137
Baseline Assessment of Water Quality In support of the Root River Watershed Restoration Plan Data Analysis Report 2011 – 2013 Adrian Koski Sarah Wright Julie Kinzelman, Ph.D., MT (ASCP)

Baseline Assessment of Water Quality In support of the
Root River Watershed Restoration Plan
Data Analysis Report 2011 – 2013
Adrian Koski Sarah Wright
Julie Kinzelman, Ph.D., MT (ASCP)

TABLE OF CONTENTS
EXECUTIVE SUMMARY i
1. INTRODUCTION 1‐1
1.1 FACTORS CONTRIBUTING TO DETERIORATED RIVER AND STREAM CONDITIONS 1‐1 1.2 CLEAN WATER ACT 1‐2 1.3 TOOLS FOR ASSESSING WATERSHED HEALTH 1‐3 1.4 WATERSHED RESTORATION PLANNING 1‐9 1.5 STUDY AREA 1‐9 1.6 HISTORICAL DATA 1‐11 1.7 2011 – 2013 STUDY PURPOSE 1‐12 1.8 TABLES AND FIGURES ‐ INTRODUCTION 1‐13
2. METHODS 2‐1
2.1 STUDY DURATION 2‐1 2.2 LAND USE 2‐1 2.3 SAMPLING SITES 2‐1 2.4 FIELD METHODS 2‐5 2.5 LABORATORY METHODS 2‐8 2.6 HYDRODYNAMIC VARIABLES 2‐10 2.7 STATISTICAL ANALYSIS 2‐11 2.8 TABLES AND FIGURES ‐ METHODS 2‐12
3. RESULTS 3‐1
3.1 ROUTINE SURFACE WATER SAMPLING SITES 3‐1 3.2 ADDITIONAL CANAL SITES 3‐8 3.3 STORMWATER OUTFALLS 3‐9 3.4 DECISION TREES 3‐10 3.5 TABLES ‐ RESULTS 3‐11
4. DISCUSSION 4‐1
4.1 ROUTINE SURFACE WATER SAMPLING SITES 4‐1 4.2 ADDITIONAL CANAL SITES 4‐7 4.3 INTRA SUB‐WATERSHED COMPARISONS 4‐7 4.4 INTER SUB‐WATERSHED COMPARISONS 4‐10 4.5 COMPARISON TO HISTORICAL WATER QUALITY MONITORING DATA 4‐11
5. CONCLUSIONS AND RECOMMENDATIONS 5‐1
6. WORKS CITED 6‐1
7. APPENDICES 7‐1
7.1 APPENDIX 1 – SITE SURVEYS 7‐1 7.2 APPENDIX 2 – DECISION TREES 7‐19 7.3 APPENDIX 3 – EDUCATION AND OUTREACH MATERIALS 7‐37

i
Executive Summary
Healthy watersheds are essential to ecologic function and provide numerous benefits to communities.
Many of the nation’s rivers and streams are in a poor physical, chemical, and/or biological health due to
land use disturbances, altered hydrologic regimes and pollutants. To protect and maintain human and
ecological health, the Clean Water Act requires water bodies to meet set criteria. Comprehensive
assessments which identify deficiencies and sources of impairment are informative to rehabilitating
water bodies which fail to meet standards. Further, such information provides a baseline from which to
gauge recovery as future implementation actions make positive changes in watershed health.
The entire main stem of the Root River, along with its associated canals and tributaries, are listed on the
state’s impaired waters [303(d)] list for excess phosphorus concentrations. Some reaches are also
impaired due to excess sediments, contaminated fish tissues and unspecified heavy metals. Historical
data indicates fecal coliform and/or E. coli concentrations commonly exceed standards throughout the
watershed. The current assessment of physical, environmental, chemical, microbiological and biotic
indicators of watershed health was performed in support of restoration planning conducted by the
Southeastern Wisconsin Regional Planning Commission (SEWRPC). The results of this study provide a
benchmark upon which to gauge the effectiveness of future actions taken to address the four priority
areas of concern: water quality, recreational access/use, habitat conditions and flooding.
Habitat, water quality, fish and macro‐invertebrate assessments were conducted by the City of Racine
Health Department and Wisconsin Department of Natural Resources at 18 locations on the middle and
lower portions of the Root River watershed from August 3rd, 2011 – March 20th, 2013. All surface water
sites were evaluated for physical, chemical, micro‐biological and biological elements, specifically: habitat
conditions, water temperature, turbidity, specific conductivity, pH, total phosphorus, dissolved oxygen,
and E. coli. Macro‐invertebrate and fish communities were assessed on a subset of these sampling sites.
At stormwater outfalls and surface water locations with elevated dry weather E. coli concentrations,
microbial source tracking techniques (total and human‐specific Bacteroides markers) were employed in
an attempt to distinguish human from non‐human pollution source contributions. Metrological and
ancillary data inclusive of precipitation, volumetric flow rate, and parameters which characterized
wastewater effluent were collected from nearby gauging stations or through the Wisconsin Department
of Natural Resources website on each day that field sample collection occurred. Data was compared
with explanatory environmental variables and evaluated for seasonal and historical variation.
Parameters with state or recommended standards were assessed for the number of samples which
exceeded threshold values. Finally, water quality was compared between and within sub‐watersheds to
determine sources of impairment(s). This report summarizes the sum of data collected by the City of
Racine Health Department Laboratory and by the Wisconsin Department of Natural Resources during
the study period.
Physical attributes within the Root River watershed directly or indirectly influenced biota, chemical
processes and microbial water quality. High turbidity and a greater proportion of fine sediments, as

ii
indicated by habitat scores, were explanatory for poor macro‐invertebrate scores, elevated E. coli and
increased total phosphorus concentrations. Turbidity levels were also positively associated with stream
flow and precipitation suggesting the mobilization of non‐point sources during and after rain events.
Significant erosion, visually confirmed by the presence of undercut banks and poor stream bank
conditions, was noted at select sites. Turbidity, resulting from surface runoff and the re‐suspension of
bottom sediments, may compromise watershed function.
Water temperatures complied with acute standards at most locations. However, exceedances of sub‐
lethal standards, particularly at urban locations within the Lower Root River sub‐watershed, were more
common. Expectedly, air temperatures were correlated with water temperature. Urban locations
generally had higher water temperatures, possibly due to a heat island effect or greater channel width.
Areas with a greater width to depth ratio (greater surface area) may have warmer temperatures due to
increased solar radiance. Negative biotic impacts were not observed to result from fluctuations in
temperature during the course of this study.
Measurements of chemical constituents and source tracking markers were used in conjunction with
microbiological indicators to gauge watershed health. Assessed parameters included: specific
conductivity, pH, total phosphorous, dissolved oxygen, detergents, total residual chlorine, E. coli and
Bacteroides (total and human specific). Correlations between select chemical constituents and biotic
assessment results were explanatory for ecosystem health, with values falling outside recommended
ranges representing potential stressors for aquatic life.
Specific conductivity fell outside recommended ranges, with some frequency, at most of the sampling
sites. Elevated values were most often observed in fall or winter, likely due to higher amounts of
baseflow and deicing of roadways, respectively. Canal sites, specifically the west and main branch
locations, often had elevated conductivity levels, possibly due to the discharge of ion rich groundwater
into the canal system via WWTP effluent. Elevated specific conductivity levels at the canal locations
likely influenced downstream reaches of the Root River.
Few sites had samples with pH values outside recommended ranges. Poor macro‐invertebrate scores
were associated with the limited number of samples outside the recommended pH range. However,
macro‐invertebrates were only evaluated at two sites which had samples outside the standard range
and results may have been an abnormality.
Total phosphorus concentrations were above state standards at all locations indicating most reaches of
the Root River watershed did not meet current criteria. Monitoring results implied multiple sources
were responsible for the elevated levels. For example, elevated levels of phosphorus were seen in dry
weather, under base flow conditions, and frequently downstream from WWTP effluent discharge
locations (implied point source contribution). However, the wide spread nature of the exceedances
throughout the watershed indicate contributions from non‐point sources as well. Higher total
phosphorus levels were also associated with sites having a greater proportion of fine sediments within

iii
the stream substrate, notably in conjunction with elevated turbidity levels; this indicates that some
portion of the phosphorus was bound to sestons.
Dissolved oxygen (DO), one parameter implicated in poor biotic assessment scores, fell below FAL
standards at most sampling sites on at least one occasion. Water temperature, volumetric flow rate,
total phosphorus concentrations and land use were all explanatory variables demonstrating correlation
to DO. Correlations between water temperature and DO were expected due to increasing gas solubility
with falling temperatures. Correlations between DO levels, total phosphorus concentrations and flow
volumes have important policy implications for the watershed if causative relationships are proven to
exist. During the study period, these parameters varied seasonally, for different reasons, which may
have resulted in the observed correlations. However, if the correlation between total phosphorus and
DO concentrations remains constant, eutrophication is a likely source of depleted DO levels within the
watershed. Correlations between DO and flow regimen indicate low flow volumes also negatively
influences DO levels. Urban locations generally had higher DO concentrations, the majority of which
were located downstream of the Horlick Dam. The Horlick Dam sampling site was one of only two
locations to meet FAL DO standards for all samples collected. Water cascading over the dam appeared
to increase DO levels directly below the dam and into downstream reaches as well.
E. coli exceeded primary contact recreational standards at most locations with great frequency,
indicating that the majority of the Root River Watershed is currently not supportive of this beneficial
use. Multiple, site dependent, factors were associated with elevated levels of E. coli including:
precipitation, volumetric flow rate, turbidity and water temperature. In most cases, elevated E. coli
appeared to be associated with wet weather mediated non‐point source pollution (positive correlations
with precipitation, flow volume, and water temperature). However, several point sources were also
implicated in fecal pollutant loading including wastewater treatment facilities and stormwater outfalls.
The impacts of point source pollution appear to have a localized effect. For example, E. coli rapidly
diminished downstream from the three WWTPs, indicating they did not have a geographically large
influence on the remainder of the watershed. The limited influence of these sources was likely due to
ambient conditions favoring bacterial die‐off. Several tributary sites (Raymond, Husher and Hoods
Creek), had elevated levels of E. coli relative to downstream locations in the absence of precipitation or
any identifiable point source. While the source of elevated bacteria levels was unclear, thresholds for
human‐specific Bacteroides were not exceeded, indicating sanitary sources were likely not responsible.
Overall fish and macro‐invertebrate assessments were characterized as “Fair” or below for the majority
of locations, indicating poor habitat quality and/or environmental stress. Scores for both fish and
macro‐invertebrate assessments were correlated indicating common stressors within biotic
communities. One common factor associated with poor scores was high total phosphorus
concentrations. Nutrients, such as phosphorous, are known to contribute to eutrophic conditions.
Other pollutants may also be delivered attached to sestons in conjunction with phosphorous; however
these analyses were outside the scope of this study. The percentage of samples at each site with DO
levels below full FAL criteria, as well as poor habitat conditions, was also associated with unsatisfactory
macro‐invertebrate scores. While high amounts of fine sediments embedded in the stream were

iv
associated with substandard macro‐invertebrate scores, a greater proportion of coarse sediments were
associated with improved scores. This suggests siltation negatively influenced spawning and interfered
with other life cycle phases. In comparison to past studies, fish and macro‐invertebrate assessments
remained stable, i.e. there was no net gain or loss (equal proportions of sites improving and degrading).
Deficiencies and associated factors which result in watershed impairment have been identified.
Although impaired, there is desire for improvement. The vision of the Clean Water Act is to ensure the
waters of the United States are drinkable, fishable and swimmable. As such, restoration activates should
focus on the identification and elimination of conditions which negatively influence these properties.
Specifically within the Root River watershed, to reduce the amount of phosphorous and sediment
loading, restore riparian habitat and connectivity, improve the diversity/ resiliency of biotic
communities, and reduce health risks associated with primary contact recreational. Through
comprehensive planning, community engagement and municipal action, steps can be taken to improve
and maintain this resource for future generations.

1‐1
1. Introduction Over 5.6 million kilometers (km) of rivers and streams flow throughout the United States, serving as the
foundation for many ecosystems and providing economic benefits to surrounding communities. A
healthy and high‐functioning watershed can enhance quality of life by sustaining natural areas, lessening
flood damage and associated costs, increasing property value, and by expanding recreational and
tourism opportunities (US EPA, 2012a). The National Rivers and Streams Assessment 2008‐2009,
conducted by the United States Environmental Protection Agency (US EPA, 2013), evaluated the health
of the nation’s rivers and streams using multiple indicators/metrics including biological, water quality,
and habitat conditions. Of these, 55 percent of river and stream kilometers were in poor biological
condition, 40 percent had elevated levels of phosphorus, 20 percent had high levels of riparian
disturbance and nine percent exceeded protective bacterial thresholds (US EPA, 2013). Three primary,
interdependent factors are attributed to deteriorated river and stream conditions: land use
disturbances, altered hydrologic regimes, and pollutants (Malmqvist and Rundle, 2002; Saunders et al.,
2002). Due to the importance of rivers and streams for human and ecological functions, laws have been
created to protect these vital assets and agencies have recommended comprehensive planning.
1.1 Factors Contributing to Deteriorated River and Stream Conditions
Land Use Disturbances. Land use disturbances have been widely documented to affect river
ecosystems, including the quality of its water, habitat, and biota. The conversion of wetlands, forests,
and grasslands to agricultural and urban (e.g. suburban, residential, commercial, industrial) uses has
been noted to change hydrological patterns (Sahin and Hall, 1996; Paul and Meyer, 2001), increase
pollutant loading into streams (Pandit, 1999; Saunders et al., 2002), and negatively affect habitat (Roth
et al., 1996). As the percentage of upstream agricultural lands reached 50 percent in watersheds across
Wisconsin, stream habitat quality and the complexity of fish assemblages declined (Wang et al., 1997).
The amount of impervious surface within a watershed is predictive of negative ecosystem health
consequences due to increased surface runoff and the mobilization of non‐point pollutants (Arnold and
Gibbons, 1996). When urbanized areas increased in the Etowah Catchment in Georgia, habitat and
macro‐invertebrate diversity and water quality measures decreased (Roy et al., 2003). An impervious
cover model created by the Center for Watershed Protection predicts stream water quality declines
when impervious cover exceeds 10 percent and severe degradation occurs with 25 percent or more
impervious cover (CWP, 2003).
Altered Flow Rates. Stream hydrologic regime is characterized by the magnitude, frequency, duration,
timing, and change of flow rates over multiple time scales (e.g. from hours to years or longer). It is
critical to the ecological integrity of river systems (Poff et al., 1997). Human‐induced changes to the
natural hydrologic regime are associated with land use disturbances, channelization, damming, and flow
diversions (Statzner and Higler, 1986; Malmqvist and Rundle, 2002). The passage of a stream through
undisturbed landscapes is dynamic; changing course within the floodplain based upon seasonal flow
fluctuations. The unimpeded interaction of streams within the floodplain creates varied habitats,
maintains biodiversity and increases biotic resiliency (Giller and Malmqvist, 1998; Tockner and Sanford,

1‐2
2002). When stream reaches are diverted, channelized, dammed, or stabilized on the banks, the lateral
expansion and contraction of streams within the floodplain is minimized or eliminated. When the
hydrologic regime is affected, base flow decreases, floods are more frequent/intense and habitat variety
is reduced (Statzner and Higler, 1986; Junk et al., 1989; Malmqvist and Rundle, 2002).
Pollutants. Pollutants can be categorized as physical, chemical and biological. Physical pollutants
include excess temperature (thermal pollution) and sediments. Chemical pollutants include acidic and
alkaline substances, dissolved solids (heavy metals and ions such as chlorides and sodium) and synthetic
organic compounds (human‐made chemicals such as pesticides and oil derivatives). Nutrients, such as
phosphorus and nitrogen, in excess amounts, are also considered chemical pollutants (DeBarry, 2004).
Biological pollutants include microorganisms, such as pathogenic (disease‐causing) bacteria or viruses
and organic matter (oxygen‐depleting substances).
Pollution in river and streams can be of natural and/or anthropogenic origin. Naturally occurring heavy
metals can be mobilized through physical processes such as groundwater seepage and natural erosion
(DeBarry, 2004). Pollutants from humans or human‐induced activities can be introduced either from a
single readily‐identifiable source such as a discharge pipe (point source), or from diffuse sources across a
landscape (non‐point source) (DeBarry, 2004). Point sources include municipal and industrial
wastewater effluent. Nonpoint source pollution includes surface runoff from agricultural, rural, and
urban areas, and from land‐ disturbing activities such as logging, wetland conversion, construction, and
other forms of development (Carpenter et al., 1998, Burzynski and Helker, 2002). The destruction of
stream buffers minimizes the capture and retention of pollutants (Slawski, 2010). In urban areas, non‐
point source runoff is often conveyed into receiving bodies via stormwater infrastructure (point source)
which may contain sanitary sewage or industrial pollutants from cross‐connected pipes or illicit
discharges (Sauer et al., 2011). The introduction of pollutants into a watershed negatively affects
human and ecological health (Paul and Meyer, 2001; WI DNR, 2011).
1.2 Clean Water Act
Watershed Protection. To protect rivers and streams from deterioration, the US EPA is required to
enforce the Federal Water Pollution Control Act Amendments of 1972 (Public Law 92‐500; 33 U.S.C.
1251 et seq.), commonly known as the Clean Water Act (CWA). The purpose of the CWA is to “restore
and maintain the chemical, physical, and biological integrity of the Nation’s waters” (U.S. Congress,
2002). Planning, management, and regulation of the CWA are generally delegated to the states. In
Wisconsin this responsibility rests with the Department of Natural Resources (WI DNR), as decreed in
Wisconsin State Statutes, Chapter 281 (WI SL, 2013).
Among other water quality management actions required by the CWA, the WI DNR sets state standards
and regulations through the Natural Resources (NR) Administrative Code. All surface waters have four
possible designated uses: 1) fish and other aquatic life, 2) recreation, 3) public health and welfare, and
4) wildlife (NR 102.04). The fish and other aquatic life use designation is further divided into five sub‐
categories: cold water, warm water sport fish, warm water forage fish [all three considered full Fish and
Aquatic Life (FAL)]; and variance sub‐categories for river sections with habitat or water quality

1‐3
deficiencies: Limited Forage Fish (LFF), and Limited Aquatic Life (LAL) (NR 102.04 (3) and 104.06) (WI
DNR, 2004; WI DNR 2010). Numeric water quality criteria and narrative requirements for maximum
pollutant levels are set to protect these designated uses and the overall quality of Wisconsin’s waters
(Minahan and Masnado, 2007). If it is determined that water quality standards are not met, the
pollutant(s) and resulting impairment(s) to the specific water body segment are assigned by the WI DNR.
The segment will be proposed for inclusion onto the U.S. EPA CWA section 303 (d) (impaired waters) list
and a total maximum daily load (TMDL) plan may be created based upon priority level. The TMDL
establishes maximum allowable pollutant loads from all contributing sources within the impaired area in
order to achieve water quality that matches its designated use (WI DNR, 2013).
Watershed Assessments. To advance the purpose and vision of the CWA, watershed integrity must be
evaluated through monitoring programs. Watershed monitoring programs must characterize key
physical, chemical, and biological elements. It is essential that indicators of watershed health be
considered in aggregate when attempting to restore or maintain quality (Karr et al., 1986; Norris and
Thoms, 1999). Some indicators have WI DNR state standards, which vary based upon use classification,
while other standards may be recommended by the U.S. EPA or based upon published research. A
variety of physical, microbiological, chemical, and biotic indicators are used to assess watershed health.
1.3 Tools for Assessing Watershed Health
A variety of physical, environmental, chemical, microbiological and biotic assessments can be used to
gauge watershed health.
PHYSICAL ASSESSMENTS
Land Use. Land use changes are an explanatory variable for declining stream health. Numerous studies
as summarized in Allan (2004) have demonstrated links between land use and water quality.
Surrounding land use can be utilized to identify stream areas that may have impaired ecosystem
indicators.
Stream Habitat. Stream habitat integrity is critical to healthy aquatic communities (Barbour et al, 1999).
Deteriorated habitat, often the result of land use disturbances and hydrological alterations, is
considered a major stressor of aquatic systems (Karr et al., 1986). In‐stream habitat that supports
abundant and diverse aquatic communities include a combination of pools, riffles, and runs with
sufficient water depth, erosion and deposition areas, various sizes of substrate, and cover such as logs
and vegetation (WI DNR, 2000a). Tree canopy cover, stream bank stability, and riparian buffer
type/width also have a direct impact on in‐stream habitat (Ball, 1982). Tree canopy cover provides
shade, regulating stream temperature. Trees and riparian buffer vegetation also contribute beneficial
organic matter, as well as filtering and slowing runoff prior to stream entry which limits erosion,
maintains base flow, and reduces downstream flooding (Slawski, 2010; U.S. EPA, 2012b). To effectively
filter 75 percent of suspended solids in runoff and remove associated nutrients, buffers must be a
minimum of six meters (m) wide and may need to extend 215 m from the stream bank depending upon
composition, inherent site properties and the efficiency of nutrient removal desired. Buffers up to 1,150
m wide may be needed to provide effective wildlife habitat protection zones (Slawski, 2010).

1‐4
The WI DNR does not regulate stream habitat. However, the evaluation of habitat as part of a
comprehensive monitoring program may aid in the determination of appropriate use designations for
stream reaches.
ENVIRONMENTAL ASSESSMENTS
Volumetric Flow Rate. Volumetric flow rate, also known as stream flow or discharge, is the amount of
water that passes through a stream or river (U.S. EPA, 2012b). Elevated flow increases shear stress on
stream banks and intensifies scouring and erosion. Prolonged periods with low stream flow decreases
habitat variety while increasing sediment deposition. This leads to species crowding and increased
competition for food and space (SEWRPC, 2007). Stream flows in Wisconsin’s rivers typically peak in
April due to spring rain and snow melt and are lowest in December following drier autumn months
(Burzynski and Helker, 2002).
The WI DNR does not have state or recommended standards for stream flow, but the amount and
source of flow (e.g. wastewater treatment plant effluent) may influence use designations.
Precipitation. Precipitation delivered directly through infrastructure, or via overland flow as surface
runoff, can result in decreased water quality. Sediment loading frequently occurs post‐rainfall,
especially in areas where inadequate buffers exist, transporting with it associated nutrients and
bacteria. High levels of nutrients can lead to eutrophication and bacteria concentrations in excess of
state and federal standards can result in beneficial use impairments (Neal et al., 2004). Precipitation
events increase the volumetric flow rate.
Water Temperature. Temperature is a measure of stream heat energy and drives numerous physical,
chemical, and biological processes (APHA et al., 2005). As temperature increases, the metabolic and
decomposition rates of organisms accelerate, raising the demand for oxygen and food. Yet when
temperatures increase, gas solubility in water decreases, diminishing the amount of dissolved oxygen
water can hold. Extremely high temperatures may adversely affect reproduction in sensitive biota,
increase disease susceptibility, and cause mortality. This alters wildlife assemblages and allows
temperature‐tolerant (and sometimes invasive) fish and macro‐invertebrate species to proliferate (US
EPA, 2012b). Higher water temperatures may be caused by riparian buffer loss, decreased tree canopy
cover, large amounts of impervious surface, channelization, and thermal discharges (Burzynski and
Helker, 2002).
WI DNR state standards for surface water temperatures are based upon the fish and aquatic life use
designation of the stream/stream reach (NR 102.04 4(e)) (Table 1‐1). To protect against acute and sub‐
lethal effects, maximum temperatures are set by calendar month, based upon use designation and
classification. Acute criteria are evaluated according to the daily maximum temperature and sub‐lethal
criteria are evaluated by weekly average maximum temperatures (minimum n=1). For LAL stream
reaches, only one criterion applies: temperatures may not exceed 30 °C [86 °Fahrenheit (F)]. This same
threshold is recommended for stormwater discharge.

1‐5
Turbidity (Water Clarity). Turbidity measures the scatter of light through water caused by suspended
solids such as colloids, clays, silts, and other fine matter (APHA et al., 2005). High turbidity is associated
with low water clarity, which can restrict photosynthetic processes of aquatic plants. Suspended solids
may be introduced into the water column from eroded stream banks, runoff and the resuspension of
settled materials (U.S. EPA, 2012b). Resuspension of settled particles can result from bottom feeders,
turbulent flow, or other disturbances. Higher turbidity levels are associated with increased water
temperatures (heat absorption from suspended solids), presence of pathogenic microorganisms
(sediments serve as habitat), and greater nutrients (via particle attachment). Prolonged turbidity can
elevate physiological stress on organisms (APHA et al., 2005; US EPA, 2012b). Settled solids embedded
within stream substrate decreases habitat and negatively affect spawning areas for fish and macro‐
invertebrates (U.S. Geological Survey, various).
The WI DNR does not have surface water criteria for turbidity. However, Minnesota, an adjacent state,
recommends a limit of 25 NTU (Nephelometric Turbidity Units) to protect cool/warm‐water fisheries
and provide safe and aesthetically pleasing recreation (MPCA, 2008) (Table 1‐2). Turbidity levels higher
than 1,000 NTU may indicate industrial discharge contributions to stormwater outfalls (Brown et al.,
2004).
CHEMICAL ASSESSMENTS
Dissolved Oxygen. The availability of oxygen is vital for maintaining biota, and affects physical, chemical,
and biochemical activities in aquatic systems (USGS, various; APHA et al., 2005). Dissolved oxygen (DO)
is commonly represented as a concentration [milligram/liter (mg/L)] or as percent saturation, which
varies based upon water temperature and atmospheric pressure. Oxygen is assimilated into the water
through atmospheric diffusion and photosynthesis (Kutty, 1987). Dissolved oxygen saturation
percentages may exceed 100 percent during photosynthesis. Consumption of DO occurs during
respiration, through decomposition, and by various chemical reactions. Dissolved oxygen levels in
streams fluctuate seasonally and diurnally due to changes in water temperature and photosynthesis
rates (US EPA, 2012b). Low and excessively high DO levels indicate possible organic pollution or
eutrophication. Eutrophic conditions are caused when too many nutrients enter a water body, spurring
excessive plant growth. This also results in large diurnal oxygen variation due to increased respiration
and decay, thus creating inhospitable conditions for sensitive aquatic life (APHA et al., 2005).
The WI DNR surface water standards for DO are based upon the designated use. In warm water stream
reaches with a FAL use classification, DO levels may not be below five mg/L at any time (NR 102.04
(4)(a)) (WI DNR, 2010) (Table 1‐2). Dissolved oxygen may not be less than three mg/L for LFF
communities [NR 104.02 (3) (a) 2.a.] and not be less than one mg/L for LAL communities [NR 104.02
(3)(b)2.a.] (WI DNR, 2004). The WI DNR does not have upper‐limit standards, but a saturation rate of
140 percent or higher may cause fish kills due to physiological stress (super saturation of oxygen in
organisms) (Kutty, 1987) (Table 1‐2). In order for a stream to be listed as impaired for DO, 10 percent of
samples collected during three days of continuous measurements(July or August, no less than one
sample per hour), over a 3‐year period, must be below minimum standards (Clayton et al, 2012). Such

1‐6
intensive monitoring was not conducted for this study; however, exceedances of concentration and
percentage saturation criteria could be determined for surface water sites.
pH. pH is a measurement of the hydrogen ion activity of a solution. A logarithmic standard unit (s.u.)
scale ranging from 0‐14 is used, with zero being extremely acidic, 14 being extremely basic, and seven
representing neutral conditions (APHA et al., 2005). The pH of a stream system can fluctuate based
upon geological and atmospheric interactions, photosynthetic rates, pollutant types and loads, and
chemical reactions throughout the ecosystem. Many chemical and biological processes are affected by
pH, which dictates the solubility of nutrients, heavy metals, and toxins (SEWRPC, 2007). The preferred
pH range for most aquatic organisms is between 6.5 and 8.0 s.u. (US EPA, 2012b).
WI DNR pH standards for all use designations requires a pH range between 6.0 and 9.0 s.u. with no more
than a 0.5 unit change outside the estimated natural seasonal maximum and minimum value [NR 102.04
(4)(c); NR 104.02 (3)(a)2.c.; NR 104.02 (3)(b)2.b.] (WI DNR, 2010; WI DNR, 2004) (Table 1‐2). To be listed
as impaired by the WI DNR, 10 percent or more of at least 10 samples from a continuous sampling
period must exceed the set minimum or maximum criteria (Clayton et al., 2012). Such intensive
monitoring was not conducted for this study. However, exceedances of established criteria could be
determined at surface water sites. For stormwater outfalls, pH levels outside a range of 6.0 – 9.0 s.u.
were considered indicative of potential industrial or commercial liquid waste (Brown et al., 2004).
Specific Conductivity. Specific conductivity is a measurement, corrected to a standard temperature of
25 °C, of the ability of water to conduct an electrical current. This is directly proportional to the
concentration of ions such as chloride, phosphate, sodium, magnesium, and iron in a solution (US EPA,
1986). These ions may occur naturally in the soil and bedrock of a watershed, but can also be delivered
to a river through sanitary, industrial, agricultural, and commercial wastes. Common anthropogenic
sources of ions include road salts (deicing agent), waste from water softening, fertilizers, and pesticides
(Brown et al., 2004; US EPA, 2012b). The average conductivity levels in most streams are based upon
site‐specific interactions between water and geological features and are relatively constant unless
affected by an influx of pollution (APHA et al., 2005).
The WI DNR does not have state surface water standards for specific conductivity, but U.S. EPA research
indicates a range between 50 and 1,500 µS/cm is supportive of healthy fisheries (US EPA, 2012b) (Table
1‐2). Specific conductivity, in concentrations greater than 2000 µS/cm, suggests possible industrial
discharge into stormwater effluent (Brown et al., 2004).
Total Residual Chlorine. Chlorine is utilized in many communities throughout the US for potable water
and sanitary waste disinfection, as well as in numerous industrial and commercial processes (Brown et
al., 2004; APHA et al., 2005). The presence of chlorine above a concentration of 0.1 mg/L may indicate
the presence of industrial or commercial liquid wastes or discharge from other sources such as water
line breaks, outdoor car washing, or non‐target irrigation (Brown et al., 2004). This information may be
used in combination with other indicator tests to deduce the origin of a pollution source, as chlorine is
volatile and cannot be detected far downstream from the source of entry. It is frequently used, as one of
1‐7
a suite of fecal source tracking methods, to detect discharge of inappropriate wastes in stormwater
effluent (Abbott, 2008).
Detergents. The presence of detergents in stormwater outfalls can be determined through the
detection of surfactants, emulsifiers that allow water and oils to mix. Most illicit discharges have
elevated concentrations of detergents (Brown et al., 2004). In stormwater effluent, detergent
concentrations of 0.25 mg/L or higher may indicate contamination by sewage or wash water. A
concentration of five mg/L or more may be suggestive of industrial discharge (Brown et al., 2004).
Total Phosphorus. Total phosphorous is a measurement of the dissolved and suspended (attached to
particles) phosphorus in the water column. Phosphorus, along with nitrogen and other nutrients, is
essential for life. In freshwater systems, phosphorus is typically the limiting nutrient for algal and plant
growth. An overabundance can cause eutrophication (US EPA, 2012b), a condition inhospitable to
complex aquatic communities (Wither and Jarvey, 2008). Phosphorus pollution originates from both
point and nonpoint sources (Carpenter et al., 1998). However, humans have accelerated the
phosphorus cycle rate fourfold, mainly due to fertilizer application on agricultural lands (US EPA, 2012b).
Wisconsin became the first state in the US to adopt rules requiring numeric criteria for total phosphorus
in rivers and streams (WI DNR, 2012a). To protect surface waters designated as FAL and LFF, a total
phosphorus criterion of (not to exceed) 75 µg/L (0.075 mg/L) was established [NR 102.06 (3) (b) (WI
DNR, 2010)] (Table 1‐2). In areas designated as LAL, the phosphorus criteria does not apply, as
described in NR 102.06 (6) (d) and NR 104.06 (1). To be considered for impairment status, the WI DNR
requires six monthly samples from May through October, in which the lower 95 percent confidence
interval of the sample population should not exceed the established threshold (Clayton et al., 2012).
MICROBIOLOGICAL ASSESSMENTS
E. coli. E. coli, when used as a fecal indicator bacterium (FIB), denotes the presence of feces in surface
water and is a surrogate for the presence of pathogenic enteric bacteria, protozoa, and viruses. Illnesses
caused by pathogens of a fecal origin include gastroenteritis, dermatitis, and respiratory infections,
amongst others (Seyfried et al., 1985; Craun et al., 2005). Commonly, E. coli or fecal coliforms have
been measured as a surrogate for pathogens due to the elusiveness of pathogens in the environment
and the difficulty of direct quantification (Field, 2008). E. coli and other FIB inhabit the intestinal tract of
warm‐blooded organisms and are excreted in feces along with the potential pathogens. Indicator
bacteria can be detected inexpensively and efficiently in laboratory tests, and concentrations
correspond with increased human illness rates (Dufour, 1984; US EPA, 1986). FIB can be introduced into
water bodies through point sources such as wastewater treatment plants, or non‐point sources such as
animal waste (e.g. livestock, wildlife, pets, or the field application of livestock waste), failed waste
disposal systems (e.g. septic tanks or sanitary sewage infrastructure), and litter (e.g. diapers) (Anderson
et al., 1997; DeBarry, 2004). E. coli can persist in soils and serve as a non‐point source of FIB if
introduced into river systems through suspension or erosion (Whitman et al., 2006). Numerous studies
have demonstrated positive correlations between FIB concentrations and water temperature, turbidity,
1‐8
stream flow, and nutrient availability; all of which may display seasonal preferences (Burznyski and
Helker, 2002; Ishii et al., 2005; SEWRPC, 2007; Lawrence, 2012).
The WI DNR surface water standards, established to protect recreational uses, have historically utilized
total and fecal coliforms. Fecal coliform standards still pertains to all surface waters of Wisconsin;
however, Great Lake tributaries can also apply E. coli as a standard according to the Beach
Environmental Assessment and Coastal Health Act of 2000 (BEACH Act), an amendment to the CWA.
According to NR 102.12 (1), “The Great Lakes system includes all the surface waters within the drainage
basin of the Great Lakes” (WI DNR, 2010). The WI DNR has adopted two E. coli action thresholds to
determine if a water body supports its recreational use designation: a single sample maximum of 235
colony forming units per 100 milliliters (CFU/100 ml); and a monthly geometric mean maximum of 126
CFU/100 ml (minimum of five samples) to assess long‐term impairment (Clayton et al., 2012) (Table 1‐2).
The U.S. EPA issued new recreational water quality criteria in 2012, but the state has not yet adopted
these standards (US EPA, 2012c).
Microbial Source Tracking (MST); human‐specific Bacteroides. MST methods help determine the origin
of FIB, which is not readily apparent through quantification alone. The origin of FIB can be difficult to
determine, particularly when caused by nonpoint source pollution (US EPA, 2005). Bacteroides,
anaerobic bacteria which constitutes a portion of warm‐blood animal intestinal flora, has subspecies
with genetic markers that are human specific; HF183 Bacteroides and the 16S rRNA genetic marker.
These characteristics enable its use as a source tracking tool (Seurinck et al., 2005; Sauer et al., 2011).
The detection of the human‐specific Bacteroides marker suggests the presence of human waste. Illness
rates in recreational waters may increase when human versus animal fecal matter is present due to
higher levels of human‐specific enteric pathogens in human feces (Seurinck et al., 2005).
The WI DNR does not have state standards for human‐specific Bacteroides in surface or stormwater, but
two thresholds have been recommended based upon published research (Table 1‐2). Further
investigation for potential sanitary sewage pollution may be warranted when: 1) a copy number
(CN)/100 ml greater than 5,000 is present, and 2) a ratio greater than 5.1 percent (+/‐ 2.93%) of human
Bacteroides to total Bacteroides is present (based upon the average ratio found in sewage) (Sauer et al.,
2011). [NOTE: More recently, the McLellan laboratory at the UWM School of Freshwater Sciences has
transitioned away from the ratio and 5,000 CN/100ml result to a higher threshold of 10,000 CN/100 ml
to suggest further investigation, but guidelines are not yet published and the former thresholds were
used in this study for recommendation purposes.]
BIOTIC ASSESSMENTS
Fish and Macro‐invertebrate Assessments. Fish and macro‐invertebrate assessments indicate the level
of biological integrity found within a water body. This is defined as the “ability to support and maintain
a balanced, integrated, adaptive community of organisms having a species composition, diversity, and
functional organization comparable to that of the natural habitat of the region” (Karr et al., 1986). Biotic
community structure can provide insight into current and past stream conditions due to the varied life
spans of fish and macro‐invertebrates (Norris and Thoms, 1999). Fish and macro‐invertebrate

1‐9
community composition are affected by physical, chemical and biological stream conditions and provide
an integrated view of watershed conditions. Due to varied life spans, the community composition is an
indicator of short‐ and long‐term degradation caused by pollutants or compromised environmental
conditions (Hilsenhoff, 1987). Fish and macro‐invertebrate assessments are based upon the number
and type of species present that are sensitive or tolerant of pollutants. State standards do not exist for
these assessments. However, this information may influence the use designation of a stream or river.
1.4 Watershed Restoration Planning
Due to the interdependence of clean rivers and streams with sustainable economic and social
development, the U.S. EPA recommends implementing watershed planning to enhance and maintain
public and ecological assets. Depending upon size, the ability for individual municipalities to address
such concerns may be limited due to the cross‐ jurisdictional nature of larger watersheds. Therefore,
municipalities must engage with one another, establish common goals, and become stewards of joint
resources for effective watershed management to occur. A watershed plan represents a strategy and
work plan which identifies causes and sources of watershed problems (i.e. contaminants, lack of
ecological integrity and limited public access) and develops goals and management actions to resolve
identified issues. Watershed plans should be based upon sound science and include diverse watershed
stakeholder participation (US EPA, 2012b).
The Southeastern Wisconsin Regional Planning Commission (SEWRPC) is in the process of drafting a
Watershed Restoration Plan for the Root River in collaboration with the Root River Restoration Planning
Group (anticipated completion: summer, 2014). The planning group represents diverse stakeholders
from Racine and Milwaukee counties: Milwaukee Metropolitan Sewerage District (MMSD), the WI DNR,
local units of governments, Southeastern Wisconsin Watersheds Trust, Inc. (Sweet Water), Root‐Pike
Watershed Initiative Network, other non‐governmental organizations, and interested citizens. The plan
will create specific, targeted recommendations to address four issues of concern within the Root River
watershed: 1) water quality, 2) recreational access and use, 3) habitat conditions, and 4) flooding.
Practical actions within these four target areas will be identified by stakeholders with the goal of
implementing a first round of recommended actions between 2014 and 2018. These actions will be
determined based upon a meta‐analysis of data from a variety of sources, including: historical water
quality, a 2007 SEWRPC regional water quality management plan, and current water quality monitoring
data (Boxhorn and Hahn, 2012). Current monitoring data is being collected Milwaukee Metropolitan
Sewerage District (MMSD), the City of Racine Health Department Laboratory, and the WI DNR. Data
includes water quality, fish, macro‐invertebrate and habitat assessments. The study area encompasses
sites from the headwaters to the mouth of the Root River at Lake Michigan. This comprehensive
database will provide the baseline and serve as the metric to confirm the effectiveness of future actions
as recommended by the restoration plan.
1.5 Study Area
The headwaters of the Root River watershed originates on a 293‐meter (m) glacial ridge in the City of
New Berlin (Waukesha County) and discharge 71 km downstream into Lake Michigan (elevation=177 m)

1‐10
in the City of Racine (Racine County) (Boxhorn and Hahn, 2013). Glaciation shaped the 515‐square km
drainage network of the Root River, creating landforms such as clay bluffs, lake plains, ground moraines
and ridge and swale topography on top of Niagara dolomite (WI DNR, 2012b). The vast majority (89%)
of ridges and plains are sloped less than six percent, but the remainder of the land area, mostly in the
upper third of the watershed, has greater grades which are more susceptible to erosion. The soils are
mostly poorly‐drained (72%) and are comprised primarily of silt‐loams overlying loamy and clay‐like tills.
Moderate to low amounts of groundwater recharge three underlying aquifers, two of which provide
base flow to the river (Boxhorn and Hahn, 2013).
The Root River watershed contains all or parts of four counties (Waukesha, Milwaukee, Racine, and
Kenosha), 19 civil divisions, four stormwater utility districts, three agricultural drainage districts, and
three wastewater treatment plants. It is comprised of 188 km of streams, nine sub‐watersheds, over 30
tributaries, 12 named lakes, one canal system, and one dam located on the main stem, Horlick Dam. The
Root River canal system has an east and west branch that merge into the main stem of the canal (8.6
kilometers in length), discharging into the main stem of the river ~40 km upstream of the mouth. Mean
annual precipitation and temperature records, available through Batten International Airport in the City
of Racine from 1940 – 2011, average 88.4 centimeters (cm) and 8.7 °Celsius (°C) respectively (Boxhorn
and Hahn, 2013). Much of the precipitation falls during the winter and spring months.
As of 2000, the primary land use within the watershed was agriculture (50%). The next largest land use,
by area, was urban (33%; primarily the upper reaches of the watershed in Milwaukee County and
immediately upstream of the mouth in the City of Racine). The remaining land uses (17%) consist of
woodlands, wetlands, grasslands, surface water, and unused or other open lands (WI DNR, 2012b). As
of the most recent reporting periods (in parentheses), 9.9 percent of the watershed had adequate
riparian buffers (2010) and 4.8 percent had intact primary environmental corridors (2005) (Boxhorn and
Hahn, 2013).
The Root River is classified as a warm‐small water system, supportive of warm water sport and forage
fish. A range of pollution‐tolerant to sensitive fish communities inhabit the river (Burzynski and Helker,
2002). While the majority of the watershed is classified as Full Fish and Aquatic Life (FAL), areas
supportive of only Limited Forage Fish (LFF) and Limited Aquatic Life (LAL) are located in portions of the
canals and some tributaries, including Hoods Creek (Burzynski and Helker, 2002). The Horlick Dam,
situated 9.5 km upstream from the mouth, separates upstream from downstream fish and other biotic
communities on the main stem.
The entirety of the 71 km main stem of the river, along with the main and west canal branches and
Husher Creek, is on the WI DNR 303(d)‐list of impaired waters for excessive concentrations of total
phosphorus (Figure 1‐1). The upper 39 km of the main stem and the main and west canal branches are
also listed as impaired for excess sediments/total suspended solids. Polychlorinated biphenyls (PCBs)
have been detected in the tissues of salmon and trout migrating from Lake Michigan upstream to the
Horlick Dam and thus this reach of the river is listed as impaired for PCBs. The harbor area at the mouth

1‐11
of the river is impaired due to unspecified metals (303(d)‐list, WI DNR, 2012b). Table 1‐3 delineates site
specific impairments within the Root River watershed.
1.6 Historical Data
Data pertaining to water quality, stream bank conditions, fish and macro‐invertebrate communities
within the five Root River sub‐watersheds of Racine County, have been collected by numerous agencies
since 1964. Agencies which have collected water quality data include: MMSD, United States Geological
Survey (USGS), WI DNR, RHD, and the WDNR Water Action Volunteers (WAV) (SEWRPC, 2007).
Fecal Coliforms and E. coli. The microbiological quality of the Root River has historically been assessed
through the quantification of fecal coliforms. Results from 1975‐2004 indicated that fecal coliforms
commonly exceeded WI DNR standards (SEWRPC, 2007). Fecal coliform concentrations generally
decreased from upstream to downstream along the main stem; lower concentrations were associated
with late winter and early spring months. At Johnson Park, fecal coliform concentrations decreased over
time, while concentrations have increased at Horlick Dam (SEWRPC, 2007).
Temporal trends could not be ascertained for E. coli due to its limited historical use as an indicator.
However, monitoring within the City of Racine from 2007‐2008 allowed for inferences regarding the
spatial variability of E. coli from Johnson Park to the mouth of the river. At Johnson Park, Horlick Dam,
the WDNR Steelhead Facility, and the mouth of the river, E. coli concentrations rarely exceeded
standards during dry weather (Abbott, 2008). However, at more urbanized sites within the City of
Racine, such as Liberty Street Bridge and the Root River Environmental Education Community Center
(REC), E. coli concentrations often exceeded standards during dry and wet weather, indicating
contributions from both wet weather mediated and non‐precipitation sources. Surface water sites and
stormwater infrastructure were recommended for additional monitoring based upon the 2008 study
results, including surveillance for human‐specific source markers at a limited number of sites where
sanitary infiltration was suspected (Abbott, 2008).
Chemical Indicators of Water Quality. Additional water quality parameters have been assessed to gauge
watershed health. Low dissolved oxygen (DO) concentrations (<5.0 mg/L) have been occasionally noted
at the mouth of the river (SEWRPC, 2007). Total phosphorus concentrations at locations on the main
stem of the river, the main canal branch, and at Husher Creek frequently exceeded the 2007 suggested
standard value of 0.1 mg/L (SEWRPC, 2007). Specific conductance values were often above the
recommended standard (1,500 µS/cm) during the winter, likely due to road deicing practices (SEWRPC,
2007). Turbidity was found to be elevated during periods of high volumetric flow or following
precipitation, particularly at sites near highly eroded stream banks, such as Johnson Park (Abbott, 2008).
Overall, the Root River, from Johnson Park to the mouth, was considered in good health with respect to
water temperature, turbidity, pH, and DO in 2007‐2008 (Abbott, 2008).
Stream Bank and Infrastructure Integrity. Three studies focused on stream bank conditions in the City
of Racine between 2002 and 2008. From 2002 ‐ 2003, stream reaches were classified, and structures to
improve fish habitat were recommended, in a stream morphological study conducted by the WI DNR

1‐12
(Abbott, 2008). In 2005, AE COM (formerly Earth Tech, Inc.) identified eight high erosion areas on
various stream banks, including Johnson Park, and eight outfalls in poor condition within the City of
Racine (Abbott, 2008). The results of these two studies were utilized in combination with 2007‐2008
water quality monitoring data at 42 open water sites and nine stormwater outfalls to determine open
water and outfall sites in need of remediation and/or further assessment, e.g. a stormwater outfall near
Liberty Street Bridge in Island Park (Abbott, 2008).
Fish and Macro‐invertebrate Assessments. Fish and macro‐invertebrate assessments were conducted
by the WI DNR (unpublished) and Wisconsin Lutheran College (Ortenblad et al., 2003) in 1979, 2001 and
2003. During the 2001 and 2003 fish assessments, fish IBIs ranged from “Very Poor” to “Good”. Poor
fish scores were found in agricultural areas, but improved in urban areas in Racine, likely due to its
connection to diverse Lake Michigan fisheries (Ortenblad et al., 2003). Macro‐invertebrate assessment
scores from 1979 ranged from “Very Poor” to “Good”. According to the Hilsenhoff Biotic Index (HBI)
scale, this indicates a range of organic pollution throughout the watershed from “probable” to “very
significant.” Macro‐invertebrate studies were inconclusive.
1.7 2011 – 2013 Study Purpose A comprehensive Root River restoration plan has been proposed and broadly supported by
environmental, regulatory, and municipal agencies as well as the general public. In proposing a
restoration plan, an accurate baseline of the microbiological, chemical and physical integrity of the
watershed was deemed necessary to guide future mitigation actions. The accumulation of baseline data
was accomplished through water quality monitoring, habitat and species surveys, and modeling. The
sampling plan was designed to inform restoration by acquiring data from key locations: 1) representing a
variety of land use types, 2) impacted by diverse pollution source categories, 3) where little or no
previous monitoring had occurred, and/or 4) with abundant data where changes in conditions over time
could be assessed.
This report specifically addresses habitat, water quality, fish and macro‐invertebrate community
assessments conducted by RHD and WI DNR within the middle and lower portions of the Root River,
including the canal system and stormwater outfalls within the City of Racine, for the time period of
August 3rd, 2011 to March 20th, 2013. This study focuses on six of the nine sub‐watersheds located
within the Root River watershed. Five of these sub‐watersheds were located in Racine County and one
tributary, Legend Creek, was located in Milwaukee County (in the Middle Root River sub‐watershed).
The Racine County sub‐watersheds are: the West Branch of the Root River Canal, East Branch of the
Root River Canal, Main Stem of the Root River Canal, Hoods Creek, and the Lower Root River. Upstream
sections of the watershed were studied concurrently by MMSD and included: the main stem of the
Upper Root River, Middle Root River, and Lower Root River sub‐watersheds in Milwaukee County. The
two remaining sub‐watersheds were not studied (East Branch and Whitnall Park Creek, two tributaries
to the main stem in Milwaukee County). Results from this report provide a basis for science‐based
restoration decisions and can serve as a metric from which to benchmark the effectiveness of the Root
River Watershed Restoration Plan following implementation.

1‐13
Table 1 ‐1
Month °C °F Month °C °F Month °C °F
Jan 0.6 33 Jan 9.4 49 Jan 24.4 76
Feb 1.1 34 Feb 10.0 50 Feb 24.4 76
Mar 3.3 38 Mar 11.1 52 Mar 25.0 77
Apr 8.9 48 Apr 12.8 55 Apr 26.1 79
May 14.4 58 May 18.3 65 May 27.8 82
Jun 18.9 66 Jun 24.4 76 Jun 28.9 84
Jul 20.6 69 Jul 27.2 81 Jul 29.4 85
Aug 19.4 67 Aug 27.2 81 Aug 28.9 84
Sep 15.6 60 Sep 22.8 73 Sep 27.8 82
Oct 10.0 50 Oct 16.1 61 Oct 26.7 80
Nov 4.4 40 Nov 9.4 49 Nov 25.0 77
Dec 1.7 35 Dec 9.4 49 Dec 24.4 76
Month °C °F Month °C °F Month °C °F
Jan 2.8 37 Jan 12.2 54 Jan 25.6 78
Feb 3.9 39 Feb 12.2 54 Feb 26.1 79
Mar 6.1 43 Mar 13.9 57 Mar 26.7 80
Apr 10.0 50 Apr 17.2 63 Apr 27.2 81
May 15.0 59 May 21.1 70 May 28.9 84
Jun 17.8 64 Jun 25.0 77 Jun 29.4 85
Jul 20.6 69 Jul 27.2 81 Jul 30.0 86
Aug 20.0 68 Aug 26.1 79 Aug 30.0 86
Sep 17.2 63 Sep 22.8 73 Sep 29.4 85
Oct 12.8 55 Oct 17.2 63 Oct 28.3 83
Nov 7.8 46 Nov 12.2 54 Nov 26.7 80
Dec 4.4 40 Dec 12.2 54 Dec 26.1 79
Source: NR 102.245 and 102.25, Table 2 (modified)
^Warm‐Small Waters have a fish and aquatic life use designation of "warm sport fish" or "warm
water forage fish" and uni‐directional 7Q10 flows (lowest 7‐day average flow that occurs on
average once every 10 years) of < 200 cfs (129 million gallons/day)
Limited Forage Fish (LFF) River Use Classification
Ambient Water Temperature Sub‐Lethal Criteria Acute Criteria
Limited Aquatic Life (LAL) River Use Classification
Temperatures at any point may not exceed 30°C (86°F)
Wisconsin Department of Natural Resources
Ambient Water Temperature and Water Quality Temperature
Criteria for Warm‐Small Waters in Wisconsin
Full Fish and Aquatic Life (FAL) River Use Classification
Ambient Water Temperature Sub‐Lethal Criteria Acute Criteria

1‐14
Table 1‐2
Habitat
Water
Temperature
(˚C)
Turbidity
(NTU
)
*E. coli
(MPN/100mL)
Human
Bacteroides
Dissolved
Oxygen
Concentration
(mg/L);
Saturation
Rate (%
)
pH
(1‐14 s.u.)
Specific
Conductivity
(µS/cm
)
Total Chlorine
(mg/L)
Detergents
(mg/L)
Total
Phosphorus
(mg/L)
Fish
Community
Macro‐
invertebrate
Community
Full Fish and
Aquatic Life ‐
Full Recreational
Use
(FAL, Full Rec.)
> 126:
geomean;
> 235:
single
sample
Concentration:
< 5.0;
Saturation Rate:
> 140
> 0.075
Limited Forage Fish,
Limited
Recreational Use
(LFF, Lim. Rec.)
No
standard
Concentration:
< 3.0;
Saturation Rate:
> 140
> 0.075
Limited Aquatic
Life,
Limited
Recreational Use
(LAL, Lim. Rec.)
> 30.0No
standard
Concentration:
< 1.0,
Saturation Rate:
> 140
No
standard
Stormwater Outfall N/A > 30.0 > 1,000 > 10,000same as
aboveN/A
< 6.0;
> 9.0> 2,000 > 0.1 > 0.25 > 0.075 N/A N/A
Exceedance Ranges of State and Recommended Standards by Assessed Parameter
Based on Surface Water Use Classification or Stormwater Outfall Designation 8.3.11 ‐ 3.20.13 Racine Health Department Root River Watershed Study
Surface Water
Use Classification
or Stormwater
Outfall
Designation
Exceedance Ranges of State and Recommended Standards by Assessed Parameter The ranges listed in this table define poor water quality
Physical Microbiological Chemical Biotic
Stormwater Outfall
Red Font Color: State Standard; Purple Font Color: Recommended Standard; N/A: not applicable
* For long‐term datasets, the WI DNR uses an E. coli geometric mean calculation of at least five samples per month. If any calculation exceeds 126 MPN/100 mL, the
waterbody is in violation of the state standards for E. coli . For single samples, >235 MPN/100 mL is the threshold criteria for the water body to be under advisory condition.
Sources: State Standards: NR 102 and NR 104, DNR personnel; Recommended Standards: (MPCA, 2008), (Sauer et al., 2012), U.S. EPA, (Brown et al., 2004)
Surface Water Use Classification
Based
upon
mean
stream
width
(< 10 m
or 10+
m); see
Figures
1 and 2
By month
for acute
and sub‐
lethal;
see Table
x and x > 25
1. > 5,000
CN/100 ml;
2. Ratio of
human
Bacteroides
: total
Bacteroides
> 5.1% +/‐
2.93%
< 6.0;
> 9.0
< 150;
> 1,500N/A N/A
Index of
Biotic
Integrity
(IBI); see
Figure A
Hilsenhoff
Index of
Biotic
Integrity
(HBI); see
Figure B

1‐15
Table 1 ‐3
Site Code
Surface Water
Site
Water Use Classification
(Fish and Other Aquatic Life Uses, Recreational Use)Pollutant(s): Impairment(s) 303(d) Status
1 Legend Creek Full Fish and Aquatic Life (FAL), Full Recreational Use
2 RRC‐Union Grove Limited Aquatic Life (LAL), Limited Recreational Use
3 Raymond Creek
4 RRC‐West
A. Sediments/ Total
Suspended Solids;
B. Total Phosphorus
A & B.
Low Dissolved
Oxygen
A & B.
303(d) ‐ listed
5 RRC‐Fonk's Limited Aquatic Life (LAL), Limited Recreational Use
6 RRC‐East Limited Forage Fish (LFF), Limited Recreational Use
7 RRC‐Main
A. Sediments/ Total
Suspended Solids;
B. Total Phosphorus
A & B.
Low Dissolved
Oxygen
A & B.
303(d) ‐ listed
8 Husher Creek
9 38 at MKE Co Line
10 5 Mile Road
11 Hoods Creek Limited Forage Fish (LFF), Limited Recreational Use None None None
12 Johnson Park
13 31 and 4 Mile
14 Horlick Dam
15 Steelhead Facility
16 Liberty St. Bridge
17 REC
18 Chartroom
Source: NR 102, NR 104, WI DNR Impaired Waters in Watershed, http://dnr.wi.gov/water/watershedImpaired.aspx?code=SE03
None
Proposed for List
Proposed for List
A. 303(d) ‐ listed
B. Addition
None
Full Fish and Aquatic Life (FAL), Full Recreational Use
Full Fish and Aquatic Life (FAL), Full Recreational Use
Full Fish and Aquatic Life (FAL), Full Recreational Use
A. Polychlorinated
Biphenyls;
B. Total Phosphorus
A. Contaminated Fish
Tissue;
B. Impairment
Unknown
Total Phosphorus*Degraded Biological
Community*
Total Phosphorus*Degraded Biological
Community*
None None
None None
Surface Water Sites, Water Use Classification, Pollutant(s): Impairment(s), and 303(d) Status 8.3.11 ‐ 3.20.13 Racine Health Department Root River Watershed Study

1‐16
Figure 1‐1: Root River watershed land use classification and impaired water status.
West Branch Root River Canal East Branch Root
River Canal
Main Branch Root River Canal
Middle Root River sub‐watershed
Lower Root River sub‐watershed
Hoods Creek sub‐watershed

2‐1
2. Methods Methods utilized in this study are separated into field and laboratory methods, collection of land use
and supplementary data, and statistical analysis/results interpretation.
2.1 Study Duration
Surface water samples were collected from designated sampling sites twice weekly from August 3rd,
2011 – March 20th, 2013 with the exception of September 22nd – December 19th, 2011, when they were
collected once‐weekly. Additional Root River canal samples were collected on two occasions during the
summer of 2012 (June 13th and June 27th). Stormwater outfalls were collected once‐weekly. No samples
were collected from December 20th, 2011 – March 20th, 2012 due to closure of the Racine Health
Department Laboratory for renovations.
2.2 Land Use
Land use was determined at surface water locations by quantifying the urban, agricultural, and
open/undeveloped designated lands upstream of the sampling location using ESRI® ArcMap™ 10.0 (ESRI
Inc., Redlands, CA). Land use 215 m upstream and extending out 215 m on either bank for an
approximate total land area of 0.09 km2 at each site were quantified using 2010 SEWRPC land use data
shapefile layers. Sites were assigned a land use based upon majority cover. The 215 m distance was
chosen based upon the effective protection zone width identified within the 2010 SEWRPC publication,
Managing the Water’s Edge. This width encompasses pollutant removal and riparian function
categories estimated to provide sediment filtration rates greater than effective 75 percent effectiveness
as well as adequate stream bank stabilization (Slawski, 2010).
2.3 Sampling Sites
Surface water sampling sites are displayed in Figure 1‐1 and Table 2‐1. Study sites were selected in
conjunction with SEWRPC and the WI DNR with the criteria that sites would: 1) provide meaningful data
where a paucity exists, 2) avoid duplicating work of external organizations (USGS, MMSD), 3) be
complimentary towards current and recent WI DNR efforts (macro‐invertebrate and fish biotic indexing,
hydrodynamic impact assessment modeling), 4) capitalize on the presence of existing hydrodynamic
infrastructure (USGS gauge stations), 5) represent diverse potential pollutant sources and/or ecological
conditions (e.g. agricultural, human, etc.) and 6) incorporate sites where historical data was available to
allow for trend analysis. All locations were classified as full fish and aquatic life (FAL) unless otherwise
noted. The following sites, numbered from upstream to downstream, were selected based upon the
above criteria:
MIDDLE ROOT RIVER
#1 ‐ Legend Creek. This tributary discharges into the Root River 47 kilometers upstream of the mouth.
The sampling site was located 0.7 km upstream of where the creek discharges into the main stem of the
river in an urban area within the City of Franklin. Legend Creek, which has limited historical data, was
chosen to augment data collected by MMSD from Milwaukee County in which monitoring locations exist
upstream and downstream.

2‐2
WEST BRANCH ROOT RIVER CANAL
#2 – Root River Canal ‐ Union Grove (RRC‐Union Grove). This sampling site is located on the west
branch of the Root River Canal in an urban area 0.2 km downstream from the Union Grove wastewater
treatment plant (WWTP) effluent discharge point. The WWTP represents a possible source of human
fecal pollution. Due to this location being effluent dominated, it has a Limited Aquatic Life (LAL) use
designation. Ephemeral stream reaches upstream of the treatment plant drain urban and agricultural
lands. Limited historical data exists and consists of a single macro‐invertebrate assessment performed
in 1996.
#3 ‐ Raymond Creek. This sampling site is located on a tributary to the canal system in an agricultural
area 1.3 km upstream of the confluence of Raymond Creek and the west canal branch. Limited
historical water quality data (16 samples from 1981‐1982, 1996) and a single macro‐invertebrate
assessment (1979) were available for this location.
#4 ‐ Root River Canal ‐ West (RRC‐West). This sampling site, on the western branch of the Root River
Canal, is 14.2 km downstream of Union Grove WWTP and 0.45 km downstream from the confluence of
the canal and Raymond Creek. This open/undeveloped location drains potential pollutants from
agricultural sections of the west canal and upstream WWTP. The confluence of the west and east canal
branches is 0.5 km downstream from this site. The canal at this location, as well as upstream, is
classified as impaired due to DO concentrations exacerbated by excess sediments/total suspended solids
and total phosphorus. Limited historical water quality (26 samples from 1981‐1982, 1996) and macro‐
invertebrate data (1981 only) exists for this site.
EAST BRANCH ROOT RIVER CANAL
#5 –Root River Canal ‐ Fonk’s Home’s Center (RRC‐Fonk’s). This sampling location, on the eastern
branch of the Root River Canal, is 0.2 km downstream from Fonk’s Home Center Inc. and Harvest View
Estates wastewater treatment plant (Fonk’s WWTP) effluent discharge point. The stream reach is
designated as Limited Aquatic Life (LAL). Local infrastructure suggests possible contributions from
human sources. Land use is agricultural upstream of the sampling location. This location has not been
historically monitored for water quality, but macro‐invertebrates were assessed once, in 1996.
#6 ‐ Root River Canal ‐ East (RRC‐East). This sampling site, on the East Canal, is located 12.3 km
downstream of RRC‐Fonk’s and 0.9 km upstream of the confluence with the main canal. The majority of
land surrounding this site is agricultural. This stream reach has a Limited Forage Fish (LFF) use
designation. Limited historical water quality (26 samples from 1981‐1982, 1996) and macro‐
invertebrate (1981) data are available for this location.
ROOT RIVER CANAL
#7 ‐ Root River Canal ‐ Main (RRC‐Main). This sampling location, on the main canal, is 3.2 km
downstream of the confluence of the west and east canal branches. This open/undeveloped site has the
potential to receive contaminant contributions from both canal branches. The entire main canal,

2‐3
inclusive of this site, is classified as impaired due to low DO concentrations associated with excess
amounts of sediments, total suspended solids, and total phosphorus. A permanent USGS stream
gauging station provides volumetric flow data. Macro‐invertebrate data was collected once, in 1979.
LOWER ROOT RIVER
#8 ‐ Husher Creek. This agricultural sampling site, located on a tributary to the main stem, is 1.5 km
upstream from the confluence of the creek and river. Husher Creek has had historically elevated fecal
indicator bacteria levels and a degraded biological community in association with excess total
phosphorus. Historical water quality data was collected from 1981‐2001 and a single macro‐
invertebrate assessment was conducted at this site in 1979.
#9 ‐ At State Highway 38 and Milwaukee County Line (38 at MKE Co Line). Located 30.2 km upstream
of the mouth, this site was the furthest upstream main stem sampling location for this study. This site is
located 0.8 km downstream from the confluence of Husher Creek, along the Root River Parkway in a
predominantly agricultural setting. Like Husher Creek, this site is located in a stream reach with a
degraded biological community due to excess total phosphorus. No historical water quality data was
available. However, fish and macro‐invertebrates were each assessed once at this site, in 2003 and 1979
respectively.
#10 ‐ At 5 Mile Road and River Road (5 Mile Road). This agricultural site, 21.9 km upstream from the
mouth, is located on the main stem of the river upstream of Hoods Creek tributary. This site has a
degraded biological community due to excess total phosphorus. Limited historical water quality (27
samples collected from 1994‐1997) and macro‐invertebrate (1979) data is available at this site.
HOODS CREEK
#11‐ Hoods Creek. The sampling site on Hoods Creek is 0.8 km upstream of the tributary’s confluence
with the Root River, which lies between sampling locations at 5 Mile Road and Johnson Park. Potential
pollutant load contributions to Hoods Creek includes effluent from the Yorkville Sewer Utility District No.
1 (Yorkville WWTP) wastewater treatment plant, which discharges 13 km upstream, as well as
surrounding urban and upstream agricultural land uses. This stream reach has a Limited Forage Fish
(LFF) use designation. Limited historical data exists at this location; 21 water quality samples collected
from 1981‐1982 and again in 1996 as well as a macro‐invertebrate assessment performed in 1979.
LOWER ROOT RIVER
#12 ‐ Johnson Park. This sampling site, located within a 335‐acre park and golf course, is on the main
stem of the Root River 17.7 km upstream of the mouth. This site has a degraded biological community
along with excess total phosphorus. Johnson Park is the furthest upstream location with a rich historical
water quality dataset (collected by the RHD). A macro‐invertebrate assessment was conducted at this
site in 1979 and fish were indexed in 2003 by Wisconsin Lutheran College.
#13 ‐ At Highway 31 and 4 Mile Road (31 and 4 Mile). This sampling location, on the main stem of the
Root River, is 15.0 km upstream of the mouth and is classified as open/undeveloped land. Upstream

2‐4
land use is dominated by suburban/agricultural uses. This site has a degraded biological community
associated with excess total phosphorus concentrations. No historical water quality data exists at this
location, but macro‐invertebrates and fish were assessed each assessed once, in 2000 and 2001
respectively.
#14‐ Horlick Dam. This sampling site is located on the main stem of the Root River immediately below
the Horlick Dam, 9.5 km upstream from the river’s mouth. From this location to the mouth, the river is
classified as impaired due to excess total phosphorus levels. Fish tissues have also been found to be
contaminated with polychlorinated biphenyls (PCBs). A wealth of historical water quality monitoring
data exists but fish and macro‐invertebrate communities have not been assessed. There is a permanent
USGS stream gauge station at this site, utilized for volumetric flow rates.
#15‐ Steelhead Facility. This urban site is located 6.5 km upstream from the mouth on the main stem of
the Root River within a 25‐acre park. The WI DNR’s Root River Steelhead Facility is immediately
downstream from this sampling site. This reach of the river is impaired due to contaminated fish tissues
(PCBs) and excess total phosphorus. Historical water quality monitoring data exists for this location.
Macro‐invertebrate and fish assessments were conducted 0.5 km downstream from this site, once each,
in 1979 (macro‐invertebrate) and 2003 (fish).
#16‐ Liberty Street Bridge. This sampling location is on the main stem of the Root River, 5.1 km
upstream from the mouth. It is impaired due to contaminated fish tissues (PCBs) and excess total
phosphorus. Historical water quality data exists at this site. Fish and macro‐invertebrate data were not
available. Past studies have recommended additional monitoring at this location due to the high
potential for sanitary contributions (Abbott, 2008).
#17 ‐ Root River Environmental Education Community Center (REC). This urban main stem site, 2.5 km
upstream from the river mouth, is 50 m upstream from the point where the river becomes channelized
prior to discharging into Lake Michigan in downtown Racine. This location is impaired due to
contaminated fish tissues (PCBs) and excess total phosphorus. Historical water quality data exists but
fish and macro‐invertebrate data were not available.
#18 – Chartroom. Located 0.4 km upstream of the mouth, this highly urbanized sampling site is greatly
influenced by the intrusion of Lake Michigan into the river channel (Abbot, 2008). The adjacent,
downstream harbor area is impaired for unspecified metals, while the river itself is impaired due to
contaminated fish tissue (PCBs) and excess total phosphorus. The area surrounding the sampling site is
dominated by commercial uses and the river is channelized. Historical water quality monitoring data
exists but fish and macro‐invertebrate assessments have not been performed.
Stormwater Outfalls. Stormwater outfall sites were selected based upon: 1) historical monitoring and
past recommendations, 2) proximity to surface water locations, and 3) likelihood for pollutant loading.
Thirteen outfalls were monitored over the course of the study; details of which are presented in Figure
2‐1 and Table 2‐2.

2‐5
Additional Monitoring Sites. Additional main stem, tributary, canal and stormwater outfall samples, or
additional sampling events at existing sites, were conducted in 2011 and 2012, on a limited basis, to
investigate elevated E. coli concentrations at headwater locations on both the East and West Branch
Canals. In addition to routine canal sites, eight locations on the West and four locations on the East
Canal Branch were monitored upstream, at, and downstream of potential pollutant sources (e.g. WWTP
effluent discharge locations and confluences with smaller tributaries). Additional canal sampling site
information can be found in Figure 2‐1 and is summarized in Table 2‐2.
2.4 Field Methods
Field methods include sample collection techniques (surface water, stormwater outfalls and total
phosphorus), and field measurements (habitat assessments, dissolved oxygen, water temperature, and
biotic community assessments).
FIELD SAMPLE COLLECTION
Surface Water and Stormwater Outfalls. Both Root River surface water and storm water outfall samples
were collected in sterile Whirl‐Pak® bags (Nasco, Fort Atkinson, WI) by hand or by using a sampling line
or sampling pole. Samples were collected approximately 10 centimeters (cm) below the surface of the
water. In instances of insufficient water depth, samples were collected at the deepest depth that did not
introduce stream bed sediments into the sample. A blunt object was used to break the ice during the
winter. If the ice was too thick to break, the sample was not collected. Upon collection, water samples
were stored in a cooler, on ice packs, and held at 4°C for transport to the City of Racine Health
Department Laboratory (RHD) where samples were analyzed within one day of sample collection.
NOTE: If samples for Bacteroides analysis were also needed, they were collected in a separate Whirl‐
Pak® bag in the same manner as specified above.
Total Phosphorus. Samples were collected once per month, condition dependent, at all surface water
sites for analysis of total phosphorus to capture representative base flow (dry) and high flow (following
snow melt or rain) events. Samples were collected in Whirl‐Pak® bags and carefully poured into pre‐
labeled sterile 250 ml polyethylene plastic bottles and preserved with approximately 1.0 ml of sulfuric
acid at the sampling site. A pH of approximately 1.0 was verified using a colorpHast® pH indicator strip
(EM Science, Gibbstown, NJ). Samples were subsequently placed in a cooler, transported to the RHD lab
and held at 0‐4°C until they were shipped on ice to the Wisconsin State Lab of Hygiene (WSLH) to be
analyzed within 28 days of sample collection.
FIELD MEASUREMENTS
Field measurements included habitat assessments, fish and macro‐invertebrate assessments and
measurements of temperature and DO.
Habitat Assessments. Habitat assessments along the Root River were conducted from November 7th to
December 5th, 2011 using a modified version of the WI DNR Wadable Stream Qualitative Fish Habitat
Rating forms for less than (<) 10 and greater than or equal to (≥) 10 meter (m) stream widths (Forms

2‐6
3600‐532A and B) (Tables 2‐3 and 2‐4). Three transects were established at each sampling site, two
upstream and one downstream from the routine monitoring location. Main stem and canal stations
were located downstream 100 m and upstream 100 and 200 m from the sampling site. Due to narrower
stream channels, tributary stations were located downstream 50 m and upstream 50 and 100 m from
the sampling site. All habitat assessments were conducted during normal water levels, at or near base
flow. For streams <10 m, seven rating categories were evaluated: 1) width to depth ratio, 2) riparian
buffer width, 3) bank erosion, 4) canopy cover, 5) channel condition, 6) fine sediments, and 7) fish cover.
For ≥10 m streams, six rating categories were evaluated: 1) maximum thalweg depth, 2) bank stability,
3) canopy cover, 4) channel condition, 5) rocky substrate, and 6) fish cover. For stream widths, pool
area and riffle to riffle or bend to bend ratios could not be calculated due to insufficient resources to
evaluate more than three transects per site. Canopy cover and channel condition replaced the original
categories of pool area and riffle to riffle or bend to bend ratio. Stream width, bankfull width and depth,
and deepest point were measured in feet and converted to meters (WI DNR, 2000a).
The measured stream width was divided into fifths to establish four channel positions (⅕, ⅖, ⅗, ⅘). In‐
stream measurements of depth, embeddedness, substrate, algae abundance, macrophyte abundance,
and shading/canopy were quantified within a one square meter area around each channel position.
Depth was measured at each channel position, in addition to the deepest point across the channel.
Embeddedness, the degree to which coarse substrate such as gravel and rubble/cobble are surrounded
by or covered with fine materials such as sand or silt, was visually estimated to the nearest 10 percent of
surface area coverage. The percentage of substrate types (e.g. bedrock, gravel, silt) by transect was
visually estimated to the nearest five percent. Algae (attached and filamentous) and macrophyte
(submergent, emergent, and floating plants) abundances on the stream bed were visually estimated to
the nearest 10 percent surface area coverage. Although leaves were off the trees at the time of habitat
assessment, the percentage of canopy/shading was estimated based on tree branch coverage directly
overhead.
Habitat cover and riparian land use and width were evaluated next to sites. Various types of habitat
cover (e.g. undercut banks, overhanging vegetation >0.20 m, woody debris) for adult game fish were
estimated 0.15 m upstream and downstream of each channel position. The amount and type of stream
buffer (e.g. cropland, developed, woodland) was visually estimated within five meters from the stream
edge and the width of undisturbed buffer within 10 m of the stream edge was measured. Bank erosion
was quantified in two ways: 1) the length of continuous bare soil between 10 m upstream and
downstream of the sampling transect; and 2) the percentage of eroded bank within 5 m of the stream
edge.
The quality of the habitat was rated from poor to excellent for individual categories and an overall
habitat score was tabulated based upon criteria outlined in the WI DNR Wadable Stream Qualitative Fish
Habitat Rating Form. Modifications were made to these criteria to reflect the absence of measurements
for pool area and riffle to riffle or bend to bend ratio and the inclusion of canopy cover and stream bank
conditions.

2‐7
Fish Community Assessments. Fish community assesssments were conducted by WI DNR personnel
once, at nine study sites, from July 12th to September 13th, 2011. These sites were selected to replicate
historically monitored locations, and capture key biological data within a variety of sub‐watersheds.
Fish community assessments were conducted by establishing 400 m transects, intended to cover at least
three pool‐riffle sequences at pre‐selected locations. Fish were collected from these transects to
determine community composition using electrofishing, a technique to incapacitate fish allowing for
their retrieval. A single electrofishing run was made from downstream to upstream at each transect.
Electrofishing was conducted using one or two backpack shockers (in small streams) or one stream
shocker in areas deep enough for a small boat containing a generator. Two or three operators waded
with hand‐held electrodes to stun the fish and facilitate capture by net on the water’s surface. All fish
greater than 26 mm in total length were collected and placed in a holding tub until species
identifications and counts were conducted at the end of each run. After fish counts and species
determination, fish were returned to the stream (WI DNR, 2001).
The species richness and composition, trophic and reproductive function, and fish abundance and
condition was used to calculate an Index of Biotic Integrity score (IBI) (Lyons, 1992). The IBI is
formulated to integrate information from individual, population, community, zoogeographic, and
ecosystem levels. The IBI specific to Wisconsin’s intermediate‐sized warm water streams utilizes 10
basic metrics with two additional metrics when extreme values are present. An overall score from zero ‐
100 equates to a biotic integrity ratings between “Very poor” to “Excellent” (Lyons, 1986).
Macro‐invertebrate Community Assessments. Macro‐invertebrate community assessments were
conducted by Wisconsin Department of Natural Resources personnel once, at fourteen study sites, from
November 3rd to December 1st, 2011. One to four macro‐invertebrate sampling locations were selected
at each site. Areas with riffles, logjams or a benthic substrate of coarse gravel to large rubble (< 0.3 m
diameter), and a stream flow velocity of at least 0.3 meters per second (m/s) represented ideal sampling
locations for macro‐invertebrate communities. Samples were obtained by holding a D‐shaped 600‐
micron mesh kick net firmly against the stream bottom and disturbing the substrate located upstream at
one arm’s length. Macro‐invertebrates were dislodged with this motion and forced downstream into
the net due to the current along with suspended sediments. Ideally, at least 100 macro‐invertebrates
were collected within three minutes. If this number was not achieved within two rounds of the
procedure, the sample was preserved with the number obtained. The net was cleaned of large debris
and rinsed of fine sediment, being careful not to lose captured organisms. The organisms remaining in
the net were transferred to a wide‐mouth jar. Isopropyl alcohol or ethanol (80‐85%) was poured into
the jar, sealed and gently inverted several times to preserve specimens. After 24 hours, the alcohol was
drained and replaced. Following preservation, jars were shipped to University of Wisconsin‐Stevens
Point for taxonomic identification (WI DNR, 2000b). A Hilsenhoff Biotic Index (HBI) score was calculated
at each location by multiplying the number of each species present by their respective pollution
tolerance value, totaling the value for all species and dividing by the total number of invertebrates (WI
DNR, 2000b; Hilsenhoff, 1987). Scores ranging between 0.0 (excellent) and 10.0 (very poor) indicates
the degree of water quality pollution associated with each location (Hilsenhoff, 1987).

2‐8
Temperature. Air Temperature was recorded at each site in degrees Celsius (°C) using an alcohol linear‐
scale calibrated thermometer. The thermometer was held in the shade, away from the body, at
approximately chest height and was allowed to stabilize prior to recording values. Water temperature
was recorded using a thermistor within a Yellow Stream Instrument (YSI) Model 550A dissolved oxygen
probe for all surface water sites. For outfalls, excess sample water was poured into a separate bag, and
an alcohol based thermometer was submersed into the bag until the temperature equilibrated and
stabilized.
Dissolved Oxygen. Dissolved oxygen (percent saturation and mg/L) was measured at sampling locations
using a YSI Model 550A dissolved oxygen meter. Prior to sampling, the meters were calibrated in
accordance to the factory recommended calibration methods. Once calibrated, the probe was
submerged approximately 10 cm below the water surface and slowly moved in a circular motion. This
gentle movement of the probe prevents consumption of dissolved oxygen, which would result in
artificially low readings. Concentrations (mg/L and percentage saturation) were allowed to stabilize and
values recorded.
2.5 Laboratory Methods
Laboratory measurements included turbidity, E. coli, Bacteroides (sample filtration only), pH, specific
conductivity, chlorine, and detergents.
Turbidity. The turbidity of each sample was analyzed at the Racine Health Department Laboratory
within 24 hours of sample collection. All turbidity units were recorded in Nephelometric Turbidity Units
(NTU). Samples were analyzed using a HF Scientific Micro 100 Turbidimeter calibrated monthly with
primary (0.02, 10, 1000 NTU) standards (GFS Chemicals, Columbus, OH). A quality control check was
performed daily before sample analysis with sealed secondary standards of the same units (GFS
Chemicals, Columbus, OH). A thoroughly mixed aliquot of the sample was poured into a rinsed cuvette
and the outer surface wiped with an alcohol swab and dried. The cuvette was then placed in the
turbidimeter optical well and indexed, rotating the cuvette in 10° increments until a complete rotation
occurred. The lowest reading of the sample was recorded in NTU.
E. coli. E. coli was quantified using IDEXX Colilert ‐ 18® or IDEXX Colilert® (IDEXX, Inc., Westbrook, ME), a
selective cultural identification method utilizing bacterial enzymatic activity and differential substrates,
for the detection of E. coli according to previously established laboratory protocols. In brief, samples
were processed diluted, 1:10 (10 mL of sample + 90 mL sterile distilled water), or 1:100 (1.0 mL sample +
99 mL of sterile distilled water) based on visual inspection of the sample (using sample cloudiness as an
estimation of gross turbidity). The sample was then mixed with reagent and sealed in a
Quanti‐Tray/2000 according to manufacturer’s instructions (Colilert or Colilert‐18® product insert, IDEXX
Laboratories, Westbrook, ME). After incubation at 35 ° C ± 0.5 ° C for 18 hours (or 24 hours for
Colilert®), Quanti‐Tray wells were read for yellow color indicating onitrophenyl ß‐D‐galactopyranoside
(ONPG) hydrolysis (confirmatory for the presence of total coliforms) and fluorescence, indicating
4‐methyl‐umbelliferyl ß‐D‐glucuronide (MUG) cleavage (confirmatory for the presence of E. coli), with

2‐9
the aid of a UV light box (366 nm). Wells producing fluorescence in the absence of yellow color were
determined to be false readings (E. coli would be classified as a total coliform and therefore should be
detected by this method as such, according to the manufacturer). The number of wells producing
fluorescence was compared to the MPN table provided by the manufacturer to enumerate E. coli as
MPN/100 mL (Most Probable Number of E. coli per 100 mL). The MPN unit is based upon a statistical
method developed by Colilert® and is analogous to the results generated from membrane filtration, a
traditional E. coli detection method which produces E. coli counts in colony forming units (CFU). E. coli
concentrations below the detection limit were treated as half the detection limit for statistical
calculation purposes, i.e. <10 MPN/100 mL became 5 MPN/100 mL. Quality control organisms (positive
= E. coli ATCC #25922, negative = P. aeruginosa ATCC # 10145) were run once per box of reagent to
validate (qualitative) test performance.
Bacteroides. Samples intended for Bacteroides enumeration (human specific and total) were
thoroughly mixed and filtered as two sample replicates (two‐100‐mL aliquots) through sterile
0.45‐micron, 47 mm nitrocellulose filters (Millipore Corporation, Billerica, MA). Filters were frozen at ‐
80 °C and later transported on ice to the laboratory of Dr. Sandra McLellan at the University of
Wisconsin‐Milwaukee School of Freshwater Science where the sample analysis occurred as per Sauer et
al (2011).
pH. The pH of each sample was measured at the Racine Health Department Laboratory on the same day
that sampling occurred. Prior to sample analysis, the Corning Model 430 pH meter was calibrated using
a two point calibration procedure with known pH buffer standards of 7.00 and 4.01. Calibrated values
and percent slope were recorded; the acceptable range for slope was 95‐100%. If values fell outside this
range, the standards were discarded and calibration occurred again. The calibration was further verified
using a pH 10.0 standard. After calibration, a thoroughly mixed 80 ml aliquot of sample was poured into
a clean 100 ml beaker and stirred with a magnetic stirrer. The sample was placed under the electrode
and the reading was allowed to stabilize (usually within 2‐3 minutes). Values were recorded in standard
units (s.u.).
Specific Conductivity. Specific conductivity in each sample collected was measured at the Racine Health
Department Laboratory on the same day that sampling occurred using an Oakton Model Con‐510
(Vernon Hills, IL) digital conductivity meter. The meter was calibrated monthly and a quality control
check performed daily using known standards prior to sample analysis. A thoroughly mixed 80 ml aliquot
of sample was poured into a clean 100 ml beaker and gently stirred with a magnetic stirrer with the
probe immersed. Once the reading had equilibrated (usually within 10 seconds), the value was recorded
in micro Siemens per centimeter (µS/cm). The electrode was rinsed in between samples with deionized
water and dried to prevent cross contamination.
Chlorine. Storm water outfall samples were analyzed for total residual chlorine on the same day of
sample collection using a Lovibond® Comparator 2000 test kit. Two 13.5 ml glass vials (Orbeco Hellige,
Inc., Sarasota, FL) were rinsed three times with sample, filled to the ten ml mark and a DPD No. 4 tablet
deposited into one vial and crushed. The untreated and treated vials were inserted into the left‐ and

2‐10
right‐hand compartments, respectively, of a Lovibond® 2000 comparator and viewed against a bright
fluorescent light source. The comparator translates the intensity of color (indicating diethyl‐p‐
phenylenediamine) into the concentration of total residual chlorine (mg/L). If the treated sample was
not clear and colorless but did not have a color reaction at least as intense as the minimum detection
level of 0.1 mg/L, the values were recorded as less than (<) 0.1 mg/L.
Detergents. Storm water outfall samples were analyzed for detergents at the Racine Health Department
Laboratory using CHEMets® Test Kit R‐9400 (CHEMetrics Inc. Calverton, VA) on the day of sample
collection. Per manufacturer directions, a thoroughly mixed 5 ml aliquot of the sample was poured into
a clean reaction tube and mixed with a predetermined quantity of methylene blue and shaken
vigorously for 30 seconds. The sample was then left undisturbed for one minute. A CHEMets® assembly
ampoule with an immiscible organic solvent was used to draw up the blue complex from the reaction
tube. Detergents, which are one of the most prominent methylene blue active substances, were
measured in mg/L (ppm) linear alkylbenzene sulfonate (325 g/mole) using the provided comparator that
matched the blue color intensity to the concentration of methylene blue active substances in the
sample. The undiluted test range is 0.0 to 3.0 mg/L, measured in increments of 0.25 mg/L. If the color
was between two standards, a visual determination was made to assign a concentration. If the
concentration exceeded 3.0 mg/L, 0.5 ml of sample was diluted with 4.5 ml deionized reagent‐grade
water to increase the test’s detection range to 30 mg/L.
2.6 Hydrodynamic Variables
Volumetric Flow Rate. The instantaneous volumetric flow rate was obtained through the USGS water
data website (http://waterdata.usgs.gov/WI/nwis/current/?type=flow) from one of three gauging
stations on the Root River (Table 2‐5). The flow rate, measured in cubic feet per second (cfs) and
converted to cubic meters per second (m3/s), was obtained for the closest 15‐minute increment prior to
the recorded sampling time at each site. Two gauging stations were located on the main stem: Root
River near Franklin, WI (#04087220) at river kilometer 43.0 and Root River at Racine, WI (#04087240) at
river kilometer 9.5. One gauging station was located on the canal system, Root River Canal near
Franklin, WI (#04087233) at 5.4 kilometers upstream of the canal confluence with the main stem. The
Root River near Franklin data was utilized for the three upstream‐most main stem and tributary sites.
The Root River at Racine data was utilized for the remaining main stem and tributary sites. Data from
the Root River Canal near Franklin was used for the six canal sites.
Wastewater Effluent Discharge Volume and Related Parameters. Wastewater Effluent discharge
volume and related parameters for the Union Grove Wastewater Treatment Plant (Union Grove WWTP),
Fonk’s Home Center Inc., Harvest View Estates Wastewater Treatment Plant (Fonk’s WWTP), and
Yorkville Sewer Utility District No. 1 (Yorkville WWTP) were obtained from the WDNR (Table 2‐5).
Continuous volume, maximum temperature (°F converted to °C), minimum DO (mg/L), and minimum
and maximum pH (s.u.) were measured once daily at least three times per week from each of the three
plants. Total phosphorus (mg/L) was measured as a monthly average from four weekly samples
collected at the Union Grove WWTP and as a 24‐hour composite collected once per month at Fonk’s
WWTP. Flow rates were measured in millions of gallons per day (MGD) and converted to m3/s. At

2‐11
Yorkville WWTP, measurement of maximum temperature was only required in 2011 and total
phosphorus was a voluntary measurement.
Precipitation. Rainfall totals were obtained from five rain gauge stations operated by three wastewater
treatment facilities in Racine and Milwaukee counties (Table 2‐5). Precipitation totals, retrieved in
inches and converted to centimeters, were reported for the previous 24‐, 48‐, and 72‐hr time periods
immediately prior to sample collection. The Milwaukee Metropolitan Sewerage District (MMSD)
operated the MMSD Maintenance Facility (WS 1222) and Franklin Public Works Yard (WS 1226). From
August 3rd, 2011 – March 22nd, 2012, WS 1222 was utilized for precipitation totals at three sampling sites
until WS 1226, a more central location, became operational on March 23, 2012. The Union Grove
WWTP operated a rain gauge station onsite and totals were applied to the canal sites. The Racine
WWTP operated Golf and Conrad (SS12) and Festival Park (L04) rain gauge stations in Racine; rainfall
totals from these locations were utilized for the 5 Mile Road site downstream to the mouth.
2.7 Statistical Analysis
Prior to statistical analysis, five percent of the data was randomly checked to ensure data quality. Basic
statistical analyses were conducted to determine conditions impacting water quality and seasonal
variation, including descriptive statistics and trend analysis. Microsoft® Office Excel data analysis
ToolPak was used to calculate descriptive statistics. Trend analysis and seasonal variations was analyzed
using SPSS® (IBM, Armonk, NY) statistical program. Significant p values were <0.05 unless otherwise
noted. Due to limited degrees of freedom, p values of <0.10 were considered significant for macro‐
invertebrate and fish assessment data analysis. Correlations were calculated for select variables and
tests of significant difference were conducted between seasons at each site. The Shapiro‐Wilk normality
test was first applied to determine if parametric or non‐parametric tests should be utilized based upon
data distribution. Mean comparisons were conducted through independent sample t‐tests and analysis
of variance (ANOVA). If log‐transformed data were not normal, then distributions were tested through
Mann‐Whitney or Kruskal‐Wallis non‐parametric tests. Normalcy and equal variance test results were
used to determine appropriate post‐hoc treatments for multiple variable tests such as Tukey‐Kramer
Method, Bonferroni‐Dunn test, and Games‐Howell.
Water quality monitoring results were interpreted in context of standards from the WI DNR (based upon
use classification), recommendations from the U.S. EPA, criteria used in adjacent states, and published
research. A summary of exceedances ranges for state and recommended standard by parameter,
depending upon site type (surface water or stormwater outfall), within the Root River watershed is
displayed in Table 1‐2.

2‐12
Table 2‐1, Root River surface water sampling sites.
Latitude Longitude
1 Legend Creek UR Middle Root River tributary 0.7 ‐ 42.89805 ‐87.99936
2 RRC‐Union Grove UR West Branch RRC canal 14.7 MI 42.68941 ‐88.03199
3 Raymond Creek AG West Branch RRC tributary 1.3 MI 42.78624 ‐87.99518
4 RRC‐West OP West Branch RRC canal 0.5 MI 42.78620 ‐87.98811
5 RRC‐Fonk's AG East Branch RRC canal 13.2 MI 42.68879 ‐87.99132
6 RRC‐East AG East Branch RRC canal 0.9 MI 42.78628 ‐87.98057
7 RRC‐Main OP Root River Canal canal 5.4 MI 42.81537 ‐87.99494
8 Husher Creek AG Lower Root River tributary 1.5 MI 42.82911 ‐87.91498
9 38 at MKE Co Line AG Lower Root River main stem 30.2 F, MI 42.84211 ‐87.91390
10 5 Mile Road AG Lower Root River main stem 21.9 MI 42.79938 ‐87.86947
11 Hoods Creek UR Hoods Creek tributary 0.8 MI 42.77271 ‐87.86643
12 Johnson Park UR Lower Root River main stem 17.7 WQ, F, MI 42.77448 ‐87.85407
13 31 and 4 Mile OP Lower Root River main stem 15.0 F, MI 42.78441 ‐87.83580
14 Horlick Dam UR Lower Root River main stem 9.5 WQ 42.75190 ‐87.82410
15 Steelhead Facility UR Lower Root River main stem 6.5 WQ, F, MI 42.73190 ‐87.81306
16 Liberty St. Bridge UR Lower Root River main stem 5.1 WQ 42.73026 ‐87.80178
17 REC UR Lower Root River main stem 2.5 WQ 42.72436 ‐87.79593
18 Chartroom UR Lower Root River main stem 0.4 WQ 42.73374 ‐87.78275
* Land Use Types: UR=urban; AG=agricultural; OP=open/undeveloped
Sub‐Watershed (RRC=Root River Canal)
**River kilometers are measured from the river's mouth (main stem sites) or from the closest confluence with the main stem
(main stem tributaries), main canal branch (west or east branch canal sites), and west or east canal branches (canal
Root River Watershed Study Surface Water Sites #1‐18 Racine Health Department, 8.3.11 ‐ 3.20.13
Site Code
Surface Water Site (Upstream to
Downstream)
Land
Use*
River Section
Type River
Kilo
meter** Historical
Monitoring (Water
Quality (WQ),
F, MI)
Coordinates

2‐13
Figure 2‐1: Root River Watershed water quality study and ancillary data sites.
West Branch
Root River Canal East Branch Root
River Canal
Main Branch
Root River Canal
Middle Root River
sub‐watershed
Lower Root River
sub‐watershed
Hoods Creek
sub‐watershed

2‐14
Table 2‐2, Additional main stem, tributary, canal and stormwater outfall monitoring locations.
Latitude Longitude
19W. Puetz before S. 68th St.
(Upstream of canal)main stem 45.2 42.88673 ‐87.99138
20 Upstream of UG Effluent west canal 15.1 42.69128 ‐88.03352
21 Union Grove Effluent effluent discharge to west canal 15.1 42.69119 ‐88.03353
22 RRC‐West at Oakdale Rd west canal 10.2 42.70996 ‐88.01526
23 UG Tributary at 61st Dr tributary to west canal 0.6 42.71313 ‐88.02230
24 RRC‐West at Hwy 20 west canal 7.1 42.73411 ‐88.01013
25 Yorkville Creek at Hwy 20 tributary to west canal 0.7 42.73561 ‐88.01527
26 50th Rd Tributary tributary to west canal 6.2 42.74213 ‐88.00819
27 RRC‐West at 3 Mile Rd west canal 2.2 42.77167 ‐87.98827
28 Upstream of Fonk's Effluent east canal 13.5 42.68686 ‐87.99125
29 Fonk's Effluent effluent discharge to east canal 13.5 42.68692 ‐87.99127
30 RRC‐East at Hwy 20 east canal 8.1 42.73203 ‐87.98208
31 RRC‐East at 3 Mile Rd east canal 3.0 42.77158 ‐87.96779
32 Horlick Dam‐Northwest main stem 9.5 42.75195 ‐87.82417
33 Horlick Dam‐East main stem 9.5 42.75183 ‐87.82387
34 Horlick Dam‐Southwest main stem 9.5 42.75167 ‐87.82429
35 Luedtke off Dominic main stem 5.4 42.73289 ‐87.80589
36 Luedtke at Spring main stem 5.4 42.73270 ‐87.80601
37 Lutheran High School main stem 4.9 42.72965 ‐87.80517
38 Luedtke & Rupert main stem 4.6 42.72729 ‐87.80595
39 Upstream‐Liberty St main stem 5.2 42.73118 ‐87.80138
40 Liberty Street main stem 5.1 42.73021 ‐87.80168
41 Washington Park 3 main stem 3.7 42.72008 ‐87.80804
42 Washington Park 1 main stem 3.7 42.71960 ‐87.80772
43 Washington Park 2 main stem 3.7 42.71955 ‐87.80761
44 Water Street Composite main stem 1.8 42.72936 ‐87.79162
Extra Canal Sites (# 19‐31)
Stormwater Outfalls (#32‐44)
* River kilometers are measured from the river's mouth (main stem sites) or from the closest confluence with the
main stem (main stem tributaries), main canal branch (west or east branch canal sites), and west or east canal
branches (canal tributaries).
Root River Watershed Study Additional Monitoring Sites #19‐44 Racine Health Department, 8.3.11 ‐ 3.20.13
Site Code
Site
(Upstream to Downstream)River Section
*River
Kilometer
Coordinates
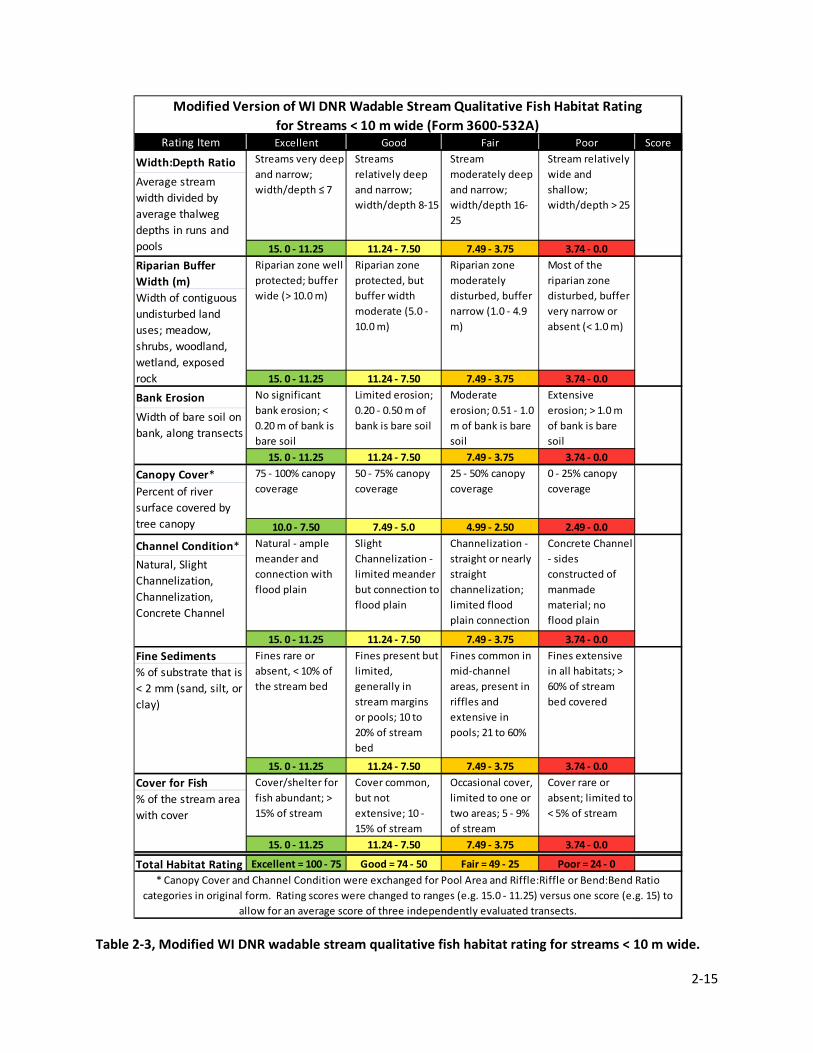
2‐15
Table 2‐3, Modified WI DNR wadable stream qualitative fish habitat rating for streams < 10 m wide.
Rating Item Excellent Good Fair Poor Score
Width:Depth Ratio
15. 0 ‐ 11.25 11.24 ‐ 7.50 7.49 ‐ 3.75 3.74 ‐ 0.0
Riparian Buffer
Width (m)
15. 0 ‐ 11.25 11.24 ‐ 7.50 7.49 ‐ 3.75 3.74 ‐ 0.0
Bank Erosion
15. 0 ‐ 11.25 11.24 ‐ 7.50 7.49 ‐ 3.75 3.74 ‐ 0.0
Canopy Cover*
10.0 ‐ 7.50 7.49 ‐ 5.0 4.99 ‐ 2.50 2.49 ‐ 0.0
Channel Condition*
15. 0 ‐ 11.25 11.24 ‐ 7.50 7.49 ‐ 3.75 3.74 ‐ 0.0
Fine Sediments
15. 0 ‐ 11.25 11.24 ‐ 7.50 7.49 ‐ 3.75 3.74 ‐ 0.0
Cover for Fish
15. 0 ‐ 11.25 11.24 ‐ 7.50 7.49 ‐ 3.75 3.74 ‐ 0.0
Total Habitat Rating Excellent = 100 ‐ 75 Good = 74 ‐ 50 Fair = 49 ‐ 25 Poor = 24 ‐ 0
Percent of river
surface covered by
tree canopy
No significant
bank erosion; <
0.20 m of bank is
bare soil
Limited erosion;
0.20 ‐ 0.50 m of
bank is bare soil
Moderate
erosion; 0.51 ‐ 1.0
m of bank is bare
soil
Width of contiguous
undisturbed land
uses; meadow,
shrubs, woodland,
wetland, exposed
rock
Riparian zone well
protected; buffer
wide (> 10.0 m)
Riparian zone
protected, but
buffer width
moderate (5.0 ‐
10.0 m)
Riparian zone
moderately
disturbed, buffer
narrow (1.0 ‐ 4.9
m)
75 ‐ 100% canopy
coverage
50 ‐ 75% canopy
coverage
25 ‐ 50% canopy
coverage
0 ‐ 25% canopy
coverage
* Canopy Cover and Channel Condition were exchanged for Pool Area and Riffle:Riffle or Bend:Bend Ratio
categories in original form. Rating scores were changed to ranges (e.g. 15.0 ‐ 11.25) versus one score (e.g. 15) to
allow for an average score of three independently evaluated transects.
% of substrate that is
< 2 mm (sand, silt, or
clay)
Cover/shelter for
fish abundant; >
15% of stream
Cover common,
but not
extensive; 10 ‐
15% of stream
Occasional cover,
limited to one or
two areas; 5 ‐ 9%
of stream
Cover rare or
absent; limited to
< 5% of stream% of the stream area
with cover
Fines rare or
absent, < 10% of
the stream bed
Fines present but
limited,
generally in
stream margins
or pools; 10 to
20% of stream
bed
Fines common in
mid‐channel
areas, present in
riffles and
extensive in
pools; 21 to 60%
Fines extensive
in all habitats; >
60% of stream
bed covered
Natural ‐ ample
meander and
connection with
flood plain
Extensive
erosion; > 1.0 m
of bank is bare
soil
Modified Version of WI DNR Wadable Stream Qualitative Fish Habitat Rating
for Streams < 10 m wide (Form 3600‐532A)
Natural, Slight
Channelization,
Channelization,
Concrete Channel
Most of the
riparian zone
disturbed, buffer
very narrow or
absent (< 1.0 m)
Slight
Channelization ‐
limited meander
but connection to
flood plain
Channelization ‐
straight or nearly
straight
channelization;
limited flood
plain connection
Concrete Channel
‐ sides
constructed of
manmade
material; no
flood plain
Average stream
width divided by
average thalweg
depths in runs and
pools
Streams very deep
and narrow;
width/depth ≤ 7
Streams
relatively deep
and narrow;
width/depth 8‐15
Stream
moderately deep
and narrow;
width/depth 16‐
25
Stream relatively
wide and
shallow;
width/depth > 25
Width of bare soil on
bank, along transects

2‐16
Table 2‐4, Modified WI DNR wadable stream qualitative fish habitat rating for streams ≥ 10 m wide.
Rating Item Excellent Good Fair Poor Score
Maximum Thalweg
Depth
22. 0 ‐ 16.50 16.49 ‐ 11.0 10.99 ‐ 5.50 5.49 ‐ 0.0
Bank Stability
12.0 ‐ 9.0 8.99 ‐ 6.0 5.99 ‐ 3.0 2.99 ‐ 0.0
Canopy Cover*
10.0 ‐ 7.50 7.49 ‐ 5.0 4.99 ‐ 2.50 2.49 ‐ 0.0
Channel Condition*
12.0 ‐ 9.0 8.99 ‐ 6.0 5.99 ‐ 3.0 2.99 ‐ 0.0
Rocky Substrate
22. 0 ‐ 16.50 16.49 ‐ 11.0 10.99 ‐ 5.50 5.49 ‐ 0.0
Cover for Fish
22. 0 ‐ 16.50 16.49 ‐ 11.0 10.99 ‐ 5.50 5.49 ‐ 0.0
Total Habitat Rating Excellent = 100 ‐ 75 Good = 74 ‐ 50 Fair = 49 ‐ 25 Poor = 24 ‐ 0
% of bank protected
by rock or vegetation
Modified Version of WI DNR Wadable Stream Qualitative Fish Habitat Rating
for Streams ≥ 10 m wide (Form 3600‐532B)
Streams very
deep; ≥ 1.5 m
Stream relatively
deep; 1 ‐ 1.5 m
Stream
moderately deep;
0.6 ‐ 0.9 m
Stream relatively
shallow; < 0.6 m
Average of the four
deepest depths
recorded
No significant
bank erosion; ≥
90% of bank
protected; < 10%
of bare soil
Limited erosion;
70 to 90% of bank
protected; 10 ‐
30% bare soil
Moderate
erosion; 50 to 69%
of bank
protected; 31 ‐
50% bare soil
Extensive
erosion; < 50% of
bank protected; >
50% bare soil
Natural, Slight
Channelization,
Channelization,
Concrete Channel
75 ‐ 100% canopy
coverage
50 ‐ 75% canopy
coverage
25 ‐ 50% canopy
coverage
0 ‐ 25% canopy
coveragePercent of river
surface covered by
tree canopy
Natural ‐ ample
meander and
connection with
flood plain
Slight
Channelization ‐
limited meander
but connection to
flood plain
Channelization ‐
straight or nearly
straight
channelization;
limited flood
plain connection
Concrete Channel
‐ sides
constructed of
manmade
material; no
flood plain
% of substrate, by
area, that is bedrock,
boulder,
rubble/cobble, or
gravel
* Canopy Cover was exchanged for original form's Riffle:Riffle or Bend:Bend Ratio category and Channel
Condition was added in by reducing the 25‐point categories (Maximum Thalweg Depth, Rocky Substrate, and
Cover for Fish) by 3 points. Rating scores were changed to ranges (e.g. 22.0 ‐ 16.50) versus one score (e.g. 22) to
allow for an average score of three independently evaluated transects.
Cover/shelter for
fish abundant; ≥
12% of stream
Cover common,
but not
extensive; 7 ‐
12% of stream
Occasional cover,
limited to one or
two areas; 2 ‐ 6%
of stream
Cover rare or
absent; limited to
< 2% of stream% of the stream area
with cover
Extensive rocky
substrate; ≥ 65%
of the stream bed
Moderate rocky
substrate; 45 ‐
65% of stream
bed
Limited rocky
substrate; 15 ‐
44% of stream
bed
Rocky substrate
uncommon; <
15% of stream
bed

2‐17
Table 2‐5, Root River Watershed ancillary data collection.
Latitude Longitude
45Root River near Franklin,
WI (04087220)RR‐F 43.0
Legend Creek, Husher Creek, 38 at
MKE Co. Line42.87361 ‐87.99583
46Root River Canal near
Franklin, WI (04087233)RRC 5.4
RRC‐Union Grove, Raymond Creek,
RRC‐West, RRC‐Fonk's, RRC‐East,
RRC‐Main
42.81550 ‐87.99479
47Root River at Racine, WI
(04087240)
RR at
Racine
(Horlick
Dam)
9.5
5 Mile Road, Horlick Dam, Johnson
Park, 31 and 4 Mile, Horlick Dam,
Steelhead Facility, Liberty St.
Bridge, REC, Chartroom
42.75139 ‐87.82361
Latitude Longitude
48
Union Grove
Wastewater Treatment
Plant
Union
Grove
WWTP
RRC‐Union Grove, RRC‐West 42.69026 ‐88.03375
49
Fonk’s Home Center
Inc., Harvest View
Estates Wastewater
Fonk's
WWTPRRC‐Fonk's, RRC‐East 42.68674 ‐87.99168
50Yorkville Sewer Utility
District No. 1
Yorkville
WWTPHoods Creek, Johnson Park 42.72813 ‐87.95856
Latitude Longitude
FFranklin Public Works
Yard (active 3/23/12)WS 1226 42.87192 ‐88.01340
MMMSD Maintenance
FacillityWS 1222 42.93460 ‐87.92894
U
Union Grove
Wastewater Treatment
Plant
UGWWTP
RRC‐Union Grove, Raymond Creek,
RRC‐West, RRC‐Fonk's, RRC‐East,
RRC‐Main
42.68995 ‐88.03368
SGolf Avenue & Conrad
DriveSS12
5 Mile Road, Hoods Creek, Johnson
Park, 31 and 4 Mile, Horlick Dam42.74987 ‐87.81663
L Festival Park L04Steelhead Facility, Liberty St.
Bridge, REC, Chartroom42.72890 ‐87.78123
* River kilometers are measured from the river's mouth (main stem sites) or from the closest confluence with the main stem (main stem
tributaries), main canal branch (west or east branch canal sites), and west or east canal branches (canal tributaries).
volumetric flow rate,
dissolved oxygen, pH,
total phosphorus
Legend Creek, Husher Creek, 38 at
MKE Co Line
8/3/11 ‐
3/20/13
* River kilometers are measured going upstream from the river's mouth for the main stem sites or from the closest confluence with the main
stem (main stem tributaries), main canal branch (west or east branch canal sites), or west or east canal branches (canal tributaries).
Wastewater Treatment Plant Sites (effluent discharge) (#48‐50)
Site Code
Wastewater
Treatment Plant Site
Abbrev‐
iation
3/23/12 ‐ 3/20/13
8/3/11 ‐ 3/22/12
8/3/11 ‐ 3/20/13
Relevant Effluent
Parameters Tested
Downstream Surface Water
Sites
Site Code
Root River Watershed Study Ancillary Data Sites (#45‐50, F, M, U, S, L) Racine Health Department, 8.3.11 ‐ 3.20.13
USGS Volumetric Flow Rate Gauge Station Sites (#45‐47)
Site Code
Gauge Station Site
(USGS Station #)
Precipitation Gauge Station Sites (F, M, U, S, L)
Coordinates
volumetric flow rate,
dissolved oxygen, pH
Abbrev‐
iation
*River
Kilometer
Dates Data
ObtainedApplicable Surface Water Sites
Coordinates
Precipitation Gauge
Station Site
Abbrev‐
iation
Dates Precipitation
Data ObtainedAssigned Surface Water Sites
Coordinates

2‐18
For a summary of exceedances ranges for state and recommended standard by parameter, depending
upon site type (surface water or stormwater outfall), within the Root River watershed see
INTRODUCTION, Table 1‐2.

3‐1
3. Results
3.1 Routine Surface Water Sampling Sites
PHYSICAL ASSESSMENTS
Land Use. The 18 study sites encompassed three primary land use types: urban (50%, nine sites),
agricultural (33%, six sites), and open/parkland (17%, three sites) (Figure 1‐1). All three land use types
were represented on the main stem and canals; there was no open/parkland sites on the tributary sites
sampled. Sampling sites by sub‐watershed, land use and tributary type are presented in Table 2‐1.
Unlike the overall character of the watershed, a greater proportion of primary monitoring stations in
this study were located in urban land use areas versus agricultural (50% versus 33%).
In addition to land use, site surveys were performed at each sampling site. Site surveys included
observational information on the physical location and surrounding area, stream bank conditions,
presence/integrity of infrastructure, pictures of the site/sampling point and any other notable findings.
Site surveys for each sampling location can be found in Appendix 1.
Habitat. At six sites, transects were inaccessible due to high water, which prevented in‐stream
measurements of depth, embeddedness, and substrate. These transects were: 200 m upstream at RRC‐
Main, 5 Mile Road, and Horlick Dam; 100 m upstream and downstream at RRC‐Fonk’s; and all transects
at Chartroom. At 5 Mile Road and Horlick Dam, two of the three transects could be collected. One
upstream transect (at 100 m) at Horlick Dam was also moved to 200 m downstream due to
inaccessibility. While all three transects could be evaluated at the REC, only two out of four channel
positions were accessed at 200 m upstream and 100 m downstream due to high water depths in the
middle and at the south/east bank. No transects could be evaluated at the Chartroom sampling site.
At RRC‐Fonk’s and RRC‐Main, the width to depth ratio and fine sediments were evaluated with data
gathered from only one and two transects, respectively, due to accessibility issues.
Stream habitat assessment metrics varied by stream width; <10 or ≥10 m (see Methods, page 2‐5). Half
of the sites (9/18) had stream widths <10 m and the remaining sites had stream widths ≥10 m. All sites
with a stream width of <10m were located on tributaries or canals. Habitat was rated primarily as
“Good” (8/9) with one site (1/9), Legend Creek, being rated as “Excellent”. All sites ≥10 m in width were
located on the main stem of the Root River, within the Lower Root River sub‐watershed. Habitat along
the main stem of the Root River was poorer than tributaries and canal sites. Six (6/9) ≥10 m sites were
rated as “Fair” and three sites (3/9) were rated as “Good”. No sites had an overall habitat assessment
rating of “Poor”. Two of the three ≥10 m sites with a “Good” rating were located in open/parkland (WI
DNR Steelhead in Lincoln Park and Johnson Park). All overall habitat scores, separated by individual
category scores, are depicted in Table 3‐1.
ENVIRONMENTAL ASSESSMENTS

3‐2
Volumetric Flow Rate. Volumetric flow rates were retrieved from the gauging station closet to each
sampling location on each day that sample collection occurred (Table 3‐2). The three surface sites
located closest to gauging stations were used as reference sites. Significant differences in seasonal
volumetric flow were observed at the reference sites. At Legend Creek (Franklin gauging station), spring
and fall flow rates were significantly higher than summer (p<0.05) [winter data was not collected at the
Franklin gauging station]. At RRC‐Main and Horlick Dam, winter and spring flow rates were significantly
higher than those in summer and fall (p<0.05). Volumetric flow rates correlated with antecedent
precipitation (24, 48 or 72 hr) at all sampling sites located on the main stem of the Root River and
tributaries, with the exception of Hwy 31 and 4 Mile Road (p<0.05). There was no correlation between
volumetric flow rate and antecedent precipitation at any of the canal sampling sites, with the exception
of RRC‐Main (p>0.05). A positive correlation between volumetric flow and E. coli concentrations was
noted at seven of the 18 sampling sites, with bacteria density increasing with increasing flow. The
opposite was true at three sites: RRC‐Union Grove, RRC‐Fonks, and Liberty Street Bridge (p<0.05).
Precipitation. Mean seasonal precipitation in the 24 hours prior to sample collection (average of all
sites) did not differ between season: winter (χ=6.4 cm), spring (χ=6.4 cm), fall (χ=3.2 cm), and summer
(χ=2.7 cm) (p>0.05). Summary data is presented in Table 3‐2. Elevated E. coli concentrations were
positively correlated with 24‐, 48‐ and 72‐hour antecedent precipitation at 16 out of the 18 sampling
sites (p<0.05).
Temperature. Water temperature summary data, by site, is listed in Table 3‐3. Water temperature
varied seasonally and the highest temperatures, as expected, were recorded in summer months
(p<0.05) (Table 3‐4). Water temperature was correlated with air temperature at all locations and varied
with habitat conditions and land use (p<0.05). Sites with greater habitat scores for width/depth ratios
had higher median water temperatures (p<0.05). Urban sites also had higher median water
temperatures than agricultural or open/parkland sites (p<0.05). Sites listed as LAL, LFF and limited
recreational use did not record the highest annual water temperature values, those were observed in
the most highly urbanized, downstream sampling sites.
The appropriate acute warm‐small state standard water temperature criteria (FAL, LFF and LAL
classifications) was only exceeded at four of the 18 sampling site and only once per site (RRC‐Main,
Horlick Dam, REC and Chartroom). The appropriate sub‐lethal criteria were exceeded more frequently
(15/16 sites, two sites not monitored) (Table 3‐5). Greater than ten percent of samples (10 – 27%)
collected from sites on the lower Root River, from Johnsons Park to the mouth (lower Root River sub‐
watershed), exceeded sub‐lethal standards, with the exception of Hwy 31 and 4 Mile Road (3%).
Upstream sites exceeded appropriate sub‐lethal standards at a frequency of less than 6%. The
recommended acute standards were never exceeded for LAL sites. RRC‐Union Grove, one of the two LAL
sites, exceeded recommended sub‐lethal standards frequently (23%) (Table 3‐5).
Turbidity (Water Clarity). Summary data for turbidity, including median values is listed in Table 3‐6.
Higher turbidity was associated with antecedent precipitation (24‐, 48‐ or 72‐hr) at all sites with the
exception of Raymond Creek. Turbidity values at half of the sites (9/18) were also associated with

3‐3
volumetric flow, the greater the flow the higher the turbidity (p<0.05). However, at three locations,
turbidity was negatively correlated with flow rates (Legend Creek, Raymond Creek, and Husher Creek)
(p<0.05) (Table 3 – 6). Six sites had turbidity levels above recommended standards (25 NTU) in greater
than 15 percent of single samples collected: Husher Creek, Raymond Creek, RRC‐Main, Horlick Dam,
RRC‐Fonks, and Hoods Creek (Table 3 ‐ 6).
Turbidity levels varied seasonally with most canal (Raymond Creek, RRC‐Fonk’s, RRC‐East, RRC‐Main)
and tributary sites (Legend and Husher Creek) displaying higher turbidity values in the summer (p<0.05)
(Table 3 ‐7). Alternatively, sites on the main stem of the river (with the exception of Johnson Park and
Chartroom) had higher turbidity values during the winter (p<0.05).
Turbidity varied within sub‐watersheds. Raymond Creek had higher turbidity than other sites on the
west branch of the canal (p<0.05). RRC‐Fonk’s had higher turbidity values than RRC‐East (downstream,
east branch) (p<0.05). Horlick Dam had higher turbidity values than all other sites within the Lower Root
River sub‐watershed, with the exception of Husher Creek (p<0.05). Husher Creek had higher turbidity
than all other sites below Johnson Park with the exceptions of Horlick Dam and REC (p<0.05). NOTE:
winter sample data was removed from the dataset prior to statistical analysis due to the inability to
collect consistent data across all sampling sites.
Between sub‐watersheds, RRC‐Main was more turbid than both upstream canal branches (east and west
branches) (p<0.05). The main canal was also more turbid than the closest downstream site within the
Lower Root River sub‐watershed, 38 at MKE Co Line (p<0.05). Hoods Creek also had higher turbidity
values than the next closest downstream site on the Lower Root River sub‐watershed (p<0.05).
However, there were no significant correlations between habitat conditions, land use, and turbidity
(p>0.05).
CHEMICAL ASSESSMENTS
Specific Conductivity. Median specific conductivity levels, by site, are listed in Table 3 ‐ 8. Sixteen out of
18 sites had at least one sample above the recommended standard of 1,500 µS/cm (Table 3 ‐8). Four
sites (RRC‐Union Grove, Raymond Creek, RRC‐West and RRC‐Main) exceeded the recommended
standard for greater than 25 percent of samples collected.
Specific conductivity varied by season at twelve out of the 18 sampling sites (Table 3 ‐ 9). The season
with the highest specific conductivity values varied by location but most saw elevations during the
winter (6 sites), followed by the fall (5 sites) and spring (1 site). Specific conductivity was negatively
associated with antecedent precipitation (24, 48 or 72 hr) at 11 sites and negatively correlated with
volumetric flow at eight sites (p<0.05). One site, Chartroom, had a positive relationship between
specific conductivity and volumetric flow (p<0.05).
Specific conductivity varied within sub‐watersheds On the west branch of the Root River Canal, RRC‐
Union Grove had higher conductivity values than both other sites (p<0.05). On the east branch of the
canal, RRC‐Fonk’s had higher values than RRC‐East (p<0.05). Within the Lower Root River sub‐

3‐4
watershed, Husher Creek had higher conductivity than multiple downstream sites on main stem of the
lower Root River (from Horlick Dam to Chartroom) (p<0.05). The Chartroom site had lower conductivity
levels than all other sites within the Lower Root River sub‐watershed (p<0.05). NOTE: winter sample
data was removed from the dataset prior to statistical analysis due to the inability to collect consistent
data across all sampling sites.
Specific conductivity also varied between sub‐watersheds. RRC‐East had lower specific conductivity
levels than RRC‐Main (p<0.05). RRC‐Main and RRC‐West did not differ (p>0.05). RRC‐Main had higher
conductivity levels than the next closest downstream site within the Lower Root River sub‐watershed
(38 at MKE Co Line, p<0.05). Hoods Creek also had higher conductivity values than the next closest
downstream site (Johnson Park, p<0.05).
pH. Median pH values at each site are listed in Table 3 ‐ 10. The recommended pH range (6.0‐9.0 s.u.)
was exceeded at least once at three sites: RRC‐West, RRC‐Main and REC (Table 3 ‐ 10). All exceedances
had pH values greater than 9.0 and occurred during summer months. Factors which correlated with
deviations in pH included precipitation, volumetric flow and air temperature (p<0.05).
Winter pH values were lower than other seasons at all locations (p<0.05) (Table 3 ‐ 11). Median
seasonal pH values were significantly higher in urban compared to agricultural land use areas (p<0.05).
NOTE: Winter sample data was removed from the dataset prior to statistical analysis due to the inability
to collect consistent data across all sampling sites e.g. there was no winter data for the Chartroom
sampling site.
pH values varied within sub‐watersheds. On the west branch of the Root River Canal, RRC‐Union Grove
had a lower median pH than Raymond Creek and RRC‐West (p<0.05). On the east canal branch of the
canal, RRC –Fonk’s had a lower pH than the next closest downstream site, RRC‐East (p<0.05). Within the
Lower Root River sub‐watershed, Husher Creek, 38 at MKE Co Line, 5 Mile Road, 31 and 4 Mile, and
Chartroom had lower pH than the downstream sampling sites (p<0.05). NOTE: winter sample data was
removed from the dataset prior to statistical analysis due to the inability to collect consistent data
across all sampling sites.
pH values also differed between sub‐watersheds. Within the canal system, RRC‐East had a lower pH
than RRC‐Main (p<0.05). RRC‐West and RRC‐Main did not differ (p>0.05). RRC‐Main had significantly
higher pH than the next closest downstream sampling location within the Lower Root River Watershed
(38 at MKE Co. Line, p<0.05). Hoods Creek had a significantly lower pH than the nearest downstream
location within the Lower Root River sub‐watershed (Johnson Park, p<0.05).
Phosphorous. Median total phosphorus concentrations at each site are listed in Table 3 ‐ 12. The
Wisconsin surface water total phosphorus standard at FAL‐ and LAL‐designated stream reaches requires
concentrations to be 0.075 mg/L or less. LAL‐classified river stretches are not regulated; however they
are recommended to meet FAL standards. In the Root River, all FAL‐ and LFF‐designated sites exceeded
total phosphorus standards and both LAL‐designated sites exceeded recommended standards for a

3‐5
minimum of six samples (Table 3 ‐ 12). The percentage of samples which exceeded standards ranged
from 46 (Legend Creek) to 92 % (RRC‐West). Sites immediately downstream from wastewater
treatment facilities almost unilaterally exceeded recommended standards: RRC‐Union Grove (13/13),
RRC‐Fonk’s (13/13) and Hoods Creek (11/12). Poor correlation was seen between precipitation, specific
conductivity and total phosphorus. However, there were correlations between total phosphorous,
volumetric flow rates (negative correlation, 7/18 sites) and turbidity (positive correlation, 6/18 sites).
Total phosphorus concentrations did not exhibit significant seasonal variation at 16 out of the 18
sampling sites (Table 3 ‐13). At the two sites that displayed significant seasonal variability, Legend Creek
and RRC‐Union Grove, phosphorus concentrations were higher in the summer (p<0.05). The months
with the lowest number of sites exceeding phosphorous standards were January and December (5/18
sites each).
Phosphorus concentrations did not differ within or between sub‐watersheds (p>0.05) nor did median
phosphorus values vary based upon land use, riparian buffer width, degree of stream bank erosion or
channel condition (p>0.05). However, total phosphorous was negatively correlated with the habitat
rating for fine sediments, i.e. median phosphorous concentrations were higher at sites with more fine
sediments imbedded in the streambed.
Dissolved Oxygen. Median dissolved oxygen (DO) concentrations, by site, are listed in Table 3‐14. Nine
sites had DO concentrations (mg/L) below the state standard for 5% or more of samples, and as high as
39%. DO, percentage saturation, exceeded 140 percent (recommended standard) at eight sites: RRC‐
Main (n=17/121), RRC‐West (n=9/120), Johnson Park (n=4/119), REC (n=3/107), Liberty St. Bridge
(n=1/121), Steelhead Facility (n=1/118), 38 at MKE Co. Line (n=1/106), and RRC‐UG (n=1/123).
State standards for DO vary based upon use classification: a minimum of 5.0 mg/L for FAL sites, 3.0 mg/L
for LFF sites, and 1.0 mg/L for LAL sites (Table 3 ‐ 14). Thirteen out of 14 sites classified as FAL had at
least one sample below the 5.0 mg/L. Horlick Dam, the only fully‐complying FAL site, had a minimum
DO concentration of 6.6 mg/L. Both LFF sites, RRC‐East and Hoods Creek, had DO concentrations at or
below the 3.0 mg/L standard at least once. The two LAL sites, RRC‐Union Grove and RRC‐Fonk’s,
consistently had DO concentrations which met state standards based on their classification (above 1.0
mg/L ). When applying FAL standards to LFF‐ and LAL‐designated river sections, RRC‐East, RRC‐Fonk’s,
Hoods Creek, and RRC‐Union Grove would have failed to meet recommended standards for 33.1, 28.0,
7.8, and 0.0 percent of samples, respectively.
DO concentrations were not correlated with antecedent precipitation (24, 48 or 72‐hour). DO was
positively correlated with volumetric flow rate; all sites with the exception of RRC‐West (p<0.05). DO
concentrations were negatively correlated with water temperature (17/18 sites, p<0.05) and total
phosphorus (11/18 sites, p<0.05).
All assessed surface water sites had significantly higher DO concentrations in the winter compared to
the spring (except for Raymond Creek) and summer (p<0.05) (Table 3 ‐ 15). Median dissolved oxygen

3‐6
(concentration and percentage saturation) was higher at urban and open sites compared to agricultural
areas (p<0.05), spring, summer and fall combined data (NOTE: Winter data was excluded due to
inconsistency in sample collection).
DO concentrations differed within sub‐watersheds. Due to limited data points and/or seasonal
differences, winter samples were removed prior to statistical analysis. On the west branch of the Root
River Canal, Raymond Creek had a lower median DO concentration than RRC‐West (p<0.05). Within the
Lower Root River sub‐watershed, DO concentrations from Johnson Park to the mouth (with the
exception of Chartroom) were equal to (5 Mile Road, 31 and 4 Mile) or higher than the upstream sites
(p<0.05).
Median dissolved oxygen concentrations also differed between sub‐watersheds. RRC‐East had a lower
DO concentration than RRC‐Main (p>0.05). RRC‐Main had a significantly higher DO concentration than
the next closest downstream site, 38 at MKE Co Line (p<0.05). Hoods Creek also had significantly lower
DO concentrations than Johnson Park, the next closest downstream sampling location within the Lower
Root River sub‐watershed (p<0.05). No other differences between sub‐watersheds were found
(p>0.05). Median dissolved oxygen (percentage saturation and concentration) values did not vary based
upon habitat conditions (riparian buffer width, bank stability, degree of stream bank erosion, canopy
cover, or channel condition) (p>0.05).
MICROBIOLOGICAL ASSESSMENTS
E. coli. E. coli, rather than fecal coliforms, was used as the microbial indicator of choice for this study
due to the direct connection between the Root River Watershed and the coastal recreational waters of
Lake Michigan. Summary data collected at each sampling site is listed in Table 3 ‐ 16. The percentage of
samples which exceeded the State of WI recreational standard of 235 MPN/100 mL at the 14 FAL sites
ranged from 12.9 (Horlick Dam) to 72.0 (Husher Creek). At LFF and LAL sites, exceedances ranged from
21.5 (RRC‐East) to 98.4 (RRC‐Union Grove) percent of samples. E. coli concentrations were positively
correlated with precipitation (16/18 sites) (24, 48 or 72 hr totals) and turbidity (13/18 sites) (p<0.05). At
seven locations there were also a positive correlation between volumetric flow rates and E. coli
concentrations (p<0.05). Water temperature and E. coli were positively correlated at nine locations
(p<0.05).
E. coli concentrations varied seasonally (14/18 sites, p<0.05) (Table 3 ‐ 17). Higher E. coli concentrations
were seen in winter (9 sites), summer (3 sites) or fall (1 site) depending upon the location (p<0.05). All
14 FAL sites had exceedances of the State of WI geometric mean standard for recreational surface
waters in at least two calendar months of the study period (Table 3 – 18). Chartroom had the lowest
exceedance rate (10%) and the Husher and Raymond Creek sites had the highest (93%). The greatest
frequency of exceedance during a single calendar month occurred during August 2011 (16/18 sites).
Standards were exceeded during at least two months at all LAL and LFF sites and in each month of the
study at RRC‐Union Grove and RRC‐Fonk’s, the two LAL sites.

3‐7
E. coli concentrations also differed within sub‐watersheds. On the west canal branch, RRC‐Union Grove
and Raymond Creek had higher E. coli concentrations than RRC‐West (p<0.05. On the east canal, RRC‐
Fonk’s had significantly higher concentrations than the next closest downstream site, RRC‐East (p>0.05).
In the Lower Root River sub‐watershed, Husher Creek and Liberty St. Bridge had higher concentrations
than all other locations (p<0.05), while Horlick Dam and Chartroom had lower E. coli concentrations
than other sites ((p<0.05). Between sub‐watersheds, Hoods Creek had a significantly higher E. coli
concentration than the next closest downstream site within the Lower Root River sub‐watershed,
Johnson Park (p<0.05). No other inter sub‐watershed differences were noted (p>0.05). NOTE: due to
the limited number of data points, winter samples were removed for site comparisons.
Human‐specific Bacteroides Marker. Additional dry weather (no precipitation within the 24 hour period
prior to sample collection) split samples were collected on November 5th and December 3rd, 2012 from
the six surface water sampling sites with the highest median E. coli concentrations (exclusive of RRC‐
Union Grove and RRC‐Fonk’s). Results are displayed in Table 3 ‐ 19. Husher Creek was the only site that
exceeded the 5,000 CN/100 mL human‐specific Bacteroides marker threshold during both sampling
events. No sites exceeded recommended ratios of human‐specific Bacteroides to total Bacteroides.
BIOTIC ASSESSMENTS
Macro‐invertebrates. Macro‐invertebrates were assessed at 15 out of the 18 sampling sites. Macro‐
invertebrate assessment scores at 9/15 sites were rated as “Poor” (n=3) or “Fairly Poor” (n=6) (Table 3 ‐
20). Five sites were rated as “Fair”, one was rated as “Good” and none were listed as “Very Poor.”
Macro‐invertebrate assessment scores were positively correlated with median total phosphorus
concentrations at each site (p=0.0517). Additionally, the percentage of samples at each site below
recommended dissolved oxygen levels (<5.0 mg/l) (p=0.0556) and outside recommended pH values
(p<0.05) positively correlated with higher (poorer) macro‐invertebrate assessment scores. Macro‐
invertebrate scores were negatively correlated with fine sediment (p=0.0736) and rocky substrate
(p=0.0833) habitat ratings, but did not vary based upon land use (p>0.05). In comparison to past
assessments (1979‐2000), three sites showed improvement, eight sites had approximately the same
score and three sites declined.
Fish Assessments. Fish community assessments were performed at nine out of the 18 sampling sites.
Fish assessment scores were rated as “Very Poor” (n = 1), “Poor” (n = 3), “Fair” (n = 4) and “Good” (n =
1) (Table 3 ‐ 20). Unlike the macro‐invertebrate HBI assessment scale where higher numbers equate to
poorer community assessments, low IBI scores correspond to poorer conditions. IBI scores were
negatively correlated with median total phosphorus concentrations (p=<0.10) and macro‐invertebrate
assessment scores (p=0.0860). Interestingly, IBI scores were positively correlated with the percentage
of samples that exceeded sub‐lethal temperature standards (p<0.05). Fish assessment scores did not
vary based upon habitat conditions (width/depth ratio, Thalweg depth, fine sediment, rocky substrate,
fish cover or total habitat score) (p>0.10) or land use (p>0.05). In comparison to historic assessments
(1979‐2003), one site showed improvement (Hwy 38/Milwaukee County Line), one stayed the same
(Steelhead Facility/Lincoln Park) and one site declined in quality (Hwy 31/4 Mile).

3‐8
3.2 Additional Canal Sites
Thirteen additional dry weather samples (no precipitation in the 72 hour period prior to sample
collection) were taken on the west branch and seven additional samples on the east branch of the Root
River Canal on June 13th and June 27th, 2012. Results are displayed in Tables 3 – 21 and 3 ‐ 22. One
additional sample, West Puetz Road (upstream of the canal as a point of reference) was collected on for
both sampling events. WWTP effluent discharge rate was noted on the day of sample collection. Biotic
assessments were not performed on any of the additional samples.
ENVIRONMENTAL ASSESSMENTS
Samples were collected under base flow conditions, in the absence of precipitation. Water temperature
was within recommended ranges for all samples (Tables 3 – 21 and 3 – 22). Turbidity exceeded 25 NTU
once per sampling event, at different locations on the west branch (6/13/12 = 50th Road tributary,
6/27/12 = Yorkville Creek at Hwy 20). Turbidity exceeded 25 NTU once on the east branch, just upstream
of Fonk’s effluent discharge point (6‐27‐12) (Tables 3 – 21 and 3 – 22).
CHEMICAL ASSESSMENTS
Specific conductivity exceeded recommended standards at 50% of the assessed locations on the west
branch; same sites both events (Table 3 – 21). Specific conductivity only exceeded 1500 µS/cm once, on
June 13th, where Fonk’s wastewater treatment facility discharges to the east branch canal (Table 3 – 22).
pH was within recommended ranges for all samples (Tables 3 – 21 and 3 – 22). Phosphorous was not
assessed. DO levels were below the recommended standard of 5.0 mg/L four times over the two
sampling events on the west branch, once each at: West Puetz Road, Hwy 38/Milwaukee County Line,
Yorkville Creek/Hwy 20 and RRC‐West (Table 3 – 21). DO levels were less than 5.0 mg/L five times on the
east branch, all occurring on June 13th (Table 3 – 22).
Correlations were observed between wastewater effluent and downstream surface water parameters at
RRC‐Union Grove, RRC‐Fonk’s, and Hoods Creek (the sampling sites in closest proximity to the WWTPs).
Surface and effluent pH values were positively correlated only at RRC‐Fonk’s (p<0.05). At all three
surface water sites, effluent discharge rates were positively correlated with DO concentrations (p<0.05).
MICROBIOLOGICAL ASSESSMENTS
On the west and east branches, E. coli concentrations peaked at or just upstream of the respective
wastewater effluent discharge points. At the first site downstream of RRC‐Union Grove (west branch),
E. coli concentrations dropped to near the state standard on both sampling dates. On the east branch,
E. coli concentrations declined to within/near state standards slightly downstream of the discharge point
on June 13th but remained elevated until RRC‐East on June 27th (Tables 3 – 21 and 3 ‐22).
Human‐specific Bacteroides results for the areas surrounding RRC‐Union Grove (west canal branch) and
RRC‐Fonk’s (east canal branch) are displayed in Table 26. Upstream of the west branch wastewater
treatment plant effluent point, the concentration and ratio of human specific to total Bacteroides

3‐9
thresholds were exceeded for 33 percent of samples. Conversely, at the effluent point and
downstream, the copy number thresholds were exceeded 100 percent of the time and ratio thresholds
were exceeded for 80 percent or more of samples analyzed for Bacteroides. On the east canal branch,
all sites exceeded the copy number and ratio thresholds for at least 75 percent of samples inclusive of
sampling locations upstream of the effluent discharge location.
3.3 Stormwater Outfalls
The physical (temperature, turbidity), chemical (specific conductivity, pH, detergent, total residual
chlorine and phosphorous) and microbiological (E. coli, human‐specific and total Bacteroides markers)
quality of stormwater discharge was assessed at thirteen stormwater outfall locations once weekly
throughout the study period. Results of these analyses can be seen in Table 3 – 22. Data is presented
from upstream to downstream.
Two of the three outfalls discharging near Horlick Dam had multiple infarctions (Table 3 – 23). Horlick
Dam‐Northwest Outfall had multiple samples exceed recommended standards for water temperature,
pH, conductivity, and detergents. pH, specific conductivity, and detergent concentrations in effluent
from this outfall were negatively correlated with precipitation (p<0.05). Horlick Dam‐East Outfall had
several samples with elevated turbidity, conductivity, detergent, and chlorine concentrations.
Over 50 percent of samples collected from the Luedtke/Dominic outfall had human‐specific Bacteroides
marker levels above recommended thresholds. Total residual chlorine was detected at least once.
Ten percent of samples at the Luedtke/Spring Street outfall had E. coli concentrations in excess of
10,000 MPN/100ml. Samples from this outfall also frequently exceeded recommended standards for
turbidity, conductivity, and detergents. There was also a positive correlation with E. coli concentrations
and a negative correlation with specific conductivity and precipitation (p<0.05).
The Lutheran High School and Luedtke/Rupert outfalls also had ten percent or more of samples with E.
coli concentrations in excess of 10,000 MPN/100ml All human‐specific Bacteroides tests results at
Luedtke/Rupert were below the limit of detection and most samples from Lutheran High School did not
exceed recommended standards. Specific conductivity exceeded standards in more than 50 percent of
samples at both locations.
There were two stormwater outfalls adjacent to the Liberty Street Bridge, Upstream‐Liberty Street
Outfall and Liberty Street Outfall. Over 50 percent of samples exceeded recommended standards for
specific conductivity and detergents at Upstream‐Liberty St. Outfall. E. coli exceeded 10,000
MPN/100ml in more than ten percent of samples at Liberty Street Outfall. The copy number (CN) to
sewage ratio for the human‐specific Bacteroides marker, turbidity (>25% of samples), detergents (>50%
samples), and total phosphorus concentrations were also frequently exceeded. At Liberty Street Outfall,
E. coli and detergents were negatively correlated with precipitation (p<0.05).
Three stormwater outfalls are located in Washington Park. Washington Park 3 frequently met water
quality standards. Samples from Washington Park 1 had E. coli concentrations in excess of 10,000

3‐10
MPN/100ml in greater than ten percent of samples collected. At least 50 percent of samples for human‐
specific Bacteroides marker exceeded threshold CN levels as well as the recommended ratio between
human‐specific and total Bacteroides at Washington Park 1 and Washington Park 2. More than 50
percent of samples at Washington Park 2 also had detectable chlorine levels. Precipitation was
positively correlated with E. coli concentrations at Washington Park 1 and 2, and negatively correlated
with chlorine levels at Washington Park 2 (p<0.05).
E. coli concentrations exceeded 10,000 MPN/100ml in more than 10 percent of samples collected from
the Water Street outfall. More than 50 percent of samples for human‐specific Bacteroides marker
exceeded threshold CN levels as well as the recommended ratio between human‐specific and total
Bacteroides. Turbidity and total residual chlorine exceeded their respective thresholds in over 25
percent of samples collected. E. coli and turbidity were positively correlated with precipitation (p<0.05).
3.4 Decision Trees
Decision trees were developed based on the physical (degree of stream bank erosion, adequacy of
buffer strips, amount of impervious cover and presence of infrastructure), environmental (antecedent
precipitation) and microbiological (E. coli and Bacteroides) properties of the sampling sites. While not as
comprehensive an examination of the full data set, a decision tree approach is one of many tools that
can be made available to local orders of government in order to prioritize areas for restoration. For the
purpose of this study, the triggering parameter(s) was E. coli response to antecedent precipitation in the
24 and 48‐hour periods prior to sample collection, or in the absence of rainfall the presence of elevated
E. coli levels in dry weather flow (in the case of stormwater infrastructure).
Decision trees for some of the current sampling sites were first developed in 2008 (Abbott, 2008).
Further testing, as previously recommended, led to the identification of an illicit connection to the
stormwater outfall discharging immediately downstream of the Liberty Street Bridge surface water
sampling site (Liberty Street Bridge outfall). The negative E. coli response to antecedent precipitation
events, presence of concentrations in excess of 10,000 MPN/100 mL and Bacteroides criteria
exceedance all pointed to a sanitary source. This source was confirmed by visualization and dye testing.
The full set of decision trees can be found in Appendix 2.

3‐11
Table 3‐1, Stream habitat assessment qualitative rating.
Width:
Depth
Ratio
Maximum
Thalweg
Depth
Riparian
Buffer
Width
Bank
Stability
Bank
Erosion
Canopy
Cover
Channel
Condition
Fine
Sediments
Rocky
Substrate Fish Cover
15 22 15 12 15 10 15/12 15 22 15/22 100
1 Legend Creek <10 10.0 11.7 6.7 7.7 15.0 13.3 15.0 79.4
2 RRC‐Union Grove <10 11.7 10.0 5.0 9.0 5.0 10.0 10.0 60.7
3 Raymond Creek <10 5.0 15.0 5.0 9.0 15.0 11.7 11.7 72.4
4 RRC‐West <10 8.3 15.0 10.0 2.3 5.0 5.0 13.3 58.9
5 RRC‐Fonk's* <10 5.0 10.0 10.0 10.0 5.0 5.0 15.0 60.0
6 RRC‐East <10 11.7 10.0 6.7 0.0 5.0 6.7 15.0 55.1
7 RRC‐Main* <10 7.5 12.5 10.0 1.5 5.0 7.5 15.0 59.0
8 Husher Creek <10 10.0 11.7 11.7 5.7 10.0 10.0 10.0 69.1
11 Hoods Creek <10 8.3 11.7 0.0 7.7 15.0 8.3 15.0 66.0
9 38 at MKE Co Line ≥10 7.0 0.0 2.0 8.0 7.0 22.0 46.0
10 5 Mile Road* ≥10 14.0 0.0 2.0 8.0 14.0 0.0 38.0
12 Johnson Park ≥10 7.0 8.0 2.3 12.0 22.0 22.0 73.3
13 31 and 4 Mile ≥10 7.0 0.0 3.3 8.0 0.0 22.0 40.3
14 Horlick Dam* ≥10 0.0 8.0 2.3 8.0 22.0 22.0 62.3
15 Steelhead Facility ≥10 7.0 4.0 3.3 8.0 22.0 22.0 66.3
16 Liberty St. Bridge ≥10 7.0 4.0 4.3 8.0 7.0 14.0 44.3
17 REC* ≥10 7.0 8.0 0.0 4.0 14.0 7.0 40.0
18 Chartroom* ≥10 22.0 12.0 0.0 0.0 CND 0.0 34.0
Stream Habitat Assessment Qualitative Rating by Site in the Root River WatershedRacine Health Department, 11.18.11 ‐ 12.5.11
Site Code Site
(Upstream to
Downstream, by
Stream Width)
Stream
Width (m)
Habitat Assessment CategoryTotal
Habitat
Score and
Rating
Maximum Category Values
Habitat Assessment Category Designations:
Green text: Stream widths less than 10 m (<10 m); Blue text: Stream widths greater than or equal to 10 m (≥10 m); Black text: Applies to both stream widths
* = not all transects/channel positions could be accessed for in‐stream measurements due to safety reasons at this site. CND = Could Not Determine Due to Depth
Rating Color Code: Excellent Good Fair Poor No score
Source: Modified versions of WI DNR Wadable Stream Qualitative Fish Habitat Rating for Streams <10 m (Form 3600‐532A) and ≥10 m (Form 3600‐532B)
Use Classification Color Code and Relevant Standard:
Use Classification and Color Code Modifed DNR wadable streams qualitative fish habitat rating criteria for < 10 and ≥10 m stream
widths were used to determine reported habitat assessment ratings. Riffle:Riffle/Bend:Bend
Ratios (<10 and ≥10 m assessments) and Pool Area (<10 m assessment) categories were not
calculated and Canopy Cover and Channel Condition categories were added for both widths.
Fish and Aquatic Life (FAL), Full Recreational Use
Limited Forage Fish (LFF), Limited Recreational Use
Limited Aquatic Life (LAL), Limited Recreational Use

3‐12
Table 3 – 2, Precipitation and volumetric flow rate data by sampling site.
# of
Eventsχ
# of
Events
with
Precip.
Total
Precip. χ
# of
Events
with
Precip.
Total
Precip. χ
# of
Events
with
Precip.
Total
Precip.
# of
Eventsχ Med.
# of
EventsMed. Range
1 Legend Creek 121 0.24 34 28.9 0.49 51 60.0 0.65 67 78.9 121 12.8 13.7 101 0.23 0.02 ‐ 9.5
2 RRC‐Union Grove 123 0.22 34 27.5 0.44 53 54.7 0.57 71 69.7 121 11.7 10.9 106 0.05 0.02 ‐16.3
3 Raymond Creek 115 0.23 30 26.6 0.47 48 53.7 0.60 66 69.2 115 15.1 16.4 106 0.06 0.02 ‐ 17.4
4 RRC‐West 121 0.22 32 26.9 0.45 51 54.4 0.58 69 70.2 121 14.4 15.1 106 0.06 0.02 ‐ 17.5
5 RRC‐Fonk's 118 0.21 30 24.7 0.44 50 51.3 0.56 68 66.4 116 12.3 11.4 104 0.05 0.02 ‐ 16.5
6 RRC‐East 121 0.22 32 26.9 0.45 51 54.4 0.58 69 70.2 121 14.3 14.7 106 0.05 0.02 ‐ 17.5
7 RRC‐Main 121 0.28 36 34.0 0.53 54 64.1 0.70 70 84.5 121 13.4 13.9 106 0.06 0.02 ‐ 17.5
8 Husher Creek 118 0.25 34 28.9 0.49 49 57.4 0.66 65 77.3 118 13.2 13.5 101 0.24 0.02 ‐ 8.4
9 38 at MKE Co Line 106 0.22 27 23.3 0.47 42 49.8 0.63 57 67.2 106 14.6 16.1 101 0.24 0.02 ‐ 8.6
10 5 Mile Road 113 0.14 31 16.4 0.34 53 38.5 0.46 62 52.0 113 12.8 13.0 113 0.62 0.01 ‐ 50.4
11 Hoods Creek 116 0.15 32 17.4 0.35 55 40.5 0.47 64 54.2 116 12.3 13.1 116 0.69 0.02 ‐ 50.4
12 Johnson Park 119 0.16 33 18.6 0.32 55 38.5 0.47 65 56.4 119 13.7 14.8 119 0.74 0.02 ‐ 49.6
13 31 and 4 Mile 105 0.13 28 13.3 0.32 50 34.1 0.44 58 46.3 105 13.4 14.2 105 0.54 0.02 ‐ 51.3
14 Horlick Dam 124 0.15 34 19.0 0.30 56 37.9 0.47 69 58.5 123 14.1 14.3 123 0.76 0.02 ‐ 49.6
15 Steelhead Facility 118 0.12 32 14.7 0.30 47 34.9 0.47 66 55.6 118 14.1 14.2 118 0.68 0.02 ‐ 49.6
16 Liberty St. Bridge 121 0.14 36 16.5 0.31 51 37.4 0.48 69 58.1 121 14.1 14.0 121 0.76 0.02 ‐ 49.8
17 REC 107 0.14 30 14.8 0.31 43 33.0 0.50 60 53.1 107 15.5 15.9 107 0.54 0.02 ‐ 49.0
18 Chartroom 101 0.10 27 10.4 0.26 38 26.3 0.44 55 44.7 101 16.1 16.5 101 0.51 0.02 ‐ 18.6
Limited Forage Fish (LFF)
Limited Aquatic Life (LAL)
χ = mean; # of Events with Precip. = Number of sampling days with precipitation > 0.01 cm; Med. = Median; Use Classification and Color Code:
Fish and Aquatic Life (FAL)
72‐hr
Volumetric Flow Rate
(m3/sec)
Air Temperature (°C)
Precipitation (cm)
Precipitation, Air Temperature, and Volumetric Flow Rate Summary Data
by Site in the Root River Watershed
8.3.11 ‐ 3.20.13
Site Code
Site (Upstream to
Downstream)
24‐hr 48‐hr

3‐13
Table 3 ‐ 3, Range and median water temperature data by sampling site.
1 Legend Creek 121 11.7 ‐0.1 ‐ 25.8
2 RRC‐Union Grove 123 14.5 1.4 ‐ 23.1
3 Raymond Creek 115 11.7 0.0 ‐ 27.4
4 RRC‐West 120 11.2 0.0 ‐ 28.0
5 RRC‐Fonk's 118 11.2 0.0 ‐ 24.1
6 RRC‐East 121 11.2 0.0 ‐ 28.5
7 RRC‐Main 121 12.0 0.0 ‐ 29.1
8 Husher Creek 118 11.3 ‐0.3 ‐ 27.2
9 38 at MKE Co Line 106 14.3 0.0 ‐ 27.6
10 5 Mile Road 113 12.8 ‐0.1 ‐ 27.2
11 Hoods Creek 116 11.5 0.0 ‐ 25.9
12 Johnson Park 119 13.0 0.0 ‐ 27.0
13 31 and 4 Mile 105 14.6 0.0 ‐ 26.8
14 Horlick Dam 124 13.0 0.0 ‐ 30.3
15 Steelhead Facility 118 13.3 0.0 ‐ 26.6
16 Liberty St. Bridge 121 13.0 0.0 ‐ 27.9
17 REC 107 16.1 0.2 ‐ 29.9
18 Chartroom 101 16.9 1.7 ‐ 29.7
0.00
0.00
0.00
0.000.90
p
0.01
0.00
0.00
0.00
0.00
0.00
0.00
0.00
0.00
0.00
0.00
0.00
0.00
0.00
Air Temperature
r
0.96
0.87
0.96
0.96
0.95
0.95
0.96
0.96
0.95
0.96
0.96
0.94
0.97
0.93
0.94
0.91
0.93
r = correlation coefficient
Source: See Ambient Water Temperature and Water Quality Temperature Criteria for Warm‐Small Waters Table
Significant p values < 0.05
Limited Aquatic Life (LAL), Limited Recreational Use
Limited Forage Fish (LFF), Limited Recreational Use
Fish and Aquatic Life (FAL), Full Recreational Use
Use Classification and Color Code: Recommended Standard (Rec'd Std.)
Use Classification Color Code and Relevant State and Recommended Standard(s)
State Standard (Std.)
Water Temperature (°C) Summary Data by Site in the Root River Watershed
Site Code
Correlations
Site (Upstream to
Downstream)
Number
of
Samples
Median
Number of
Exceedances
Rec'd
Std.
State
Std.
Racine Health Department, 8.3.11 ‐ 3.20.13
See Water
Temperature
Exceedances by
Site in the Root
River Watershed
table.
See Ambient Water Temperature
and Water Quality Temperature
Criteria for Warm‐Small Waters
Not greater than 30 °C (86 °F).
Recommended standards for LFF and LAL
sites are FAL standards.
Not applicable
Range
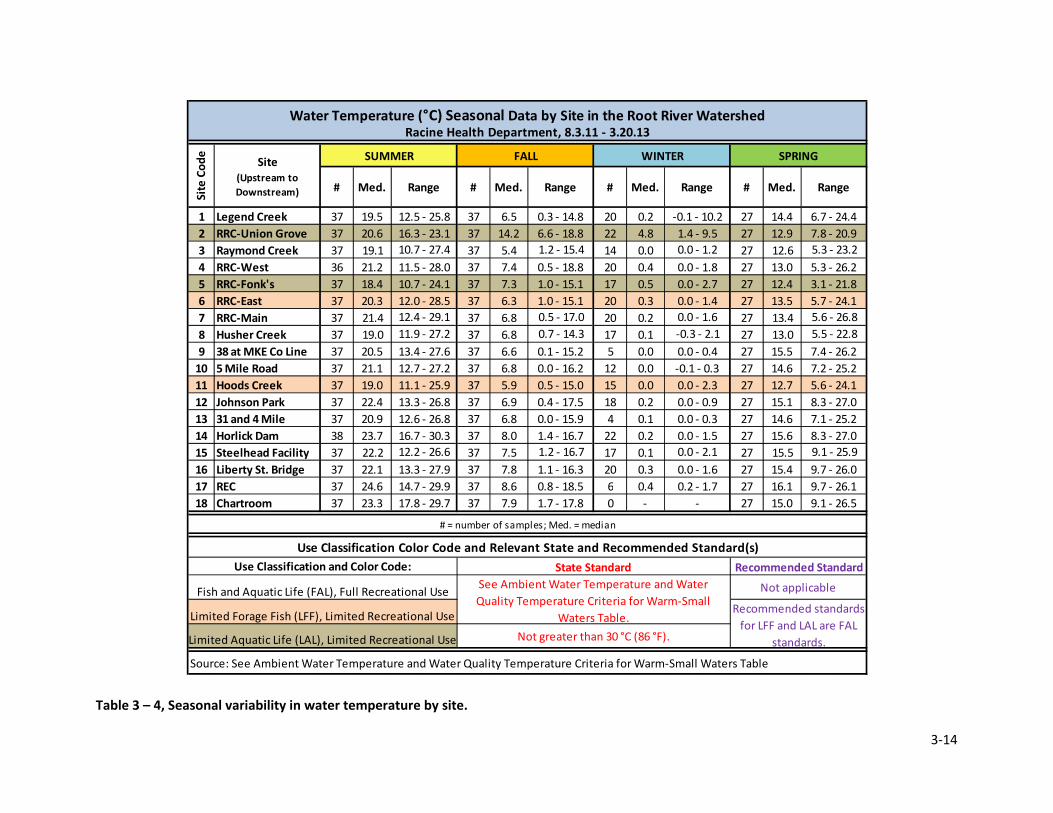
3‐14
Table 3 – 4, Seasonal variability in water temperature by site.
1 Legend Creek 37 19.5 37 6.5 20 0.2 27 14.4
2 RRC‐Union Grove 37 20.6 37 14.2 22 4.8 27 12.9
3 Raymond Creek 37 19.1 37 5.4 14 0.0 27 12.6
4 RRC‐West 36 21.2 37 7.4 20 0.4 27 13.0
5 RRC‐Fonk's 37 18.4 37 7.3 17 0.5 27 12.4
6 RRC‐East 37 20.3 37 6.3 20 0.3 27 13.5
7 RRC‐Main 37 21.4 37 6.8 20 0.2 27 13.4
8 Husher Creek 37 19.0 37 6.8 17 0.1 27 13.0
9 38 at MKE Co Line 37 20.5 37 6.6 5 0.0 27 15.5
10 5 Mile Road 37 21.1 37 6.8 12 0.0 27 14.6
11 Hoods Creek 37 19.0 37 5.9 15 0.0 27 12.7
12 Johnson Park 37 22.4 37 6.9 18 0.2 27 15.1
13 31 and 4 Mile 37 20.9 37 6.8 4 0.1 27 14.6
14 Horlick Dam 38 23.7 37 8.0 22 0.2 27 15.6
15 Steelhead Facility 37 22.2 37 7.5 17 0.1 27 15.5
16 Liberty St. Bridge 37 22.1 37 7.8 20 0.3 27 15.4
17 REC 37 24.6 37 8.6 6 0.4 27 16.1
18 Chartroom 37 23.3 37 7.9 0 ‐ 27 15.0
Source: See Ambient Water Temperature and Water Quality Temperature Criteria for Warm‐Small Waters Table
Recommended standards
for LFF and LAL are FAL
standards.
Use Classification Color Code and Relevant State and Recommended Standard(s)
Use Classification and Color Code:
17.8 ‐ 29.7 1.7 ‐ 17.8 ‐ 9.1 ‐ 26.5
# = number of samples; Med. = median
Limited Forage Fish (LFF), Limited Recreational Use
Fish and Aquatic Life (FAL), Full Recreational Use
Not greater than 30 °C (86 °F).
See Ambient Water Temperature and Water
Quality Temperature Criteria for Warm‐Small
Waters Table.
State Standard
Not applicable
Recommended Standard
Limited Aquatic Life (LAL), Limited Recreational Use
13.3 ‐ 27.9 1.1 ‐ 16.3 0.0 ‐ 1.6 9.7 ‐ 26.0
14.7 ‐ 29.9 0.8 ‐ 18.5 0.2 ‐ 1.7 9.7 ‐ 26.1
16.7 ‐ 30.3 1.4 ‐ 16.7 0.0 ‐ 1.5 8.3 ‐ 27.0
12.2 ‐ 26.6 1.2 ‐ 16.7 0.0 ‐ 2.1 9.1 ‐ 25.9
13.3 ‐ 26.8 0.4 ‐ 17.5 0.0 ‐ 0.9 8.3 ‐ 27.0
12.6 ‐ 26.8 0.0 ‐ 15.9 0.0 ‐ 0.3 7.1 ‐ 25.2
12.7 ‐ 27.2 0.0 ‐ 16.2 ‐0.1 ‐ 0.3 7.2 ‐ 25.2
11.1 ‐ 25.9 0.5 ‐ 15.0 0.0 ‐ 2.3 5.6 ‐ 24.1
11.9 ‐ 27.2 0.7 ‐ 14.3 ‐0.3 ‐ 2.1 5.5 ‐ 22.8
13.4 ‐ 27.6 0.1 ‐ 15.2 0.0 ‐ 0.4 7.4 ‐ 26.2
12.0 ‐ 28.5 1.0 ‐ 15.1 0.0 ‐ 1.4 5.7 ‐ 24.1
12.4 ‐ 29.1 0.5 ‐ 17.0 0.0 ‐ 1.6 5.6 ‐ 26.8
12.5 ‐ 25.8 0.3 ‐ 14.8 ‐0.1 ‐ 10.2 6.7 ‐ 24.4
11.5 ‐ 28.0 0.5 ‐ 18.8 0.0 ‐ 1.8 5.3 ‐ 26.2
10.7 ‐ 24.1 1.0 ‐ 15.1 0.0 ‐ 2.7 3.1 ‐ 21.8
16.3 ‐ 23.1 6.6 ‐ 18.8 1.4 ‐ 9.5 7.8 ‐ 20.9
10.7 ‐ 27.4 1.2 ‐ 15.4 0.0 ‐ 1.2 5.3 ‐ 23.2
Med. Range # Med. Range #
Water Temperature (°C) Seasonal Data by Site in the Root River WatershedRacine Health Department, 8.3.11 ‐ 3.20.13
Site Code
Site (Upstream to
Downstream)
SUMMER FALL WINTER SPRING
# Med. Range # Med. Range
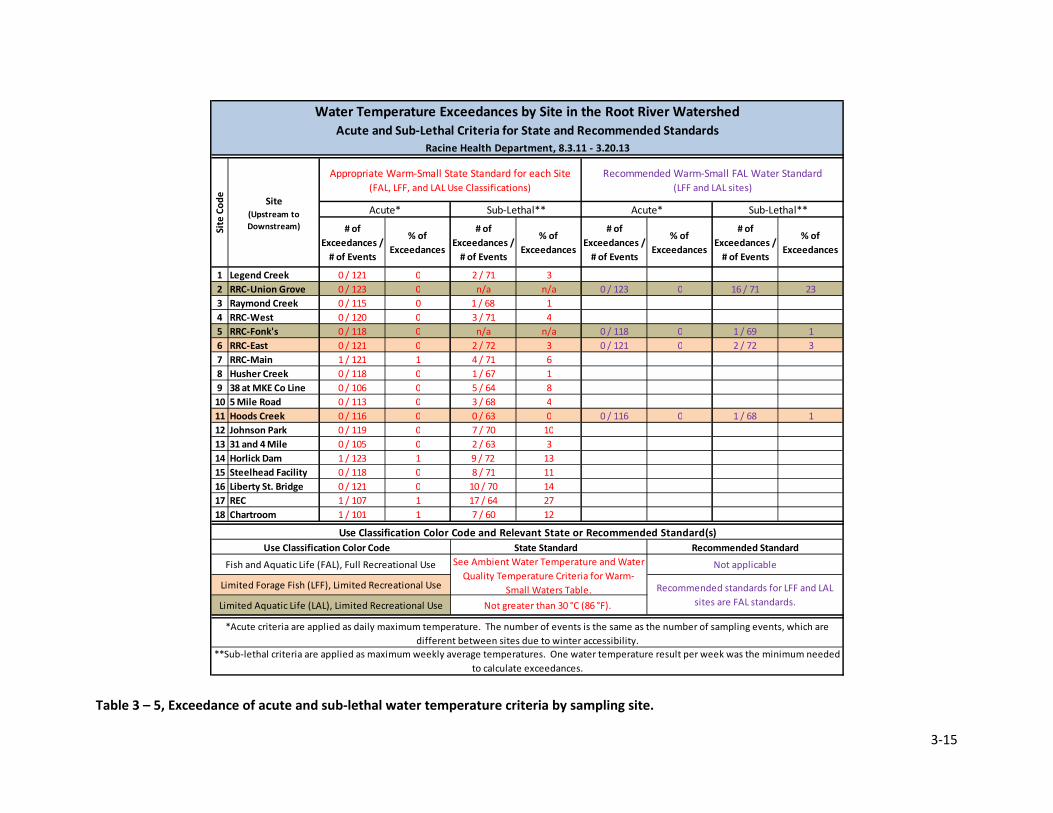
3‐15
Table 3 – 5, Exceedance of acute and sub‐lethal water temperature criteria by sampling site.
# of
Exceedances /
# of Events
% of
Exceedances
# of
Exceedances /
# of Events
% of
Exceedances
# of
Exceedances /
# of Events
% of
Exceedances
# of
Exceedances /
# of Events
% of
Exceedances
1 Legend Creek 0 / 121 0 2 / 71 3
2 RRC‐Union Grove 0 / 123 0 n/a n/a 0 / 123 0 16 / 71 23
3 Raymond Creek 0 / 115 0 1 / 68 1
4 RRC‐West 0 / 120 0 3 / 71 4
5 RRC‐Fonk's 0 / 118 0 n/a n/a 0 / 118 0 1 / 69 1
6 RRC‐East 0 / 121 0 2 / 72 3 0 / 121 0 2 / 72 3
7 RRC‐Main 1 / 121 1 4 / 71 6
8 Husher Creek 0 / 118 0 1 / 67 1
9 38 at MKE Co Line 0 / 106 0 5 / 64 8
10 5 Mile Road 0 / 113 0 3 / 68 4
11 Hoods Creek 0 / 116 0 0 / 63 0 0 / 116 0 1 / 68 1
12 Johnson Park 0 / 119 0 7 / 70 10
13 31 and 4 Mile 0 / 105 0 2 / 63 3
14 Horlick Dam 1 / 123 1 9 / 72 13
15 Steelhead Facility 0 / 118 0 8 / 71 11
16 Liberty St. Bridge 0 / 121 0 10 / 70 14
17 REC 1 / 107 1 17 / 64 27
18 Chartroom 1 / 101 1 7 / 60 12
Recommended Standard
See Ambient Water Temperature and Water
Quality Temperature Criteria for Warm‐
Small Waters Table.
Not greater than 30 °C (86 °F).
Recommended standards for LFF and LAL
sites are FAL standards.
Not applicable
Site Code
Limited Forage Fish (LFF), Limited Recreational Use
Sub‐Lethal**
Use Classification Color Code State Standard
Racine Health Department, 8.3.11 ‐ 3.20.13
Water Temperature Exceedances by Site in the Root River WatershedAcute and Sub‐Lethal Criteria for State and Recommended Standards
**Sub‐lethal criteria are applied as maximum weekly average temperatures. One water temperature result per week was the minimum needed
to calculate exceedances.
*Acute criteria are applied as daily maximum temperature. The number of events is the same as the number of sampling events, which are
different between sites due to winter accessibility.
Use Classification Color Code and Relevant State or Recommended Standard(s)
Appropriate Warm‐Small State Standard for each Site
(FAL, LFF, and LAL Use Classifications)
Recommended Warm‐Small FAL Water Standard
(LFF and LAL sites)
Acute* Sub‐Lethal** Acute*
Fish and Aquatic Life (FAL), Full Recreational Use
Limited Aquatic Life (LAL), Limited Recreational Use
Site (Upstream to
Downstream)

3‐16
Table 3 – 6, Median turbidity values, including exceedance of state standards and correlations to precipitation and flow rate, by site.
r p r p r p
1 Legend Creek 121 5.9 1.1 ‐ 49.9 ‐ 5 0.20 0.03 0.20 0.03 0.20 0.03
2 RRC‐Union Grove 123 4.1 0.9 ‐ 210 ‐ 10 0.36 0.00 0.32 0.00 0.31 0.00
3 Raymond Creek 114 14.7 1.2 ‐ 211 ‐ 38 0.02 0.84 0.02 0.85 0.04 0.64
4 RRC‐West 121 6.8 2.0 ‐ 327 ‐ 10 0.13 0.15 0.19 0.03 0.19 0.04
5 RRC‐Fonk's 118 12.4 2.3 ‐ 260 ‐ 23 0.25 0.01 0.22 0.02 0.24 0.01
6 RRC‐East 121 9.2 2.2 ‐ 467 ‐ 17 0.20 0.03 0.29 0.00 0.34 0.00
7 RRC‐Main 121 16.6 4.6 ‐ 431 ‐ 27 0.09 0.31 0.27 0.00 0.25 0.01
8 Husher Creek 118 19.1 1.9 ‐ 434 ‐ 48 0.20 0.03 0.17 0.06 0.10 0.29
9 38 at MKE Co Line 106 12.1 3.0 ‐ 316 ‐ 10 0.25 0.01 0.27 0.01 0.31 0.00
10 5 Mile Road 113 13.6 2.2 ‐ 472 ‐ 12 0.23 0.01 0.19 0.05 0.22 0.02
11 Hoods Creek 116 14.2 3.4 ‐ 515 ‐ 22 0.25 0.01 0.32 0.00 0.33 0.00
12 Johnson Park 119 7.4 2.3 ‐ 444 ‐ 10 0.29 0.00 0.35 0.00 0.38 0.00
13 31 and 4 Mile 105 7.0 1.8 ‐ 60.5 ‐ 5 0.26 0.01 0.29 0.00 0.26 0.01
14 Horlick Dam 124 15.9 4.0 ‐ 620 ‐ 25 0.11 0.22 0.21 0.02 0.23 0.01
15 Steelhead Facility 118 9.0 3.1 ‐ 551 ‐ 17 0.27 0.00 0.23 0.02 0.33 0.00
16 Liberty St. Bridge 121 9.2 3.5 ‐ 556 ‐ 16 0.31 0.00 0.24 0.01 0.31 0.00
17 REC 107 10.5 4.2 ‐ 580 ‐ 15 0.31 0.00 0.24 0.01 0.24 0.01
18 Chartroom 101 7.3 1.8 ‐ 44.0 ‐ 7 0.31 0.00 0.25 0.01 0.21 0.04
0.00
0.00
0.00
0.00
0.00
0.00
0.000.64
0.53
0.53
Volumetric Flow Rate
p
0.05
0.80
0.00
0.00
0.53
0.30
0.07
0.00
0.05
0.01
0.090.16
0.66
0.64
0.29
0.66
Turbidity (NTU) Summary Data by Site in the Root River WatershedRacine Health Department, 8.3.11 ‐ 3.20.13
Site Code
Site (Upstream to
Downstream)
Number
of
Samples
Median
Number of
ExceedancesCorrelations
State
Std.
Rec'd
Std
Precipitation
24‐hr 48‐hr 72‐hr
r = correlation coefficient Significant p values < 0.05
Range
r
‐0.20
0.03
‐0.60
0.54
‐0.06
‐0.10
‐0.18
‐0.43
0.20
0.26
Use Classification Color Code and Relevant State and Recommended Standard(s)
Use Classification and Color Code: State Standard (Std.) Recommended Standard (Rec'd Std.)
Fish and Aquatic Life (FAL), Full Recreational Use
Not applicable Not greater than 25 NTU.Limited Forage Fish (LFF), Limited Recreational Use
Limited Aquatic Life (LAL), Limited Recreational Use
Source: Minnesota State Standards. (MPCA, 2008)

3‐17
Table 3 – 7, Seasonal turbidity values by sampling site.
1 Legend Creek 37 10.8 37 3.6 20 3.1 27 7.1
2 RRC‐Union Grove 37 4.1 37 3.9 22 7.3 27 4.0
3 Raymond Creek 37 21.3 37 19.6 14 12.0 27 5.7
4 RRC‐West 37 4.4 37 5.4 20 13.2 27 7.4
5 RRC‐Fonk's 37 18.3 37 10.0 17 12.5 27 12.2
6 RRC‐East 37 14.3 37 7.0 20 8.5 27 4.0
7 RRC‐Main 37 22.6 37 13.0 20 15.4 27 12.6
8 Husher Creek 37 32.2 37 8.6 17 22.6 27 11.6
9 38 at MKE Co Line 37 13.0 37 7.2 5 25.8 27 16.6
10 5 Mile Road 37 15.7 37 8.4 12 17.5 27 12.6
11 Hoods Creek 37 20.1 37 6.4 15 22.3 27 10.9
12 Johnson Park 37 7.3 37 6.8 18 16.0 27 10.1
13 31 and 4 Mile 37 7.0 37 4.4 4 26.6 27 9.8
14 Horlick Dam 38 18.3 37 14.0 22 10.9 27 23.0
15 Steelhead Facility 37 8.0 37 7.3 17 17.2 27 13.7
16 Liberty St. Bridge 37 7.7 37 7.8 20 17.9 27 11.8
17 REC 37 8.2 37 8.4 6 43.2 27 13.5
18 Chartroom 37 4.9 37 7.7 0 ‐ 27 16.2 2.9 ‐ 44.0
4.3 ‐ 38.4
9.7 ‐ 44.5
6.6 ‐ 47.9
6.6 ‐ 47.3
6.7 ‐ 71.15.3 ‐ 580.0
‐
Range
1.9 ‐ 47.5
1.9 ‐ 40.2
3.1 ‐ 22.8
3.5 ‐ 87.9
6.9 ‐ 178.0
2.3 ‐ 44.3
4.9 ‐ 55.6
5.5 ‐ 45.4
6.9 ‐ 62.7
6.8 ‐ 63.6
4.4 ‐ 34.0
3.6 ‐ 47.64.0 ‐ 444.0
16.9 ‐ 60.5
4.0 ‐ 620.0
2.1 ‐ 21.1
Range
1.1 ‐ 49.9
2.6 ‐ 210.0
4.6 ‐ 211.0
4.8 ‐ 327.0
4.4 ‐ 260.0
3.2 ‐ 467.0
4.6 ‐ 431.0
3.2 ‐ 434.0
5.7 ‐ 316.0
5.6 ‐ 472.0
8.8 ‐ 515.0
3.0 ‐ 32.4
2.2 ‐ 24.6
3.4 ‐ 130.0
2.3 ‐ 60.9
Turbidity (NTU) Seasonal Data by Site in the Root River WatershedRacine Health Department, 8.3.11 ‐ 3.20.13
Site Code
Site (Upstream to
Downstream)
SUMMER FALL WINTER SPRING
# Range Range # Med.Med. # Med.Med.
7.5 ‐ 136.0
4.5 ‐ 36.3
4.0 ‐ 17.9
4.2 ‐ 20.4
Use Classification Color Code and Relevant State and Recommended Standard(s)
#
3.7 ‐26.5
0.8 ‐ 16.9
4.4 ‐ 109.0
2.0 ‐ 47.3
6.5 ‐ 123.0
3.9 ‐ 36.0
12.2 ‐ 47.0
9.9 ‐ 78.9
2.7 ‐ 23.5
1.8 ‐ 20.0
1.5 ‐ 35.1
1.5 ‐ 129.0
1.2 ‐ 77.3
3.4 ‐ 84.8
2.3 ‐ 35.9
2.2 ‐ 30.2
5.8 ‐ 39.4
1.9 ‐ 65.811.3 ‐ 92.2
7.6 ‐ 50.2
6.0 ‐ 55.0
4.3 ‐ 551.0
3.7 ‐ 556.0
3.1 ‐ 42.6
3.5 ‐ 48.9
4.5 ‐ 69.4
Source: Minnesota State Standards. (MPCA, 2008)
Fish and Aquatic Life (FAL), Full Recreational Use
Not applicable Not greater than 25 NTULimited Forage Fish (LFF), Limited Recreational Use
Limited Aquatic Life (LAL), Limited Recreational Use
Use Classification and Color Code: State Standard Recommended Standard
# = number of samples; Med. = median
1.8 ‐ 20.5
5.5 ‐ 28.1
3.3 ‐ 16.9

3‐18
Table 3 – 8, Median specific conductivity values, exceedance of state recommended standards and correlation to precipitation and flow rate
by site.
r p r p r p
1 Legend Creek 121 1,092 420 ‐ 3,110 ‐ 10 ‐0.17 0.07 ‐0.28 0.00 ‐0.31 0.00
2 RRC‐Union Grove 123 1,936 431 ‐ 5,410 ‐ 95 ‐0.20 0.02 ‐0.19 0.03 ‐0.26 0.00
3 Raymond Creek 115 1,072 288 ‐ 2,950 ‐ 36 ‐0.16 0.10 ‐0.15 0.11 ‐0.15 0.12
4 RRC‐West 121 1,386 325 ‐ 2,260 ‐ 51 ‐0.16 0.08 ‐0.13 0.14 ‐0.13 0.17
5 RRC‐Fonk's 118 1,267 233 ‐ 1,655 ‐ 3 ‐0.22 0.02 ‐0.19 0.04 ‐0.19 0.04
6 RRC‐East 121 946 365 ‐ 1,716 ‐ 6 ‐0.05 0.59 ‐0.10 0.28 ‐0.14 0.12
7 RRC‐Main 121 1,229 350 ‐ 1,950 ‐ 35 ‐0.12 0.21 ‐0.17 0.07 ‐0.20 0.03
8 Husher Creek 118 1,099 223 ‐ 1,514 ‐ 2 ‐0.27 0.00 ‐0.23 0.01 ‐0.24 0.01
9 38 at MKE Co Line 106 1,018 600 ‐ 2,130 ‐ 2 ‐0.20 0.04 ‐0.19 0.05 ‐0.29 0.00
10 5 Mile Road 113 1,007 495 ‐ 1,701 ‐ 4 ‐0.11 0.23 ‐0.18 0.05 ‐0.21 0.03
11 Hoods Creek 116 1,179 509 ‐ 2,150 ‐ 6 ‐0.08 0.42 ‐0.26 0.01 ‐0.25 0.01
12 Johnson Park 119 1,011 482 ‐ 2,890 ‐ 5 ‐0.12 0.19 ‐0.18 0.05 ‐0.23 0.01
13 31 and 4 Mile 105 989 636 ‐ 1,326 ‐ 0 ‐0.07 0.48 ‐0.06 0.58 ‐0.11 0.27
14 Horlick Dam 124 983 463 ‐ 2,790 ‐ 8 ‐0.02 0.85 ‐0.06 0.51 ‐0.10 0.28
15 Steelhead Facility 118 966 471 ‐ 2,720 ‐ 7 ‐0.15 0.11 ‐0.17 0.07 ‐0.21 0.02
16 Liberty St. Bridge 121 980 485 ‐ 3,440 ‐ 8 ‐0.06 0.55 ‐0.15 0.11 ‐0.23 0.01
17 REC 107 950 486 ‐ 2,890 ‐ 1 ‐0.24 0.01 ‐0.30 0.00 ‐0.38 0.00
18 Chartroom 101 669 342 ‐ 1,053 ‐ 0 0.16 0.10 0.08 0.40 0.03 0.79
0.54
0.00
0.42
0.68
0.22
0.95
0.48
‐0.01
0.07
‐0.06
0.66
p
0.54
0.00
0.00
0.00
0.00
0.01
0.00
0.00
0.12
0.64
0.00
0.04
‐0.49
0.08
‐0.04
0.11
Specific Conductivity (µS/cm) Summary Data by Site in the Root River WatershedRacine Health Department, 8.3.11 ‐ 3.20.13
Site Code
Site (Upstream to
Downstream)
Number
of
Samples
Median
Number of
ExceedancesCorrelations
State
Std.
Rec'd
Std.
Precipitation
24‐hr 48‐hr 72‐hr
r = correlation coefficient Significant p values < 0.05
Range Volumetric Flow Rate
r
‐0.06
‐0.68
‐0.78
‐0.81
‐0.88
‐0.24
‐0.76
‐0.34
‐0.15
Use Classification Color Code and Relevant State and Recommended Standard(s)
Use Classification and Color Code: State Standard (Std.) Recommended Standard (Rec'd Std.)
Fish and Aquatic Life (FAL), Full Recreational Use
N/ANot less than 150 µS/cm or greater than 1,500
µS/cm.Limited Forage Fish (LFF), Limited Recreational Use
Limited Aquatic Life (LAL), Limited Recreational Use
Source: (U.S. EPA, 2012)
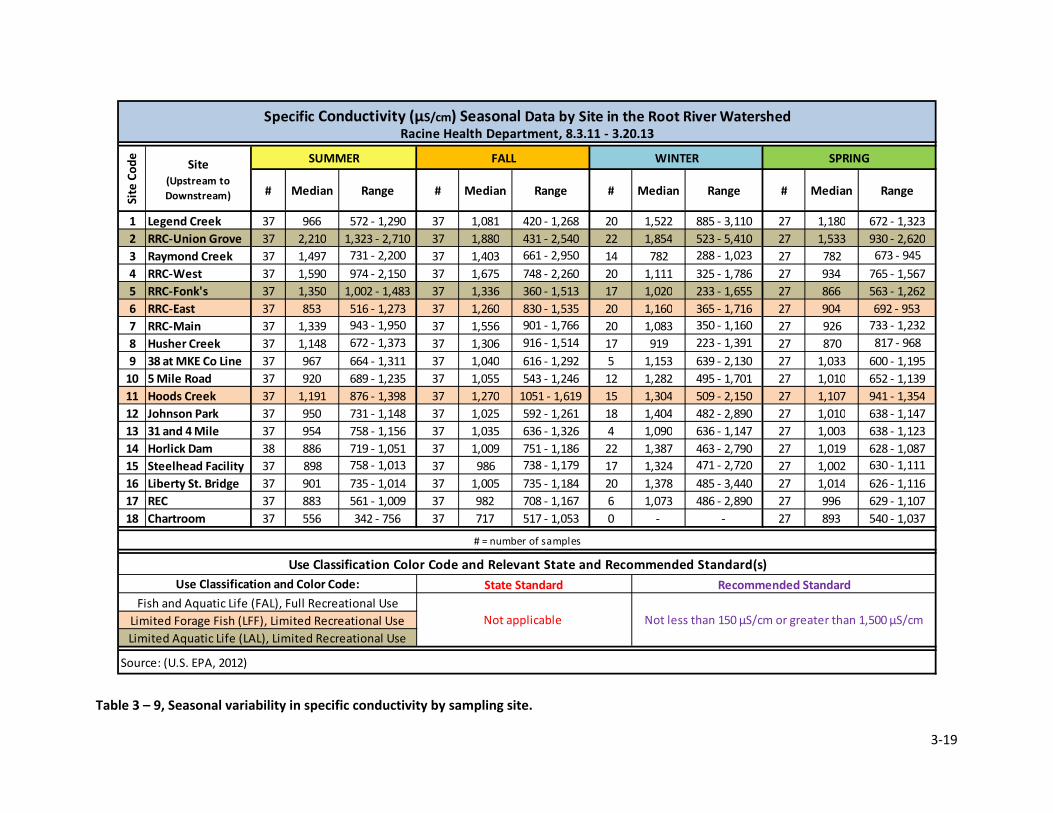
3‐19
Table 3 – 9, Seasonal variability in specific conductivity by sampling site.
1 Legend Creek 37 966 37 1,081 20 1,522 27 1,180
2 RRC‐Union Grove 37 2,210 37 1,880 22 1,854 27 1,533
3 Raymond Creek 37 1,497 37 1,403 14 782 27 782
4 RRC‐West 37 1,590 37 1,675 20 1,111 27 934
5 RRC‐Fonk's 37 1,350 37 1,336 17 1,020 27 866
6 RRC‐East 37 853 37 1,260 20 1,160 27 904
7 RRC‐Main 37 1,339 37 1,556 20 1,083 27 926
8 Husher Creek 37 1,148 37 1,306 17 919 27 870
9 38 at MKE Co Line 37 967 37 1,040 5 1,153 27 1,033
10 5 Mile Road 37 920 37 1,055 12 1,282 27 1,010
11 Hoods Creek 37 1,191 37 1,270 15 1,304 27 1,107
12 Johnson Park 37 950 37 1,025 18 1,404 27 1,010
13 31 and 4 Mile 37 954 37 1,035 4 1,090 27 1,003
14 Horlick Dam 38 886 37 1,009 22 1,387 27 1,019
15 Steelhead Facility 37 898 37 986 17 1,324 27 1,002
16 Liberty St. Bridge 37 901 37 1,005 20 1,378 27 1,014
17 REC 37 883 37 982 6 1,073 27 996
18 Chartroom 37 556 37 717 0 ‐ 27 893
626 ‐ 1,116
629 ‐ 1,107
540 ‐ 1,037‐
672 ‐ 1,323
930 ‐ 2,620
673 ‐ 945
765 ‐ 1,567
563 ‐ 1,262
692 ‐ 953
733 ‐ 1,232
817 ‐ 968
600 ‐ 1,195
652 ‐ 1,139
941 ‐ 1,354
638 ‐ 1,147
638 ‐ 1,123
628 ‐ 1,087
630 ‐ 1,111
636 ‐ 1,147
463 ‐ 2,790
471 ‐ 2,720
485 ‐ 3,440
486 ‐ 2,890708 ‐ 1,167
517 ‐ 1,053
885 ‐ 3,110
523 ‐ 5,410
288 ‐ 1,023
325 ‐ 1,786
233 ‐ 1,655
365 ‐ 1,716
350 ‐ 1,160
223 ‐ 1,391
639 ‐ 2,130
495 ‐ 1,701
509 ‐ 2,150
482 ‐ 2,890
1051 ‐ 1,619
592 ‐ 1,261
636 ‐ 1,326
751 ‐ 1,186
758 ‐ 1,156
719 ‐ 1,051
758 ‐ 1,013
735 ‐ 1,014
431 ‐ 2,540
661 ‐ 2,950
748 ‐ 2,260
360 ‐ 1,513
830 ‐ 1,535
901 ‐ 1,766
916 ‐ 1,514
616 ‐ 1,292
543 ‐ 1,246
943 ‐ 1,950
672 ‐ 1,373
664 ‐ 1,311
738 ‐ 1,179
735 ‐ 1,184
731 ‐ 1,148
Specific Conductivity (µS/cm) Seasonal Data by Site in the Root River WatershedRacine Health Department, 8.3.11 ‐ 3.20.13
Site Code
Site (Upstream to
Downstream)
SUMMER FALL WINTER SPRING
# MedianMedian Range Range
Use Classification Color Code and Relevant State and Recommended Standard(s)
# MedianMedian #
# = number of samples
Source: (U.S. EPA, 2012)
Range Range
572 ‐ 1,290
#
689 ‐ 1,235
876 ‐ 1,398
1,323 ‐ 2,710
731 ‐ 2,200
974 ‐ 2,150
1,002 ‐ 1,483
516 ‐ 1,273
561 ‐ 1,009
342 ‐ 756
420 ‐ 1,268
Not less than 150 µS/cm or greater than 1,500 µS/cmNot applicable
Fish and Aquatic Life (FAL), Full Recreational Use
Limited Forage Fish (LFF), Limited Recreational Use
Limited Aquatic Life (LAL), Limited Recreational Use
Use Classification and Color Code: State Standard Recommended Standard

3‐20
Table 3 – 10, pH summary data by sampling site including exceedance of state standards and correlation to precipitation, temperature and
flow rate.
r p r p r p r p r p
1 Legend Creek 121 8.0 6.7 ‐ 8.4 0 ‐ ‐0.18 0.05 ‐0.22 0.02 ‐0.20 0.03 ‐0.27 0.00 0.14 0.16
2 RRC‐Union Grove 123 7.8 7.6 ‐ 8.3 0 ‐ ‐0.26 0.00 ‐0.22 0.02 ‐0.19 0.04 0.13 0.15 0.19 0.05
3 Raymond Creek 115 7.9 7.3 ‐ 9.0 0 ‐ ‐0.14 0.15 ‐0.13 0.17 ‐0.20 0.04 0.11 0.24 0.44 0.00
4 RRC‐West 121 8.0 7.3 ‐ 9.3 1 ‐ ‐0.18 0.05 ‐0.16 0.08 ‐0.09 0.34 0.52 0.00 ‐0.63 0.00
5 RRC‐Fonk's 118 7.5 7.0 ‐ 8.1 0 ‐ ‐0.08 0.36 ‐0.12 0.20 ‐0.19 0.04 ‐0.01 0.95 0.62 0.00
6 RRC‐East 121 7.8 7.3 ‐ 8.4 0 ‐ ‐0.14 0.13 ‐0.14 0.12 ‐0.08 0.40 0.58 0.00 ‐0.43 0.00
7 RRC‐Main 121 7.9 7.4 ‐ 9.4 4 ‐ ‐0.23 0.01 ‐0.21 0.02 ‐0.27 0.00 0.49 0.00 ‐0.32 0.00
8 Husher Creek 118 7.9 7.3 ‐ 8.7 0 ‐ ‐0.22 0.02 ‐0.19 0.04 ‐0.17 0.06 0.29 0.00 ‐0.16 0.12
9 38 at MKE Co Line 106 7.9 7.6 ‐ 8.6 0 ‐ ‐0.12 0.21 ‐0.04 0.71 0.02 0.88 ‐0.16 0.10 0.19 0.06
10 5 Mile Road 113 7.9 7.4 ‐ 8.6 0 ‐ ‐0.12 0.20 ‐0.07 0.49 ‐0.15 0.11 0.15 0.11 ‐0.38 0.00
11 Hoods Creek 116 7.9 7.5 ‐ 8.3 0 ‐ ‐0.16 0.08 ‐0.09 0.34 ‐0.07 0.47 0.20 0.04 0.02 0.83
12 Johnson Park 119 8.1 7.5 ‐ 8.8 0 ‐ ‐0.15 0.12 0.00 0.98 ‐0.06 0.52 0.37 0.00 ‐0.35 0.00
13 31 and 4 Mile 105 8.0 7.4 ‐ 8.3 0 ‐ ‐0.13 0.20 ‐0.06 0.55 ‐0.10 0.30 ‐0.09 0.34 ‐0.27 0.01
14 Horlick Dam 124 8.2 7.6 ‐ 8.8 0 ‐ ‐0.19 0.04 ‐0.10 0.25 ‐0.12 0.18 0.62 0.00 ‐0.61 0.00
15 Steelhead Facility 118 8.1 7.6 ‐ 8.5 0 ‐ ‐0.11 0.23 ‐0.04 0.68 ‐0.11 0.22 0.18 0.05 ‐0.04 0.64
16 Liberty St. Bridge 121 8.2 7.6 ‐ 8.5 0 ‐ 0.18 0.04 ‐0.16 0.09 ‐0.21 0.02 0.30 0.00 ‐0.21 0.02
17 REC 107 8.3 7.6 ‐ 9.1 1 ‐ ‐0.30 0.00 ‐0.26 0.01 ‐0.31 0.00 0.48 0.00 ‐0.54 0.00
18 Chartroom 101 8.0 7.6 ‐ 8.7 0 ‐ ‐0.05 0.60 ‐0.03 0.76 ‐0.15 0.13 ‐0.21 0.03 0.29 0.00
Air
Temperature72‐hr
r = correlation coefficient Significant p values < 0.05
pH (s.u.) Summary Data by Site in the Root River WatershedRacine Health Department, 8.3.11 ‐ 3.20.13
Site Code
Site (Upstream to
Downstream)
Number
of
Samples
Median
Number of
ExceedancesCorrelations
State
Std.
Rec'd
Std.
PrecipitationRange Volumetric
Flow Rate24‐hr 48‐hr
Limited Aquatic Life (LAL), Limited Recreational Use
Not less than 6.0 s.u. or
greater than 9.0 s.u.Not applicable
Fish and Aquatic Life (FAL), Full Recreational Use
Limited Forage Fish (LFF), Limited Recreational Use
Use Classification Color Code and Relevant State and Recommended Standard(s)
Use Classification and Color Code: State Standard (Std.) Recommended Standard (Rec'd Std.)
* Mean calculation not applicable to pH due to logarithmic scale

3‐21
Table 3 ‐11, Seasonal variability in pH by sampling site.
1 Legend Creek 37 7.9 37 8.0 20 7.9 27 7.9
2 RRC‐Union Grove 37 7.8 37 7.8 22 7.8 27 7.9
3 Raymond Creek 37 7.9 37 7.9 14 7.9 27 8.1
4 RRC‐West 37 8.2 37 8.1 20 7.6 27 7.9
5 RRC‐Fonk's 37 7.4 37 7.3 17 7.5 27 7.9
6 RRC‐East 37 8.0 37 7.8 20 7.5 27 7.9
7 RRC‐Main 37 8.3 37 7.9 20 7.7 27 8.0
8 Husher Creek 37 8.0 37 7.9 17 7.7 27 7.9
9 38 at MKE Co Line 37 7.9 37 7.9 5 7.7 27 8.0
10 5 Mile Road 37 8.0 37 8.0 12 7.7 27 7.9
11 Hoods Creek 37 8.0 37 7.9 15 7.8 27 8.0
12 Johnson Park 37 8.2 37 8.1 18 7.8 27 8.1
13 31 and 4 Mile 37 8.0 37 8.0 4 7.7 27 8.0
14 Horlick Dam 38 8.3 37 8.2 22 7.8 27 8.2
15 Steelhead Facility 37 8.1 37 8.2 17 8.0 27 8.2
16 Liberty St. Bridge 37 8.2 37 8.2 20 8.0 27 8.3
17 REC 37 8.5 37 8.2 6 7.9 27 8.2
18 Chartroom 37 7.9 37 8.0 0 ‐ 27 8.1 7.8 ‐ 8.4
7.8 ‐ 8.3
7.7 ‐ 8.3
7.6 ‐ 8.3
7.8 ‐ 8.6
7.8 ‐ 8.5
7.6 ‐ 8.1
7.4 ‐ 8.8
7.6 ‐ 8.7
7.6 ‐ 8.2
7.6 ‐ 8.3
7.9 ‐ 8.4
7.6 ‐ 8.3
7.5 ‐ 8.1
7.6 ‐ 8.1
7.6 ‐ 8.2
7.6 ‐ 8.2
7.6 ‐ 8.2
7.8 ‐ 8.5
7.8 ‐ 8.5
‐
7.8 ‐ 8.4
7.8 ‐ 8.6
7.6 ‐ 8.2
7.6 ‐ 8.1
7.6 ‐ 8.0
7.3 ‐ 8.2
7.3 ‐ 7.8
7.3 ‐ 7.7
7.3 ‐ 7.7
7.4 ‐ 7.9
7.3 ‐ 8.0
7.6 ‐7.9
7.4 ‐ 7.9
7.5 ‐ 7.9
7.5 ‐ 8.0
7.4 ‐ 7.8
7.6 ‐ 8.7
7.7 ‐ 8.1
7.6 ‐ 8.0
7.6 ‐ 8.3
7.6 ‐ 8.4
7.0 ‐ 7.8
7.6 ‐ 8.4
7.8 ‐ 8.2
7.7 ‐ 8.1
7.6 ‐ 8.2
7.6 ‐ 8.2
7.7 ‐ 8.1
7.7 ‐ 8.7
7.6 ‐ 8.3
7.8 ‐ 8.5
7.8 ‐ 8.5
7.7 ‐ 8.2
8.0 ‐ 8.8
7.9 ‐ 8.5
7.8 ‐ 8.5
7.7 ‐ 9.1
7.7 ‐ 8.3
7.7 ‐ 8.6
7.8 ‐ 8.6
7.7 ‐ 8.1
7.4 ‐ 9.0
7.7 ‐ 9.3
7.1 ‐ 8.1
7.6 ‐ 8.3
7.7 ‐ 9.4
7.8 ‐ 8.0
7.8 ‐ 8.8
pH (s.u.) Seasonal Data by Site in the Root River WatershedRacine Health Department, 8.3.11 ‐ 3.20.13
Site Code
Site (Upstream to
Downstream)
SUMMER FALL WINTER SPRING
# Range Range Range Range
6.7 ‐ 8.4
7.7 ‐ 8.3
Source: WI DNR NR 102.04 (4)(c), NR 104.02 (3)(a)2.c.), and NR 104.02 (3)(b)2.b.)
Not less than 6.0 s.u.
or greater than 9.0 s.u.
Fish and Aquatic Life (FAL), Full Recreational Use
Not applicableLimited Forage Fish (LFF), Limited Recreational Use
Limited Aquatic Life (LAL), Limited Recreational Use
Use Classification and Color Code: State Standard Recommended Standard
# MedianMedian # MedianMedian
# = number of samples
Use Classification Color Code and Relevant State and Recommended Standard(s)
#
7.7 ‐ 8.1

3‐22
Table 3 – 12, Median total phosphorous concentrations and correlation to precipitation, turbidity, flow rate and conductivity by site.
r p r p r p r p r p r p
1 Legend Creek 13 0.049 0.019 ‐ 0.178 6 ‐ ‐0.23 0.45 ‐0.23 0.45 ‐0.22 0.47 0.67 0.01 ‐0.60 0.05 ‐0.39 0.18
2 RRC‐Union Grove 13 0.364 0.159 ‐ 0.618 N/A 13 ‐0.19 0.53 ‐0.19 0.53 ‐0.42 0.15 0.08 0.78 ‐0.86 0.00 0.78 0.00
3 Raymond Creek 12 0.112 0.028 ‐ 1.810 7 ‐ ‐0.31 0.33 ‐0.31 0.33 ‐0.18 0.57 0.87 0.00 ‐0.65 0.03 0.52 0.08
4 RRC‐West 13 0.139 0.053 ‐ 0.566 12 ‐ 0.08 0.80 0.08 0.80 0.22 0.47 0.05 0.86 ‐0.18 0.59 0.17 0.58
5 RRC‐Fonk's 13 1.950 0.130 ‐ 4.430 N/A 13 ‐0.15 0.62 ‐0.15 0.62 ‐0.44 0.14 0.12 0.70 ‐0.95 0.00 0.82 0.00
6 RRC‐East 13 0.119 0.036 ‐ 1.260 9 ‐ ‐0.31 0.30 ‐0.31 0.30 ‐0.04 0.91 0.72 0.00 ‐0.68 0.02 ‐0.37 0.20
7 RRC‐Main 13 0.130 0.068 ‐ 0.892 9 ‐ ‐0.62 0.02 ‐0.62 0.02 ‐0.48 0.10 0.62 0.02 ‐0.50 0.12 0.36 0.21
8 Husher Creek 13 0.113 0.032 ‐ 0.376 8 ‐ ‐0.35 0.24 ‐0.35 0.24 ‐0.05 0.87 0.94 0.00 ‐0.72 0.01 ‐0.02 0.94
9 38 at MKE Co Line 11 0.106 0.047 ‐ 0.592 9 ‐ ‐0.40 0.22 ‐0.40 0.22 ‐0.40 0.22 0.14 0.67 ‐0.74 0.01 ‐0.30 0.35
10 5 Mile Road 13 0.094 0.038 ‐ 0.497 8 ‐ ‐0.12 0.71 ‐0.04 0.91 0.10 0.74 0.76 0.00 ‐0.29 0.34 ‐0.45 0.12
11 Hoods Creek 12 0.185 0.060 ‐ 0.797 11 ‐ ‐0.04 0.91 0.09 0.79 ‐0.13 0.69 0.66 0.02 ‐0.66 0.02 0.48 0.11
12 Johnson Park 13 0.071 0.043 ‐ 0.467 6 ‐ ‐0.03 0.93 0.02 0.96 0.18 0.55 0.10 0.72 ‐0.14 0.66 ‐0.32 0.27
13 31 and 4 Mile 11 0.078 0.046 ‐ 0.477 6 ‐ ‐0.13 0.70 0.03 0.94 0.03 0.93 ‐0.21 0.52 ‐0.50 0.12 ‐0.60 0.05
14 Horlick Dam 13 0.097 0.047 ‐ 0.326 9 ‐ ‐0.11 0.71 ‐0.09 0.76 0.10 0.75 0.30 0.31 ‐0.01 0.98 ‐0.34 0.24
15 Steelhead Facility 12 0.092 0.044 ‐ 0.287 8 ‐ ‐0.20 0.53 ‐0.20 0.53 ‐0.20 0.53 ‐0.03 0.92 ‐0.21 0.51 ‐0.40 0.19
16 Liberty St. Bridge 12 0.093 0.043 ‐ 0.290 8 ‐ ‐0.15 0.65 ‐0.15 0.65 ‐0.15 0.65 ‐0.17 0.59 ‐0.26 0.41 ‐0.25 0.43
17 REC 12 0.106 0.040 ‐ 0.337 9 ‐ 0.01 0.98 0.01 0.98 0.01 0.98 0.18 0.56 ‐0.26 0.41 ‐0.33 0.28
18 Chartroom 11 0.077 0.049 ‐ 0.136 6 ‐ ‐0.08 0.81 ‐0.08 0.81 ‐0.08 0.81 0.09 0.78 0.42 0.20 0.40 0.21
r = correlation coefficient Significant p values < 0.05
Volumetric
Flow RateConductivity
Total Phosphorus (mg/L) Summary Data by Site in the Root River WatershedRacine Health Department, 8.3.11 ‐ 3.20.13
Site Code
Site (Upstream to
Downstream)
Number of
SamplesMedian
Number of
ExceedancesCorrelations
State
Std.
Rec'd
Std.
PrecipitationTurbidity
24‐hr 48‐hr 72‐hrRange
Use Classification Color Code and Relevant State and Recommended Standard(s)
Use Classification and Color Code: State Standard (Std.) Recommended Standard (Rec'd Std.)
Source: WI DNR NR 102.06 (3)(b), NR 102.06 (6)(d), and NR 104.06 (1), Table 4.
Fish and Aquatic Life (FAL), Full Recreational Use
Limited Forage Fish (LFF), Limited Recreational Use
Limited Aquatic Life (LAL), Limited Recreational Use Not applicable (N/A)
Not greater than 0.075 mg/L Not applicable
Not greater than 0.075 mg/L

3‐23
Table 3 – 13, Seasonal total phosphorous concentrations by sampling site.
1 Legend Creek 3 0.104 0.082 ‐ 0.178 4 0.043 0.019 ‐ 0.087 2 0.032 0.020 ‐ 0.043 4 0.056 0.031 ‐ 0.127
2 RRC‐Union Grove 3 0.517 0.494 ‐ 0.618 4 0.422 0.256 ‐ 0.477 2 0.270 0.176 ‐ 0.364 4 0.225 0.159 ‐ 0.363
3 Raymond Creek 3 0.642 0.132 ‐ 1.810 4 0.154 0.028 ‐ 0.988 1 0.091 0.091 ‐ 0.091 4 0.048 0.031 ‐ 0.158
4 RRC‐West 3 0.271 0.091 ‐ 0.566 4 0.160 0.053 ‐ 0.219 2 0.136 0.133 ‐ 0.139 4 0.096 0.077 ‐ 0.228
5 RRC‐Fonk's 3 3.900 3.440 ‐ 4.210 4 1.342 0.224 ‐ 4.430 2 1.042 0.134 ‐ 1.950 4 0.212 0.172 ‐ 2.550
6 RRC‐East 3 1.100 0.203 ‐ 1.260 4 0.104 0.050 ‐ 0.256 2 0.078 0.036 ‐ 0.119 4 0.090 0.040 ‐ 0.460
7 RRC‐Main 3 0.369 0.204 ‐ 0.892 4 0.101 0.069 ‐ 0.145 2 0.123 0.105 ‐ 0.140 4 0.090 0.068 ‐ 0.292
8 Husher Creek 3 0.340 0.145 ‐ 0.376 4 0.085 0.043 ‐ 0.132 2 0.099 0.032 ‐ 0.165 4 0.083 0.043 ‐ 0.208
9 38 at MKE Co Line 3 0.213 0.120 ‐ 0.592 4 0.093 0.047 ‐ 0.106 0 ‐ ‐ 4 0.086 0.054 ‐ 0.189
10 5 Mile Road 3 0.236 0.124 ‐ 0.497 4 0.073 0.045 ‐ 0.101 2 0.087 0.038 ‐ 0.135 4 0.085 0.052 ‐ 0.181
11 Hoods Creek 3 0.588 0.329 ‐ 0.797 4 0.165 0.083 ‐ 0.256 1 0.179 0.179 ‐ 0.179 4 0.106 0.060 ‐ 0.384
12 Johnson Park 3 0.286 0.119 ‐ 0.467 4 0.066 0.046 ‐ 0.071 2 0.094 0.043 ‐ 0.144 4 0.081 0.051 ‐ 0.202
13 31 and 4 Mile 3 0.250 0.128 ‐ 0.477 4 0.066 0.046 ‐ 0.078 0 ‐ ‐ 4 0.081 0.054 ‐ 0.196
14 Horlick Dam 3 0.281 0.125 ‐ 0.326 4 0.073 0.059 ‐ 0.097 2 0.092 0.047 ‐ 0.136 4 0.106 0.080 ‐ 0.205
15 Steelhead Facility 3 0.246 0.103 ‐ 0.287 4 0.071 0.047 ‐ 0.110 1 0.044 0.044 ‐ 0.044 4 0.100 0.069 ‐ 0.192
16 Liberty St. Bridge 3 0.264 0.101 ‐ 0.290 4 0.079 0.068 ‐ 0.104 1 0.043 0.043 ‐ 0.043 4 0.121 0.063 ‐ 0.182
17 REC 3 0.266 0.125 ‐ 0.337 4 0.091 0.077 ‐ 0.197 1 0.040 0.040 ‐ 0.040 4 0.096 0.071 ‐ 0.176
18 Chartroom 3 0.094 0.054 ‐ 0.097 4 0.061 0.049 ‐ 0.064 0 ‐ ‐ 4 0.103 0.077 ‐ 0.136
Total Phosphorus (mg/L) Seasonal Data by Site in the Root River WatershedRacine Health Department, 8.3.11 ‐ 3.20.13
Site Code
Site (Upstream to
Downstream)
SUMMER FALL WINTER SPRING
# Range Range Range Range
# = number of samples
Use Classification Color Code and Relevant State and Recommended Standard(s)
# MedianMedian # MedianMedian
Source: WI DNR NR 102.06 (3)(b), NR 102.06 (6)(d), and NR 104.06 (1), Table 4.
Not applicable
Not applicable
Not greater than 0.075 mg/L
Fish and Aquatic Life (FAL), Full Recreational Use Not greater than 0.075 mg/L
Limited Forage Fish (LFF), Limited Recreational Use
Limited Aquatic Life (LAL), Limited Recreational Use
Use Classification and Color Code: State Standard Recommended Standard
#

3‐24
Table 3 – 14, Median dissolved oxygen concentrations with correlation to precipitation, water temperature, flow rate and nutrients by site.
r p r p r p r p r p r p
1 Legend Creek 121 8.8 3.5 ‐ 15.8 12 ‐ 0.11 0.23 0.16 0.09 0.20 0.03 ‐0.86 0.00 0.59 0.01 ‐0.78 0.00
2 RRC‐Union Grove 123 8.5 5.3 ‐ 15.3 0 0 0.08 0.36 0.11 0.24 0.13 0.17 ‐0.50 0.00 0.59 0.00 ‐0.71 0.01
3 Raymond Creek 115 6.9 0.1 ‐ 17.1 45 ‐ 0.04 0.65 0.05 0.56 0.04 0.71 ‐0.44 0.00 0.74 0.00 ‐0.76 0.01
4 RRC‐West 120 10.7 3.7 ‐ 23.3 2 ‐ ‐0.09 0.36 0.01 0.88 0.09 0.35 ‐0.33 0.00 0.03 0.79 0.53 0.09
5 RRC‐Fonk's 118 7.1 2.8 ‐ 14.1 0 33 ‐0.02 0.82 ‐0.01 0.94 0.02 0.85 ‐0.51 0.00 0.48 0.00 ‐0.60 0.05
6 RRC‐East 121 7.6 0.7 ‐ 14.5 24 40 0.08 0.39 0.08 0.42 0.08 0.39 ‐0.71 0.00 0.55 0.00 ‐0.85 0.00
7 RRC‐Main 121 10.7 2.2 ‐ 27.5 14 ‐ ‐0.21 0.02 ‐0.12 0.18 ‐0.15 0.11 ‐0.15 0.13 0.22 0.02 ‐0.04 0.90
8 Husher Creek 118 7.6 0.8 ‐ 14.5 26 ‐ 0.11 0.23 0.06 0.50 0.12 0.22 ‐0.75 0.00 0.61 0.00 ‐0.70 0.01
9 38 at MKE Co Line 106 6.7 1.7 ‐ 14.7 22 ‐ 0.01 0.96 0.05 0.61 0.11 0.27 ‐0.81 0.00 0.54 0.00 ‐0.87 0.00
10 5 Mile Road 113 7.8 2.6 ‐ 13.7 12 ‐ 0.06 0.52 0.01 0.89 ‐0.01 0.93 ‐0.82 0.00 0.35 0.00 ‐0.68 0.02
11 Hoods Creek 116 8.0 3.0 ‐ 15.2 1 9 0.13 0.17 0.14 0.15 0.14 0.15 ‐0.76 0.00 0.66 0.00 ‐0.83 0.00
12 Johnson Park 119 10.2 3.2 ‐ 19.6 5 ‐ 0.02 0.85 ‐0.01 0.89 ‐0.06 0.53 ‐0.58 0.00 0.40 0.00 ‐0.54 0.08
13 31 and 4 Mile 105 7.9 3.4 ‐ 14.4 10 ‐ 0.04 0.69 0.02 0.83 0.00 1.00 ‐0.94 0.00 0.37 0.00 ‐0.85 0.00
14 Horlick Dam 124 10.0 6.6 ‐ 16.1 0 ‐ 0.04 0.63 0.01 0.94 ‐0.05 0.59 ‐0.86 0.00 0.43 0.00 ‐0.80 0.00
15 Steelhead Facility 118 10.3 5.0 ‐ 16.6 1 ‐ 0.07 0.45 0.03 0.71 ‐0.03 0.79 ‐0.73 0.00 0.51 0.00 ‐0.36 0.26
16 Liberty St. Bridge 121 10.3 4.6 ‐ 16.5 2 ‐ 0.13 0.17 0.07 0.45 ‐0.03 0.78 ‐0.72 0.00 0.54 0.00 ‐0.57 0.06
17 REC 107 10.1 3.5 ‐ 15.6 3 ‐ 0.01 0.89 ‐0.03 0.73 ‐0.04 0.71 ‐0.65 0.00 0.32 0.00 ‐0.33 0.31
18 Chartroom 101 8.3 3.3 ‐ 14.6 10 ‐ 0.02 0.88 ‐0.10 0.32 ‐0.15 0.12 ‐0.73 0.00 0.26 0.01 0.16 0.63
Volumetric
Flow Rate
Phosphorus
Concentration
Significant p values < 0.05
Dissolved Oxygen Concentration (mg/L) Summary Data by Site in the Root River WatershedRacine Health Department, 8.3.11 ‐ 3.20.13
Site Code
Site (Upstream to
Downstream)
Number
of
Samples
Median
Number of
ExceedancesCorrelations
State
Std.
Rec'd
Std.
Precipitation Water
Temperature24‐hr 48‐hr 72‐hrRange
r = correlation coefficient
Use Classification Color Code and Relevant State and Recommended Standard(s)
Use Classification and Color Code: State Standard (Std.) Recommended Standard (Rec'd Std.)
Limited Aquatic Life (LAL), Limited Recreational Use Not less than 1.0 mg/L
Source: WI DNR NR 102.04 (4)(a), NR 104.02 (3)(a)2.a, and NR 104.02 (3)(b)2.a
Fish and Aquatic Life (FAL), Full Recreational Use Not less than 5.0 mg/L
Limited Forage Fish (LFF), Limited Recreational Use Not less than 3.0 mg/L
Not applicable
Not less than 5.0 mg/L
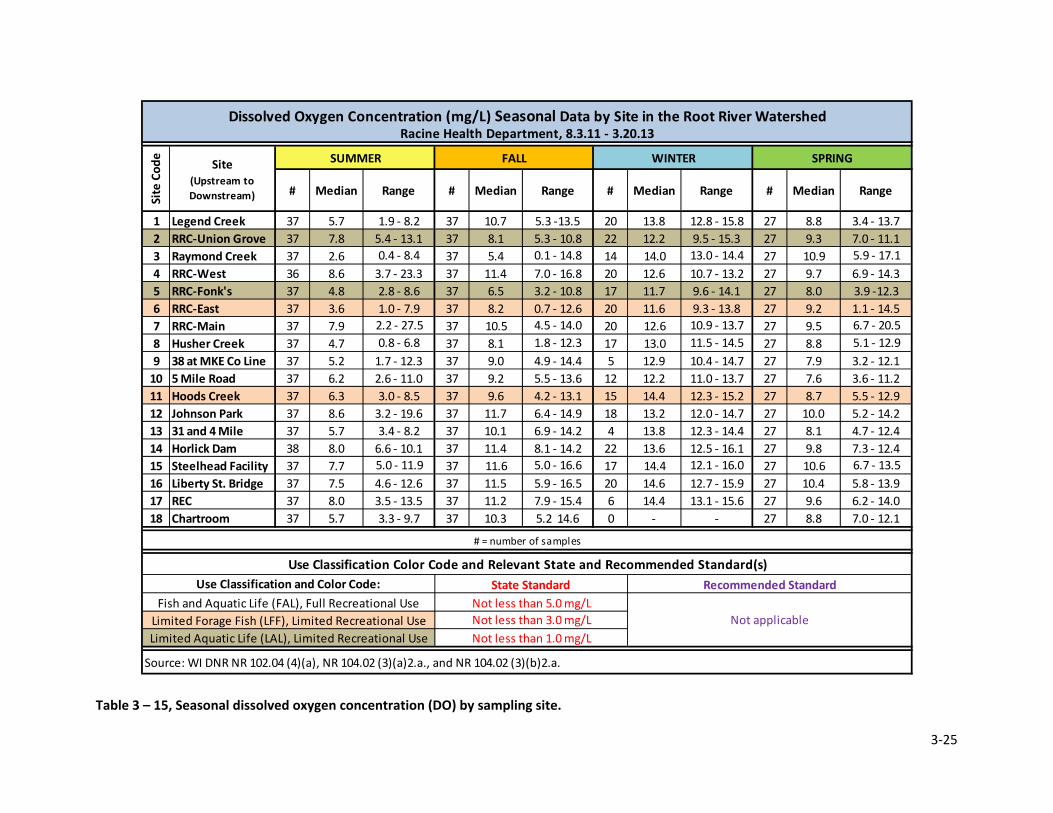
3‐25
Table 3 – 15, Seasonal dissolved oxygen concentration (DO) by sampling site.
1 Legend Creek 37 5.7 37 10.7 20 13.8 27 8.8
2 RRC‐Union Grove 37 7.8 37 8.1 22 12.2 27 9.3
3 Raymond Creek 37 2.6 37 5.4 14 14.0 27 10.9
4 RRC‐West 36 8.6 37 11.4 20 12.6 27 9.7
5 RRC‐Fonk's 37 4.8 37 6.5 17 11.7 27 8.0
6 RRC‐East 37 3.6 37 8.2 20 11.6 27 9.2
7 RRC‐Main 37 7.9 37 10.5 20 12.6 27 9.5
8 Husher Creek 37 4.7 37 8.1 17 13.0 27 8.8
9 38 at MKE Co Line 37 5.2 37 9.0 5 12.9 27 7.9
10 5 Mile Road 37 6.2 37 9.2 12 12.2 27 7.6
11 Hoods Creek 37 6.3 37 9.6 15 14.4 27 8.7
12 Johnson Park 37 8.6 37 11.7 18 13.2 27 10.0
13 31 and 4 Mile 37 5.7 37 10.1 4 13.8 27 8.1
14 Horlick Dam 38 8.0 37 11.4 22 13.6 27 9.8
15 Steelhead Facility 37 7.7 37 11.6 17 14.4 27 10.6
16 Liberty St. Bridge 37 7.5 37 11.5 20 14.6 27 10.4
17 REC 37 8.0 37 11.2 6 14.4 27 9.6
18 Chartroom 37 5.7 37 10.3 0 ‐ 27 8.8 7.0 ‐ 12.1
5.5 ‐ 12.9
5.2 ‐ 14.2
4.7 ‐ 12.4
7.3 ‐ 12.4
6.7 ‐ 13.5
1.1 ‐ 14.5
6.7 ‐ 20.5
5.1 ‐ 12.9
3.2 ‐ 12.1
3.6 ‐ 11.2
3.4 ‐ 13.7
7.0 ‐ 11.1
5.9 ‐ 17.1
6.9 ‐ 14.3
3.9 ‐12.3
12.5 ‐ 16.1
12.1 ‐ 16.0
12.7 ‐ 15.9
13.1 ‐ 15.6
5.8 ‐ 13.9
6.2 ‐ 14.0
12.8 ‐ 15.8
9.5 ‐ 15.3
13.0 ‐ 14.4
10.7 ‐ 13.2
9.6 ‐ 14.1
9.3 ‐ 13.8
10.9 ‐ 13.7
11.5 ‐ 14.5
10.4 ‐ 14.7
4.6 ‐ 12.6
3.5 ‐ 13.5
0.8 ‐ 6.8
1.7 ‐ 12.3
2.6 ‐ 11.0
‐
5.9 ‐ 16.5
7.9 ‐ 15.4
5.2 14.6
11.0 ‐ 13.7
12.3 ‐ 15.2
12.0 ‐ 14.7
12.3 ‐ 14.4
5.5 ‐ 13.6
4.2 ‐ 13.1
6.4 ‐ 14.9
6.9 ‐ 14.2
8.1 ‐ 14.2
5.0 ‐ 16.6
3.4 ‐ 8.2
6.6 ‐ 10.1
5.0 ‐ 11.9
5.3 ‐13.5
5.3 ‐ 10.8
0.1 ‐ 14.8
7.0 ‐ 16.8
3.2 ‐ 10.8
0.7 ‐ 12.6
4.5 ‐ 14.0
1.8 ‐ 12.3
4.9 ‐ 14.4
Dissolved Oxygen Concentration (mg/L) Seasonal Data by Site in the Root River WatershedRacine Health Department, 8.3.11 ‐ 3.20.13
Site Code
Site (Upstream to
Downstream)
SUMMER FALL WINTER SPRING
# Range Range Range Range
Use Classification and Color Code: State Standard Recommended Standard
# MedianMedian # MedianMedian
# = number of samples
Use Classification Color Code and Relevant State and Recommended Standard(s)
#
1.9 ‐ 8.2
5.4 ‐ 13.1
0.4 ‐ 8.4
3.7 ‐ 23.3
2.8 ‐ 8.6
1.0 ‐ 7.9
2.2 ‐ 27.5
3.0 ‐ 8.5
3.2 ‐ 19.6
3.3 ‐ 9.7
Source: WI DNR NR 102.04 (4)(a), NR 104.02 (3)(a)2.a., and NR 104.02 (3)(b)2.a.
Not less than 1.0 mg/L
Not less than 3.0 mg/L
Fish and Aquatic Life (FAL), Full Recreational Use
Not applicableLimited Forage Fish (LFF), Limited Recreational Use
Limited Aquatic Life (LAL), Limited Recreational Use
Not less than 5.0 mg/L

3‐26
Table 3 – 16, E. coli summary data, by site, including frequency of recreational water quality standard exceedance and correlation to
precipitation, water temperature, flow rate and turbidity.
r p r p r p r p r p r p
1 Legend Creek 121 175 5 ‐ 24,192 47 ‐ 0.27 0.01 0.38 0.01 0.36 0.01 0.40 0.00 ‐0.08 0.41 0.43 0.00
2 RRC‐Union Grove 123 3,837 200 ‐ 41,060 N/A 121 0.08 0.36 0.04 0.64 0.03 0.78 0.01 0.87 ‐0.20 0.04 0.16 0.09
3 Raymond Creek 115 441 20 ‐ 161,600 75 ‐ 0.22 0.02 0.25 0.01 0.28 0.00 0.02 0.82 ‐0.09 0.37 0.25 0.01
4 RRC‐West 121 200 5 ‐ 241,920 50 ‐ 0.09 0.33 0.18 0.04 0.18 0.05 ‐0.18 0.04 0.52 0.00 0.60 0.00
5 RRC‐Fonk's 118 819 50 ‐ 57,940 N/A 103 0.22 0.02 0.13 0.16 0.13 0.15 0.27 0.00 ‐0.40 0.00 0.10 0.28
6 RRC‐East 121 84 5 ‐ 3,180 N/A 26 0.21 0.02 0.34 0.00 0.36 0.00 ‐0.05 0.61 0.37 0.00 0.37 0.00
7 RRC‐Main 121 109 5 ‐ 23,820 34 ‐ 0.26 0.01 0.36 0.00 0.36 0.00 ‐0.11 0.24 0.38 0.00 0.39 0.00
8 Husher Creek 118 555 5 ‐ 19,560 85 ‐ 0.17 0.08 0.14 0.12 0.10 0.29 0.14 0.13 0.09 0.39 0.13 0.15
9 38 at MKE Co Line 106 109 5 ‐ 3,654 31 ‐ 0.28 0.00 0.40 0.00 0.40 0.00 0.45 0.00 0.04 0.67 0.59 0.00
10 5 Mile Road 113 108 10 ‐ 3,654 38 ‐ 0.24 0.01 0.36 0.00 0.35 0.00 0.28 0.00 0.33 0.00 0.45 0.00
11 Hoods Creek 116 200 10 ‐ 13,540 N/A 50 0.28 0.00 0.41 0.00 0.41 0.00 0.23 0.01 0.08 0.39 0.66 0.00
12 Johnson Park 119 85 5 ‐ 3,270 25 ‐ 0.32 0.00 0.33 0.00 0.38 0.00 0.30 0.00 0.32 0.00 0.44 0.00
13 31 and 4 Mile 105 100 5 ‐ 1,785 33 ‐ 0.17 0.08 0.36 0.00 0.32 0.00 0.45 0.00 0.04 0.69 0.32 0.00
14 Horlick Dam 124 50 5 ‐ 129,965 16 ‐ 0.14 0.11 0.16 0.08 0.28 0.00 0.09 0.33 0.29 0.00 0.44 0.00
15 Steelhead Facility 118 105 5 ‐ 12,033 35 ‐ 0.24 0.01 0.29 0.00 0.34 0.00 0.22 0.02 0.00 1.00 0.31 0.00
16 Liberty St. Bridge 121 246 5 ‐ 11,199 62 ‐ 0.17 0.06 0.27 0.00 0.35 0.00 0.42 0.00 ‐0.26 0.00 0.11 0.25
17 REC 107 187 10 ‐ 6,488 42 ‐ 0.33 0.00 0.47 0.00 0.54 0.00 0.00 0.98 ‐0.06 0.55 ‐0.02 0.82
18 Chartroom 101 50 5 ‐ 3,873 15 ‐ 0.51 0.00 0.49 0.00 0.55 0.00 ‐0.14 0.17 0.45 0.00 0.43 0.00
Significant p values < 0.05
Volumetric
Flow RateTurbidity
State Standard (Std.)
Not greater than 235 MPN/100 mL
Recommended Standard (Rec'd Std.)
Not applicable (N/A)
Not greater than 235 MPN/100 mL
Single Sample Standard E. coli (MPN/100 mL) Summary Data by Site in the Root River WatershedRacine Health Department, 8.3.11 ‐ 3.20.13
Site Code
Site (Upstream to
Downstream)
Number
of
Samples
Median
Number of
ExceedancesCorrelations
State
Std.
Rec'd
Std.
Precipitation Water
Temperature24‐hr 48‐hr 72‐hrRange
r = correlation coefficient
Use Classification Color Code and Relevant State and Recommended Standard(s)
Use Classification and Color Code:
Fish and Aquatic Life (FAL), Full Recreational Use
Limited Forage Fish (LFF), Limited Recreational Use
Limited Aquatic Life (LAL), Limited Recreational Use
Source: WI DNR NR 102.12 (1), (Clayton et al., 2012)
Not applicable (N/A)

3‐27
Table 3 – 17, Median seasonal E. coli concentrations by sampling site.
1 Legend Creek 37 389 37 200 20 69 27 100
2 RRC‐Union Grove 37 3,730 37 3,270 22 6,880 27 3,360
3 Raymond Creek 37 512 37 354 14 1,190 27 310
4 RRC‐West 37 110 37 100 20 352 27 300
5 RRC‐Fonk's 37 1,354 37 1,710 17 310 27 591
6 RRC‐East 37 86 37 50 20 212 27 52
7 RRC‐Main 37 100 37 63 20 451 27 100
8 Husher Creek 37 573 37 630 17 345 27 627
9 38 at MKE Co Line 37 200 37 50 5 323 27 100
10 5 Mile Road 37 211 37 50 12 239 27 100
11 Hoods Creek 37 480 37 109 15 609 27 100
12 Johnson Park 37 132 37 41 18 134 27 100
13 31 and 4 Mile 37 249 37 50 4 531 27 100
14 Horlick Dam 38 58 37 50 22 47 27 50
15 Steelhead Facility 37 200 37 100 17 145 27 63
16 Liberty St. Bridge 37 554 37 158 20 128 27 100
17 REC 37 231 37 185 6 639 27 95
18 Chartroom 37 50 37 50 0 ‐ 27 50 5 ‐ 970
50 ‐ 2,160
50 ‐ 1,043
20 ‐ 860
5 ‐ 630
50 ‐ 1,723
20 ‐ 2,010
50 ‐ 6,910
50 ‐ 2,187
41 ‐ 1,860
50 ‐ 1,296
5 ‐ 2,495
310 ‐ 24,192
50 ‐ 2,590
41 ‐ 7,120
100 ‐ 29,090
5 ‐ 1,081
5 ‐ 1,658
5 ‐ 959
10 ‐ 1,137
50 ‐ 3,076
50 ‐ 933
10 ‐ 337
200 ‐ 41,060
216 ‐ 15,531
132 ‐ 3,654
50 ‐ 2,590
41 ‐ 1,515
52 ‐ 2,359
98 ‐ 988
51 ‐ 1,850
41 ‐ 1,500
97 ‐ 4,352
10 ‐ 6,440
52 ‐ 4,611
31 ‐ 3,654
10 ‐ 3,654
‐
10 ‐ 11,199
50 ‐ 6,488
5 ‐ 2,602
20 ‐ 1,246
41 ‐ 1,935
5 ‐ 906
74 ‐ 1,187
State Standard Recommended Standard
50 ‐ 3,654
20 ‐ 2,430
E. coli (MPN/100 mL) Seasonal Data by Site in the Root River WatershedRacine Health Department, 8.3.11 ‐ 3.20.13
Site Code
Site (Upstream to
Downstream)
SUMMER FALL WINTER SPRING
# Range RangeRangeRange
5 ‐ 3,873
5 ‐ 4,190
200 ‐ 41,060
20 ‐ 161,600
5 ‐ 241,920
50 ‐ 15,150
# = number of samples
Use Classification Color Code and Relevant State and Recommended Standard(s)
#
50 ‐ 24,192
410 ‐ 32,550
50 ‐ 24,192
10 ‐ 1,090
200 ‐ 57,940
5 ‐ 1,198
20 ‐ 697
5 ‐ 3,180
5 ‐ 23,820
5 ‐ 19,560
5 ‐ 3,090
10 ‐ 1,970
10 ‐ 13,540
5 ‐ 3,270
5 ‐ 1,220
5 ‐ 740
5 ‐ 12,033
50 ‐ 1,785
5 ‐ 129,965
Source: WI DNR NR 102.12 (1), (Clayton et al, 2012)
Fish and Aquatic Life (FAL), Full Recreational Use
Limited Forage Fish (LFF), Limited Recreational Use
Limited Aquatic Life (LAL), Limited Recreational UseNot applicable
Single Sample: Not greater than 235 MPN/100 mL
Single Sample:
Not greater than 235 MPN/100 mL
Not applicable
Use Classification and Color Code:
# MedianMedian # MedianMedian

3‐28
Table 3 – 18, Long term compliance with the State of WI geometric mean standard for E. coli in surface
water.
2011 2012 2013
1 Legend Creek > 126 50 34 68 8, 9, 10 4, 5, 6, 7, 8, 9, 10, 11, 12 1, 2, 3
2 RRC‐Union Grove N/A; > 126 52 52 100 8, 9, 10 4, 5, 6, 7, 8, 9, 10, 11, 12 1, 2, 3
3 Raymond Creek > 126 45 42 93 8, 9, 10 4, 5, 6, 7, 8, 9, 10, 11, 12 2, 3
4 RRC‐West > 126 50 29 58 8, 9, 10 4, 5, 6, 7, 8, 9, 10, 11, 12 1, 2, 3
5 RRC‐Fonk's N/A; > 126 48 48 100 8, 9, 10 4, 5, 6, 7, 8, 9, 10, 11, 12 1, 2
6 RRC‐East N/A; > 126 50 12 24 8, 9, 10 4, 5, 6, 7, 8, 9, 10, 11, 12 1, 2, 3
7 RRC‐Main > 126 50 26 52 8, 9, 10 4, 5, 6, 7, 8, 9, 10, 11, 12 1, 2, 3
8 Husher Creek > 126 46 43 93 8, 9, 10 4, 5, 6, 7, 8, 9, 10, 11, 12 1, 2
9 38 at MKE Co Line > 126 42 26 62 8, 9, 10 4, 5, 6, 7, 8, 9, 10, 11, 12 ‐
10 5 Mile Road > 126 43 26 60 8, 9, 10 4, 5, 6, 7, 8, 9, 10, 11, 12 2
11 Hoods Creek N/A; > 126 45 31 69 8, 9, 10 4, 5, 6, 7, 8, 9, 10, 11, 12 2, 3
12 Johnson Park > 126 48 19 40 8, 9, 10 4, 5, 6, 7, 8, 9, 10, 11, 12 1, 2, 3
13 31 and 4 Mile > 126 42 22 52 8, 9, 10 4, 5, 6, 7, 8, 9, 10, 11, 12 ‐
14 Horlick Dam > 126 53 9 17 8, 9, 10 4, 5, 6, 7, 8, 9, 10, 11, 12 1, 2, 3
15 Steelhead Facility > 126 47 23 49 8, 9, 11 4, 5, 6, 7, 8, 9, 10, 11, 12 1
16 Liberty St. Bridge > 126 50 32 64 8, 9, 11 4, 5, 6, 7, 8, 9, 10, 11, 12 1, 2, 3
17 REC > 126 42 31 74 8, 9, 11 4, 5, 6, 7, 8, 9, 10, 11, 12 ‐
18 Chartroom > 126 42 4 10 8, 9, 11 4, 5, 6, 7, 8, 9, 10, 11, 12 ‐
Long‐Term Dataset Evaluation* of E. coli Compliance
with WI DNR Recreational Use Criterion in the Root River Watershed Racine Health Department, 8.3.11 ‐ 3.20.13
% of
Exceedances
Use Classification Color Code and Relevant Standard(s)
*Sites have different numbers of valid geomeans due to winter accessibil ity; ** Numbers equate to calendar months, i .e 8 is August; 4 is April
Months** with Valid Geomeans (Exceedances highlighted red or purple)
Site Code
Site (Upstream to
Downstream)
Geomean
Criterion (MPN/100 mL)
# of
Exceedances
# of Valid
Geomeans*
Sources: Wisconsin 2012 Consolidated Assessment and Listing Methodology (WisCALM) for Clean Water Act Section 305(b), 314, and 303(d)
Integrated Reporting. DNR Bureau of Water Quality; DNR Personnel.
The WI DNR may util ize this method for E. coli measurements in Great Lakes tributaries (NR 102.12) to determine if a water body should be on the
Impaired Waters List. If ≥1 of the monthly‐aggregated geometric means exceeds the criterion of 126 cfu/100 mL (equivalent to MPN/100 mL) the
water body will be identified as not supporting its recreation use and placed on the Impaired Waters List. The pollutant is l isted as E. coli and the
impairment is identified as "Recreational Restrictions ‐ Pathogens." WI DNR will propose to remove a waterbody from the Impaired Waters List
when the monthly‐aggregated geometric means of data collected during the previous five years meet the criterion of 126 cfu/100 mL.
*Utilizes a Geometric Mean Calculation of at least five samples in a month to determine compliance with 126 MPN/100 mL or less
of E. coli bacteria. In contrast to the single sample maximum criterion of 235 MPN/100 mL, this calculation assesses for chronic
conditions of high bacteria levels that present a human health risk and impede recreational use.
Limited Aquatic Life (LAL), Limited Recreational UseNot applicable
Not greater than 126 MPN/100 mL
Not greater than 126 MPN/100 mL
Not applicable
Limited Forage Fish (LFF), Limited Recreational Use
Full Fish and Aquatic Life (FAL), Full Recreational Use
Use Classification Color Code State Standard Recommended Standard

3‐29
Table 3 – 19, Results of total and human‐specific Bacteroides marker testing at select open water,
stormwater outfall sites.
Human
Bacteroides (CN/100 mL)
Total Bacteroides (CN/100 mL)
CN/
100 mL
> 5,000
Human Bact.
: Total Bact.
> 5.1%
1 Legend Creek 2 No All BLD 70,556 ‐ 226,067 0 0
2 RRC‐Union Grove 10 Yes 10,476 ‐ 657,184 11,571 ‐ 19,913,483 10 8
3 Raymond Creek 2 No BLD ‐ 960 2,209,115 ‐ 4,982,281 0 0
4 RRC‐West 2 No BLD ‐ 603 1,289,744 ‐ 3,031,584 0 0
5 RRC‐Fonk's 11 Yes 7,181 ‐ 1,304,543 3,412 ‐ 20,762,708 11 11
8 Husher Creek 2 No 17,774 ‐ 151,660 2,295,677 ‐ 57,333,652 2 0
11 Hoods Creek 2 No BLD ‐ 634 185,038 ‐ 293,351 0 0
16 Liberty St. Bridge 2 No 574 ‐ 1,072 1,262,751 ‐ 1,838,875 0 0
20 Upstream‐UG Effluent 3 Yes BLD ‐ 148,235 20,157 ‐ 1,894,313 1 1
21 Union Grove Effluent 7 Yes 15,295 ‐ 1,055,257 13,006 ‐ 51,759,014 7 6
28 Upstream‐Fonk's Effluen 4 Yes BLD ‐ 3,705,077 36,606 ‐ 106,070,288 3 4
29 Fonk's Effluent 10 Yes 37,168 ‐ 5,023,888 14,333 ‐ 112,380,272 10 9
32 Horlick Dam‐Northwest 8 Yes BLD ‐ 6,381 BLD ‐ 21,475 1 2
33 Horlick Dam‐East 3 Yes 576 ‐ 9,910 BLD ‐ 1,430,696 1 1
34 Horlick Dam‐Southwest 17 Yes BLD ‐ 1,636 BLD ‐ 49,522 0 3
35 Luedtke off Dominic 9 Yes 1,061 ‐ 3,477,247 BLD ‐ 2,932,789 8 8
36 Luedtke at Spring 16 Yes BLD ‐ 6,359 BLD ‐ 175,907,695 1 1
37 Lutheran High School 16 Yes BLD ‐ 107,689 BLD ‐ 15,708,960 6 4
38 Luedtke & Rupert 15 Yes BLD ‐ 1,649 BLD ‐ 1,308,061 0 0
40 Liberty Street 9 Yes 439,177 ‐ 58,957,943 6,251,537 ‐ 359,906,402 9 7
41 Washington Park 3 15 Yes BLD ‐ 18,032 659 ‐ 77,343 1 1
42 Washington Park 1 16 Yes 3,524 ‐ 11,203,063 17,083 ‐ 304,013,976 14 6
43 Washington Park 2 17 Yes 10,040 ‐ 523,920 60,922 ‐ 6,209,783 17 13
44 Water Street Composite 17 Yes BLD ‐ 59,720 9,104 ‐ 30,395,619 11 6
Human Bacteroides Summary Data at Select Surface (#1‐18), Extra Canal (#19‐31), and
Stormwater Outfall (#32‐44) Sites in the Root River Watershed
Use Classification Color Code and Relevant Standard:
Use Classification and Color Code Recommended Standard
Racine Health Department, 8.3.11 ‐ 3.20.13
# of Exceedances Range
(minimum to maxium value)
(BLD=Below Limit of Detection)
Site Code
Site (Upstream to
Downstream)
# of
Samples
Prior
Rainfall (Yes/No)
Fish and Aquatic Life (FAL), Full Rec'l Use
Limited Forage Fish (LFF), Limited Rec'l Use
Limited Aquatic Life (LAL), Limited Rec'l Use
Source: (Sauer et al., 2012)
Wastewater Effluent or Stormwater Outfall
Two recommended standards for thresholds indicating possible
human sewage contamination are used: a copy number (CN)/100
mL no greater than 5,000 and a ratio of human to total
Bacteroides (Bact .) no greater than 5.1%

3‐30
Table 3 – 20, Historic and current fish and macro‐invertebrate community assessments, by site.
Site Code Site
(Upstream to
Downstream)
Fish
Assessment
Historical Data
Current Fish
Assessment (WI DNR in 2011)
Change in Fish
Community^
MI Assessment
Historical
Data***
Current MI
Assessment (WI DNR in 2011)
Change in MI
Community^
1 Legend Creek ‐ ‐ ‐ ‐ 6.88 1st Record
2 RRC‐Union Grove ‐ ‐ ‐ 5.95 6.41 Same
3 Raymond Creek ‐ ‐ ‐ 8.91 6.98 Sign. Improved^
4 RRC‐West ‐ 22 ‐ 6.70 7.54 Declined
5 RRC‐Fonk's ‐ ‐ ‐ 8.35 7.47 Improved
6 RRC‐East ‐ 29 ‐ 6.66 7.04 Same
7 RRC‐Main ‐ ‐ ‐ ‐ ‐ ‐
at 5 Mile Road ‐ 27 ‐ 7.77 8.01 Same
at 7 Mile Road ‐ ‐ ‐ 5.71 7.82 Sign. Declined^
8 Husher Creek ‐ ‐ ‐ ‐ ‐ ‐
at 5 Mile Road ‐ 10 ‐ ‐ ‐ ‐
at 7‐1/2 Mile Road ‐ 31 ‐ 7.37 7.15 Same
9 38 at MKE Co Line 5* 32 Sign.^ Improved 8.16 7.57 Improved
10 5 Mile Road ‐ 56 ‐ 5.58 5.74 Same
11 Hoods Creek ‐ ‐ ‐ 6.37 6.08 Same
12 Johnson Park 32* ‐ ‐ 6.25 5.22 Improved
13 31 and 4 Mile 52** 30 Declined 5.55 5.79 Same
14 Horlick Dam ‐ ‐ ‐ ‐ ‐ ‐
15 Steelhead Facility ‐ ‐ ‐ ‐ ‐ ‐
at Lincoln Park 47 ** 35 Same 5.32 5.56 Declined
16 Liberty St. Bridge ‐ ‐ ‐ ‐ ‐ ‐
17 REC ‐ ‐ ‐ ‐ ‐ ‐
18 Chartroom ‐ ‐ ‐ ‐ ‐ ‐
Good Fair Fairly Poor Poor Very Poor
Source: Craig Helker, Water Resources Management Specialist, WI DNR
Use Classification Color Code and Relevant Standard:
Use Classification and Color Code Recommended Standard
Fish and Aquatic Life (FAL)Index of Biotic Integrity (IBI) applied to all fish assessments and Hilsenhoff
Index of Biotic Integrity (HBI) applied to macroinvertebrate assessmentsLimited Forage Fish (LFF)
Limited Aquatic Life (LAL)
Fish and Macroinvertebrate assessment sites could not always be exactly matched to the surface water sampling location.
Historical (1979 ‐ 2003) and Current (2011) Fish and Macroinvertebrate (MI) Community Assessments
by Site in the Root River Watershed
*Collected by Wisconsin Lutheran College in 2003; ** Collected by WI DNR in 2001; *** Collected by WI DNR once between 1979 to 2000
̂Sign. = Significantly. A significant change occurs when the assessment rating increases or decreases by two categories.
Rating Color Code:

3‐31
Table 3 – 21, Results of additional testing, Root River Canal – West Branch (June 2012).
Site Code
Site
(Upstream to Downstream)
E. coli Count
(MPN/100 mL)
Water
Temperature
(˚C)
Dissolved
Oxygen
(mg/L)
pH
(s.u.)
Specific
Conductivity
(µS/cm)
Turbidity
(NTU)
19 W. Puetz (US‐canal) 203 18.9 3.1 7.7 1,418 18.3
20 Upstream of UG Effluent 359 15.2 9.8 8.0 1,837 5.4
21 Union Grove Effluent 24,192 18.7 8.3 7.8 2,620 4.2
2 RRC‐Union Grove 24,192 19.4 9.3 7.8 2,620 3.6
22 RRC‐West at Oakdale Rd 313 20.2 10.0 8.0 1,970 5.3
23 UG Tributary at 61st Dr 1,153 16.9 17.0 8.1 745 2.6
24 RRC‐West at Hwy 20 134 21.3 22.5 8.7 1,719 10.9
25 Yorkville Creek at Hwy 20 203 24.2 15.0 8.4 1,028 19.0
26 50th Rd Tributary 259 17.4 15.1 8.3 1,064 31.9
27 RRC‐West at 3 Mile Rd 187 19.2 14.2 8.2 1,644 8.5
3 Raymond Creek 683 15.7 6.9 7.9 945 9.3
4 RRC‐West 201 18.9 9.6 7.8 1,506 4.9
7 RRC‐Main 148 20.4 18.0 8.7 1,180 15.8
9 38 at MKE Co Line (DS‐canal) 148 18.8 3.6 7.7 1,195 16.3
20 Upstream of UG Effluent 813 20.7 9.5 7.9 1,888 4.8
21 Union Grove Effluent 10,462 19.7 8.7 7.7 2,330 2.4
2 RRC‐Union Grove 4,106 20.9 9.5 7.9 2,370 3.1
22 RRC‐West at Oakdale Rd 331 21.8 10.3 7.8 2,280 1.5
23 UG Tributary at 61st Dr 441 16.2 10.2 7.5 747 1.5
24 RRC‐West at Hwy 20 573 20.7 12.6 8.0 1,950 4.1
25 Yorkville Creek at Hwy 20 4,611 24.0 0.8 7.7 1,432 99.9
26 50th Rd Tributary 305 20.0 9.4 8.2 1,294 4.6
27 RRC‐West at 3 Mile Rd 161 20.5 8.2 7.9 1,628 1.2
3 Raymond Creek 10,462 17.2 6.9 8.1 905 13.6
4 RRC‐West 160 20.0 4.5 7.7 1,597 2.2
7 RRC‐Main 52 21.3 13.1 8.3 1,339 12.2
9 38 at MKE Co Line (DS‐canal) 249 19.7 6.3 8.2 1,038 10.3
E. coli Count
(MPN/100 mL)
Water
Temperature
(˚C)
Dissolved
Oxygen
(mg/L)
pH
(s.u.)
Specific
Conductivity
(µS/cm)
Turbidity
(NTU)
> 235 variable* < 5.0 < 6.0; > 9.0 < 150; > 1,500 > 25
N/A variable* < 3.0 < 6.0; > 9.0 < 150; > 1,500 > 25
N/A > 30 < 1.0 < 6.0; > 9.0 < 150; > 1,500 > 25
* See Ambient Water Temperature and Water Quality Temperature Criteria for Warm‐Small Waters Table
Use Classification Color Code and Relevant State and Recommended Standards
The values listed in this table represent standard violations and poor water quality.
Additional Root River Canal Western Branch Sites and Sampling Results 6.13.12 and 6.27.12
72‐hrs of 0.00 cm of precipitation on both days; US=upstream; DS=downstream
6.13.12
6.27.12
State Standard Recommended Standard N/A: not applicable
Surface Water Classification
Fish and Aquatic Life (FAL),
Full Recreational UseLimited Forage Fish (LFF),
Limited Recreational UseLimited Aquatic Life (LAL),
Limited Recreational Use
Effluent locations are evaluated based upon standards of their receiving water body.

3‐32
Table 3 – 22, Results of additional testing, Root River Canal – East Branch (June 2012).
Site Code
Site
(Upstream to Downstream)
E. coli Count
(MPN/100 mL)
Water
Temperature
(˚C)
Dissolved
Oxygen
(mg/L)
pH
(s.u.)
Specific
Conductivity
(µS/cm)
Turbidity
(NTU)
19 W. Puetz (US‐canal) 203 18.9 3.1 7.7 1,418 18.3
28 US of Fonk's Effluent 135 16.5 1.4 7.8 934 11.4
29 Fonk's Effluent 4,352 16.5 ‐ 7.0 1,547 1.4
5 RRC ‐ Fonk's 504 17.2 7.8 7.9 1,262 11.3
30 RRC‐East at Hwy 20 213 16.8 7.5 8.2 968 4.5
31 RRC‐East at 3 Mile Rd 74 20.5 2.0 7.8 997 4.0
6 RRC‐East 20 17.7 1.3 7.7 953 2.7
7 RRC‐Main 148 20.4 18.0 8.7 1,180 15.8
9 38 at MKE Co Line (DS‐canal) 148 18.8 3.6 7.7 1,195 16.3
28 US of Fonk's Effluent 4,106 20.5 5.5 8.0 987 25.6
29 Fonk's Effluent 2,187 20.4 8.9 7.0 1,472 2.6
5 RRC ‐ Fonk's 2,481 20.7 8.6 8.1 1,062 13.7
30 RRC‐East at Hwy 20 3,076 18.1 7.0 8.1 1,053 8.6
6 RRC‐East 97 19.6 3.7 8.0 843 8.9
7 RRC‐Main 52 21.3 13.1 8.3 1,339 12.2
9 38 at MKE Co Line (DS‐canal) 249 19.7 6.3 8.2 1,038 10.3
E. coli Count
(MPN/100 mL)
Water
Temperature
(˚C)
Dissolved
Oxygen
(mg/L)
pH
(s.u.)
Specific
Conductivity
(µS/cm)
Turbidity
(NTU)
> 235 variable* < 5.0 < 6.0; > 9.0 < 150; > 1,500 > 25
N/A variable* < 3.0 < 6.0; > 9.0 < 150; > 1,500 > 25
N/A > 30 < 1.0 < 6.0; > 9.0 < 150; > 1,500 > 25
* See Ambient Water Temperature and Water Quality Temperature Criteria for Warm‐Small Waters Table
Use Classification Color Code and Relevant State and Recommended Standards
The values listed in this table represent standard violations and poor water quality.
Additional Root River Canal Eastern Branch Sites and Sampling Results 6.13.12 and 6.27.12
72‐hrs of 0.00 cm of precipitation on both days; US=upstream; DS=downstream
6.13.12
6.27.12
State Standard Recommended Standard N/A: not applicable
Surface Water Classification
Fish and Aquatic Life (FAL),
Full Recreational Use
Limited Forage Fish (LFF),
Limited Recreational UseLimited Aquatic Life (LAL),
Limited Recreational Use
Effluent locations are evaluated based upon standards of their receiving water body.

3‐33
Table 3 – 23, Physical, chemical and microbiological quality of stormwater entering the lower Root River. Outfalls where exceedances of
recommended level occurred are designated with an “X”.
Water Temp
Turbidity
pH
Specific
Conductivity
Detergen
ts
Chlorine
Phosphorus
> 10%* > 70%**> 50%
CN
> 50%
Ratio> 0% > 25% > 0% > 50% > 50% > 0% > 0%
32 Horlick Dam‐Northwest X X X X ND
33 Horlick Dam‐East X X X X ND
34 Horlick Dam‐Southwest ND
35 Luedtke off Dominic X X X ND
36 Luedtke at Spring X X X X X ND
37 Lutheran High School X X ND
38 Luedtke & Rupert X X ND ND X ND
39 Upstream‐Liberty St X X X ND
40 Liberty Street X X X X X X X
41 Washington Park 3 ND
42 Washington Park 1 X X X ND
43 Washington Park 2 X X X ND
44 Water Street Composite X X X X X ND
*Samples which exceeded 10,000 MPN/100ml E. coli. **Samples which exceeded 235 MPN/100ml E. coli.
ND=non‐detect, or results were below analytical detection limit.
Percentage of Stormwater Samples Exceeding Recommended or State Standards
E. coli Bacteroides
Site Code
Site (Upstream to
Downstream)
4‐1
4. Discussion
4.1 Routine Surface Water Sampling Sites
PHYSICAL ASSESSMENTS
Half of the sampling sites chosen for this study were classified as urban land use with the greatest
concentration within 10km of the mouth of the river; starting at Horlick Dam. Remaining sites were
classified as agricultural, parkland or open and were primarily located within the canal system and
upstream sections of the Lower Root River sub‐watershed. Site assessments, conducted in the vicinity of
the sampling point, demonstrated a wide variety of physical conditions and pollution sources with the
potential to adversely impact surface water quality and conditions supportive of aquatic life. These
included: channelization, eroded stream banks, presence of municipal infrastructure (stormwater and
WWTP effluent discharge), culverts, agricultural drainage tiles, lack of riparian buffer, minimal tree
canopy and a high degree of adjacent impervious surface cover.
Physical attributes of rivers and streams impact habitat quality. Comprehensive habitat scores for most
tributaries or canal locations (less than 10 m width) were either “Excellent” or “Good”. Sites greater
than 10 meters in width, located on the main stem of the river, had overall habitat scores of “Good” or
“Fair”. Scores for individual attributes, which comprise the overall habitat score, ranged from “Poor” to
“Excellent” and thus overall habitat scores did not necessarily coincide with individual category scores.
Stream habitat categories, which differ based upon stream width (greater or less than 10m), were
explanatory for water quality indicators, e.g. turbidity. Therefore, study results should be interpreted in
the context of the different habitat parameters and scoring systems.
ENVIRONMENTAL ASSESSMENTS
Winter and spring flow volumes were greater than those in summer at the three gauging stations within
the Root River watershed (spring only at Franklin due to malfunctioning winter gauge). Sampling sites
could only be accessed following events that would disrupt or thin the ice cover to allow for collection
during winter months. Examples of such events included warm weather induced snow melt or
precipitation. Collecting winter samples under these conditions likely created a bias towards high flow
conditions. Rain events were associated with increased flow in all other seasons. However, flow volumes
were only retrieved when samples were collected and, therefore, may not be representative of the
entire season.
Although significant seasonal differences in precipitation were not detected, National Oceanic and
Atmospheric Administration (NOAA) classified the region containing the Root River watershed as under
severe drought conditions from May‐August, 2012 (Hoerling et al., 2013). This status was not reflected
when examining seasonal variability likely due to the overlap of the drought with two seasons in which
normal amounts of precipitation were received. For the purpose of this study, only antecedent
precipitation in the 24, 48 or 72‐hour period prior to sample collection was considered for correlation
analyses. Antecedent precipitation was explanatory for multiple variables, e.g. turbidity, but caution
must be used in extrapolating these results beyond the confines under which they were obtained.

4‐2
Results must be interpreted within the context of the study, immediate response rather than response
to overall seasonal conditions, i.e. drought, normal or wet conditions. Further studies would be
necessary to accurately detect long range seasonal differences and/or trends..
Water temperature varied seasonally and was lowest during the winter and spring. Air temperature,
land use, and habitat conditions were explanatory for water temperature. The positive correlation
between air and water temperature largely explain seasonal differences. However, urban sites generally
had higher water temperatures than agricultural areas. Possible explanations include a heat island effect
due to the built environment or increased solar radiance at wider channel locations associated with
urban areas near the mouth of the river. Sites that had channels with greater width to depth ratios also
had higher median water temperatures, likely due to increased solar radiance per volume of water (i.e.
larger surface to volume ratio).
Few sites exceeded acute temperature standards. However, most FAL and LFF sites exceeded sub‐lethal
standards. All urban sites within the Lower Root River sub‐watershed had greater than ten percent of
samples exceed sub‐lethal standards. In comparison, all other FAL and LFF sites exceeded standards less
than six percent of the time. Union Grove, one of the two LAL sites, exceeded recommended sub‐lethal
standards frequently (23%). This was likely due to thermal inputs from the local WWTP, which
comprised the vast majority of base flow based upon visual observations. The other LAL site, RRC‐
Fonk’s, also adjacent to a WWTP, did not frequently exceed acute temperature standards likely due to
discharge from the WWTP making up a smaller relative portion of stream flow.
Multiple sites displayed seasonal variation in turbidity, although the season with the highest level was
not consistent. Many canal and tributary locations had greater turbidity values during the summer, with
the exception of two west canal locations. Main stem sites were more turbid during the winter. Sample
collection methods and site accessibility may partially explain these findings. Many canal and tributary
sites had extremely low flow during summer months. At times, it became impossible to collect water
samples without inadvertently disturbing bottom sediments. This may also explain why turbidity was
negatively correlated with flow volumes at three tributary/canal locations, where a high percentage of
samples exceeded recommended standards (e.g. low flow increased the probability of disturbing
bottom sediments). Alternatively, most sites on the main stem of the Root River could only be sampled
during winter months following events that disrupted or thinned the ice cover (high flow, melting).
These events likely re‐suspended sediments into the water column and created bias towards higher
apparent turbidity in winter months. Turbidity was positively correlated with precipitation (17/18
locations) and stream flow (9/18 locations) suggesting that the mobilization of sediments and other
debris through runoff and erosional processes results in higher turbidity. Although there was no
correlation between habitat and turbidity, erosional features, such as undercut banks, mass wasting and
poor stream bank conditions, were present at multiple locations. The lack of relationships between land
use, habitat conditions and turbidity in this study may be due to the existence of multiple scale
dependent processes (catchment dependent, watershed dependent, etc.) and non‐linear responses
(Allan, 2004). Although a correlation between habitat conditions and land use was not observed in this
study, other studies have documented an association (Allan, 2004).

4‐3
Six sites had greater than 15 percent of samples exceed recommended turbidity standards. Five of
these locations were canal or tributary sites; the remaining site was Horlick Dam. Speculatively,
tributaries and canals may have flashier flow conditions which could promote erosion, introducing
sediments into the water column. Alternatively, under low/base flow conditions, bottom sediments
could have been disturbed as an artifact of sample collection, creating a high bias. High turbidity at
Horlick Dam may also be related to the agitation of water as it travels over the dam spillway, re‐
suspending bottom sediments and releasing substrate associated biofilms. Stormwater outfalls adjacent
to this site occasionally had elevated turbidity levels and may have also been a contributing factor.
CHEMICAL ASSESSMENTS
Specific conductivity varied seasonally at most sites (12/18); however, the season with the highest
conductivity was not consistent between all locations. At most sites with seasonal variability, the
highest conductivity values were seen in fall or winter (11/12). Higher values may be related to low flow
conditions during fall and road deicing (influx of salt) during the winter. Base flow, which comprises a
larger percentage of fall stream flow compared to other seasons, may have a higher specific conductivity
values than precipitation mediated surface runoff due to the interaction and dissolution of minerals
(ions) in soils by groundwater. In general, specific conductivity was negatively correlated with
precipitation (n=11 sites) and volumetric flow rate (n=8 sites). This is representative of surface runoff
and precipitation diluting base flow. Irrespective of seasonal variation, most sampling sites 16/18) had
specific conductivity values which exceeded recommended levels during the study period; although
only four sites exceeded standards in more than 25 percent of samples collected (RRC‐Union Grove,
Raymond Creek, RRC‐West and RRC‐Main).
Lower pH values were associated with winter months at all locations with a complete seasonal dataset
(17/18). pH had site dependent correlations with: precipitation (negative correlation), volumetric flow
rate (negative correlation) and air temperature (positive correlation). The correlation between air
temperature and pH largely explains seasonal variability. This was caused by increased gas solubility in
water, inclusive of carbon dioxide (CO2), with low temperature. Dissolved CO2 reacts with water to
produce carbonic acid (H2CO3) which lowers pH. Negative correlations between precipitation,
volumetric flow and pH represent the influx of precipitation mediated surface runoff which will
generally have a lower pH than base flow due to runoff being saturated with atmospheric CO2 and the
lack of interactions with soils which contain minerals which buffer against changes (e.g. calcium
carbonate).
pH varied based upon land use, with urban sites generally having a higher pH. This may be due to
warmer water temperatures being associated with urban areas. There were more sub‐lethal
temperature exceedances in the urban areas of the Lower Root River. pH readings were within the
recommended range at most sampling sites (15/18). At sites where pH was outside the recommended
range, no more than 3.3 percent of samples exceeded standards. Sites with exceedances were not
grouped geographically and included sites within the west canal, the main canal and Lower Root River
sub‐watersheds

4‐4
Total phosphorus concentrations varied seasonally at Legend Creek and RRC‐Union Grove, with both
sites having higher concentrations in the summer. Similar trends were observed by Bowes et al (2003).
Total phosphorus concentrations correlated with volumetric flow rate (negative correlation, primarily
canal and tributary sites) and turbidity (positive correlation) at approximately one third of the 18
sampling sites. Median total phosphorus concentrations were negatively correlated with the habitat
rating for fine sediments, i.e. higher amounts of fine sediments correlated with greater median
phosphorus concentration. Correlations between turbidity, the amount of fine sediments and higher
total phosphorus concentrations suggests some portion of phosphorus was attached to sestons and that
factors which re‐suspended sediments in to the water column (as evidenced by increased turbidity)
increased phosphorus concentrations. The negative correlation between phosphorus and volumetric
flow rate could be an artifact of accidently disturbing bottom sediments when collecting surface water
samples. However, similar observations have been described in other studies, where sampling error was
not a confounder (Bowes et al, 2008).
Waste water treatment facilities or industrial effluent tend to be constant sources of phosphorous
loading, independent of stream flow (Bowes et al, 2008). Thus the transport of diffuse, non‐point,
sources of nutrients into riparian systems is precipitation mediated and flow dependent. Dry weather
total phosphorus concentrations were primarily related to loading from the WWTP which represented a
large portion of base flow in their respective receiving waters. Higher flow volumes in the winter, may
also explain why fewer sites exceeded phosphorus standards at the majority of sampling sites as well as
seasonal variability, where noted.
All sampling sites exceeded phosphorus standards (minimum exceedance rate of 46%), indicating
elevated levels are common throughout the watershed. Sites downstream from wastewater treatment
facilities exceeded either recommended or state water quality standards more frequently than the other
sampling sites [e.g. RRC‐ Union Grove (13/13), RRC‐Fonk’s (13/13) and Hoods Creek (11/12)]. The close
proximity of these sites to water treatment facilities suggests the facilities maybe a factor in frequent
exceedances. Additional data would be required to determine the influence of these facilities on the
greater watershed. Although samples frequently exceeded phosphorus standards near WWTP,
exceedances throughout the watershed indicate non‐point sources also contribute to excess
concentrations.
Dissolved oxygen exhibited seasonal variability. Higher DO concentrations were seen in the winter
compared to summer and/or spring at the majority of sampling sites (17/18). DO was negatively
correlated with water temperature at nearly all locations. Increased gas (oxygen) solubility, associated
with lower water temperatures, is explanatory for seasonal variation. DO concentrations were positively
correlated with volumetric flow rate (17/18 sites) but not precipitation. This indicates that the addition
of water via precipitation events does not increase oxygen concentrations. The apparent relationship
between DO and volumetric flow may be due to co‐variation. Lower water temperatures and higher
flow due to snow melt/precipitation in the winter may have contributed to observable trends.

4‐5
DO was negatively correlated with total phosphorus concentrations at most sampling sites (13/18).
Excess nutrients may promote eutrophication, which ultimately depletes DO levels. This could also be a
product of co‐variation as both parameters displayed similar seasonal trends. Total phosphorus
concentrations were more likely to exceed standards in summer months, the season when DO
concentrations were lowest, likely due to higher water temperatures.
DO concentrations were higher at urban and open/parkland designated land use areas compared to
sites classified as agricultural. The majority of urban locations were located downstream from the
Horlick Dam, which aerates the water as it cascades over the dam, resulting in greater oxygenation of
the water. Additional studies examining the consumption and residence time of DO within the Lower
Root River Sub‐Watershed would be needed to determine if oxygenation from the dam are sustained
through downstream locations as the data seems to suggest.
Most FAL sites, with the exception of Horlick Dam, had DO concentrations below <5.0 mg/l (standard)
on at least one occasion, indicating low DO is pervasive throughout the watershed. LFF sites also had
samples below recommended standards (<3.0 mg/l). Both LAL site met minimum standards (>1.0 mg/l).
If FAL standards were applied to LFF and LAL sites, three out of the four sites would have failed to meet
standards on at least one occasion. Eight sites also exceeded DO saturation concentrations of 140
percent; a stressor for aquatic wildlife and suggestive of eutrophication. Unlike sites with low DO levels,
sites with greater than 140 percentage oxygen saturation included sites below Horlick Dam.
MICROBIOLOGICAL ASSESSMENTS
E. coli concentrations varied seasonally; most sites had higher concentrations in either winter or
summer. E. coli concentrations were positively associated with precipitation (16/18 sites), volumetric
flow rate (7/18 sites), water temperature (9/18 sites) and turbidity (13/18 sites). Correlations between
precipitation, volumetric flow, turbidity and E. coli suggest the mobilization of non‐point sources
contributed to elevated bacteria concentrations at many locations. Additionally, correlations between
turbidity and E. coli suggest factors which introduced sediments into the water also introduced
associated bacteria. Correlations between water temperatures and E. coli may suggest bacteria
persistence and/or growth in sediments and other media under warm conditions as suggested in Ishii et
al (2005). Relationships between E. coli and turbidity may also partially explain elevated E. coli
concentrations in winter months. Winter conditions conducive to open water sampling are also
conditions which increase flow and re‐suspend sediments into the water column, e.g. snow melt.
Dilution of base flow as a result of precipitation and runoff, most notably after extended periods of dry
weather can result in a inverse relationship between volumetric flow rate and the concentration of E.
coli in surface water.
E. coli concentrations frequently exceeded single sample (12.9 – 72.0%) and monthly geometric mean
(in each of 2 – 12 months) standards suggesting most locations are currently not fit for primary contact
recreation. Contrary to seasonal trends, summer months (August) had more frequent exceedances of
geometric mean standards. This corroborates the correlation between water temperatures and E. coli

4‐6
and the inference that bacteria persistence and/or growth in sediments and other media is more
prevalent under warm conditions.
Human‐specific Bacteroides concentrations were below recommended thresholds at all surface water
sites ,excluding RRC‐Union Grove and RRC‐Fonk’s, except for Husher Creek. It was anticipated that RRC‐
Union Grove and RRC‐Fonk’s would exceed the threshold for Bacteroides markers as they are adjacent
to the WWTP effluent discharge locations. One sample from Husher Creek had concentrations greater
than 5,000 CN/100 mL, indicating the possible presence of sanitary sources upstream of the site.
Additional testing is recommended at this location to pinpoint the source(s).
BIOTIC ASSESSMENTS
Macro‐invertebrate assessment scores were “Fair”, “Fairly Poor” or “Poor” at 13 out of the 14 locations
where habitat assessments were conducted. Most were described as “Poor” or “Very Poor”, indicating
compromised habitat quality or environmental stress resulting from pollutant loading within the
watershed. Multiple factors were associated with poor scores including: high phosphorus, low DO (<5.0
mg/l), and high pH (>9.0). Poor macro‐invertebrate scores at sites with high phosphorus may be due to
eutrophic conditions which results in low DO levels. Speculatively, sediment associated phosphorus may
be linked to the mobilization of other pollutants such as pesticides, herbicides or other contaminants
which may also have a detrimental impact on macro‐invertebrate populations. Low DO levels can
increase non‐tolerant species morbidity and mortality. The percentage of samples which exceeded pH
standards correlated with poor macro‐invertebrate scores. However, macro‐invertebrates were only
assessed at two locations with samples outside the recommended pH ranges. In terms of habitat
conditions, high amounts of fine sediments were associated with poor assessment scores suggesting
siltation interferes with reproduction, likely due to compromised spawning areas (U.S. Geological
Survey, various). Conversely, a higher amount of rocky substrate was associated with improved
assessment scores. In comparison to historic assessments (1979‐2000), the number of sites which
improved was equal to the number of sites which declined; most sites did not change. This indicates
little net change in macro‐invertebrate scores throughout the watershed.
Fish assessment scores were rated as “Very Poor” (n = 1), “Poor” (n = 3), “Fair” (n = 4) and “Good” (n =
1), indicating less than ideal biological integrity. As with macro‐invertebrate assessments, poor scores
were associated with sites that had high total phosphorus concentrations. Poor fish assessment scores
were also associated with poor macro‐invertebrate scores (scores were inversely related due to the
reverse scoring continuums utilized for fish and macro‐invertebrate assessments). This may indicate
that factors which resulted in poor macro‐invertebrate scores also directly or indirectly contribute to
poor diversity and resiliency within the fish community. Unexpectedly, higher fish assessment scores
were associated with areas that had more sub‐lethal temperature exceedances. This may be due to
urban areas downstream from Horlick Dam having higher DO levels, higher surface water temperatures
and a different type of fishery (Great Lakes fishery). Similar to macro‐invertebrate assessments, the
number of sites which showed improvement was equal to the number of sites which showed declined,
indicating no net change.

4‐7
4.2 Stormwater Outfalls
All stormwater outfalls, excluding Horlick Dam‐Southwest and Washington Park 3, had multiple
exceedances of water quality standards for at least one parameter. Ten percent of samples, at six sites,
had E. coli concentrations in excess of recommended standards for stormwater (>10,000 MPN/100ml).
This is not necessarily unusual as stormwater runoff often exceeds E. coli standards regardless of
adjacent land use (Clary et al, 2008). However, five sites had human specific Bacteroides levels above
5,000 CN/100ml in greater than 50 percent of samples. In conjunction with elevated dry weather E. coli,
this is suggestive of a potential sanitary source. Three locations consistently presented these conditions;
Liberty Street Outfall, Washington Park 1 Outfall and Water Street Composite Outfall. In addition to
Liberty Street Outfall, Washington Park 1 and Washington Park 2 had ratios of human‐specific
Bacteroides to total Bacteroides above the average amount found in sewage for 50 percent or more
samples. Potential sanitary infiltration into the stormwater conveyance system should be investigated in
the respective basins. Not surprisingly, considering there was likely sanitary infiltration into the storm
sewer, there was a negative correlation between E. coli and precipitation at Liberty Street Outfall. This
suggests that surface runoff, which often elevates E. coli concentrations, provided a dilutional effect to
the predominant dry weather source of bacteria. There was a positive correlation between E. coli and
precipitation at all other stormwater outfall sites, suggesting precipitation mobilized, non‐point sources
were additive to any E. coli present in dry weather flow.
Eight stormwater outfalls had elevated detergents (>50%) and/or detection of total residual chlorine.
This may indicate the release of industrial, commercial or other process water (including municipal
potable or black water) into the stormwater conveyance system. Several sites had a negative
correlation between precipitation and concentrations of detergents (Horlick Dam‐Northwest) or
chlorine (Washington Park 2), further suggesting a dry weather source of contamination. The origin of
dry weather pollution sources remains unclear for all locations except Liberty Street Outfall. The
presence of a sanitary source was confirmed by scoping the Liberty Street Outfall with a video camera,
where a sewage lateral was found connected into the stormwater infrastructure. Redirecting the lateral
into the sanitary system has eliminated dry weather flow at this outfall. The presence of a sewage
source may have negatively influenced adjacent surface water E. coli concentrations. Future testing is
required for verification. Additional investigation is also required to verify pollution sources at Water
Street, Washington Park 1 and Washington Park 2 outfalls. The detection of sanitary sources through
the combined use of decision trees and microbial source tracking methods confirms the efficacy of such
techniques in identifying illicit discharges.
4.3 Intra Sub‐watershed Comparisons
There were notable differences in assessed water quality parameters at various locations within the
three sub‐watersheds of the Root River. The suite of parameters chosen for this study was both
conservative and non‐conservative in nature. For conservative parameters, such as specific
conductivity, upstream sources have the ability to impact downstream sites as these constituents are
4‐8
not normally transformed by chemical, physical or biological processes. Non‐conservative parameters
(turbidity, pH, total phosphorus, dissolved oxygen and E. coli) can be transformed, thus, upstream
contributions might not influence downstream reaches of the river if active processes are present which
degrade the constituent. For conservative parameters, differences in concentrations between upstream
and downstream reaches indicate the presence of an active source or sink. For non‐conservative
parameters, differences in concentrations between upstream and downstream reaches may indicate a
source, sink, or degradation of the constituent.
Root River Canal ‐ West Branch. RRC‐Union Grove had higher specific conductivity values than the
other sampling sites within the sub‐watershed. RRC‐West had higher specific conductivity levels than
Raymond Creek. Higher conductivity values at the RRC‐Union Grove site may be related to WWTP
effluent, comprising the majority of dry weather flow at this location (as indicated by visual
observations). Drinking water in the Village of Union Grove comes from a groundwater sources and may
be softened. This further increases ion concentrations; therefore, it was likely that potable water had a
higher specific conductance before being discharged as effluent. Elevated conductivity in samples
collected at RRC‐West compared to Raymond Creek was likely due to the conservative nature of the
parameter (e.g. high levels of conductivity from RRC‐Union Grove elevate levels at RRC‐West). The high
degree of base flow derived from wastewater effluent discharged at the RRC‐Union Grove site may also
explain the lower pH and higher E. coli concentrations compared to other sites within the sub‐
watershed. Correlations between effluent discharge and stream dissolved oxygen levels also imply
influences from the WWTP.
Raymond Creek had significantly higher turbidity levels than the other sites located on the west branch
of the canal. In addition to being more turbid, Raymond Creek was one of six locations to have greater
than 15 percent of samples exceed 25 NTU. Raymond Creek also had lower DO concentrations than
RRC‐West. However, with the exception of Raymond Creek, all other sites within this sub‐watershed met
standards in 95 percent or more of samples collected. Raymond Creek also had a higher E. coli
concentration than RRC‐West. Lower levels of E. coli and less frequent exceedances of water quality
standards at RRC‐West in comparison to the rest of the sub‐watershed indicates the rapid die‐off and
dissipation of FIB as water travels downstream from the WWTP. This hypothesis was supported by data
gleaned from the additional samples collected from the canal system, which also indicated the rapid
disappearance of E. coli downstream from the facility. The source of elevated E. coli concentrations at
Raymond Creek was unclear, but samples analyzed for Bacteroides do not suggest a human source.
Additional sampling is needed to determine the exact nature of the pollution sources.
Root River Canal ‐ East Branch. On the east branch of the canal system, RRC‐Fonk’s had higher
turbidity, specific conductivity and E. coli concentrations, as well as lower pH, than RRC‐East. Similar to
RRC‐Union Grove, RRC‐Fonk’s is immediately downstream from a WWTP. The close proximity to the
effluent discharge location likely influences water quality. Also similar to RRC‐Union Grove, additional
canal testing indicated E. coli concentrations decreased significantly downstream from the WWTP.
Samples collected upstream and downstream of the WWTP, and analyzed for total and human‐specific
Bacteroides, confirm the presence of a human source. The presence of MST markers downstream from

4‐9
the WWTP is plausible due to effluent comprising a portion of the dry weather flow, but it is unlikely
that the upstream location (~5 meters upstream) was similarly affected. This suggests the possibility of
another human source further upstream such as a failing septic or sewage conveyance systems (Eiswirth
and Hotzl, 1997; Sauer et al, 2011). Additional research would be required to determine the source(s) of
elevated human specific Bacteroides upstream of Fonk’s waste water treatment facility.
Lower Root River Sub‐watershed. Within the Lower Root River sub‐watershed, Horlick Dam had higher
turbidity than all other sites with the exception of Husher Creek. High turbidity at Horlick Dam may be
related to the agitation of water as it falls over the dam, causing the re‐suspension of sediments and
disassociation of particulate biofilms. The impoundment above the dam likely serves as a sink for
upstream particulate matter; any alteration to the current configuration, or complete removal, should
be carefully considered prior to implementation. Husher Creek had the highest turbidity values from
Johnson Park to the mouth. It was unclear why turbidity was frequently elevated in samples from
Husher Creek; the addition of comprehensive upstream sampling locations may elucidate the pollution
source(s). Sites Hwy 38 at MKE Co Line and 5 Mile Road had higher turbidity values than Johnson Park,
Hwy 31/4 Mile Road and Chartroom, indicating turbidity is greater in the upper sections of the sub‐
watershed compared to downstream locations (with the exception of REC).
Two differences were noted with respect to specific conductivity: 1) Husher Creek had higher specific
conductivity than all sites from Horlick Dam to the Chartroom and 2) Chartroom (mouth of the river) had
a lower specific conductivity than all other locations. Although Husher Creek had elevated conductivity
relative to other sites with the sub‐watershed, this did not appear to be problematic as most samples
were within the recommended range. Lower conductivity at Chartroom compared to all other locations
was likely due to the intrusion of Lake Michigan coastal water, as suggested in Abbott (2008). This
would also explain why Chartroom was the only location where volumetric flow rates were positively
correlated with specific conductivity; likely due to the composition of the sample (a greater proportion
of river versus Great Lakes water) during high flow periods.
Lower pH values were found at Husher Creek, Hwy 38/MKE Co Line, 5 Mile Road, Hwy 31/4 Mile, and
Chartroom than the remaining sites within the lower sub‐watershed (Johnson Park, Horlick Dam,
Steelhead Facility, Liberty St. Bridge and REC). Hwy 38/MKE Line also had lower pH than Hwy 31/4 Mile
and Johnson Park was lower than Horlick Dam. Overall, pH was lower in upstream locations with the
exception of Chartroom (where significant mixing with Lake Michigan occurs). pH is temperature‐
dependent due to gas solubility. Thus there were similar trends between temperature and pH. All sites
from Johnson Park to river mouth, with the exception of 31 and 4 Mile, exceeded sub‐lethal standards
for greater than 10% of samples. The high degree of urbanization/wider stream channels in the lower
reaches of the Root River likely contributes to the higher water temperatures and pH values.
Dissolved oxygen concentrations at Johnson Park and all sites below Horlick Dam (with the exception of
Chartroom) were higher than the remaining sites above the dam suggesting that aeration of water at
the dam increases DO levels at downstream sites. Samples from the Chartroom site were partially
representative of Lake Michigan water and differed in DO concentrations accordingly. Although there

4‐10
was no correlation between habitat condition and DO concentration throughout the watershed,
elevated levels observed at Johnson Park, relative to adjacent sites, may be related to the presence of
riffles.
E. coli concentrations were higher at Liberty Street Bridge and Husher Creek compared to all other
locations within the lower Root River sub‐watershed. High E. coli concentrations at Liberty Street
Bridge were likely related to the illicit connection. The source of elevated E. coli concentrations at
Husher Creek was not identified, but high concentrations of human specific Bacteroides in one sample
suggests the possibility of a human source. Additional monitoring would be required to determine exact
source(s) at this location. Conversely, Horlick Dam and Chartroom had lower E. coli concentrations than
adjacent sites. Low E. coli concentrations at Horlick Dam may be related to particles and associated
bacteria settling from the water column and may be directly related to the lower turbidity levels
observed. Low E. coli concentration at the mouth of the river (Chartroom) relative to adjacent sites was
observed during this study and also in a previous study by Abbott (2008). The navigable portion of the
river may serve as a sink for particulate matter and associated bacteria coupled with a dilutional effect
caused by the intrusion of Lake Michigan water into the river; either could serve to decrease observable
bacteria concentrations.
4.4 Inter Sub‐watershed Comparisons
There were notable water quality differences at some locations between, as well as within, sub‐
watersheds.
Middle Root River vs. Lower Root River Sub‐watershed. There were no significant differences for any of
the assessed water quality parameter between the only site within the Middle Root River sub‐
watershed, Legend Creek, and the closest downstream site on the Lower Root River. This implies that
Legend Creek was not a significant source of pollution to the Lower Root River sub‐watershed for
parameters examined, although this does not imply the absence of upstream sources.
East and West Canal Branches vs. Main Canal. The site on the main canal had higher turbidity than the
lowest downstream sites on the east and west canals, respectively which suggest localized sources were
responsible. Specific conductivity, pH and DO concentrations in samples from the east canal were lower
than what was observed on the main canal. However, there was no difference in specific conductivity,
pH and DO between the main and west canal branches. This indicates that water within the main canal
has properties similar to the west canal. This may be due to a greater amount of base flow originating
from the west versus the east branch of the canal; possibly due to the large quantity of water discharged
(as effluent) from the Union Grove WWTP and/or a larger drainage basin. E. coli concentrations did not
differ.
Main Canal vs. Lower Root River Sub‐watershed. The main branch of the canal also had higher
turbidity, specific conductivity, pH and DO concentrations than the next closest downstream site on the
Lower Root River sub‐watershed, Hwy 38/MKE Co Line. This indicates the canal system has the ability to
adversely influence water quality within the Lower Root River sub‐watershed. However, this study did

4‐11
not include sites upstream of the confluence of the canal system on the main stem of the Root River and
therefore could not determine the degree of influence. Although the degree to which the canal system
influences water quality in the remainder of the watershed could not be determined, 28 percent of base
flow volume originates from the canal system (SEWRPC, 2007); indicating the volume of water
discharged from the canal system is great enough to impact downstream surface water quality.
Hoods Creek vs. Lower Root River Sub‐watershed. Hoods Creek had higher turbidity, specific
conductivity, and E. coli values, and lower pH and DO levels than the site below its confluence with the
Lower Root River sub‐watershed, Johnson Park. Similar to RRC‐Union Grove and RRC‐ Fonk’s, the
Yorkville WWTP may have influenced pH, specific conductivity and E. coli values at Hoods Creek. As with
the other sites located downstream from wastewater treatment facilities, E. coli concentrations quickly
decreased as the proximity between the effluent discharge location and the sampling point increased.
This suggests elevated E. coli concentrations from the WWTP; approximately 13 km upstream from the
sampling location, likely did not exert adverse influence at this site. Results from Bacteroides analysis
further support a non‐human source. Although Hoods Creek had higher E. coli and turbidity than
Johnson Park, it remains unclear as to whether this tributary has the ability to influence water quality
within the Lower Root River sub‐watershed due to the non‐conservative nature of these parameters.
4.5 Comparison to Historical Water Quality Monitoring Data
Data collected during this study was compared to past assessments that used similar methodology at
the same study locations within the lower Root River sub‐watershed, from Johnson’s park to the mouth
(Abbott, 2008). The current study data was normalized to conform to data within Abbott (2008), which
was collected from May through October in 2007 and 2008. Sample collection dates outside of that time
frame were removed from the current study prior to statistical analysis. All sites (Johnson Park, Horlick
Dam, Steelhead Facility, Liberty Street Bridge, REC and Chartroom) had higher pH and lower turbidity
compared to the 2007 – 2008 study. All sites, with the exception of Steelhead Facility and Liberty Street
Bridge, also had lower E. coli concentrations. Work has been conducted to remediate compromised
infrastructure at several stormwater outfalls within the Lower Root River sub‐watershed, including the
most recent retrofit of the sewer lateral at the Liberty Street stormwater outfall. The City of Racine
Department of Parks, Recreation and Cultural Services (PRCS) have also instituted a “no mow zone” in
an attempt to increase riparian buffer width within city parks. These actions serve to positively influence
E. coli, pH and turbidity values. However, current study results were partially collected during drought
conditions. This may contribute to the apparent differences to past studies. Low discharge volumes
were also associated with higher pH, lower E. coli and lower turbidity levels. Further, decreases in E. coli
and turbidity occurred at all locations during the course of the present study, and not solely those near
stormwater infrastructure, suggesting a percentage of the differences noted were weather related.
In addition to examining individual water quality parameters, the decision trees originally produced by
Abbott (2008) were revisited in the current study. Most notably, the recommendation for further
investigation of dry weather exceedances at the Liberty Street sampling location was revisited. Upon
further examination, and the use of a suite of MST methods (detergents, total residual chlorine, and

4‐12
Bacteroides markers), an illicit discharge was identified at a nearby home. Re‐routing to the sanitary
sewer has resulted in a reduction in both E. coli concentrations and human sewage markers. The utility
of a decision tree approach, supported by a routine monitoring program, is a useful approach for
identifying and prioritizing potential pollution sources adversely impacting water quality within the Root
River, its canals and tributaries.

5‐1
5. Conclusions and Recommendations
This two year study of water quality within the Root River watershed indicates compromised physical,
chemical, microbiological and biological integrity.
PHYSICAL AND ENVIRONMENTAL ASSESSMENTS
Physical attributes within the Root River watershed directly or indirectly influenced biota, chemical
processes and microbial water quality. For instance, high turbidity and a greater proportion of fine
sediments, as indicated by habitat scores, were explanatory for poor macro‐invertebrate scores,
elevated E. coli and increased total phosphorus concentrations. Turbidity levels were also positively
associated with stream flow and precipitation suggesting the mobilization of non‐point sources during
and after rain events. Significant erosion, visually confirmed by the presence of undercut banks and poor
stream bank conditions, was noted at select sites. Turbidity, resulting from surface runoff and the re‐
suspension of bottom sediments, may compromise watershed function. Therefore, watershed
restoration plans should evaluate ways to reduce and control the introduction and mobilization of
sediments. Associations between turbidity, land use classification and habitat conditions were not
found in this study. However, other studies have observed such relationships, which suggest alterations
to land use, habitat improvements and/or the targeted implementation of best management practices
inclusive of effective buffers could offer a variety of benefits.
Water temperatures complied with acute standards at most locations. However, exceedances of sub‐
lethal standards, particularly at urban locations within the Lower Root River sub‐watershed, were more
common. Expectedly, air temperature was correlated with water temperature. Urban locations
generally had higher water temperatures, possibly due to a heat island effect or greater channel width.
Areas with a greater width to depth ratio (greater surface area) may have warmer temperatures due to
increased solar radiance. Negative biotic impacts were not observed to result from fluctuations in
temperature during the course of this study. However, increasing tree canopy will ensure that
supportive water temperatures are maintained.
CHEMICAL AND MICROBIOLOGICAL ASSESSMENTS
Measurements of chemical constituents and source tracking markers were used in conjunction with
microbiological indicators to gauge watershed health. Assessed parameters included: specific
conductivity, pH, total phosphorous, dissolved oxygen, detergents, total residual chlorine, E. coli and
Bacteroides (total and human specific). Correlations between select chemical constituents and biotic
assessment results were explanatory for ecosystem health, with values falling outside recommended
ranges representing potential stressors for aquatic life.
Specific conductivity fell outside recommended ranges, with some frequency, at most of the sampling
sites. Elevated values were most often observed in fall or winter, likely due to a higher proportion of
base flow and deicing of roadways, respectively. Canal sites, specifically the west and main branch
locations, often had elevated conductivity levels, possibly due to the discharge of ion rich groundwater
into the canal system via WWTP effluent. Elevated specific conductivity levels at canal locations likely
5‐2
influenced downstream reaches of the Root River. Due to chronic and acute influences on biological
communities from road deicing using salt (Corsi et al, 2010), alternatives should be evaluated for
environmental impacts and costs.
Few sites had samples with pH values outside recommended ranges. Poor macro‐invertebrate scores
were associated with the percentage of samples outside the recommended pH range. However, macro‐
invertebrates were only evaluated at two sites which had samples outside the standard range and
results may have been an abnormality. Further investigation is warranted at these locations. pH values
were temperature and precipitation dependent and were higher in urban land use areas, possibly due to
higher water temperatures at these locations.
Total phosphorus concentrations were above state standards at all locations indicating most reaches of
the Root River watershed did not meet current criteria. Monitoring results implied multiple sources
were responsible for elevated levels. For example, elevated levels of phosphorus were seen in dry
weather, under base flow conditions, and frequently downstream from WWTP effluent discharge
locations (implied point source contribution). However, the wide spread nature of exceedances
throughout the watershed indicate contributions from non‐point sources as well. Higher total
phosphorus levels were also associated with sites having a greater proportion of fine sediments within
the stream substrate, notably in conjunction with elevated turbidity levels; this indicates that some
portion of the phosphorus was bound to sestons. Limiting the introduction and mobilization of
sediments within the watershed would likely reduce the amount of phosphorus from non‐point sources
(as well as reducing turbidity). WWTPs and other point source permittees should strive to reduce the
concentration of phosphorous in their effluent. Agricultural land use areas should be reviewed for
current conservation and fertilizer application practices.
Dissolved oxygen, one parameter implicated in poor biotic assessment scores, fell below FAL standards
at most sampling sites on at least one occasion. Water temperature, volumetric flow rate, total
phosphorus concentrations and land use were all explanatory variables demonstrating correlation to
DO. Correlations between water temperature and DO were expected due to increasing gas solubility
with falling temperatures. Correlations between DO levels, total phosphorus concentrations and flow
volumes have important policy implications for the watershed if causative relationships are proven.
During the study period, these parameters varied seasonally, for different reasons, which may have
resulted in the observed correlations. However, if correlations between total phosphorus and DO
concentrations remain constant, eutrophication is a likely source of depleted DO levels within the
watershed. Correlations between DO and flow regimen indicate low flow volumes also negatively
influences DO levels. Urban locations generally had higher DO concentrations, the majority of which
were located downstream of Horlick Dam. The Horlick Dam sampling site was one of only two locations
to meet FAL DO standards for all samples collected. Water cascading over the dam appeared to
increase DO levels directly below the dam and into downstream reaches as well.
E. coli concentrations frequently exceeded primary contact recreational standards at most locations,
indicating that the majority of the Root River Watershed is currently not supportive of this beneficial
5‐3
use. Multiple, site dependent, factors were associated with elevated levels of E. coli including:
precipitation, volumetric flow rate, turbidity and water temperature. In most cases, elevated E. coli
appeared to be associated with wet weather mediated non‐point source pollution (positive correlations
with precipitation, flow volume, and water temperature).
However, several point sources were also implicated in fecal pollutant loading including wastewater
treatment facilities and stormwater outfalls. The impacts of point source pollution appear to have a
localized effect. For example, E. coli rapidly diminished downstream from the three WWTPs, indicating
they did not have a geographically large influence on the remainder of the watershed. The limited
influence of these sources was likely due to ambient conditions favoring bacterial die‐off.
Several tributary sites (Raymond, Husher and Hoods Creek), had elevated levels of E. coli relative to
downstream locations in the absence of precipitation or any identifiable point source. While the source
of elevated bacteria levels was unclear, thresholds for human‐specific Bacteroides were not exceeded,
indicating sanitary sources were likely not responsible. Land use was classified as agricultural at two out
of the three locations; further testing is warranted to determine if this is a contributing factor.
Improvements in the microbial quality of water within the Root River watershed will require further
investigation work in areas where non‐point source pollution was indicated as the primary source. This
would include a determination of the relative contributions from agricultural or landscape versus
impervious surface runoff. Municipalities must also be vigilant with respect to municipal infrastructure
integrity. Aging or inappropriately routed infrastructure may act as a direct conduit for the delivery of
raw sewage into the tributaries, canals and main stem of the Root River. Monitoring guidelines, for
permitting requirements, are supplied in the Regional Water Quality Management Plan (SEWRPC,
http://www.sewrpc.org/SEWRPC/Environment/RegionalWaterQualityManagement.htm).
BIOTIC ASSESSMENTS
Overall fish and macro‐invertebrate assessments were characterized as “Fair” or below for the majority
of locations, indicating poor habitat quality and/or environmental stress. Scores for both fish and
macro‐invertebrate assessments were correlated indicating common stressors within biotic
communities. A common factor associated with poor scores was high total phosphorus concentrations.
Nutrients, such as phosphorous, are known to contribute to eutrophic conditions. Other pollutants may
also be delivered attached to sestons in conjunction with phosphorous; however these analyses were
outside the scope of this study. The percentage of samples at each site with DO levels below full FAL
criteria, as well as poor habitat conditions, was also associated with unsatisfactory macro‐invertebrate
scores. While high amounts of fine sediments embedded in the stream were associated with
substandard macro‐invertebrate scores, a greater proportion of coarse sediments were associated with
improved scores. This suggests siltation negatively influenced spawning and interfered with other life
cycle phases. In comparison to past studies, fish and macro‐invertebrate assessments remained stable,
i.e. there was no net gain or loss (equal proportions of sites improving and degrading). Moving forward,
specific actions should be taken to remove and/or minimize impairments which result in poor biotic
assessment scores including reducing phosphorous loading (in any amount), reducing the delivery of

5‐4
silts/fines into the system through the implementation of adequate stormwater retention, riparian
buffer systems and other conservation and best management practices.
RECOMMENDATIONS
Various reaches of the Root River Watershed are currently impaired for fish consumption, phosphorous
and total suspended solids. The monitoring data generated through this study supports the current
designations and has gone on further to identify interrelated factors which negatively influence
watershed health.
Macro‐invertebrate and fish communities suffer due to poor habitat conditions and excess pollutant
loading. These problems are aggravated by low dissolved oxygen levels, frequent exceedances of total
phosphorus standards and excess silts/suspended solids (as evidenced by habitat assessment scores and
elevated turbidity levels).
However, there is a desire for improvement and actions have been taken to improve water quality at
the municipal level. For example, the lower Root River sub‐watershed saw decreases in E. coli and
turbidity levels and increases in pH over baseline (2007 – 2008) levels in this study. The City of Racine
has made improvements to stormwater infrastructure, provided public education (Appendix 3) and
increased riparian buffer widths in some areas through the implementation of “no mow” zones. These
practices have resulted in appreciable improvements in water quality since the initial baseline
assessment was conducted in 2007 ‐ 2008 (Abbott, 2008). Improvements must be taken in context of
environmental conditions and periods of drought and/or unusually heavy rainfall which may bias
monitoring results in favor or against long term gains in watershed health. It is unclear what proportion
of these improvements are related to stormwater infrastructure improvements and best management
practices versus weather conditions occurring during the study period, however any degree of
improvement is movement in the right direction .
While gains have been made in some areas, they are offset by degradation in others. By identifying
contributing factors, actions can be taken to limit negative environmental impacts and improve
watershed health. Continued monitoring is necessary to ensure ecosystem needs are met and to
identify sources of pollution which were outside the scope of this study. Through comprehensive
planning and community engagement, actions can be taken to improve and maintain this resource for
future generations.
This work was made possible through a grant from the Fund for Lake Michigan with support from the
City of Racine and Wisconsin Department of Natural Resources

6‐1
6. Works Cited
Abbott, K. (2008). Guiding remediation of the Root River, Racine, WI, USA, through correlation of stream
bank condition, river morphology and infrastructure surveys to chemical and microbial source tracking.
Master's Thesis . University of Surrey.
American Public Health Association (APHA), American Water Works Association (AWWA), Water
Environment Federation (WEF). (2005). Standard methods for the examination of water and
wastewater, 21st edition. Washington, D.C.: American Public Health Association.
Anderson, S., Turner, S., and Lewis, G. (1997). Enterococci in the New Zealand environment: implications
for water quality monitoring. Water Science and Technology , 35, 325‐331.
Arnold, C. L., and Gibbons, C. J. (1996). Impervious surface coverage: the emergence of a key
environmental indicator. Journal of the American Planning Association , 62, 243‐258.
Ball, J. (1982). Stream classification guidelines for Wisconsin. Madison: Wisconsin Department of Natural
Resources.
Barbour, M. T., Gerritsen, J., Snyder, B. D., and Stribling, J. B. (1999). Rapid bioassessment protocols for
use in streams and wadeable rivers: periphyton, benthic macroinvertebrates, and fish, second edition.
Office of Water. Washington, D.C.: U.S. Environmental Protection Agency.
Bowes, M. J., House, W. A., and Hodgkinson, R. A. (2003). Phosphorus dynamics along a river continuum.
Science of the Total Environment, 313 (1), , 199‐212.
Bowes, M. J., Smith, J. T., Jarvie, H. P., and Neal, C. (2008). Modelling of Phosphorus Inputs to River from
Diffuse and Point Sources. Science of the Total Environment, 395 (2) , 125‐138.
Boxhorn, J. E., and Hahn, M. G. (2013). A restoration plan for the Root River watershed ‐ draft chapter IV:
Characterization of the watershed. Waukesha: Southeastern Wisconsin Regional Planning Commission.
Boxhorn, J. E., and Hahn, M. G. (2012). Root River Watershed Restoration Plan Draft Chapter I ‐
Introduction. Retrieved May 23, 2013, from Southeastern Wisconsin Regional Planning Commission:
http://www.sewrpc.org/SEWRPCFiles/Environment/RootRiverWshedRestorationPlan/capr‐316‐chapter‐
01‐draft.pdf
Brown, E., Caraco, D., and Pitt, R. (2004). Illicit Discharge Detection and Elimination: A Guidance Manual
for Program Development and Technical Assessments. Washington, D.C.: United States Environmental
Protection Agency.
Burzynski, M., and Helker, C. (2002). The state of the Root‐Pike river basin. Madison: Wisconsin
Department of Natural Resources.

6‐2
Carpenter, S. R., Caraco, N. F., Correll, D. L., Howarth, R. W., Sharpley, A. N., and Smith, V. H. (1998).
Nonpoint pollution of surface waters with phosphorus and nitrogen. Ecological Applications , 8 (3), 559‐
568.
Center for Watershed Protection (CWP). (2003). Impacts of impervious surface cover on aquatic systems.
Ellicott City: Center for Watershed Protection.
Clary, J., Jones, J., Urbonas, B. Q., Strecker, E., and Wagner, T. (2008). Can Stormwater BMPs Remove
Bacteria? New Findings from the International Stormwater BMP Database. At Press for Publication in
Stormwater Magazine May/June 2008 , 1‐14.
Clayton, N., Helmuth, L., Larson, A., Masnado, R., Minahan, K., and Prachell, C. (2012, April). Wisconsin
2012 Consolidated Assessment and Listing Methodology (WisCALM) for Clean Water Act Section 305(b),
314, and 303(d) Integrated Reporting. Retrieved May 11, 2013, from Wisconsin Department of Natural
Resources: http://dnr.wi.gov/topic/surfacewater/documents/FINAL_2012_WisCALM_04‐02‐12.pdf
Corsi, S. R., Graczyk, D. J., Geis, S. W., Booth, N. L., & Richards, K. D. (2010). A fresh Look at Road Salt:
Aquatic Toxicity and Water‐Quality Impacts on Local, Regional, and National Scales. Environ. Sci.
Technol. 44 (19), 7376‐82.
Craun, G., Calderon, R., and Craun, M. (2005). Outbreaks associated with recreational water in the
United States. International Journal of Environmental Health Research , 15 (4), 243‐262.
DeBarry, P. A. (2004). Watersheds: Processes, Assessment, and Management. Hoboken: John Wiley and
Sons, Inc.
Dufour, A. P. (1984). Health Effects Criteria for Fresh Recreational Waters. Washington, DC: United
States Environmental Protection Agency .
Eiswirth, M., and Hotzl, H. (1997). The impact of leaking sewers on urban groundwater. Groundwater in
the Urban Environment, 1 , 399‐404.
Field, K. (2005‐2007). Microbial Source Tracking: Its Utility and limitations toward the Protection of
Recreational Waters in the Great Lakes Basin. 59‐65: Great Lakes Science Advisory Board Priorities.
Hilsenhoff, W. L. (1987). An improved biotic index of organic stream pollution. The Great Lakes
Entomologist , 20 (1), 31‐36.
Hoerling, M., Schubert, S., and Mo, K. (2013). An interpretation of the origins of the 2012 Central Great
Plains drought: assessment report. Washington, D.C.: National Oceanic and Atmospheric Administration.
Junk, W. J., Bayley, P. B., and Sparks, R. E. (1989). The flood pulse concept in river‐floodplain systems. In:
Proceedings of the International Large River Symposium, ed. D.P. Dodge. 106, pp. 110‐127. Canadian
Special Publications: Fisheries and Aquatic Sciences.
6‐3
Karr, J., Fausch, K., Angermeier, P., Yant, P., and Schlosser, I. (1986). Assessing biological integrity in
running waters: a method and its rationale. Champaign: Illinois Natural History Survey.
Kutty, M. (1987). Site selection for aquaculture: chemical features of water. Port Harcourt: United
Nations Development Programme.
Lawrence, S. J. (2012). Escherichia coli bacteria density in relation to turbidity, streamflow
characteristics, and season in the Chattahoochee River near Atlanta, Georgia, October 2000 through
September 2008 ‐ Description, Statistical Analysis, and Predictive Modeling. Reston: U.S. Geological
Survey.
Lyons, J. (1992). Using the index of biotic integrity (IBI) to measure environmental quality in warmwater
streams of Wisconsin. General Technical Report NC‐149, United States Department of Agriculture, Forest
Service, St. Paul.
Malmqvist, B., and Rundle, S. (2002). Threats to the running water ecosystems of the world.
Environmental Conservation , 29 (2), 134‐153.
Minahan, K., and Masnado, B. (2007). Water Body Use Designations. Retrieved May 10, 2013, from
WDNR Water Monitoring Strategy:
http://dnr.wi.gov/topic/surfacewater/monitoring/strategy/Tier2/Ch10‐UseDes_MonStratV3_11‐6‐
2008.pdf
Minnesota Pollution Control Agency (MPCA). (2008). Turbidity: description, impact on water quality,
sources, measures ‐ a general overview. Retrieved May 16, 2013, from Minnesota Pollution Control
Agency: http://www.pca.state.mn.us/index.php/view‐document.html?gid=7854
Neal, C., Skeffington, R., Neal, M., Wyatt, R., Wickham, H., Hill, L. and Hewitt, N. 2004. Rainfall and
runoff water quality of the Pang and Lambourn, tributaries of the River Thames, south‐eastern England.
Hydrology and Earth System Sciences, 8(4), 601‐613.
Norris, R. H., and Thoms, M. C. (1999). What is river health? Freshwater Biology , 41, 197‐209.
Ortenblad, A. L., Bolha, D. A., and Anderson, R. C. (2003). Sustainability through biological monitoring on
the Root River Racine, Wisconsin. Milwaukee: Wisconsin Lutheran College.
Pandit, A. K. (1999). Freshwater Ecosystems of the Himalaya. New York: The Panthenon Publishing
Group.
Paul, M. J., and Meyer, J. L. (2001). Streams in the urban landscape. Annual Reviews of Ecological
Systems , 32, 333‐365.
Poff, N. L., Allan, J. D., Bain, M. B., Karr, J. R., Prestegaard, K. L., Richter, B. D., et al. (1997). The natural
flow regime. BioScience , 47 (11), 769‐784.

6‐4
Roth, N. E., Allan, J. D., and Erickson, D. L. (1996). Landscape influences on stream biotic integrity
assessed at multiple spatial scales. Landscape Ecology , 11 (3), 141‐156.
Roy, A. H., Rosemond, A. D., Paul, M. J., Leigh, D. S., and Wallace, J. B. (2003). Stream macroinvertebrate
response to catchment urbanisation (Georgia, USA). Freshwater Biology , 48, 329‐346.
Sahin, V., and Hall, M. (1996). The affects of afforestation and deforestation on water yields. Journal of
Hydrology , 178, 293‐309.
Sauer, E. P., VandeWalle, J. L., Bootsma, M. J., and McLellan, S. L. (2011). Detection of the human
specific Bacteroides genetic marker provides evidence of widespread sewage contamination of
stormwater in the urban environment. Water Research , 45, 4081‐4091.
Saunders, D. L., Meeuwig, J. J., and Vincent, A. C. (2002). Freshwater protected areas: strategies for
conservation. Conservation Biology , 16 (1), 30‐41.
Seurinck, S., Defoirdt, T., Verstraete, W., and Siciliano, S. D. (2005). Detection and quantification of the
human‐specific HF183 Bacteroides 16S rRNA genetic marker with real‐time PCR for assessment of
human faecal pollution in freshwater. Environmental Microbiology , 2, 249‐259.
Seyfried, P., Tobin, R., Brown, N., and Ness, P. (1985). A prospective study of swimming‐related illness: I.
swimming‐associated health risk. American Journal of Public Health , 75 (9), 1068‐1070.
Slawski, T. (2010). Managing the water's edge ‐ making natural connections. Waukesha: Southeastern
Wisconsin Regional Planning Commission.
Southeastern Wisconsin Regional Planning Commission (SEWRPC). (2007). Technical Report Number 39:
Water quality conditions and sources of pollution in the greater Milwaukee watersheds: Part two of
three: Chapters 5‐12. Waukesha: Southeastern Wisconsin Regional Planning Commission.
Southeastern Wisconsin Regional Planning Commission (SEWRPC). (2007). Water quality conditions and
sources of pollution in the Greater Milwaukee watersheds. Waukesha: Southeastern Wisconsin Regional
Planning Commission.
Statzner, B., and Higler, B. (1986). Stream hydraulics as a major determinant of benthic invertebrate
zonation patterns. Freshwater Biology , 16, 127‐139.
Tockner, K., and Stanford, J. (2002). Riverine floodplains: present state and future trends. Environmental
Conservation , 29, 308‐330.
United States Congress (U.S. Congress). (As amended through P.L. 107‐303, November 27, 2002).
Federal Water Pollution Control Act. Retrieved May 10, 2013, from U.S. Senate Committee on
Environment and Public Works: http://www.epw.senate.gov/water.pdf
United States Environmental Protection Agency (U.S. EPA). (1986). Ambient Water Quality for Bacteria.
Washington, D.C.: United States Environmental Protection Agency.

6‐5
United States Environmental Protection Agency (U.S. EPA). (2005). Microbial Source Tracking Guide
Document. Cincinnati: U.S. EPA Office of Research and Development.
United States Environmental Protection Agency (U.S. EPA). (2012b). Monitoring and Assessing Water
Quality ‐ Volunteer Monitoring. Retrieved May 15, 2013, from United States Environmental Protection
Agency Office of Water: http://water.epa.gov/type/rsl/monitoring/
United States Environmental Protection Agency (U.S. EPA). (2013). National Rivers and Streams
Assessment 2008‐2009. Office of Research and Development, Office of Wetlands, Oceans and
Watersheds. Washington, D.C.: US EPA.
United States Environmental Protection Agency (U.S. EPA). (2012c). Recreational Water Quality Criteria.
Retrieved May 18, 2013, from United States Environmental Protection Agency Office of Water:
http://water.epa.gov/scitech/swguidance/standards/criteria/health/recreation/upload/factsheet2012.p
df
United States Environmental Protection Agency (U.S. EPA). (2012a). The Economic Benefits of Protecting
Healthy Watersheds. Retrieved November 26, 2013, from
http://water.epa.gov/polwaste/nps/watershed/upload/economic_benefits_factsheet3.pdf
United States Geological Survey (U.S. Geological Survey). (variously dated). National field manual for the
collection of water‐quality data, book 9, chaps. A1‐A9. Retrieved May 16, 2013, from United States
Geological Survey Water Quality‐Information: http://water.usgs.gov/owq/FieldManual/
Wang, L., Lyons, J., Kanehl, P., and Gatti, R. (1997). Influences of watershed land use on habitat quality
and biotic integrity in Wisconsin streams. Fisheries , 22 (6), 6‐12.
Whitman, R., Nevers, M., and Byappanahalli, M. (2006). Examination of the watershed‐wide distribution
of Escherichia coli along southern Lake Michigan: an integrated approach. Applied and Environmental
Microbiology , 72 (11), 7301‐7310.
Wisconsin Department of Natural Resources (WI DNR). (2010). Chapter NR 102 ‐ Water quality
standards for Wisconsin surface waters. Retrieved May 10, 2013, from Wisconsin Legislative Documents
‐ Administrative Code: http://docs.legis.wisconsin.gov/code/admin_code/nr/100/102.pdf
Wisconsin Department of Natural Resources (WI DNR). (2004). Chapter NR 104 ‐ Uses and designated
standards. Retrieved May 10, 2013, from Wisconsin Legislative Documents ‐ Administrative Code:
http://docs.legis.wisconsin.gov/code/admin_code/nr/100/104.pdf
Wisconsin Department of Natural Resources (WI DNR). (2001). Guidelines for assessing fish communities
of wadable streams in Wisconsin. Bureau of Fisheries Management and Habitat Protection, Monitoring
and Data Assessment Section, Madison.

6‐6
Wisconsin Department of Natural Resources (WI DNR). (2000b). Guidelines for collecting
macroinvertebrate samples from wadable streams. Bureau of Fisheries Management and Habitat
Protection, Monitoring and Data Assessment Section, Madison.
Wisconsin Department of Natural Resources (WI DNR). (2000a). Guidelines for evaluating habitat of
wadable streams. Bureau of Fisheries Management and Habitat Protection, Monitoring and Data
Assessment Section, Madison.
Wisconsin Department of Natural Resources (WI DNR). (2013). Impaired Waters. Retrieved May 11,
2013, from Wisconsin Department of Natural Resources: http://dnr.wi.gov/topic/ImpairedWaters/
Wisconsin Department of Natural Resources (WI DNR). (2012b). Watershed ‐ Root River (SE03).
Retrieved May 23, 2013, from Wisconsin Department of Natural Resources:
http://dnr.wi.gov/water/watershedDetail.aspx?code=SE03andName=Root River
Wisconsin Department of Natural Resources (WI DNR). (2012a). Wisconsin Water Quality Report to
Congress ‐ Year 2012. Madison: Wisconsin Department of Natural Resources Water Division.
Wisconsin Department of Natural Resources (WI DNR). (2011). Wisconsin's Nonpoint Source Program
Management Plan ‐ FFY 2011‐2015. Retrieved May 11, 2013, from Wisconsin Department of Natural
Resources: http://dnr.wi.gov/topic/Nonpoint/documents/NPSProgramMgmtPlan6282011.pdf
Wisconsin State Legislature (WI SL). (2013). Wisconsin State Statutes: Chapter 281 ‐ Water and Sewage.
Retrieved May 11, 2013, from http://docs.legis.wisconsin.gov/statutes/statutes/281.pdf:
http://docs.legis.wisconsin.gov/statutes/statutes/281.pdf
Withers, P., and Jarvie, H. (2008). Delivery and cycling of phosphorus in rivers: a review. Science of the
Total Environment , 400, 379‐395.

Appendix 1 – Root River Site Surveys

Site #1: Legend Creek
Location and surrounding area:
Tributary to middle main stem of river inthe City of Franklin. Predominantlyresidential but in a woodland setting.Upstream areas comprised of golf courseand some parkland.and some parkland.
Stream bank conditions:
Stream banks are steep and eroded insome locations. Numerous mature treesand surrounding woodland habitat Looking downstream from sampling point in
i t N t t th d t bili ti lLooking upstream from sampling point in winter. N t t l t i d th d b idprovide some bank stabilization that
allows free meander and sinuosity.Habitat is good quality due to variedsubstrate facilitating riffles and poolformation.
winter. Note tree growth and stabilization along bank.
Note two culvert pipes underneath road bridge.
Steep bank erosion
Infrastructure:
No storm water outfalls were found.Creek is channelized as it flows underthe upstream street bridge and throughtwo culvert pipes which may inhibit fish
erosion
passage.
Other comments:
A buildup of foam was occasionallyobserved just downstream of thesampling point but detergent levels were
Good meander and sinuosity at 50 meters Evidence of riffles, a variety of substrate sizes, sampling point but detergent levels werenot found to be high.
upstream of sampling point. Mature wooded habitat provides near to full canopy cover.
and some steep bank erosion at 50 meters downstream of sampling point.

Site #2: RRC‐Union Grove
Location and surrounding area:
Location is downstream of Union GroveWastewater Treatment Plant (WWTP).WWTP effluent provides the stream flowfor this upper section of the westerncanal branch. Land use is primarily
Twoculverts
canal branch. Land use is primarilysuburban immediately upstream of thesampling point; downstream is largelyagricultural.
Stream bank conditions:
St b k h li d b t hLooking downstream from sampling point in
i N t k t bili ti t b kLooking upstream across 67th Drive from the
li i t i i T l t i j iStream banks are channelized but haveadequate rock and vegetative cover.
Infrastructure:
The effluent discharge pipe from UnionGrove WWTP discharges to the Root
spring. Note rock stabilization on stream banks, limited meander, and agricultural land on right.
sampling point in spring. Two culvert pipes join underneath road bridge to form one.
gRiver at this location. One stormwateroutfall, which drains a parking lot, parkand subdivision to the southwest alsodischarges at this location, however nohigh levels of bacteria were detected.The canal passes through an elevated
Housing subdivision
The canal passes through an elevatedculvert underneath 67th Drive whichlikely inhibits fish passage.
Other comments:
This canal section is classified as Limitedf h ffl
Canal streambed upstream of wastewater Culvert for main canal flow is on right and storm Aquatic Life since the WWTP effluentdischarge provides the main streamflow.
effluent pipe is ephemeral, depending upon rainfall for flow.
water outfall for park and housing subdivision is on left.

Site #3: Raymond Creek Highly vegetated in summer
Flood plain connectionLocation and surrounding area:
Tributary flows through woodland butarea is surrounded by abundantagricultural land located in centralRacine County. This tributary dischargesinto the west branch of the Root River
Flood plain connection
into the west branch of the Root RiverCanal upstream of Site #4: RRC‐West.
Stream bank conditions:
Stream banks are naturalized, havegenerally low slopes, good meander, and
dl d t t d b ff t
Looking downstream from sampling point duringhigh flooding period in winter (left) and close to
Looking upstream from sampling point duringhigh flooding period in winter (left) and close to
woodland or vegetated buffer systems.Low slopes allow for greater flood plainconnection. Stream banks are eroded,however, in steep riparian areas locateddownstream.
g g p ( )no flow in summer (right).
g g p ( )no flow in summer (right).
Infrastructure:
One ditch drains a nearby street andresidential runoff was noted justdownstream of the sampling point butthis was not a major contributing sourceof bacteria or other pollutants.of bacteria or other pollutants.
Other comments:
This creek is not ephemeral but can haveextremely low flow during dry periods.Water sometimes built up during lowfl d l l d d
Woody debris buildup with aggregated scum Steep eroded slope located below residential flow periods, particularly around woodydebris.
upstream of sampling point. area 50 meters downstream of sampling point.

Site #4: RRC‐West
Location and surrounding area:
Sampling site was located near the endof the western branch of the Root RiverCanal in a predominantly agriculturalarea of central Racine County.
Stream bank conditions:
Stream banks are channelized, uniform,and relatively steep. Well vegetated withtall grasses in summer. Some steeperportions downstream of the samplingl ti hi hl d d T
Looking downstream from sampling point duringhi h fl di i d i i t (l ft) d l
Looking upstream from sampling point duringhi h fl di i d i i t (l ft) d llocation are highly eroded. Trees are
generally set back at least 5 meters fromedge, thus providing little canopy to theriver.
Infrastructure:
high flooding period in winter (left) and lower flow in fall (right).
high flooding period in winter (left) and lower flow in fall (right).
No nearby infrastructure was found.Creek flows through a bridge culvertunderneath the road at the samplingpoint which may inhibit fish passage.
Other comments:Other comments:
Algal blooms and vegetative buildupcould be high during the summermonths, likely due to little canopy andhigh nutrients. Channelization allows forbuildup of fine sediments in the canal.l dd l f d
Trees closer than 5 meters to stream bank Accumulation of high algal growth (left) and fine Planting additional trees for canopy andinvestigating areas to re‐establish ameander would be beneficial.
provide canopy (erosional). Bank with tall grasses show little erosion (depositional).
sediment in canal bed (right).

Site #5: RRC‐Fonk’s
Location and surrounding area:
Sampling location is downstream ofFonk’s Home Center WastewaterTreatment Plant (WWTP). Their effluentdischarge pipe is located close toheadwaters of the eastern canal branch.headwaters of the eastern canal branch.Land use if primarily suburban along thewest bank but the remaining area islargely agricultural.
Stream bank conditions:
St b k h li d ifLooking downstream across Highway 11 from
li i t iLooking upstream from sampling point during
(l ft) U t F k’ W t tStream banks are channelized, uniform,very steep, and highly eroded. Near tofull canopy of stream due to tree cover.
Infrastructure:
Besides the wastewater treatment plant
sampling point in summer. summer (left). Upstream, Fonk’s Wastewater Treatment Plant effluent discharge pipe (right).
peffluent discharge pipe, one agriculturaldrainage tile with low to no flow wasfound. The canal flows through a bridgeculvert, which may inhibit fish passage.
Other comments:Other comments:
This canal section is classified as LimitedAquatic Life due to the WWTP effluentdischarge. Channelized conditions allowfor extensive buildup of fine sedimentsin the canal. Large pieces of trash weref b d b dd d b d
Accumulation of large pieces of trash in mucky Highly eroded east bank 100 meters upstream of often observed embedded in bedsediments.
sediment during low flow period. sampling point.

Site #6: RRC‐EastTree
Location and surrounding area:
Located near the terminal end of theeastern branch of the Root River Canal ina predominantly agricultural area. Thereis a private residence to the west and adirt driveway leading to a recreational
Tree stumps
dirt driveway leading to a recreationalpark to the east of the sampling location.
Stream bank conditions:
Stream banks are mainly channelized,steep, and can be eroded. Bankundercutting was observed Little direct
Looking downstream from sampling point in S 2011 N t t t d l
Looking upstream from sampling point duringN t hi hl h li d b t t t dundercutting was observed. Little direct
tree cover exists due to removal ofvegetation downstream of the samplinglocation in 2011. Low grasses andinvasive plants (purple loosestrife) haveextensively grown in their place.
Summer, 2011. Note tree stumps and less vegetation than 2012 (below).
summer. Note highly channelized but vegetated stream banks.
Concrete pieces
Undercut bank
Infrastructure:
A ditch that drains the road andsurrounding area is 0.5 metersdownstream of the sampling point.However, monitoring indicated limitedpollution. One small agricultural draintile was noted 100 meters upstream.
Other comments:
This canal section is classified as LimitedForage Fish. Large pieces of concrete Looking downstream from sampling point in Large pieces of concrete 75 meters downstream g g pwere observed downstream along theeast bank, possibly placed as an erosioncontrol measure.
Summer, 2012. Note extensive vegetative growth and purple loosestrife on right bank.
of sampling point (left). Eroded undercut banks on upstream west bank (right).

Site #7: RRC‐Main
Location and surrounding area:
This site is downstream of theconfluence of the east and west RootRiver canal branches. Predominantlyagricultural land (cattle and row crops)but there are a few private residencesbut there are a few private residencesand a park are also present.
Stream bank conditions:
Stream banks are steep and have nomeander due to deep channelization.Th b k d d d b
Looking downstream from sampling point in i R l t d ithi f
Looking upstream from sampling point in N t ttl i l d f d ff tThe banks are eroded and can be
become highly vegetated with grassesduring the summer.
Infrastructure:
No storm water infrastructure or
spring. Row crops are planted within a few meters of east (right) bank.
summer. Note cattle grazing land fenced off to within 5 meters of west (right) bank.
agricultural drain tiles were noted at thislocation.
Other comments:
Due to highly eroded banks, finesediment build‐up was high. Extensivesediment build up was high. Extensivealgal growth occurred during thesummer, likely due to high nutrients andfull direct sunlight. Potential sources ofbacteria and nutrients are plentiful andthere are currently no mechanisms inplace to prevent runoff Wide buffer
U.S. Geological Survey Discharge Gauging Looking upstream from sampling point during place to prevent runoff. Wide bufferstrips with trees could provide filtration,shade, and bank stabilization.
Station on east (right) bank provides continuous volumetric flow rate measurements.
winter flooding episode. Flooded areas in parkland (left) and in cattle grazing land (right).

Site #8: Husher Creek
Location and surrounding area:
Tributary to main stem in eastern RacineCounty. Predominantly agricultural land(row crops) with a few nearby homes.
Stream bank conditions:Stream bank conditions:
Stream banks are highly channelizedupstream but downstream locationshave considerable meanders andmoderately inclined banks. The streambank is highly vegetated upstream of the
li l ti ith thi k d dWest bank buffer upstream measures between 4 d 10 t id b t k d
Looking upstream (left) and downstream (right) f th li i t isampling location with thick reeds and
grasses. Downstream is a mixture ofwoodland and grasses.
Infrastructure:
No storm water infrastructure was noted
4 and 10 meters wide between creek and surrounding agricultural field.
from the sampling point in summer.
but one agricultural drain tile wasidentified approximately 50 metersupstream. Sampling point was from anoverarching bridge that sits on a culvert;culvert may inhibit fish passage.
Other comments:
Upstream habitat could be improved:gentler bank slopes, wider buffer strips,increased canopy, and reinstitutingstream meanders. Samples testedpositive for human specific markers
Downstream of sampling point the banks are Upstream of sampling point in highly positive for human‐specific markersduring monitoring. Upstream areasshould be examined for faulty sanitarysystems.
gentler, meanders occur, and adequate tree canopy exists.
channelized area that becomes very dense with reed/grass growth.

Site #9: 38 at MKE Co Line
Location and surrounding area:
Sampling site was located on the mainstem of the Root River at the MilwaukeeRacine county line. Location surroundedby a variety of land uses: residential,wooded parkland and open space.wooded parkland and open space.
Stream bank conditions:
The stream channel is wide at this mainstem section and bank slopes aregradual, allowing excess waters to Looking downstream during flood conditions
f li i t i i t B k lLooking downstream during normal flow
diti f li i t iconnect with flood plain. Some areas oferosion and undercutting were notedand low‐level deposition occurred onopposing banks. Additional habitat, suchas ephemeral pools or ponds, have beencreated via connectivity to the flood
from sampling point in winter. Bank slopes are moderate and river connects with flood plain.
conditions from sampling point in summer. Upstream is similar habitat conditions.
yplain. The tree canopy is full next to thebanks and provides woody debrisbuildup.
Infrastructure:
N t t i f t tNo stormwater infrastructure oragricultural tiles were found near thissampling location.
Other comments:
An assessment for native versus invasive Downstream of sampling point on south bank is Upstream of sampling point on north bank is
plant species within the adjacentwoodland area may provide insight intothe quality of the ecosystem.
ephemeral pool habitat created after flood water recession.
Milwaukee County Parks dirt recreational trail next to river.

Site #10: 5 Mile Road
Location and surrounding area:
Located on the main stem of the river ineastern Racine County. Sampling pointis surrounded by open recreationalparkland, some woodland, privateresidences, and agriculture (row crops).residences, and agriculture (row crops).
Stream bank conditions:
The stream channel is relatively wideand cuts deep, particularly near thepark, which has a grass buffer strip. Highlevels of erosion occur here. Some flood
Looking downstream during normal flow diti f li i t i f ll
Looking upstream during normal flow conditions f li i t i f lllevels of erosion occur here. Some flood
plain connection and deposition occurson the woodland side. Tree canopycover is low upstream but moderate tohigh downstream. Downstreamwoodland east bank buffer strip width isbetween 5 and 50 meters Bank
conditions from sampling point in fall. from sampling point in fall.
between 5 and 50 meters. Bankundercutting has occurred in somelocations, as evidenced by the exposedtree roots.
Infrastructure:
No storm water infrastructure wasNo storm water infrastructure wasnoted. One agricultural drain tile wasfound downstream.
Other comments: Balancing recreational access withstream bank naturalization in the park
Cabbage field on west bank side of river Steep eroded bank next to open parkland (left stream bank naturalization in the parkmay help reduce erosion.
downstream of sampling point. arrow) and shallow slope leading to woodland area (right arrow).

Site #11: Hoods Creek
Location and surrounding area:
This sampling location was located on atributary to the main stem of the RootRiver, in eastern Racine County. Theimmediate area is residential land with amoderate amount of woodland andmoderate amount of woodland andagricultural lands upstream. TheYorkville Wastewater Treatment Plant(WWTP) discharges to the Root Riverapproximately 6.5 miles upstream.
Stream bank conditions:Looking downstream during normal flow
diti f li i t i iLooking upstream during normal flow conditions f li i t i i
Stream bank conditions:
Stream banks are in fair condition inmost spots with a moderate amount ofgrass and woodland serving as a bufferstrip. The creek is fairly deep and doesn’thave much flood plain connection Banksare severely undercut upstream
conditions from sampling point in spring. from sampling point in spring.
are severely undercut upstream.
Infrastructure:
No storm water infrastructure oragricultural drain tiles were observed.
Other comments:
This tributary section is classified asLimited Forage Fish. Nutrient loadingfrom the upstream WWTP andagricultural production is likely. Streambank stabilization may help with erosionin high cut areas. Removal of crumbling Upstream is an old abandoned rail bridge with Steep eroded bank upstream of sampling point. g ginfrastructure associated with therailway is recommended.
crumbling infrastructure. Woody debris and various substrate sizes are evident in this habitat.
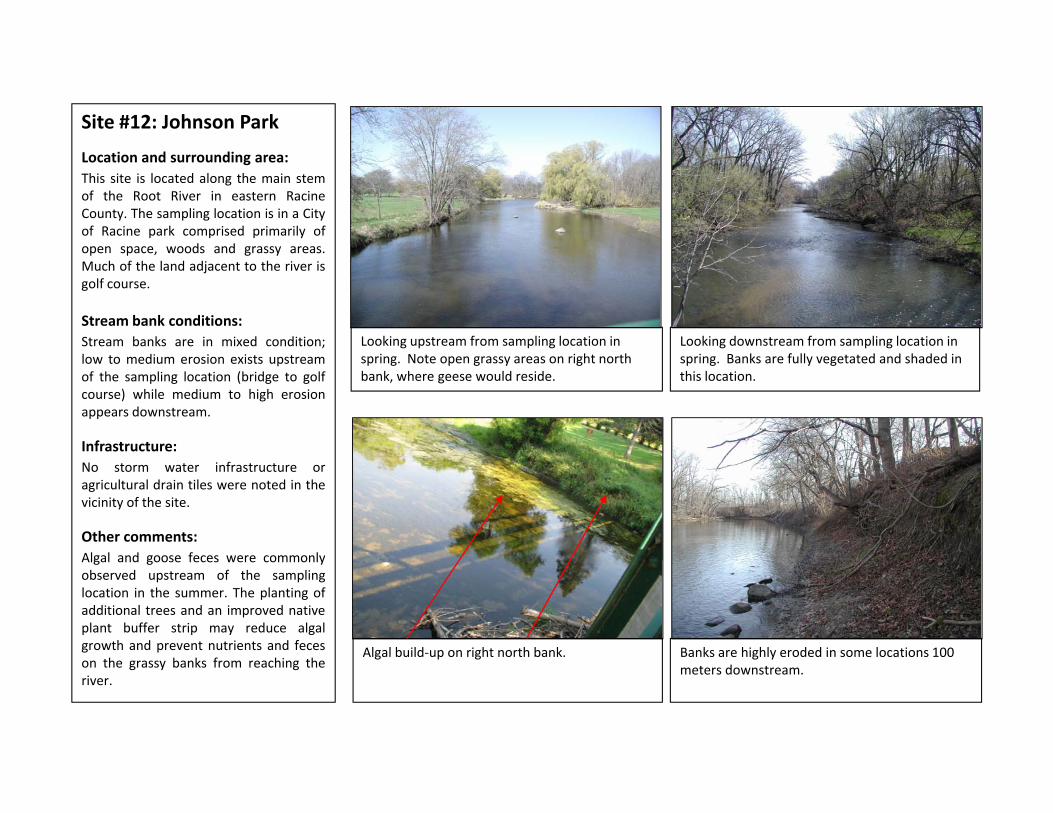
Site #12: Johnson Park
Location and surrounding area:
This site is located along the main stemof the Root River in eastern RacineCounty. The sampling location is in a Cityof Racine park comprised primarily ofopen space, woods and grassy areas.open space, woods and grassy areas.Much of the land adjacent to the river isgolf course.
Stream bank conditions:
Stream banks are in mixed condition;l t di i i t t
Looking downstream from sampling location in i B k f ll t t d d h d d i
Looking upstream from sampling location in i N t i ht thlow to medium erosion exists upstream
of the sampling location (bridge to golfcourse) while medium to high erosionappears downstream.
Infrastructure:
spring. Banks are fully vegetated and shaded in this location.
spring. Note open grassy areas on right north bank, where geese would reside.
No storm water infrastructure oragricultural drain tiles were noted in thevicinity of the site.
Other comments:
Algal and goose feces were commonlyAlgal and goose feces were commonlyobserved upstream of the samplinglocation in the summer. The planting ofadditional trees and an improved nativeplant buffer strip may reduce algalgrowth and prevent nutrients and feceson the grassy banks from reaching the
Banks are highly eroded in some locations 100 Algal build‐up on right north bank. on the grassy banks from reaching theriver.
meters downstream.

Site #13: 31 and 4 Mile
Location and surrounding area:
This location is on the main stem of theRoot River in eastern Racine County. It issurrounded by a mix of residential land,agricultural fields(row crops), livestock(horses) and some wooded areas.
Algal build‐up
(horses) and some wooded areas.
Stream bank conditions:
The Root River is wide in this stretch,particularly near the Highway 31 bridge.Stream banks are in mixed condition;
di t hi h i i tLooking downstream from sampling location in
i Hi h l l f l b ild i thiLooking upstream from sampling location in
medium to higher erosion in steeperupstream areas but little erosion on thegentler slopes located downstream ofthe sampling site. Downstream areasalso connect with a large flood plain.Tree canopy is adequate except for near
spring. High levels of algae can build up in this open and shallow area during summer.
summer.
the Hwy 31 bridge.
Infrastructure:
A storm water sluice gate sits on thenorth bank downstream of the samplingpoint, but runoff is filtered through ap , gwetland area prior to reaching the river.No other infrastructure was observed.
Other comments:
Due to the large width, the river wasslow moving and hence frozen for the
In the downstream section, connection with the View of sampling point and large double bridge slow‐moving and hence frozen for themajority of the winter reducing thenumber of data points.
flood plain allows for creation of pool habitats. infrastructure which facilitates widening and reduces the tree canopy.

Site #14: Horlick Dam
Location and surrounding area:
This main stem sampling location is inthe City of Racine. It is surrounded bycommercial, residential, open space, andpark land.
Stream bank conditions:
Above the dam, the water is deep, finesediments settle out, and it is verysimilar to a lake environment. Streambanks are more naturalized here and
t t d d dLooking downstream from the sampling point in th f ll d l fl diti (l ft) d ith
Looking upstream at the dam from the sampling i t i f ll d i l fl (l ft) d fl di
Riffles
connect to open space and woodedparkland. Water depth decreases belowthe dam, substrate is comprised ofbedrock and rubble, riffles are present,and flow is directed by concrete/stonewalls and a large set‐back bluff. Tree
the fall under low flow conditions (left) and with typical flow during the spring (right).
point in fall during low flow (left) and a flooding episode in the winter of 2012 (right).
canopy is adequate near the woodedareas both above and below the dam.
Infrastructure:
A USGS flow rate gauging station, andthree storm water outfalls are locatedbelow the dam. The northwest outfalldischarge has had consistently high pHand conductivity. The east outfall hascompromised infrastructure and shouldbe fixed.
Year‐round resident duck population living Horlick Dam Northwest (left, both discharge
Other comments:
There is a near year‐round duck population near this site.
below the dam ranges from five to 75 ducks. points) and East outfalls (right). East outfall end pipe has disconnected from discharge point.

Site #15: Steelhead Facility
Location and surrounding area:
This site is located on the main stem ofthe Root River in the City of Racine. It issurrounded by parkland and residentialareas. The WI DNR Steelhead Facility andweir is immediately downstream .weir is immediately downstream .
Stream bank conditions:
The stream banks range from gentlysloped to steep. Condition ranges fromgrassy, eroded with or without
h i t t t b tt dLooking downstream from sampling location in i t Fi h i t idth d
Looking upstream from the sampling location in i t N t t h lf d i l d
Concrete shelf
overhanging tree roots, to buttressedwith rock pilings or concrete shelves.Substrate is varied in size and createsriffles. Tree canopy is adequate in areasaway from the open/grassy areas.
f
winter. Fish weir runs across stream width and free‐standing rocks stabilize nearby banks.
winter. Note concrete shelf and grass island on south (left) bank and grassed area on north bank
Infrastructure:
No storm water infrastructure oragricultural drain tiles exist at thislocation. The downstream weir runsacross the river to direct fish into thesteelhead facility for egg collection. Any ggupstream outfall type pipe transfers thefish from the facility back into the river.
Other comments:
Buffers in park are adequate but may contain invasive species These
Steep eroded banks (left) at the foot of a bluff Deteriorated concrete pillars do not appear to be contain invasive species. These should be identified and eradicated.
with residences on west bank and free‐standing rock pilings on east bank next to park (right).
functional , are collecting large debris and should be investigated for removal.

Site #16: Liberty Street BridgeBridge
Location and surrounding area:
This site was located on the main stemof the river in the City of Racine. It issurrounded by urban residential areasalong the east bank and parkland alongalong the east bank and parkland alongthe west bank.
Stream bank conditions:
The vast majority of the stream banksare stabilized by rocks and stone walls.S d t d
Looking downstream from sampling location on b id i i N t ti ti f k ll
Looking upstream from sampling point in spring. M d t k t t (l ft) b k dSome meanders occur upstream and
downstream but they are limited.
Infrastructure:
Three storm water outfalls are located inthe vicinity: two small outfalls on the
th t d th t id f th
bridge in spring. Note continuation of rock wall support on both stream banks.
Moderate rock support on west (left) bank and established rock walls on east (right) bank.
southeast and southwest sides of thebridge, and one large outfall located 50meters upstream.
Other comments:
The southeast outfall samples were highf h k h h dfor human markers, phosphorus, anddetergents. A sanitary sewer line froman uphill house was disconnected fromthe storm sewer and dry weather flowfrom the outfall ceased. The largeupstream outfall was tested four times High levels of detergents found in southeast Uphill sanitary sewage source (left arrow) and and may also be a source of fecalpollution loading to the Root River;testing should continue. The southwestoutfall was always dry.
outfall (note foaming present in storm water discharge).
southeast outfall (right arrow).

Site #17: REC
Location and surrounding area:
This site was located on the main stemof the river, at the City of Racine/UW‐Parkside REC Center, just prior to thechannelized downtown area. It issurrounded by commercial, industrial,surrounded by commercial, industrial,and high density residential housing.Large amounts of impervious surface arepresent at/downstream of this site.
Stream bank conditions:
Th i i id h d h lView looking downstream from the sampling
i t f th REC ki l t Thi i thLooking upstream from sampling point in spring. G d ith k ll f b k
Sampling Location
The river is wide here and has a slowflow which facilitates the accumulationof fine sediments on the northwest banknear the sampling location. The streambanks are generally gently sloped withgrassy buffers upstream. Downstream,
point from the REC parking lot. This is the beginning of channelized section of the river.
Grassed areas with some rock walls for bank stabilization.
the river is channelized by steel andconcrete walls extending through thedowntown area to the mouth. The treecanopy is generally low here due to thelarge width, with the exception ofmoderate tree cover in grassed areasupstream.
Infrastructure:
Some small storm water drainage pipes exist along the channelized portions.
East bank of channelized river portion with Root River Environmental Education Community
Other comments:
The open waters and slow flow allow for some high summer algal growth.
industrial/commercial land use visible in the background .
Center (REC) sign in front of educational building.

Site #18: Chartroom Channelized river walls
Location and surrounding area:
Located on the main of the river, justupstream from the mouth, in the City ofRacine in channelized downtown area.Site is surrounded by commercialproperties containing large amounts ofproperties containing large amounts ofimpervious surface.
Stream bank conditions:
The river is controlled by steel andconcrete‐reinforced walls comprising theh l l di t f th R t Ri
Looking downstream from sampling point in Looking upstream from sampling point in A i h li d th h th h b
Sampling point
channel leading out from the Root Rivermouth to the harbor. No erosion wasnoted. Substrate could not be assesseddue to deep river conditions. No to verylittle tree canopy exists.
f
summer. summer. Area is channelized through the harbor until the mouth of the river at Lake Michigan.
Infrastructure:
Several small storm water outfall pipesexit through the channelized walls atregular intervals.
Other comments:
Lake Michigan intrusion into the RootRiver at this location artificiallydecreased assessed water qualityparameter concentrations, i.e. bacteria,phosphorus, turbidity, and conductivity.The large expanse of open water and
Root River harbor at sunset (courtesy Scott Root River recreational pathway along river (left) The large expanse of open water andlow flow facilitated full freezing;minimal winter sampling occurred.
Anderson, Racine Journal Times). and Chartroom Charlie’s restaurant and marina in background (right picture).

Appendix 2 – Root River Decision Trees

7-19
Key: IC = Impervious Cover OF = Stormwater Outfall PPT = Precipitation R2 = Degree of Determination (Regression)
= Decision Tree Path
Focus on nearby areas for bank stabilization. Investigate upstream golf course for grassed buffers to convert to long-rooted native vegetation. Legend Creek does have a significant positive relationship (p<0.05) with 24 and 48 hr PPT, but the R2 values are not above the prescribed thresholds.
Yes
Storm water outfalls nearby with DWF? Nearby leaky septic systems?
No
Yes
Major priority: Monitor OF if not
already. Investigate source of DWF and
eliminate.
No
Low priority: Look at localized
areas of improvement
Medium priority: Reduce runoff in
local area, consider stream bank
improvements
E. coli exceedance >40% in dry weather? & >50% in 24 hr PPT?
No
E. coli exceedance > 40% in 24 hr PPT?
No Yes
Med–High priority: Reduce storm water
runoff through buffer/filter strips as
appropriate
Pollution from upstream sites. Insufficient buffer strips?
Yes
High IC??
OFs / animal
feedlots?
Eroded stream banks / lack of buffer strip?
Low-Med priority: Reduce storm water runoff – infiltration
systems/buffers, etc.
Yes No
Low priority: look at localized
areas of improvement
Low-Med priority: Consider stream bank
improvements – vegetate/buffer strips
#1: Legend Creek
E. coli response to 24 hr PPT? (r2>0.65)
E. coli responds to 48 hr PPT?
(r2>0.5)
E. coli exceedance > 50% within 24 hr PPT?
Medium Priority: Storm water runoff
management, improve sites
upstream

7-20
Key: IC = Impervious Cover OF = Stormwater Outfall PPT = Precipitation R2 = Degree of Determination (Regression)
= Decision Tree Path
Upstream E. coli levels were analyzed and found to be negligible compared to the wastewater treatment plant effluent. Investigate upstream and downstream areas where stream could be allowed to meander.
Yes
Storm water outfalls nearby with DWF? Nearby leaky septic systems?
No
Yes
Major priority: Monitor OF if not
already. Investigate source of DWF and
eliminate.
No
Low priority: Look at localized
areas of improvement
Medium priority: Reduce runoff in
local area, consider stream bank
improvements
E. coli exceedance >40% in dry weather? & >50% in 24 hr PPT?
No
E. coli exceedance > 40% in 24 hr PPT?
No Yes
Med–High priority: Investigate E. coli
sources upstream to determine if other
sources exist.
Pollution from upstream (wastewater treatment plant) sites.
Yes
High IC??
OFs / animal
feedlots?
Eroded stream banks / lack of buffer strip?
Low-Med priority: Reduce storm water runoff – infiltration
systems/buffers, etc.
Yes No
Low priority: look at localized
areas of improvement
Low-Med priority: Consider stream bank
improvements – vegetate/buffer strips
#2: RRC – Union Grove
E. coli response to 24 hr PPT? (r2>0.65)
E. coli responds to 48 hr PPT?
(r2>0.5)
E. coli exceedance > 50% within 24 hr PPT?
Medium Priority: Storm water runoff
management, improve sites
upstream

7-21
Key: IC = Impervious Cover OF = Stormwater Outfall PPT = Precipitation R2 = Degree of Determination (Regression)
= Decision Tree Path
Yes
Storm water outfalls nearby with DWF? Nearby leaky septic systems?
No
Yes
Major priority: Monitor OF if not
already. Investigate source of DWF and
eliminate.
No
Low priority: Look at localized
areas of improvement
Medium priority: Reduce runoff in
local area, consider stream bank
improvements
E. coli exceedance >40% in dry weather? & >50% in 24 hr PPT?
No
E. coli exceedance > 40% in 24 hr PPT?
No Yes
Med–High priority: Reduce storm water
runoff through buffer/filter strips as
appropriate
Pollution from upstream sites. Insufficient buffer strips?
Yes
High IC??
OFs / animal
feedlots?
Eroded stream banks / lack of buffer strip?
Low-Med priority: Reduce storm water runoff – infiltration
systems/buffers, etc.
Yes No
Low priority: look at localized
areas of improvement
Low-Med priority: Consider stream bank
improvements – vegetate/buffer strips
#3: Raymond Creek
E. coli response to 24 hr PPT? (r2>0.65)
E. coli responds to 48 hr PPT?
(r2>0.5)
E. coli exceedance > 50% within 24 hr PPT?
Medium Priority: Storm water runoff
management, improve sites
upstream
Check upstream for additional stream flow sources that may have elevated E. coli counts during dry weather. Increase buffer strips from nearby farm fields. Raymond Creek does have a significant positive relationship (p<0.05) with 24 and 48 hr PPT, but the R2 values are not above the prescribed thresholds.

7-22
Key: IC = Impervious Cover OF = Stormwater Outfall PPT = Precipitation R2 = Degree of Determination (Regression)
= Decision Tree Path
Yes
Storm water outfalls nearby with DWF? Nearby leaky septic systems?
No
Yes
Major priority: Monitor OF if not
already. Investigate source of DWF and
eliminate.
No
Low priority: Look at localized
areas of improvement
Medium priority: Reduce runoff in
local area, consider stream bank
improvements
E. coli exceedance >40% in dry weather? & >50% in 24 hr PPT?
No
E. coli exceedance > 40% in 24 hr PPT?
No Yes
Med–High priority: Reduce storm water
runoff through buffer/filter strips as
appropriate
Pollution from upstream sites. Insufficient buffer strips?
Yes
High IC??
OFs / animal
feedlots?
Eroded stream banks / lack of buffer strip?
Low-Med priority: Reduce storm water runoff – infiltration
systems/buffers, etc.
Yes No
Low priority: look at localized
areas of improvement
Low-Med priority: Consider stream bank
improvements – vegetate/buffer strips
#4: RRC - West
E. coli response to 24 hr PPT? (r2>0.65)
E. coli responds to 48 hr PPT?
(r2>0.5)
E. coli exceedance > 50% within 24 hr PPT?
Medium Priority: Storm water runoff
management, improve sites
upstream
Increase buffer widths around nearby farm fields, particularly those with animals. Investigate agricultural drain tiles that may benefit from a filtration system. Increase buffer strips from nearby farm fields. RRC-West does have a significant positive relationship (p<0.05) with 48 hr PPT, but the R2 values are not above the prescribed thresholds.

7-23
Key: IC = Impervious Cover OF = Stormwater Outfall PPT = Precipitation R2 = Degree of Determination (Regression)
= Decision Tree Path
Yes
Storm water outfalls nearby with DWF? Nearby leaky septic systems?
No
Yes
Major priority: Monitor OF if not
already. Investigate source of DWF and
eliminate.
No
Low priority: Look at localized
areas of improvement
Medium priority: Reduce runoff in
local area, consider stream bank
improvements
E. coli exceedance >40% in dry weather? & >50% in 24 hr PPT?
No
E. coli exceedance > 40% in 24 hr PPT?
No Yes
Med–High priority: Investigate E. coli
sources upstream to determine if other
sources exist.
Pollution from upstream (wastewater treatment plant) sites.
Yes
High IC??
OFs / animal
feedlots?
Eroded stream banks / lack of buffer strip?
Low-Med priority: Reduce storm water runoff – infiltration
systems/buffers, etc.
Yes No
Low priority: look at localized
areas of improvement
Low-Med priority: Consider stream bank
improvements – vegetate/buffer strips
#5: RRC – Fonk’s
E. coli response to 24 hr PPT? (r2>0.65)
E. coli responds to 48 hr PPT?
(r2>0.5)
E. coli exceedance > 50% within 24 hr PPT?
Medium Priority: Storm water runoff
management, improve sites
upstream
Upstream human-marker Bacteroides tests indicated possible sanitary infiltration beyond wastewater treatment plant. Further upstream investigation for leaky septic systems or other bacterial sources may be beneficial. RRC-Fonk’s does have a significant positive relationship (p<0.05) with 24 hr PPT, but the R2 values are not above the prescribed thresholds.

7-24
Key: IC = Impervious Cover OF = Stormwater Outfall PPT = Precipitation R2 = Degree of Determination (Regression)
= Decision Tree Path
Yes
Storm water outfalls nearby with DWF? Nearby leaky septic systems?
No
Yes
Major priority: Monitor OF if not
already. Investigate source of DWF and
eliminate.
No
Low priority: Look at localized
areas of improvement
Medium priority: Reduce runoff in
local area, consider stream bank
improvements
E. coli exceedance >40% in dry weather? & >50% in 24 hr PPT?
No
E. coli exceedance > 40% in 24 hr PPT?
No Yes
Med–High priority: Reduce storm water
runoff through buffer/filter strips as
appropriate
Pollution from upstream sites. Insufficient buffer strips?
Yes
High IC??
OFs / animal
feedlots?
Eroded stream banks / lack of buffer strip?
Low-Med priority: Reduce storm water runoff – infiltration
systems/buffers, etc.
Yes No
Low priority: look at localized
areas of improvement
Low-Med priority: Consider stream bank
improvements – vegetate/buffer strips
#6: RRC - East
E. coli response to 24 hr PPT? (r2>0.65)
E. coli responds to 48 hr PPT?
(r2>0.5)
E. coli exceedance > 50% within 24 hr PPT?
Medium Priority: Storm water runoff
management, improve sites
upstream
Investigate areas to incorporate meander within the currently channelized canal. Replant trees along canal. RRC-East does have a significant positive relationship (p<0.05) with 24 and 48 hr PPT, but the R2 values are not above the prescribed thresholds.

7 -25
Yes
Storm water outfalls nearby with DWF? Nearby leaky septic systems?
No
Yes
Major priority: Monitor OF if not
already. Investigate source of DWF and
eliminate.
No
Low priority: Look at localized
areas of improvement
Medium priority: Reduce runoff in
local area, consider stream bank
improvements
E. coli exceedance >40% in dry weather? & >50% in 24 hr PPT?
No
E. coli exceedance > 40% in 24 hr PPT?
No Yes
Med–High priority: Reduce storm water
runoff through buffer/filter strips as
appropriate
Pollution from upstream sites. Insufficient buffer strips?
Yes
High IC??
OFs / animal
feedlots?
Eroded stream banks / lack of buffer strip?
Low-Med priority: Reduce storm water runoff – infiltration
systems/buffers, etc.
Yes No
Low priority: look at localized
areas of improvement
Low-Med priority: Consider stream bank
improvements – vegetate/buffer strips
#7: RRC - Main
E. coli response to 24 hr PPT? (r2>0.65)
E. coli responds to 48 hr PPT?
(r2>0.5)
E. coli exceedance > 50% within 24 hr PPT?
Medium Priority: Storm water runoff
management, improve sites
upstream
Key: IC = Impervious Cover OF = Stormwater Outfall PPT = Precipitation R2 = Degree of Determination (Regression)
= Decision Tree Path
Increase buffer widths around nearby farm fields, particularly those with animals. Investigate agricultural drain tiles that may benefit from a filtration system. RRC-Main does have a significant positive relationship (p<0.05) with 24 and 48 hr PPT, but the R2 values are not above the prescribed thresholds.

7-26
Yes
Storm water outfalls nearby with DWF? Nearby leaky septic systems?
No
Yes
Major priority: Monitor OF if not
already. Investigate source of DWF and
eliminate.
No
Low priority: Look at localized
areas of improvement
Medium priority: Reduce runoff in
local area, consider stream bank
improvements
E. coli exceedance >40% in dry weather? & >50% in 24 hr PPT?
No
E. coli exceedance > 40% in 24 hr PPT?
No Yes
Med–High priority: Investigate E. coli
sources upstream to determine if other
sources exist.
Pollution from upstream areas. Insufficient buffer strips?
Yes
High IC??
OFs / animal
feedlots?
Eroded stream banks / lack of buffer strip?
Low-Med priority: Reduce storm water runoff – infiltration
systems/buffers, etc.
Yes No
Low priority: look at localized
areas of improvement
Low-Med priority: Consider stream bank
improvements – vegetate/buffer strips
#8: Husher Creek
E. coli response to 24 hr PPT? (r2>0.65)
E. coli responds to 48 hr PPT?
(r2>0.5)
E. coli exceedance > 50% within 24 hr PPT?
Medium Priority: Storm water runoff
management, improve sites
upstream
No known OFs exist immediately upstream but sampling site human-marker Bacteroides tests indicated some human sewage may be present. Investigate further upstream for OFs, compromised septic systems, or feedlots with direct drainage. Otherwise, increase buffer widths around nearby farm fields, particularly those with animals. Investigate agricultural drain tiles that may benefit from a filtration system.
Key: IC = Impervious Cover OF = Stormwater Outfall PPT = Precipitation R2 = Degree of Determination (Regression)
= Decision Tree Path

7-27
Yes
Storm water outfalls nearby with DWF? Nearby leaky septic systems?
No
Yes
Major priority: Monitor OF if not
already. Investigate source of DWF and
eliminate.
No
Low priority: Look at localized
areas of improvement
Medium priority: Reduce runoff in
local area, consider stream bank
improvements
E. coli exceedance >40% in dry weather? & >50% in 24 hr PPT?
No
E. coli exceedance > 40% in 24 hr PPT?
No Yes
Med–High priority: Reduce storm water
runoff through buffer/filter strips as
appropriate
Pollution from upstream sites. Insufficient buffer strips?
Yes
High IC??
OFs / animal
feedlots?
Eroded stream banks / lack of buffer strip?
Low-Med priority: Reduce storm water runoff – infiltration
systems/buffers, etc.
Yes No
Low priority: look at localized
areas of improvement
Low-Med priority: Consider stream bank
improvements – vegetate/buffer strips
#9: 38 at MKE Co Line
E. coli response to 24 hr PPT? (r2>0.65)
E. coli responds to 48 hr PPT?
(r2>0.5)
E. coli exceedance > 50% within 24 hr PPT?
Medium Priority: Storm water runoff
management, improve sites
upstream
Key: IC = Impervious Cover OF = Stormwater Outfall PPT = Precipitation R2 = Degree of Determination (Regression)
= Decision Tree Path
Investigate stream bank stabilization upstream. 38 at MKE Co. Line does have a significant positive relationship (p<0.05) with 24 and 48 hr PPT, but the R2 values are not above the prescribed thresholds.
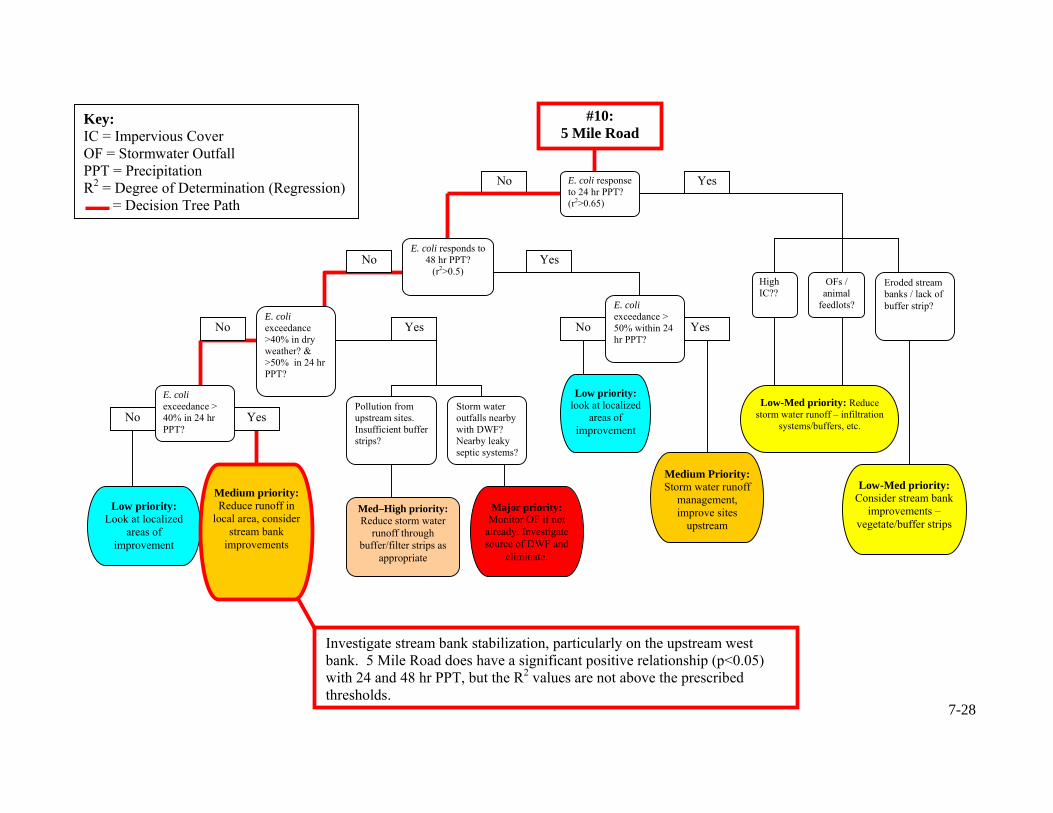
7-28
Yes
Storm water outfalls nearby with DWF? Nearby leaky septic systems?
No
Yes
Major priority: Monitor OF if not
already. Investigate source of DWF and
eliminate.
No
Low priority: Look at localized
areas of improvement
Medium priority: Reduce runoff in
local area, consider stream bank
improvements
E. coli exceedance >40% in dry weather? & >50% in 24 hr PPT?
No
E. coli exceedance > 40% in 24 hr PPT?
No Yes
Med–High priority: Reduce storm water
runoff through buffer/filter strips as
appropriate
Pollution from upstream sites. Insufficient buffer strips?
Yes
High IC??
OFs / animal
feedlots?
Eroded stream banks / lack of buffer strip?
Low-Med priority: Reduce storm water runoff – infiltration
systems/buffers, etc.
Yes No
Low priority: look at localized
areas of improvement
Low-Med priority: Consider stream bank
improvements – vegetate/buffer strips
#10: 5 Mile Road
E. coli response to 24 hr PPT? (r2>0.65)
E. coli responds to 48 hr PPT?
(r2>0.5)
E. coli exceedance > 50% within 24 hr PPT?
Medium Priority: Storm water runoff
management, improve sites
upstream
Key: IC = Impervious Cover OF = Stormwater Outfall PPT = Precipitation R2 = Degree of Determination (Regression)
= Decision Tree Path
Investigate stream bank stabilization, particularly on the upstream west bank. 5 Mile Road does have a significant positive relationship (p<0.05) with 24 and 48 hr PPT, but the R2 values are not above the prescribed thresholds.

7-29
Key: IC = Impervious Cover OF = Stormwater Outfall PPT = Precipitation R2 = Degree of Determination (Regression)
= Decision Tree Path
Yes
Storm water outfalls nearby with DWF? Nearby leaky septic systems?
No
Yes
Major priority: Monitor OF if not
already. Investigate source of DWF and
eliminate.
No
Low priority: Look at localized
areas of improvement
Medium priority: Reduce runoff in
local area, consider stream bank
improvements
E. coli exceedance >40% in dry weather? & >50% in 24 hr PPT?
No
E. coli exceedance > 40% in 24 hr PPT?
No Yes
Med–High priority: Reduce storm water
runoff through buffer/filter strips as
appropriate
Pollution from upstream sites. Insufficient buffer strips?
Yes
High IC??
OFs / animal
feedlots?
Eroded stream banks / lack of buffer strip?
Low-Med priority: Reduce storm water runoff – infiltration
systems/buffers, etc.
Yes No
Low priority: look at localized
areas of improvement
Low-Med priority: Consider stream bank
improvements – vegetate/buffer strips
#11: Hood’s Creek
E. coli response to 24 hr PPT? (r2>0.65)
E. coli responds to 48 hr PPT?
(r2>0.5)
E. coli exceedance > 50% within 24 hr PPT?
Medium Priority: Storm water runoff
management, improve sites
upstream
Investigate stream bank stabilization on the upstream banks. Hood’s Creek does have a significant positive relationship (p<0.05) with 24 and 48 hr PPT, but the R2 values are not above the prescribed thresholds.

7-30
Yes
Storm water outfalls nearby with DWF? Nearby leaky septic systems?
No
Yes
Major priority: Monitor OF if not
already. Investigate source of DWF and
eliminate.
No
Low priority: Look at localized
areas of improvement
Medium priority: Reduce runoff in
local area, consider stream bank
improvements
E. coli exceedance >40% in dry weather? & >50% in 24 hr PPT?
No
E. coli exceedance > 40% in 24 hr PPT?
No Yes
Med–High priority: Reduce storm water
runoff through buffer/filter strips as
appropriate
Pollution from upstream sites. Insufficient buffer strips?
Yes
High IC??
OFs / animal
feedlots?
Eroded stream banks / lack of buffer strip?
Low-Med priority: Reduce storm water runoff – infiltration
systems/buffers, etc.
Yes No
Low priority: look at localized
areas of improvement
Low-Med priority: Consider stream bank
improvements – vegetate/buffer strips
#12: Johnson Park
E. coli response to 24 hr PPT? (r2>0.65)
E. coli responds to 48 hr PPT?
(r2>0.5)
E. coli exceedance > 50% within 24 hr PPT?
Medium Priority: Storm water runoff
management, improve sites
upstream
Convert grass buffers to long-rooted native vegetation, particularly on upstream north bank where geese congregate on golf course. Johnson Park does have a significant positive relationship (p<0.05) with 24 and 48 hr PPT, but the R2 values are not above the prescribed thresholds.
Key: IC = Impervious Cover OF = Stormwater Outfall PPT = Precipitation R2 = Degree of Determination (Regression)
= Decision Tree Path

7-31
Yes
Storm water outfalls nearby with DWF? Nearby leaky septic systems?
No
Yes
Major priority: Monitor OF if not
already. Investigate source of DWF and
eliminate.
No
Low priority: Look at localized
areas of improvement
Medium priority: Reduce runoff in
local area, consider stream bank
improvements
E. coli exceedance >40% in dry weather? & >50% in 24 hr PPT?
No
E. coli exceedance > 40% in 24 hr PPT?
No Yes
Med–High priority: Reduce storm water
runoff through buffer/filter strips as
appropriate
Pollution from upstream sites. Insufficient buffer strips?
Yes
High IC??
OFs / animal
feedlots?
Eroded stream banks / lack of buffer strip?
Low-Med priority: Reduce storm water runoff – infiltration
systems/buffers, etc.
Yes No
Low priority: look at localized
areas of improvement
Low-Med priority: Consider stream bank
improvements – vegetate/buffer strips
#13: 31 and 4 Mile
E. coli response to 24 hr PPT? (r2>0.65)
E. coli responds to 48 hr PPT?
(r2>0.5)
E. coli exceedance > 50% within 24 hr PPT?
Medium Priority: Storm water runoff
management, improve sites
upstream
Key: IC = Impervious Cover OF = Stormwater Outfall PPT = Precipitation R2 = Degree of Determination (Regression)
= Decision Tree Path
Investigate stream bank stabilization on the upstream banks. 31 and 4 Mile Road does have a significant positive relationship (p<0.05) with 48 hr PPT, but the R2 values are not above the prescribed thresholds.

7-32
Yes
Storm water outfalls nearby with DWF? Nearby leaky septic systems?
No
Yes
Major priority: Monitor OF if not
already. Investigate source of DWF and
eliminate.
No
Low priority: Look at localized
areas of improvement
Medium priority: Reduce runoff in
local area, consider stream bank
improvements
E. coli exceedance >40% in dry weather? & >50% in 24 hr PPT?
No
E. coli exceedance > 40% in 24 hr PPT?
No Yes
Med–High priority: Reduce storm water
runoff through buffer/filter strips as
appropriate
Pollution from upstream sites. Insufficient buffer strips?
Yes
High IC??
OFs / animal
feedlots?
Eroded stream banks / lack of buffer strip?
Low-Med priority: Reduce storm water runoff – infiltration
systems/buffers, etc.
Yes No
Low priority: look at localized
areas of improvement
Low-Med priority: Consider stream bank
improvements – vegetate/buffer strips
#14: Horlick Dam
E. coli response to 24 hr PPT? (r2>0.65)
E. coli responds to 48 hr PPT?
(r2>0.5)
E. coli exceedance > 50% within 24 hr PPT?
Medium Priority: Storm water runoff
management, improve sites
upstream
Key: IC = Impervious Cover OF = Stormwater Outfall PPT = Precipitation R2 = Degree of Determination (Regression)
= Decision Tree Path
Bird population in area is likely to maintain some E. coli loading. Increase long-rooted native vegetation in grassed areas in park upstream of dam.

7-33
Yes
Storm water outfalls nearby with DWF? Nearby leaky septic systems?
No
Yes
Major priority: Monitor OF if not
already. Investigate source of DWF and
eliminate.
No
Low priority: Look at localized
areas of improvement
Medium priority: Reduce runoff in
local area, consider stream bank
improvements
E. coli exceedance >40% in dry weather? & >50% in 24 hr PPT?
No
E. coli exceedance > 40% in 24 hr PPT?
No Yes
Med–High priority: Reduce storm water
runoff through buffer/filter strips as
appropriate
Pollution from upstream sites. Insufficient buffer strips?
Yes
High IC??
OFs / animal
feedlots?
Eroded stream banks / lack of buffer strip?
Low-Med priority: Reduce storm water runoff – infiltration
systems/buffers, etc.
Yes No
Low priority: look at localized
areas of improvement
Low-Med priority: Consider stream bank
improvements – vegetate/buffer strips
#15: Steelhead Facility
E. coli response to 24 hr PPT? (r2>0.65)
E. coli responds to 48 hr PPT?
(r2>0.5)
E. coli exceedance > 50% within 24 hr PPT?
Medium Priority: Storm water runoff
management, improve sites
upstream
Key: IC = Impervious Cover OF = Stormwater Outfall PPT = Precipitation R2 = Degree of Determination (Regression)
= Decision Tree Path
Investigate stream bank stabilization on the upstream west banks and convert grassed buffer areas to long-rooted native vegetation. Steelhead Facility does have a significant positive relationship (p<0.05) with 24 and 48 hr PPT, but the R2 values are not above the prescribed thresholds.
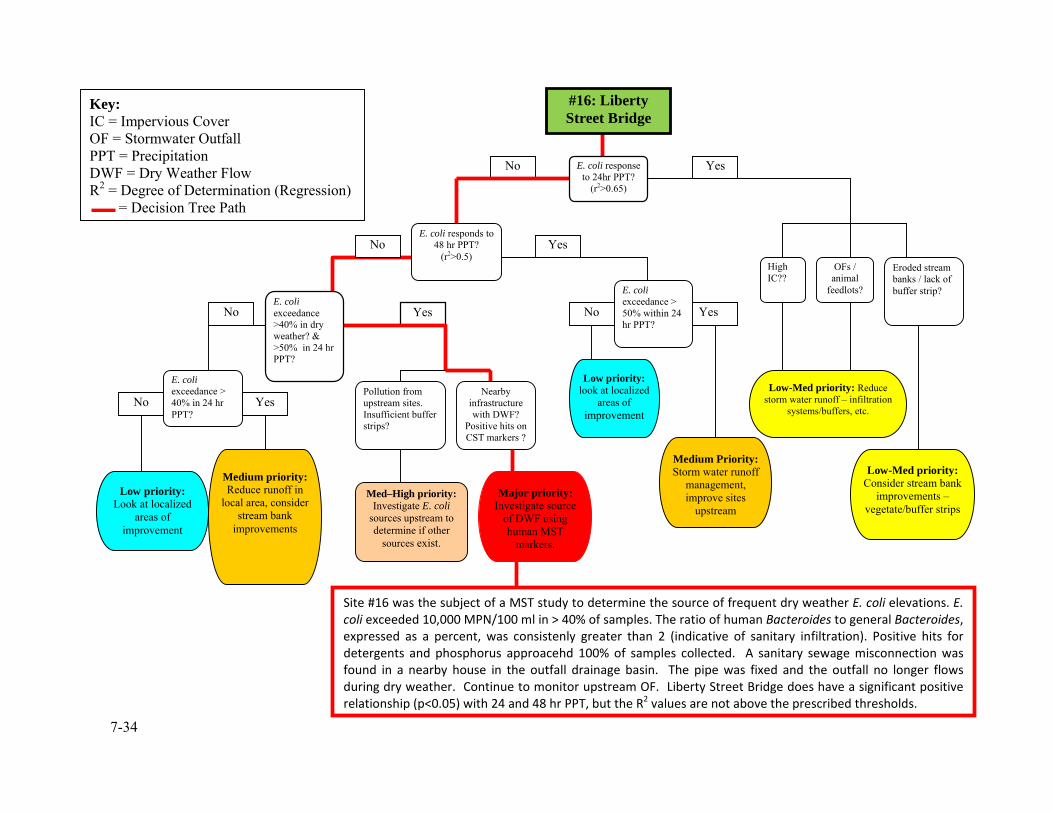
16 7-34
Yes
Nearby infrastructure with DWF?
Positive hits on CST markers ?
No
Yes
Major priority: Investigate source
of DWF using human MST
markers.
No
Low priority: Look at localized
areas of improvement
Medium priority: Reduce runoff in
local area, consider stream bank
improvements
E. coli exceedance >40% in dry weather? & >50% in 24 hr PPT?
No
E. coli exceedance > 40% in 24 hr PPT?
No Yes
Med–High priority: Investigate E. coli
sources upstream to determine if other
sources exist.
Pollution from upstream sites. Insufficient buffer strips?
Yes
High IC??
OFs / animal
feedlots?
Eroded stream banks / lack of buffer strip?
Low-Med priority: Reduce storm water runoff – infiltration
systems/buffers, etc.
Yes No
Low priority: look at localized
areas of improvement
Low-Med priority: Consider stream bank
improvements – vegetate/buffer strips
#16: Liberty Street Bridge
E. coli response to 24hr PPT?
(r2>0.65)
E. coli responds to 48 hr PPT?
(r2>0.5)
E. coli exceedance > 50% within 24 hr PPT?
Medium Priority: Storm water runoff
management, improve sites
upstream
Key: IC = Impervious Cover OF = Stormwater Outfall PPT = Precipitation DWF = Dry Weather Flow R2 = Degree of Determination (Regression)
= Decision Tree Path
Site #16 was the subject of a MST study to determine the source of frequent dry weather E. coli elevations. E. coli exceeded 10,000 MPN/100 ml in > 40% of samples. The ratio of human Bacteroides to general Bacteroides, expressed as a percent, was consistenly greater than 2 (indicative of sanitary infiltration). Positive hits for detergents and phosphorus approacehd 100% of samples collected. A sanitary sewage misconnection was found in a nearby house in the outfall drainage basin. The pipe was fixed and the outfall no longer flows during dry weather. Continue to monitor upstream OF. Liberty Street Bridge does have a significant positive relationship (p<0.05) with 24 and 48 hr PPT, but the R2 values are not above the prescribed thresholds.

7-35
Yes
Storm water outfalls nearby with DWF? Nearby leaky septic systems?
No
Yes
Major priority: Monitor OF if not
already. Investigate source of DWF and
eliminate.
No
Low priority: Look at localized
areas of improvement
Medium priority: Reduce runoff in
local area, consider stream bank
improvements
E. coli exceedance >40% in dry weather? & >50% in 24 hr PPT?
No
E. coli exceedance > 40% in 24 hr PPT?
No Yes
Med–High priority: Reduce storm water
runoff through buffer/filter strips as
appropriate
Pollution from upstream sites. Insufficient buffer strips?
Yes
High IC??
OFs / animal
feedlots?
Eroded stream banks / lack of buffer strip?
Low-Med priority: Reduce storm water runoff – infiltration
systems/buffers, etc.
Yes No
Low priority: look at localized
areas of improvement
Low-Med priority: Consider stream bank
improvements – vegetate/buffer strips
#17: REC Center
E. coli response to 24 hr PPT? (r2>0.65)
E. coli responds to 48 hr PPT?
(r2>0.5)
E. coli exceedance > 50% within 24 hr PPT?
Medium Priority: Storm water runoff
management, improve sites
upstream
Key: IC = Impervious Cover OF = Stormwater Outfall PPT = Precipitation R2 = Degree of Determination (Regression)
= Decision Tree Path
Investigate options to decrease impervious surface cover in surrounding area. REC Center does have a significant positive relationship (p<0.05) with 24 and 48 hr PPT, but the R2 values are not above the prescribed thresholds.

7-36
Yes
Storm water outfalls nearby with DWF? Nearby leaky septic systems?
No
Yes
Major priority: Monitor OF if not
already. Investigate source of DWF and
eliminate.
No
Low priority: Look at localized
areas of improvement
Medium priority: Reduce runoff in
local area, consider stream bank
improvements
E. coli exceedance >40% in dry weather? & >50% in 24 hr PPT?
No
E. coli exceedance > 40% in 24 hr PPT?
No Yes
Med–High priority: Reduce storm water
runoff through buffer/filter strips as
appropriate
Pollution from upstream sites. Insufficient buffer strips?
Yes
High IC??
OFs / animal
feedlots?
Eroded stream banks / lack of buffer strip?
Low-Med priority: Reduce storm water runoff – infiltration
systems/buffers, etc.
Yes No
Low priority: look at localized
areas of improvement
Low-Med priority: Consider stream bank
improvements – vegetate/buffer strips
#18: Chartroom
E. coli response to 24 hr PPT? (r2>0.65)
E. coli responds to 48 hr PPT?
(r2>0.5)
E. coli exceedance > 50% within 24 hr PPT?
Medium Priority: Storm water runoff
management, improve sites
upstream
Key: IC = Impervious Cover OF = Stormwater Outfall PPT = Precipitation R2 = Degree of Determination (Regression)
= Decision Tree Path
Investigate options to decrease impervious surface cover in surrounding area. Chartroom does have a significant positive relationship (p<0.05) with 24 and 48 hr PPT, but the R2 values are not above the prescribed thresholds.

Appendix 3 – Stormwater BMP Educational Signage

6TH STREET RECONSTRUCTIONWHAT IS A STORMWATER
6TH STREET RECONSTRUCTION PLANTER?
7‐37

STORMWATER PLANTER DESIGN STORMWATER RUNOFFSTORMWATER PLANTER DESIGN STORMWATER RUNOFF
7‐38

NATIVE PLANTS 6TH STREET STREETSCAPE VIEWNATIVE PLANTS 6 S S SC
7‐39


