IN THE ENVIRONMENT COURT AT AUCKLAND IN THE MATTER of the Resource Management Act 1991 AND IN THE MATTER of appeals under section 120 of the Act BETWEEN ROTOKAWA JOINT VENTURE LIMITED and MIGHTY RIVER POWER LIMITED ENV-2006-AKL-000685 (formerly ENV A 0535/04) ENV-2006-313-000061 (topic reference) AND TAUPO DISTRICT COUNCIL ENV-2006-AKL-000691 (formerly ENV A 0542/04) ENV-2006-313-000061 (topic reference) AND CONTACT ENERGY LIMITED (ENV-2006-AKL-000692 (formerly ENV A 0543/04) ENV-2006-313-000061 (topic reference) AND NZ PRAWNS LIMITED ENV-2006-AKL-000695 (formerly ENV A 0547/04) ENV-2006-313-000061 (topic reference) Appellants AND WAIKATO REGIONAL COUNCIL Respondent AND CONTACT ENERGY LIMITED Applicant EVIDENCE OF MICHAEL HORACE TIMPERLEY
Transcript
IN THE ENVIRONMENT COURTAT AUCKLAND
IN THE MATTER of the Resource Management Act1991
AND
IN THE MATTER of appeals under section 120 of theAct
BETWEEN ROTOKAWA JOINT VENTURELIMITED and MIGHTY RIVERPOWER LIMITEDENV-2006-AKL-000685 (formerlyENV A 0535/04)ENV-2006-313-000061 (topicreference)
AND TAUPO DISTRICT COUNCILENV-2006-AKL-000691 (formerlyENV A 0542/04)ENV-2006-313-000061 (topicreference)
AND CONTACT ENERGY LIMITED(ENV-2006-AKL-000692 (formerlyENV A 0543/04)ENV-2006-313-000061 (topicreference)
AND NZ PRAWNS LIMITEDENV-2006-AKL-000695 (formerlyENV A 0547/04)ENV-2006-313-000061 (topicreference)
Appellants
AND WAIKATO REGIONAL COUNCIL
Respondent
AND CONTACT ENERGY LIMITED
Applicant
EVIDENCE OF MICHAEL HORACE TIMPERLEY
AK778684 FINAL Page 2
1. INTRODUCTION
1.1 My name is Michael Horace Timperley. I hold a MSc (Hons) degree in
chemistry from the University of Auckland and a PhD degree from Massey
University, Palmerston North. I am employed by the Auckland Regional
Council as a Stormwater Technical Specialist and I also practise as a private
consultant. Prior to May last year I was Regional Manager Auckland for the
National Institute of Water and Atmospheric Research (NIWA) and Principal
Scientist for aquatic chemistry. I also lead a team of chemistry and hydrology
specialists. I have worked on environmental chemistry issues for more than
30 years, firstly for the New Zealand DSIR, then for Environmental Science
and Research Ltd and subsequently for NIWA, both Crown Research
Institutes. I have published and presented research papers on the influence
of geothermal fluids on the chemistry of the Waikato River and lakes in the
Taupo and Rotorua areas. I have also investigated the actual and potential
environmental effects on receiving waters of geothermal fluid discharges
from commercial utilisation of the geothermal resources at Wairakei, Ohaaki,
Mokai and Ngawha.
1.2 I confirm that I have been supplied with a copy of the Code of Conduct for
Expert Witnesses in the Environment Court, Practice Note (31 March 2005). I
have read and agree to comply with that code. Except where I state that I
am relying on the specific evidence of another person, my evidence is within
my area of expertise. I have not omitted to consider material facts known to
me that might alter or detract from the opinions which I express.
1.3 In my evidence I will primarily address:
• Chemicals in geothermal fluid from the Wairakei/Tauhara Geothermal
Field.
• The discharge of geothermal fluid and arsenic to Lake Taupo and the
Waikato River from the Wairakei/Tauhara Geothermal Field before and
after development of the Wairakei Power Station.
• The effects of arsenic in the Wairakei Power Station separated
geothermal water discharge on Waikato River water and sediment
quality.
• Hydrogen sulphide and mercury in geothermal steam and in the
Wairakei Power Station cooling water discharge
AK778684 FINAL Page 3
• The effects of hydrogen sulphide in the Wairakei Power Station cooling
water discharge on the quality of Waikato River water.
• The effects of mercury in the Wairakei Power Station discharges on the
water, sediments, aquatic animals and plants of the Waikato River.
2. CHEMICALS IN GEOTHERMAL FLUID FROM THE WAIRAKEI/TAUHARA
GEOTHERMAL FIELD.
2.1 Steam is produced to feed the Wairakei Power Station by drawing
geothermal fluid from deep within the reservoir of the Wairakei/Tauhara
Geothermal Field. Some of this fluid is separated into steam and water in
separation plants at ground level and some of the fluid is drawn from the
reservoir entirely as steam without a water phase (sometimes referred to as
“dry steam”).
2.2 At the Wairakei Power Station the steam passes through the turbines and is
then condensed back to liquid water by cooling with a spray of Waikato River
water. Approximately 0.4 tonne s-1 of steam is condensed with approximately
16.8 cumecs of river water. The resulting mixture, the “cooling water”, is
discharged to the Waikato River.
2.3 During the boiling and separation of steam and water in the separation
plants, the carbon dioxide, hydrogen sulphide and mercury contained in the
fluid mostly transfer to the steam phase. Dry steam also contains these
substances. No other chemicals occur in the steam or, as a result of the
condensing process in the Station, in the cooling water in sufficient quantities
to be of environmental significance.
2.4 Of the chemicals added to the cooling water by the steam:
(1) Hydrogen sulphide can be toxic to aquatic life.
(2) Carbon dioxide in the cooling water lowers the Waikato River water pH,
that is, it makes the water more acidic. The lower pH increases the
concentration of hydrogen sulphide as I will explain later.
(3) About half of the mercury in the cooling water has accumulated in the
bed sediments of Lake Ohakuri and lakes further downstream as I will
discuss in more detail later.
2.5 The geothermal water remaining after the separation of steam is referred to
here as “separated geothermal water”. The separated geothermal water from
AK778684 FINAL Page 4
the Wairakei bore field is discharged into the Waikato River a short distance
upstream of the Wairakei Power Station. This water contains quantities of all
the chemicals in the original geothermal fluid. The dominant chemical is
sodium chloride which is of no environmental concern in the Waikato River.
In addition to the other chemicals commonly found in fresh and salt waters
such as calcium, potassium, magnesium, sulphate and bicarbonate,
geothermal water also contains mercury, sulphide, ammonia, lithium,
caesium and rubidium. On the basis of existing knowledge, the quantities of
these elements in the separated geothermal water from Wairakei are, by
themselves, too small to cause adverse effects in the river, although mercury
in the separated water adds to the effects of the mercury in the cooling water.
3. THE DISCHARGE OF GEOTHERMAL FLUID AND ARSENIC TO LAKE
TAUPO AND THE WAIKATO RIVER FROM THE WAIRAKEI/TAUHARA
GEOTHERMAL FIELD BEFORE AND AFTER DEVELOPMENT OF THE
WAIRAKEI POWER STATION.
3.1 I will now describe the procedure I used to estimate the amount of
geothermal fluid and the arsenic it contained that discharged naturally from
the Wairakei/Tauhara Geothermal Field before development of the Field. I
will also compare this pre-development discharge with the present discharge.
3.2 Very few measurements of arsenic were made in the geothermal fluid from
the Wairakei/Tauhara Geothermal Field before field development. Some
measurements of chloride ion concentrations were made, however, and
these chloride ion measurements can be used to estimate the arsenic
concentration in the pre-development fluid as I will now explain.
3.3 The procedure I used was to firstly estimate the amount of chloride ion
discharged naturally from the Field before field development and then to
multiply this by the ratio of the arsenic concentration to the chloride
concentration in the fluid. This was possible because the arsenic to chloride
ion concentration ratio in the geothermal fluids from the Wairakei/Tauhara
Geothermal Field is known and this ratio has not changed appreciably over
time.
3.4 My best current estimates of the chloride ion mass loads into Lake Taupo
and into the Waikato River between Taupo Control Gates (TCG) and the
Aratiatia dam before and after the Wairakei/Tauhara Geothermal Field was
developed are given in Table 1. I made these estimates from published data
as I will now explain.
AK778684 FINAL Page 5
3.5 For estimating these mass flows I assumed that neither the flows of
freshwater nor its typical chloride concentration of about 3 g m-3 (Timperley,
1983) have changed since before the development of the Wairakei/Tauhara
Field. In my opinion this is a valid assumption.
Table 1: Natural mass flows (g s-1) of chloride ion from the Wairakei/Tauhara
geothermal field before and after development of the field.
Lake andriversection
Source ofgeothermalwater
Inflow pathway Pre-development
mass flow
Post-development
mass flow
Lake Taupo Tauhara Waipahihi Stream 9k
Tauhara Groundwater 0.1j
Tauhara Total inflows toLake Taupo
70g 9
TaupoGates toHuka Falls
Tauhara OtumuhekeStream
included in 6 4.4d
Wairakei WaipouweraweraStream
21c 0.5d
Tauhara Huka Falls Creek included in 6 3.2d
Wairakei/Tauhara
Other inflowsincludinggroundwater
159c 37
Wairakei/Tauhara
Total inflows forTaupo Gates toHuka Falls
180 45f
Huka Fallsto Aratiatia
Wairakei Dry Gully Creek included in 10 0.2e
Wairakei Kiriohineki Stream(Alum Lakes)
included in 10 0h
Wairakei Kiriohineki Stream(Waiora Valley)
9b <9
Wairakei Wairakei Stream 240a 3.8e*Wairakei Other inflows
includinggroundwater
89c <89
Wairakei Total for HukaFalls to Wairakei
338 <102
Total fromWairakei/Tauharafield
588 <156
AK778684 FINAL Page 6
a Glover (1998)b Glover (1998) from Ellis and Wilson (1955)c Ellis and Wilson (1955)d Gibbs (1987)e Environment Waikato geothermal monitoring programme (Timperley, 1994).f Huser (1989)g Allis (1988)h Contact Energy (flow from Alum Lakes now ceased)k Gibbs (1979), Timperley unpublished data.j see text
* This value is for a site immediately upstream of the original Geyser Valley and
so may be an under-estimate of the present-day natural flow from the valley.
Pre-development chloride ion mass flows from the Tauhara part of the Field
3.6 The pre-development flow of geothermal fluid from the Tauhara part of the
Field was estimated by Allis (1988) from the heat output of the inferred area
of deep geothermal resource and the surface drainage pattern. Because the
flow of chloride ion is directly related to the heat flow, Allis (1988) was able to
estimate the chloride ion mass flow.
3.7 This estimate of the chloride ion mass flow made by Allis (1988) was 140 g s-
1 and based on the heat flow, Allis (1988) estimated that about half of the
chloride ion could have been entering Lake Taupo. The other half would have
been entering the Waikato River.
Pre-development chloride ion mass flows from the Wairakei part of the field
3.8 The chloride ion mass flows in the Waikato River were measured in 1954 by
Ellis and Wilson (1955) at the outlet of Lake Taupo, at Huka Falls, at the
Aratiatia Rapids, in the Waiora Stream (Kiriohineki Stream) and at two sites
in the Wairakei Stream. From these data they estimated that 180 g s-1 of
chloride from geothermal fluids entered the river between Taupo Control
Gates and Huka Falls. A chloride ion mass flow of 21 g s-1 was estimated at
that time by Healy (pers.com. to Ellis and Wilson) for the Waipouwerawera
Stream which is one of the geothermal fluid flows into this section of the river.
3.9 In my opinion, these are reliable estimates of pre-development mass flows
because they are unlikely to have been greatly affected by field development
during the relatively short time between the start of development in about
1950 and the time that the measurements were made by Ellis and Wilson in
1954.
AK778684 FINAL Page 7
3.10 The balance of 159 g s-1 originated from the other chloride ion mass flows
into this section of the river. These other mass flows included 70 g s-1 from
the Tauhara part of the Field and 89 g s-1 from the Wairakei part of the Field.
3.11 By 1954 there were 20 bores extracting geothermal fluid from the Wairakei
part of the Field. These bores would have affected the natural geothermal
flows from Geyser Valley and this was taken into account by Glover (1998) in
deriving the estimate of 240 g s-1 given in Table 1 for the Wairakei Stream.
3.12 Glover (1998) considered that the bores were unlikely to have similarly
affected the flows from Waiora Valley so I consider that the estimate of 9 g s-1
made by Ellis and Wilson (1955) is a reliable estimate of the pre-
development mass flow from this area.
3.13 Other flows of geothermal water were estimated by Ellis and Wilson (1955) to
add a further 89 g s-1 of chloride ion to the river between Huka Falls and the
Aratiatia dam.
3.14 Thus, my best estimate of the total pre-development mass flow of chloride
ion into Lake Taupo and into the Waikato River from the Wairakei/Tauhara
Geothermal Field is 588 g s-1.
Post-development chloride ion mass flows from the Wairakei/Tauhara
Geothermal Field
3.15 On two occasions in 1978 the chloride ion concentration in the Waipahihi
Stream was 280 g m-3 (Timperley unpublished data) and the flow at the time
was about 0.031 cumecs (Gibbs, 1979). This gives a chloride ion mass flow
of about 9 g s-1 for this stream.
3.16 Gibbs (1979) estimated that the flow of groundwater through the Taupo
beach front in 1979 was about 0.5 L s-1. The chloride ion concentration in this
groundwater has not been measured but even if all of this flow is assumed to
be undiluted geothermal fluid with a chloride ion concentration of 1600 g m-3,
which is typical for the geothermal water from the Tauhara part of the Field,
the chloride ion mass flow in this groundwater would be only about 1 g s-1.
This is certainly an overestimate because warm groundwater occurs over
only a few short sections of the beach at its eastern end and the cold
groundwater has a chloride concentration of about 3 g m-3. In my opinion,
the average chloride ion concentration for groundwater over the whole length
of the 3 km beach is unlikely to be greater than 150 g m-3. At this
AK778684 FINAL Page 8
concentration the chloride ion mass flow with this groundwater flow would be
about 0.1 g s-1.
3.17 The chloride ion mass flows calculated by Gibbs (1987) from water flows and
chloride concentrations measured between 1978 and 1982 for the
Otumuheke and Waipouwerawera Streams and Huka Falls Creek were 4.4,
0.53 and 3.2 g s-1 respectively.
3.18 The total chloride ion mass flow into the Waikato River between Taupo Gates
and Huka Falls (including Huka Falls Creek) in 1989 was estimated by
Waikato Regional Council (“Environment Waikato”) to be about 45 g s-1
(Timperley, 1994).
3.19 Subtracting the chloride ion mass flows for the Otumuheke and
Waipouwerawera Streams and Huka Falls Creek of about 8 g s-1 from the
Environment Waikato estimate of 45 g s-1 implies a mass load of about 37 g
s-1 from groundwater and riverbed springs.
3.20 The total chloride ion mass flow in Dry Gully Creek and the Kiriohineki
Stream determined by the Environment Waikato geothermal monitoring
programme between 1986 and 1992 was about 9 g s-1. Contact has advised,
however, that flow from the Alum Lakes into the Kiriohineki (Waiora) Stream
has now ceased which means that the chloride ion mass flow from this
stream is now less than 9 g s-1.
3.21 The best measurement of the natural chloride ion mass flow in the Wairakei
Stream of about 3.8 g s-1 was made by the Environment Waikato geothermal
monitoring programme between 1986 and 1992. This value is, however, for a
site immediately upstream of the original Geyser Valley and so the value
might be slightly less than the present-day natural flow from the Valley.
3.22 The other pre-development mass flow of about 89 g s-1 into this part of the
river has not been measured post-development but there is no doubt that this
has decreased.
3.23 The possible size of this decrease can be estimated from the decline in the
chloride ion mass flow in the Waipouwerawera Stream which is the only
natural geothermal inflow to the Waikato River for which there are reliable
pre- and post-development chloride ion mass flows.
3.24 The 1954 estimate for this stream was 21 g s-1 (Healy, pers. com. to Ellis and
Wilson) and the measured value during the 1978 to 1982 period was 0.53 g
AK778684 FINAL Page 9
s-1 (Gibbs, 1987). If this decrease is assumed to have occurred for all other
natural geothermal chloride ion mass flows into the river from the Wairakei
part of the Field, then the pre-development mass flows of 98 g s-1 for all
inflows other than the Wairakei Stream probably decreased to about 2 to 3 g
s-1 after field development.
3.25 Thus, the total post-development natural chloride ion mass flow is probably
about 7 g s-1 for the Huka Falls to Aratiatia section and 52 g s-1 for the Taupo
Gates to Aratiatia section.
Present-day flow of separated geothermal water equivalent to the decline in
the natural flows from the Wairakei/Tauhara Field
3.26 Allowing for the uncertainty of the post-development natural chloride ion
mass flow of between 61 g s-1 and 156 g s-1, the decline in the natural
chloride ion mass flow is between about 432 and 527 g s-1.
3.27 This decline can be expressed as an equivalent discharge of present-day
Wairakei separated geothermal water. The flow-weighted chloride ion
concentration in the present-day separated water is 1930 g t-1. This gives an
equivalent discharge of SGW from the Wairakei bore field of between about
19,300 t d-1 (tonnes per day) and 23,600 t d-1.
3.28 The low end of this range assumes no decline in the unmeasured pre-
development chloride ion mass flow of 89 g s-1 into the river between Huka
Falls and Aratiatia; a very unlikely scenario. Accordingly, the most probable
equivalent present-day discharge of separated geothermal water is nearer
the upper end of this range, say, about 23,000 t d-1.
Pre- and post-development arsenic mass flows from the Wairakei/Tauhara
geothermal field
3.29 The ratios of chloride to arsenic in fluids from the Wairakei/Tauhara
Geothermal Field are plotted against time in Figure 1. The earliest results for
the period December 1952 to January 1959 were reported by Ritchie (1961).
Mahon and Glover (1965) reported the results for 1965 and the results for the
Wairakei drains in 2000 were reported by Ray et al. (2001)
3.30 There is one anomalous feature of the data in the figure and that is the
increasing ratio for the Wairakei bore fluids from about 430 to about 500 over
the period 1952 to 1959 (all these data are reported in Ritchie,1961). Ritchie
AK778684 FINAL Page 10
did not comment on this apparent trend but there is good evidence to show
that these measurements were incorrect.
3.31 The analytical methods Ritchie used to measure chloride and arsenic in the
1959 samples differed from those used for the earlier samples. The pre-
1959 method Ritchie (1961) used for arsenic was published by the American
Public Health Association, one of the definitive authorities on water quality
analyses. This method was, therefore, likely to have been reasonably
reliable.
3.32 The method used for the 1959 analyses was adapted by Ritchie from a
literature method and although he achieved almost complete recovery of
arsenic added to distilled water, this does not guarantee that he achieved
complete recovery from natural samples. In fact, Ritchie’s result for Lake
Taupo water using the 1959 method was 0.5 mg m-3 whereas the present
concentration is about 10 mg m-3. Geothermal fluid discharges into Lake
Taupo have almost certainly decreased since the 1950s (those from Tauhara
have) so the lake water concentration of arsenic in the late 1950’s would
have been at least 10 mg m-3 and possibly higher. It seems likely that the
higher chloride to arsenic ratios obtained for the 1959 samples were the
result of the 1959 method developed by Ritchie recovering only about 90% of
the arsenic from the geothermal samples.
3.33 Excluding these anomalous high results, the range for the pre-1959 ratios is
similar to the range for the post-1959 ratios. It can be concluded, therefore,
that there has been little change in the ratio over time and that the ratio for
fluids from the Wairakei part of the Field are similar to those obtained during
the 1950’s for fluids from the Tauhara part of the Field. There are no recent
data for Tauhara fluids.
3.34 Excluding the 1959 data, the mean chloride to arsenic ratio for the other 22
results is 485. The mass flow of chloride in the natural discharges of
geothermal fluids from the Wairakei/Tauhara Field was estimated to be about
588 g s-1 before development of the Field and between 61 g s-1 and 156 g s-1
now. Applying the above mean chloride to arsenic ratio gives estimates of the
natural mass flow of arsenic of about 1.2 g s-1 or 38 t year-1 before
development and between 0.13 g s-1 (4 t year-1) and 0.32 g s-1 (10 t year-1)
after development.
3.35 It is almost certain that the pre-development natural flows of geothermal
water into the Waikato River between Taupo Gates and Aratiatia have
AK778684 FINAL Page 11
decreased as explained previously for the chloride ion, and for this reason it
is likely that the present natural mass flow of arsenic is towards the lower end
of this range, i.e., closer to 4 t year-1 than to 10 t year-1. The natural mass
flow of arsenic has, therefore, reduced from about 38 t year-1 before
development began to about 4 t year-1, a reduction of 34 t year-1.
Figure 2. Calculated concentrations of total dissolved arsenic in Waikato River
water for various quantities of geothermal water discharged from the
Wairakei/Tauhara geothermal field at river flows at Taupo Control Gates of 130
cumecs for the pre-development situation, 160 cumecs for the present-day situation
with a separated water discharge of 60,000 t d-1, and 50 cumecs for both situations.
4.9 Prior to development of the Wairakei/Tauhara Geothermal Field, the annual
average arsenic concentrations in the river water at Hamilton would have
been about 21ppb and 45ppb for flows at Taupo Control Gates of 130
cumecs and 50 cumecs respectively. At Mercer where Watercare now
extracts water for treatment and transport to Auckland, the average arsenic
concentrations would have been approximately 19ppb and 42ppb
respectively for these two Taupo Control Gate flows.
AK778684 FINAL Page 14
4.10 At a separated geothermal water discharge of 60,000 t d-1, the approximate
present discharge, the average concentrations would be about 24ppb and
63ppb at Hamilton and about 21ppb and 55ppb at Mercer, for river flows at
Taupo Control Gates of 160 cumecs and 50 cumecs respectively.
4.11 Thus, the annual average arsenic concentrations in the river water at
Hamilton and Mercer prior to development of the Wairakei/Tauhara
Geothermal Field would have been 85 to 90% of present-day concentrations.
4.12 Previous studies (McLaren and Kim, 1995, Webster-Brown and Lane, 2005)
found considerable variation over a year in the river water dissolved arsenic
concentrations, with summer concentrations up to three times higher than
winter concentrations. For example, at Hamilton summer concentrations of
about 60ppb and winter concentrations of about 20ppb have been recorded.
It is possible, therefore, that for short periods during summer river water
concentrations could be 50% higher than the annual average concentrations
calculated with the model.
4.13 Monitoring by Contact between November 2005 and the end of May 2006 did
not, however, detect these high summer concentrations. The reasons for this
are unknown.
Sediments
4.14 Table 2 shows the concentrations of arsenic in the bed sediments of Lake
Taupo and of the reservoirs of the Waikato River measured prior to the start
of reinjection of Wairakei separated geothermal water (Hickey et al, 1995).
All sediments contained arsenic at concentrations exceeding one or both of
the ANZECC 2000 Interim Sediment Quality Guidelines.
4.15 These guidelines are an indication of the risk of sediment-bound arsenic to
aquatic life. In laboratory tests about 10% of sediment samples with arsenic
concentrations equal to the ANZECC ISQG-Low showed adverse effects on
the test animals. For the ISQG-High, about 50% of samples showed adverse
effects.
4.16 A small proportion of the arsenic in these sediments originates from the
weathering of minerals in non-geothermal environments, but the major
proportion originates from geothermal fluids.
4.17 The discharge of separated geothermal water from the Wairakei Geothermal
Field to the Waikato River has reduced since reinjection commenced. As a
AK778684 FINAL Page 15
consequence, the arsenic concentrations in the surface layers of reservoir
bed sediments would have begun to decrease as the old sediment has been
mixed with new sediment containing less arsenic. Provided that the quantity
of separated geothermal water does not increase in future above about
60,000 t d-1, then this decrease in the sediment arsenic concentration will
continue for sometime into the future.
4.18 The eventual extent of this decrease in sediment arsenic concentrations is
predictable. If the discharge of separate geothermal water remains at about
60,000 t d-1 then the sediment arsenic concentrations will eventually stabilise
at about 60% of the concentrations that existed prior to the start of
reinjection, assuming that the chemical conditions that influence the
accumulation of arsenic into the reservoir sediments do not change. The
present discharge is about 60% of the discharge before reinjection started.
Table 2. Arsenic concentrations in bed sediments from Lake Taupo and the Waikato
River. Numbers in italics exceed the ANZECC 2000 ISQG-Low guideline. Numbers
in bold italics exceed the ISQG-High.
Site Arsenic concentration (ppm)
Taupo 7.9
Aratiatia 69.4
Ohakuri 111.0; >200; 103 – 1340
Maraetai 101 – 233
Waipapa 859 –1520
Karapiro 222
Hamilton 60.1
ANZECC guidelines ISQG-Low 20
ANZECC guidelines ISQG-high 70
5. THE EFFECTS OF HYDROGEN SULPHIDE IN THE WAIRAKEI POWER
STATION COOLING WATER DISCHARGE ON THE WAIKATO RIVER
WATER QUALITY
5.1 As I have described previously, geothermal fluids add hydrogen sulphide, a
water soluble gas, and mercury to the Waikato River. However, with the
exception of flows of fluids into the river through the river bed and the cooling
water from the Wairakei Power Station that contain condensed geothermal
steam, the amounts of hydrogen sulphide and mercury added to the river by
geothermal fluids are likely to be small. This is because most of these fluid
flows are able to lose gases, including hydrogen sulphide and mercury, to the
AK778684 FINAL Page 16
atmosphere before they reach the river. For flows through the river bed,
however, the hydrogen sulphide and mercury could dissolve into the river
water rather than escape to the atmosphere.
5.2 Early investigations by NIWA scientists (Ray et al, 2001) identified hydrogen
sulphide arising from the cooling water discharge as a potential threat to
aquatic life in the Waikato River. A comprehensive programme was
undertaken by NIWA and Contact staff to determine the range of
concentrations and the level of effects of hydrogen sulphide in the Waikato
River and to assist in developing appropriate strategies for avoiding,
remedying or mitigating those effects. The proposed strategies for avoiding
the discharge of hydrogen sulphide to the river are based on replicating
natural oxidation processes which I will discuss in a moment.
5.3 Hydrogen sulphide is one of three chemical species containing sulphur that
together constitute total sulphide in aqueous systems. The other two species
are bisulphide and sulphide. All three species are soluble in water and all are
present if total sulphide is present. The proportions of the species change as
the water pH changes. As the pH decreases, that is, the water becomes
more acidic, the proportion of hydrogen sulphide increases. Hydrogen
sulphide is the toxic form of total sulphide.
5.4 Hydrogen sulphide is difficult to measure. Surveys of the type undertaken for
this study measure the concentrations of total sulphide and from these
results, and the measured water pH, temperature and concentrations of other
dissolved substances, the concentrations of hydrogen sulphide are obtained
by calculation.
5.5 Total sulphide was measured on numerous occasions by NIWA and Contact
staff during the period November 1999 to July 2000 in the cooling water and
at various sites in the river downstream of the cooling water outfall. The
results are shown in Figure 3. The source of steam supplied to the Wairakei
Power Station has not changed appreciably since that time so the total
sulphide concentrations in the river will not have altered to any extent either.
AK778684 FINAL Page 17
0
1
10
100
1000
10000
0 2000 4000 6000 8000 10000 12000
Distance downstream from Huka Falls (m)
To
tals
ulp
hid
eco
nce
ntr
atio
n(p
pb
) coo
ling
wat
er
Ara
tiat
iad
am
Rap
ids
Jet
jett
y
Fu
lljam
esra
pid
s
Figure 3. Total sulphide concentrations in the cooling water and in Waikato River
water at various distances downstream from Huka Falls. Huka Falls is position 0m
on the figure.
5.6 The concentration of total sulphide in the cooling water was approximately
1000ppb. The total sulphide concentration in the river water was about
20ppb at the Aratiatia Dam, a reduction of about 50-fold from the
concentration in the cooling water, and 2ppb at the Fulljames Rapids, that is
an overall reduction of about 500 fold relative to the cooling water. The wide
range of concentrations at the first sampling site downstream of the outfall
was due to the incomplete and variable mixing of cooling water into the river
water.
5.7 To assist with assessing how the concentrations of hydrogen sulphide in the
river water would change under varying cooling water discharges and river
flow regimes, I developed a mathematical model for hydrogen sulphide
concentrations in the river water based on the measured concentrations of
total sulphide shown in Figure 3.
5.8 The mathematical model developed for hydrogen sulphide firstly calculates
the concentration of total sulphide in the river water due solely to dilution at
AK778684 FINAL Page 18
any selected distance downstream of the cooling water outfall and at any
selected river water flow.
5.9 The difference between the measured total sulphide concentration and that
calculated from dilution is the total sulphide lost. This loss can be attributed to
oxidation and volatilisation. These processes are not differentiated in the
model but their combined effect, that is, the loss of total sulphide, at any
particular location in the river is explained almost entirely by the residence
time of total sulphide in the river between the outfall and the location.
5.10 A mathematical equation relating the loss of total sulphide to the residence
time was derived. Figure 4 compares the model estimates with the measured
values for the total sulphide lost.
0
20
40
60
80
100
120
140
160
180
200
0 20 40 60 80 100 120 140 160 180 200
TS loss m easured m g m -3
TS
loss
pre
dic
ted
mg
m-3
Figure 4. Comparison of the estimated and measured losses of total sulphide (TS) in
the Waikato River water downstream of the Wairakei Station cooling water outfall.
5.11 The model calculates the river water pH due to the carbon dioxide in the
cooling water taking into account the composition of the river water upstream
of the cooling water outfall and the river water flow and temperature. This pH
together with the calculated effects of other chemicals in the river water on
AK778684 FINAL Page 19
total sulphide are then applied to the calculated river water concentration of
total sulphide to produce an estimated concentration of hydrogen sulphide.
5.12 This model has been used to estimate the effects of reducing the cooling
water concentration of total sulphide on the hydrogen sulphide concentration
in the river downstream of the cooling water outfall.
5.13 Figure 5 shows the concentrations of hydrogen sulphide calculated using the
model in Waikato River water downstream of the Wairakei Power Station
cooling water outfall. A maximum cooling water discharge of 17.2 cumecs
with a total hydrogen sulphide concentration of 80ppb and the existing
concentration of carbon dioxide of 43ppm together with a river water
temperature of 15oC were assumed for these calculations.
5.14 A total hydrogen sulphide concentration of 80ppb is the quarterly average
maximum concentration in the cooling water proposed in the Statement of
Agreed Matters between Technical Experts on behalf of the Appellant
(Contact Energy Limited) and respondent (Waikato Regional Council).
5.15 The existing concentration of carbon dioxide was used because, firstly, it is
not known at this time by how much the proposed treatment system for total
sulphide will reduce the carbon dioxide concentration and, secondly, using
the existing concentration produces a worst case model result for river water
hydrogen sulphide concentration.
AK778684 FINAL Page 20
0
2
4
6
8
10
12
14
16
18
20
0 2000 4000 6000 8000 10000 12000 14000 16000
Distance downstream of Huka Falls (m)
Hyd
roge
nsu
lphi
deco
ncen
trat
ion
(ppb
)
Fu
lljam
esR
apid
s
Ara
tiat
iaD
am Present discharge
Treateddischarge
50
Riverwaterflows
160
250
250160
50
Co
olin
gw
ater
ou
tfal
l
0
2
4
6
8
10
12
14
16
18
20
0 2000 4000 6000 8000 10000 12000 14000 16000
Distance downstream of Huka Falls (m)
Hyd
roge
nsu
lphi
deco
ncen
trat
ion
(ppb
)
Fu
lljam
esR
apid
s
Ara
tiat
iaD
am Present discharge
Treateddischarge
50
Riverwaterflows
160
250
250160
50
Co
olin
gw
ater
ou
tfal
l
Figure 5. Concentrations of hydrogen sulphide calculated using the model in river
water downstream of the cooling water outfall.
6. THE EFFECTS OF MERCURY IN THE WAIRAKEI POWER STATION
DISCHARGES ON THE WATER, SEDIMENTS, AQUATIC ANIMALS AND
PLANTS OF THE WAIKATO RIVER.
Water quality
6.1 In the early 1970s the separated geothermal water from the Wairakei
Geothermal Field and cooling water from the Wairakei Power Station were
found to carry about 5 and 50kg year-1 respectively of mercury into the
Waikato River (Weissberg and Zobel, 1973). During the period 1988 to 1992
the average cooling water discharge of total mercury was 46.5kg year-1
(Timperley, 1997). Of this total, elemental mercury which is the form of
mercury present in the original geothermal fluid before separation of the
water and steam, constituted an average of 19.3 kg year-1. The chemical
form of the other 27.2kg year-1 in the cooling water discharge is unknown.
6.2 Reinjecting 40000 t d-1 of separated water (approximately the present
reinjection rate) has reduced the annual load of mercury discharged to the
river in the separated geothermal water by about 5kg to about 3kg.
AK778684 FINAL Page 21
6.3 Incorporating the 1988 to 1992 data for the cooling water (Timperley, 1993)
with the 1970’s result for the separated geothermal water (Weissberg and
Zobel, 1973) adjusted for reinjection and the total mercury concentration of
0.0005ppb in Lake Taupo water (Kim, 1995), gives an average concentration
of total mercury in the river water of about 0.010ppb immediately after full
mixing of the cooling water at a flow of 160 cumecs at Taupo Control Gates.
At a Taupo Control Gates flow of 50 cumecs (the minimum flow under the
Mighty River Power consents), the concentration would be about 0.031ppb.
Both these concentrations are below the ANZECC 2000 trigger value for 99%
protection of aquatic species of 0.06ppb, and below the New Zealand
drinking water Maximum Acceptable Value for total mercury of 2ppb
(Ministry of Health, 2005).
6.4 GNS Wairakei have estimated on the basis of my data as set out in the AEE,
an assumed cooling water flow of 17.2 cumecs, and an assumed separated
geothermal water discharge of 60,000 tonnes per day, that there will be a
combined annual discharge from Wairakei of 37 kg +/-_ 9 kg per annum of
mercury. The apparent high variability in this estimate reflects the variance in
the mercury concentration data which in turn reflects difficulties associated
with sampling and analysing mercury at low concentrations. This value
provided the basis for one of the mercury limits discussed by Mr Venus in his
evidence.
Sediments
6.5 Dissolved forms of mercury entering surface waters, for example, from the
atmosphere and from catchment sources, are incorporated into, or adsorbed
onto, suspended particulate matter. Where water velocities and turbulence
are sufficiently low, these particles settle carrying the mercury into the bed
sediment. This is a natural process occurring in all surface waters. The
scavenging of dissolved mercury by particulate matter is extremely efficient
and results in very low natural concentrations of dissolved mercury in surface
waters. The concentration of total mercury of 0.0005ppb in Lake Taupo
water (Kim, 1995) is an example.
6.6 Mercury in the Wairakei Power Station cooling water discharge undergoes
the same process in the Waikato River with the result that much of the
mercury discharged from the Station has accumulated in the bed sediments
of the Waikato River reservoirs.
AK778684 FINAL Page 22
6.7 Table 3 gives the total mercury concentrations in the surface layers of bed
sediments from Lake Taupo and the Waikato River reservoirs (Hickey et al,
1995). Except that from Lake Taupo, sediment at all sites had mercury
concentrations exceeding the ANZECC 2000 ISQG-Low guideline.
Table 3. Mercury concentrations in bed sediments of Lake Taupo and the Waikato
River. Numbers in italics exceed the ANZECC 2000 ISQG-Low.
Site Mercury concentration (ppm)
Taupo 0.025
Aratiatia 0.47 – 0.87
Ohakuri 0.12 – 0.74
Maraetai 0.36 – 0.83
Waipapa 0.30 – 0.38
Karapiro 0.43
Hamilton 0.31
ANZECC guideline ISQG-Low 0.15
ANZECC guideline ISQG-high 1
6.8 The quantities of mercury in the bed sediments of Lakes Ohakuri,
Whakamaru, Maraetai and Arapuni have been measured (Timperley, 1993).
These data can be extended with a high level of confidence to the other four
lakes to enable the total amount of mercury contained in the lake sediments
to be estimated. This estimate indicates that approximately half of the
mercury discharged to the Waikato River from the Wairakei Power Station
during its operational lifetime remains in the reservoir bed sediments. It can
be assumed that the other half has been lost to the atmosphere, the
sediments of the lower Waikato River and its flood plain, and the Tasman
Sea.
6.9 The highest concentrations of mercury in the reservoir bed sediments occur
in the upper part of Lake Ohakuri. This is the first section of river
downstream from the cooling water outfall with sufficiently low water
velocities to allow fine suspended particulate matter to settle. The bed
sediments in this part of Lake Ohakuri contain about one quarter of the
quantity of mercury discharged from the Wairakei Power Station over its
lifetime.
AK778684 FINAL Page 23
Aquatic life
6.10 The principal environmental concern with mercury is the accumulation of a
highly toxic organic form of mercury, methylmercury, in edible fish.
Methylmercury is produced from inorganic mercury, the predominant natural
form, mostly by bacteria living in fine-grained muddy bed sediments. These
types of sediments are common in lakes. Methylmercury diffuses from the
sediment into the overlying water where it is absorbed into algae. Small
animals ingest the algae and the methylmercury. These animals with their
methylmercury are, in turn, eaten by larger animals. Because animals
excrete methylmercury very slowly, it accumulates in their tissues. The
highest concentrations of mercury occur in the oldest predator animals in the
ecosystem, for example, trout and eels in the Waikato River. This process of
mercury “bioaccumulation” occurs in all water bodies where conditions are
suitable for the production of methylmercury and where there are animals
feeding on other animals.
6.11 Because of the health risks associated with ingesting methylmercury,
guidelines have been developed for the consumption of fish, the principal
source of this compound in human diet. New Zealand has adopted a
Maximum Level for mercury in fish. For trout and eels this Maximum Level is
0.5 mg kg-1 (Australia New Zealand Food Standards Code, 2002).
6.12 Table 4 compares the concentrations of mercury in trout from the Waikato
River with the concentrations in trout from a selection of other lakes in the
central North Island.
Table 4. Concentrations of mercury in mg kg-1 wet weight in the flesh of trout from
various lakes in North Island. Data on different lines are from different studies.
Concentrations above the New Zealand Maximum Level in fish are shown in bold.1Concentrations are for methylmercury (approximately equal to total mercury).2Median concentrations.
AK778684 FINAL Page 24
Water body Number of
fish
analysed
Mean or
median
concentration
Concentration
range
Lake Taupo 7
7
21
76
0.065
0.12
0.19
0.102
0.03 – 0.11
0.02 – 0.24
0.03 – 0.53
0.01 – 0.87
Lake Aratiatia 49 0.112 0.23 – 0.80
Lake Ohakuri 23 0.28 0.12 – 0.55
Lake Atiamuri 2
25
0.32
0.29
no range
given
0.11 – 0.62
Lake Whakamaru 5
34
0.32
0.20
0.28 – 0.37
0.06 – 0.54
Lake Maraetai 7
18
0.14
0.17
0.09 – 0.21
0.07 – 0.55
Lake Waipapa 5 0.082 0.06 – 0.13
Lake Arapuni 21 0.185 0.07 – 0.27
Lake Karapiro 11 0.211 0.06 – 0.34
The Waikato at
Ngaruawahia
17 0.122 0.04 – 0.35
The Waikato at
Huntly
7 0.166 0.08 – 0.27
AK778684 FINAL Page 25
Water body Number of
fish
analysed
Mean or
median
concentration
Concentration
range
Lake Rotorua 26
20
11
4
0.5311
0.46
0.85
1.68
0.146 – 1.991
0.23 – 0.93
0.06 – 2.1
1.1 – 2.57
Lake Okareka 19
13
5
0.2211
0.24
0.35
0.117 –
0.5011
0.10 – 0.63
0.33 – 0.37
Lake Okaro 25 0.6501 0.420 – 1.151
Lake Tarawera 25
20
0.1821
0.09
0.069 –
0.6121
0.054 – 0.1
Lake Tikitapu 5 0.3 0.15 – 0.56
Lake Rotokakahi 6 0.25 0.10 – 0.39
Lake Rotomahana 30
15
5
1.841
1.24
2.1
0.71 – 4.131
0.98 – 1.56
1.52 – 2.92
Lake Rotoiti 23
6
1.11
1.0
no range
given
0.47 – 3.0
Lake Rotoehu 17
9
0.11
0.22
0.06 – 0.19
0.12 – 0.63
AK778684 FINAL Page 26
Water body Number of
fish
analysed
Mean or
median
concentration
Concentration
range
Lake Okataina 20
4
0.06
0.38
0.03 –0.11
0.06 – 0.62
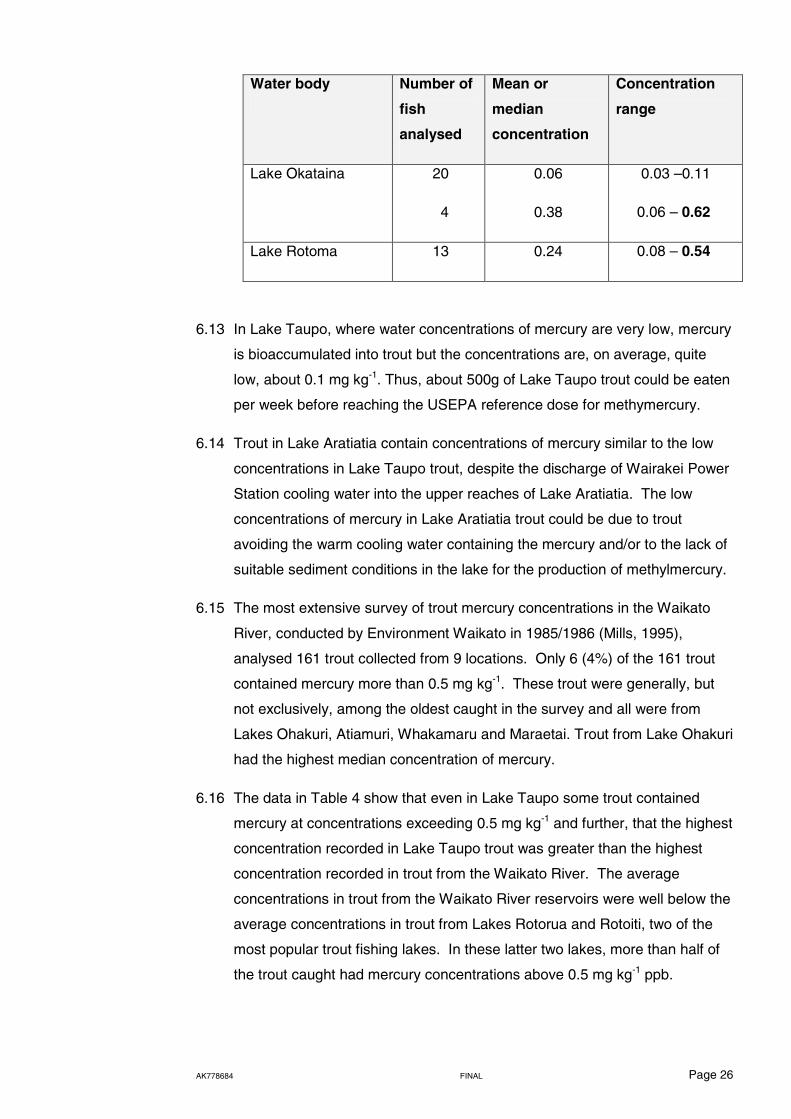
Lake Rotoma 13 0.24 0.08 – 0.54
6.13 In Lake Taupo, where water concentrations of mercury are very low, mercury
is bioaccumulated into trout but the concentrations are, on average, quite
low, about 0.1 mg kg-1. Thus, about 500g of Lake Taupo trout could be eaten
per week before reaching the USEPA reference dose for methymercury.
6.14 Trout in Lake Aratiatia contain concentrations of mercury similar to the low
concentrations in Lake Taupo trout, despite the discharge of Wairakei Power
Station cooling water into the upper reaches of Lake Aratiatia. The low
concentrations of mercury in Lake Aratiatia trout could be due to trout
avoiding the warm cooling water containing the mercury and/or to the lack of
suitable sediment conditions in the lake for the production of methylmercury.
6.15 The most extensive survey of trout mercury concentrations in the Waikato
River, conducted by Environment Waikato in 1985/1986 (Mills, 1995),
analysed 161 trout collected from 9 locations. Only 6 (4%) of the 161 trout
contained mercury more than 0.5 mg kg-1. These trout were generally, but
not exclusively, among the oldest caught in the survey and all were from
Lakes Ohakuri, Atiamuri, Whakamaru and Maraetai. Trout from Lake Ohakuri
had the highest median concentration of mercury.
6.16 The data in Table 4 show that even in Lake Taupo some trout contained
mercury at concentrations exceeding 0.5 mg kg-1 and further, that the highest
concentration recorded in Lake Taupo trout was greater than the highest
concentration recorded in trout from the Waikato River. The average
concentrations in trout from the Waikato River reservoirs were well below the
average concentrations in trout from Lakes Rotorua and Rotoiti, two of the
most popular trout fishing lakes. In these latter two lakes, more than half of
the trout caught had mercury concentrations above 0.5 mg kg-1 ppb.
AK778684 FINAL Page 27
6.17 Although a trout with mercury concentrations above 0.5 mg kg-1 can be
caught occasionally from the Waikato River, (and also from Lake Taupo),
almost all of the trout caught from the River had mercury concentrations well
below 0.5 mg kg-1.
6.18 In the Waikato River downstream from Lake Maraetai, the average
concentrations in trout were about 0.2 mg kg-1 or less.
6.19 The same Environment Waikato study referred to earlier found that eels in
Lakes Arapuni and Karapiro contained mercury at concentrations below 0.5
mg kg-1.
6.20 Mercury concentrations in freshwater mussels were higher in Lake Aratiatia
than they were in most of the other lakes, although in all lakes that have been
studied the concentrations exceeded 0.5 mg kg-1. Concentrations in Lake
Aratiatia mussels were over 100 times higher than were the concentrations in
Lake Taupo mussels. There were few mussels in Lake Aratiatia but they
were abundant in some other parts of the river. They are, however, difficult
to obtain and are not normally taken for human consumption.
6.21 There do not appear to be any reported results for mercury concentrations in
aquatic plants from the Waikato River. Based on the low concentrations of
mercury I have measured in aquatic plants growing in some of the Rotorua
lakes receiving geothermal fluids, I would not expect mercury to accumulate
to high concentrations in the aquatic plants of the Waikato River.
6.22 Lake Ohakuri is one of several Waikato River reservoirs where elvers are
being released to establish eel populations in new habitats. These eels will
accumulate mercury and future old eels could contain high concentrations of
mercury. Mercury is unlikely to be an issue for a commercial eel fishery if one
were to be established on the lakes where elvers are now being released,
because young eels with relatively low mercury concentrations would
dominate the commercial catch.
6.23 The concentrations of mercury in the surface bed sediments of the Waikato
River reservoirs and the effects of this mercury on river animals including
bioaccumulation into trout and eels, will remain essentially unchanged for at
least as long as the discharges of mercury to the river continue at the levels
of the last decade.
6.24 If the discharges of mercury to the river were to be substantially reduced I
would expect the mercury concentrations in the surface few centimetres of
AK778684 FINAL Page 28
the bed sediments of the river’s reservoirs to slowly decrease as the existing
sediments become buried with new sediment containing lower concentrations
of mercury. It would probably be several years, however, before the resulting
lower concentrations in bed sediments and in trout and eels would be
detectable.
7. SUMMARY
7.1 The best estimate of the natural mass flow of chloride ion from the
Wairakei/Tauhara Geothermal Field before development is 588 g s-1. The
present-day natural mass flow is probably between about 61 g s-1 and 156 g
s-1. The difference of between 432 g s-1 and 527 g s-1 is the estimated decline
in the natural chloride ion mass flow due to the development of the
Wairakei/Tauhara field.
7.2 The pre-development flow of “naturally separated geothermal water” from the
Wairakei/Tauhara Field was about 24,000 t d-1, comprising about 18,000 t d-1
from the Wairakei part of the Field and about 6000 t d-1 from the Tauhara part
of the Field.
7.3 The decrease in the natural chloride ion mass flow is equivalent to a present-
day discharge of separated geothermal water from the Wairakei bore field of
between about 19,300 t d-1 and 23,600 t d-1. The most probable equivalent
present-day discharge of separated geothermal water is nearer the upper
end of this range, say, about 23,000 t d-1.
7.4 The natural mass flow of arsenic in the geothermal fluids from the
Wairakei/Tauhara field was about 1.2 g s-1 or 38 t year-1 before development
and between 0.13 g s-1 (4 t year-1) and 0.32 g s-1 (10 t year-1) after
development.
7.5 It is likely that the present natural mass flow of arsenic is towards the lower
end of this range, i.e., closer to 4 t year-1 than to 10 t year-1. The natural mass
flow of As has, therefore, reduced from about 38 t year-1 before development
began to about 4 t year-1, a reduction of 34 t year-1.
7.6 Arsenic concentrations in Lake Taupo water are at the Maximum Acceptable
Value of 10ppb for treated New Zealand drinking water. Natural flows of
geothermal water into the Waikato River below Taupo Control Gates add
further arsenic to the river water. Prior to development of the
Wairakei/Tauhara Geothermal Field the annual average river water
AK778684 FINAL Page 29
concentration at Hamilton would have been about 21ppb. With development
of the Field and with the present level of separated water reinjection, the
annual average arsenic concentration at Hamilton is about 24ppb.
7.7 Arsenic has accumulated in the bed sediments of the Waikato River
reservoirs to concentrations that exceed the ANZECC 2000 guidelines.
7.8 Approximately 80-90% of the total sulphide presently discharged from the
Wairakei Power Station is lost from the river water between the cooling water
outfall and the Aratiatia Dam primarily because of bacterial oxidation. The
total sulphide remaining in the river water raises hydrogen sulphide
concentrations above the site-specific water quality guideline of 2ppb for
between 8 and 10km downstream, depending on river water flow, from the
cooling water outfall.
7.9 Reducing the cooling water concentration of total sulphide to 80ppb would
reduce the distance downstream of the cooling water outfall over which the
site-specific water quality guideline of 2ppb would be exceeded to less than
2km at low river flow of 50 cumecs, 2km at mean river flow of 160 cumecs
and 3km at a river flow of 250 cumecs.
7.10 Mercury, mostly from the Wairakei Power Station cooling water discharge,
has accumulated in the bed sediments of the Waikato River reservoirs where
some of this mercury is converted by bacteria into methylmercury. This form
of mercury bioaccumulates in trout and eels. In the mid-1980’s 4% of trout
caught from the river had mercury concentrations above 0.5 mg kg-1. Mostly
these trout were old and all were from Lakes Ohakuri, Atiamuri, Whakamaru
and Maraetai. Elsewhere in the river average mercury concentrations in trout
were below 0.5 mg kg-1.
7.11 The average concentrations of mercury in trout from the Waikato River are
less than half the average concentrations in trout from Lakes Rotorua and
Rotoiti, two of the most popular trout fishing lakes in North Island.
7.12 In future old eels in Lake Ohakuri could contain high concentrations of
mercury but the concentrations in younger eels caught for commercial sale
are likely to be below this level.
AK778684 FINAL Page 30
References
Aggett, J.; Aspell, A.C. (1980) Arsenic from geothermal sources in the Waikato
catchment. New Zealand Journal of Science 23: 77-82.
Allis, R.G. (1988). Tabulation of natural heat output of Wairakei field. Geophysics
Division, DSIR. Contract Report 72.
Australia New Zealand Food Standards Code. (2002). Food Standards Australia
New Zealand.
Ellis, A.J.; Wilson, S.H. (1955). The heat from the Wairakei-Taupo thermal region
calculated from the chloride output. N.Z. Journal of Science and Technology
Section B 36(6): 622-631.
Gibbs, M. (1979). Groundwater input to Lake Taupo, New Zealand: Nitrogen and
phosphorus inputs from Taupo township. New Zealand Journal of Science 22: 235-
243.
Gibbs, M. (1987). Chemical composition and budget of the Waikato River between
Lake Taupo and Lake Ohakuri, North Island, New Zealand (1978-1982). DSIR
Taupo Research Laboratory Report 89.
Glover, R.B. (1998). Changes in the chemistry of Wairakei fluids 1929-1977.
Proceedings of the 21st N.Z. Geothermal Workshop.
Hickey, C.W.;Roper, D.S.; Buckland, S.J. (1995) Metal concentrations of resident
and transplanted freshwater mussels Hyridella menziesi (Unionacea: Hyriidae) and
sediments in the Waikato River, New Zealand. The Science of the Total
Environment 175:163-177.
Huser, B.A. (1989). Upper Waikato River and Tauhara geothermal field: Water
quality and geochemistry. Waikato Regional Council Technical Report 1989/22.
Kim, J.P. (1995) Methylmercury in rainbow trout (Oncorhynchus mykiss) from
Lakes Okareka, Okaro, Rotomahana, Rotorua and Tarawera, North Island, New
Zealand. The Science of the Total Environment 164:209-219.
McLaren, S.J.; Kim, N.D. (1995). Evidence for a seasonal fluctuation of arsenic in
New Zealand’s longest river and the effect of treatment on the concentrations in
drinking water. Environmental Pollution 1:67-73.
AK778684 FINAL Page 31
Mahon, W.A.J.; Glover, R.B. (1965). The chemistry of geothermal fluids discharged
from drill holes at Wairakei, New Zealand. Proceeding 8th Commonwealth Mining
and Metallurgical Congress, New Zealand Section. Paper 209.
Mills, G.N. (1995) Mercury and arsenic in Waikato River fish. NIWA Client Report
SCJ129/06.
Ministry of Health. (2005). Drinking-water standards for New Zealand 2005.