1
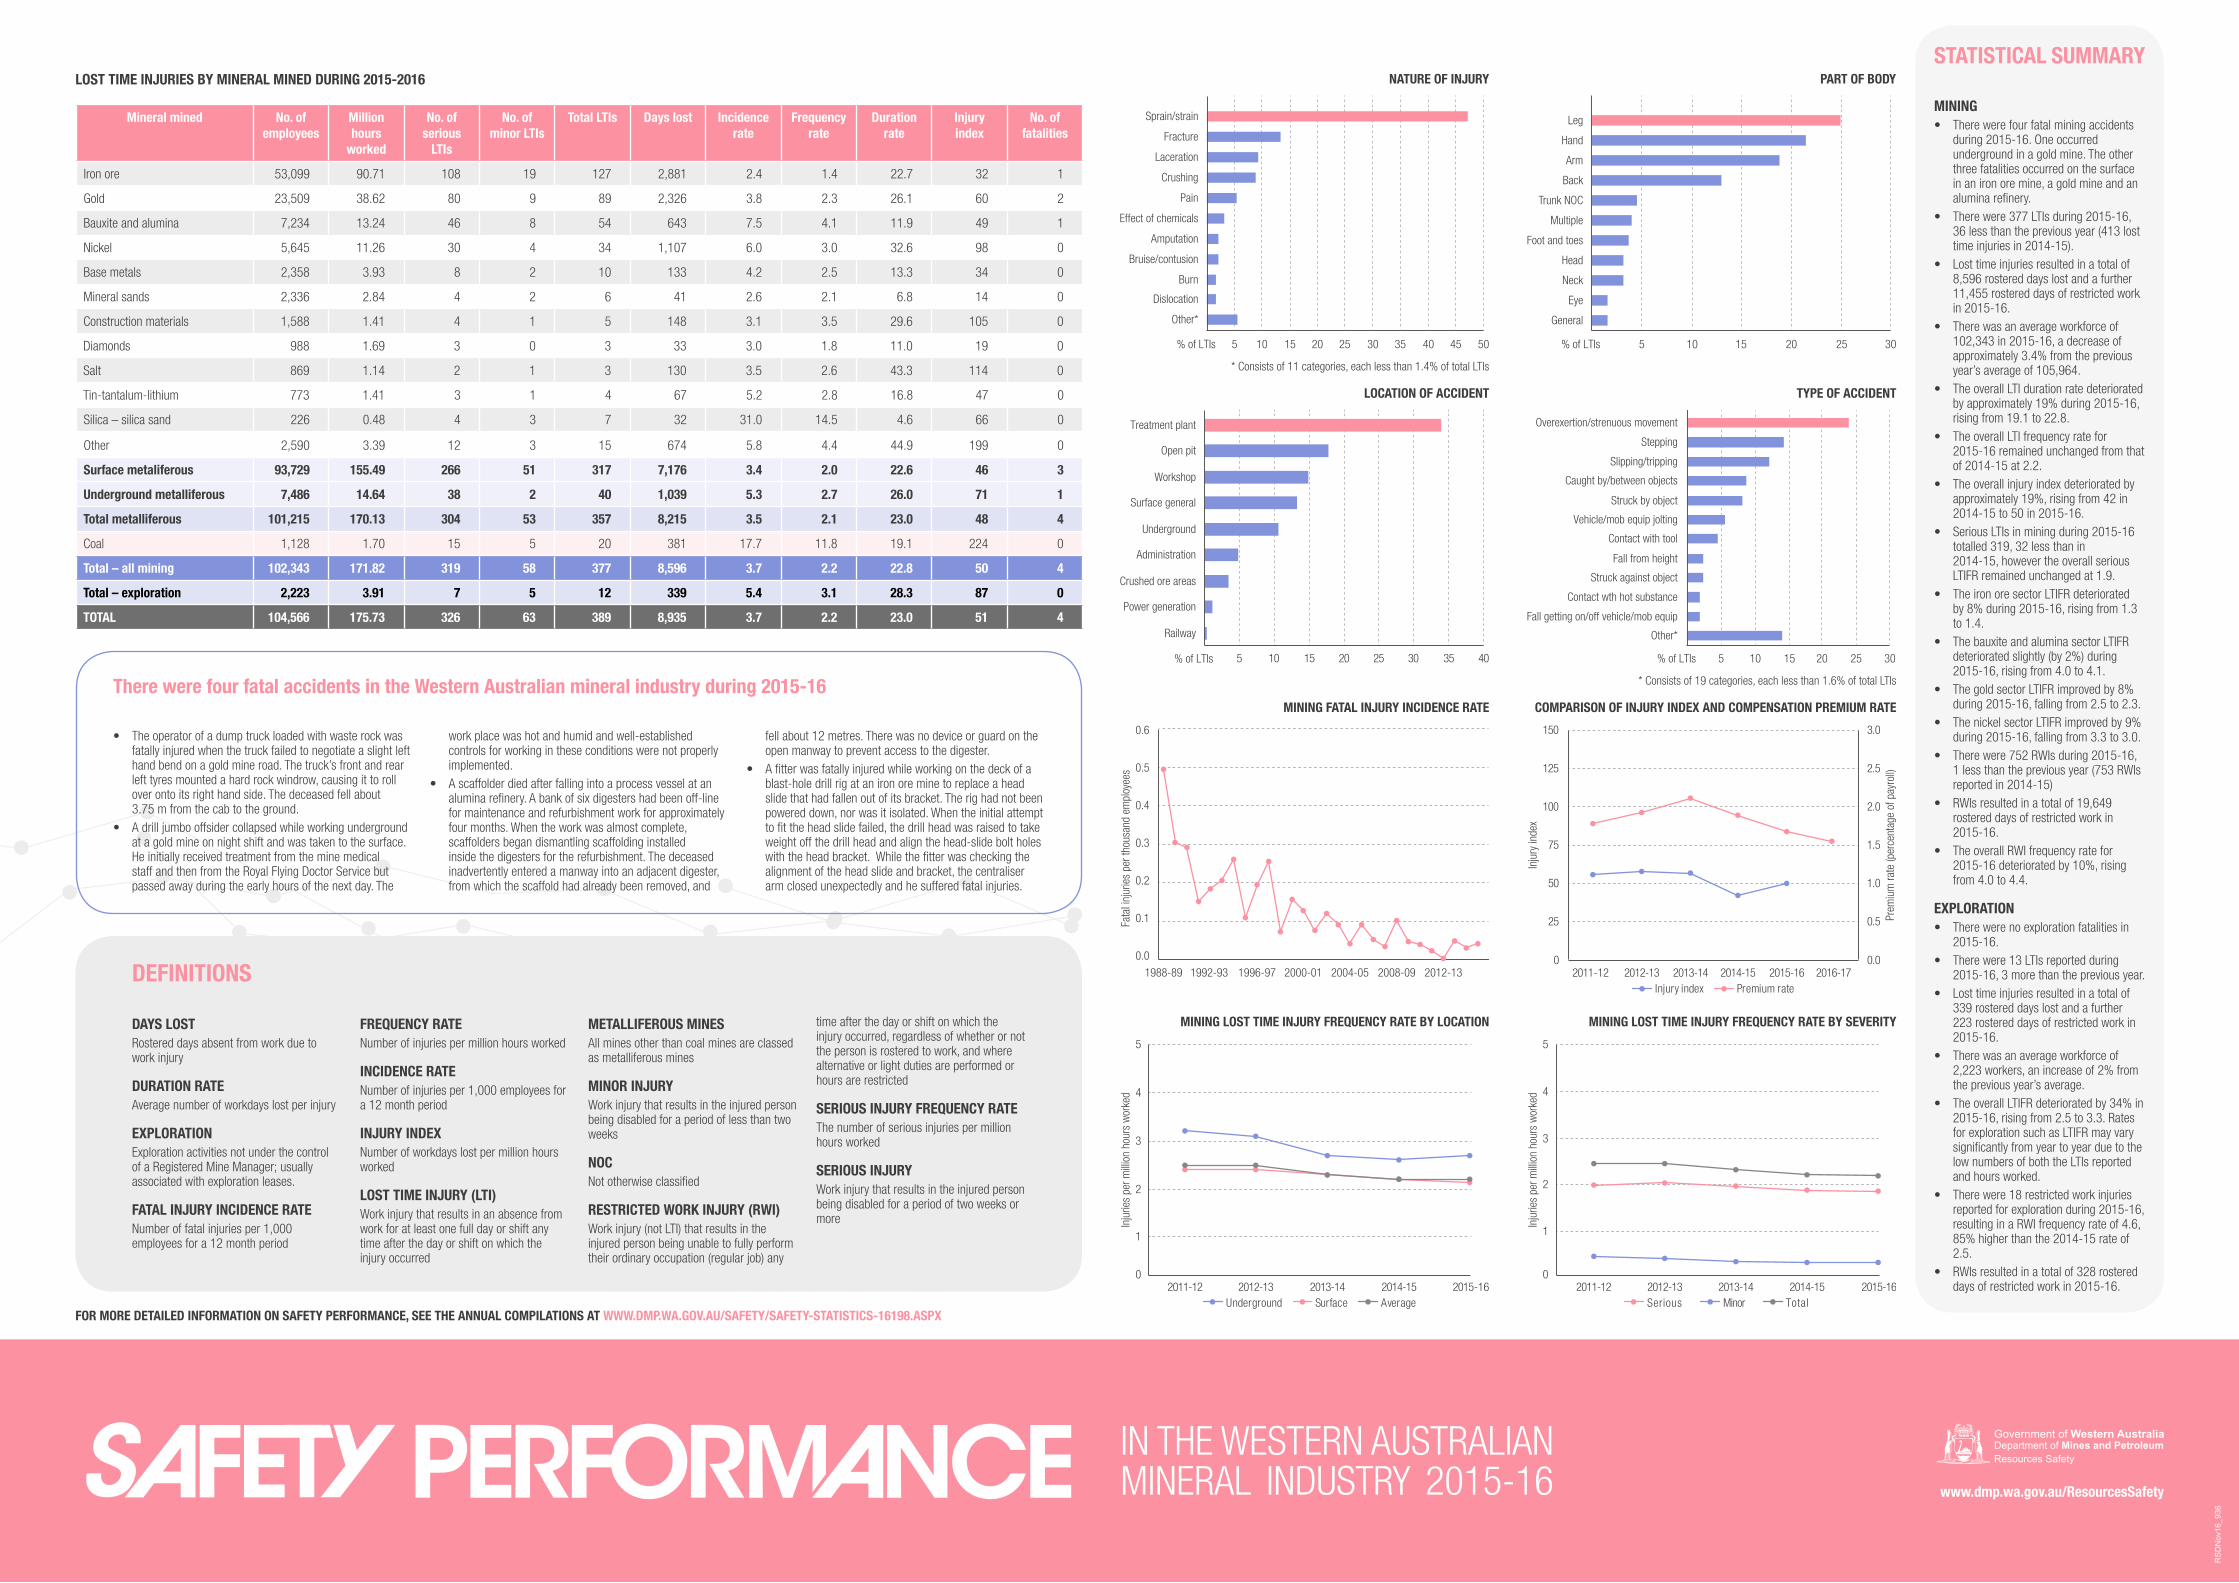
IN THE WESTERN AUSTRALIAN MINERAL INDUSTRY 2015-16 RSDNov16_936 www.dmp.wa.gov.au/ResourcesSafety LOST TIME INJURIES BY MINERAL MINED DURING 2015-2016 Mineral mined No. of employees Million hours worked No. of serious LTIs No. of minor LTIs Total LTIs Days lost Incidence rate Frequency rate Duration rate Injury index No. of fatalities Iron ore 53,099 90.71 108 19 127 2,881 2.4 1.4 22.7 32 1 Gold 23,509 38.62 80 9 89 2,326 3.8 2.3 26.1 60 2 Bauxite and alumina 7,234 13.24 46 8 54 643 7.5 4.1 11.9 49 1 Nickel 5,645 11.26 30 4 34 1,107 6.0 3.0 32.6 98 0 Base metals 2,358 3.93 8 2 10 133 4.2 2.5 13.3 34 0 Mineral sands 2,336 2.84 4 2 6 41 2.6 2.1 6.8 14 0 Construction materials 1,588 1.41 4 1 5 148 3.1 3.5 29.6 105 0 Diamonds 988 1.69 3 0 3 33 3.0 1.8 11.0 19 0 Salt 869 1.14 2 1 3 130 3.5 2.6 43.3 114 0 Tin-tantalum-lithium 773 1.41 3 1 4 67 5.2 2.8 16.8 47 0 Silica – silica sand 226 0.48 4 3 7 32 31.0 14.5 4.6 66 0 Other 2,590 3.39 12 3 15 674 5.8 4.4 44.9 199 0 Surface metaliferous 93,729 155.49 266 51 317 7,176 3.4 2.0 22.6 46 3 Underground metalliferous 7,486 14.64 38 2 40 1,039 5.3 2.7 26.0 71 1 Total metalliferous 101,215 170.13 304 53 357 8,215 3.5 2.1 23.0 48 4 Coal 1,128 1.70 15 5 20 381 17.7 11.8 19.1 224 0 Total – all mining 102,343 171.82 319 58 377 8,596 3.7 2.2 22.8 50 4 Total – exploration 2,223 3.91 7 5 12 339 5.4 3.1 28.3 87 0 TOTAL 104,566 175.73 326 63 389 8,935 3.7 2.2 23.0 51 4 PART OF BODY There were four fatal accidents in the Western Australian mineral industry during 2015-16 • The operator of a dump truck loaded with waste rock was fatally injured when the truck failed to negotiate a slight left hand bend on a gold mine road. The truck’s front and rear left tyres mounted a hard rock windrow, causing it to roll over onto its right hand side. The deceased fell about 3.75 m from the cab to the ground. • A drill jumbo offsider collapsed while working underground at a gold mine on night shift and was taken to the surface. He initially received treatment from the mine medical staff and then from the Royal Flying Doctor Service but passed away during the early hours of the next day. The work place was hot and humid and well-established controls for working in these conditions were not properly implemented. • A scaffolder died after falling into a process vessel at an alumina refinery. A bank of six digesters had been off-line for maintenance and refurbishment work for approximately four months. When the work was almost complete, scaffolders began dismantling scaffolding installed inside the digesters for the refurbishment. The deceased inadvertently entered a manway into an adjacent digester, from which the scaffold had already been removed, and fell about 12 metres. There was no device or guard on the open manway to prevent access to the digester. • A fitter was fatally injured while working on the deck of a blast-hole drill rig at an iron ore mine to replace a head slide that had fallen out of its bracket. The rig had not been powered down, nor was it isolated. When the initial attempt to fit the head slide failed, the drill head was raised to take weight off the drill head and align the head-slide bolt holes with the head bracket. While the fitter was checking the alignment of the head slide and bracket, the centraliser arm closed unexpectedly and he suffered fatal injuries. % of LTIs Other* Dislocation Burn Bruise/contusion Amputation Effect of chemicals Pain Crushing Laceration Fracture Sprain/strain 5 10 15 20 25 30 35 40 45 50 NATURE OF INJURY 5 10 15 20 25 30 General Eye Neck Head Foot and toes Multiple Trunk NOC Back Arm Hand Leg % of LTIs LOCATION OF ACCIDENT % of LTIs 5 10 15 20 25 30 35 40 Railway Power generation Crushed ore areas Administration Underground Surface general Workshop Open pit Treatment plant MINING FATAL INJURY INCIDENCE RATE Fatal injuries per thousand employees 0.0 0.1 0.2 0.3 0.4 0.5 0.6 1988-89 1992-93 1996-97 2000-01 2004-05 2008-09 2012-13 COMPARISON OF INJURY INDEX AND COMPENSATION PREMIUM RATE Injury index Premium rate (percentage of payroll) 0.0 0.5 1.0 1.5 2.0 2.5 3.0 0 25 50 75 100 125 150 2011-12 2012-13 2013-14 2014-15 2015-16 2016-17 Premium rate Injury index MINING LOST TIME INJURY FREQUENCY RATE BY LOCATION Injuries per million hours worked 0 1 2 3 4 5 2011-12 2012-13 2013-14 2014-15 2015-16 Underground Surface Average MINING LOST TIME INJURY FREQUENCY RATE BY SEVERITY Injuries per million hours worked 0 1 2 3 4 5 2011-12 2012-13 2013-14 2014-15 2015-16 Serious Minor Total TYPE OF ACCIDENT 5 10 15 20 25 30 % of LTIs Other* Fall getting on/off vehicle/mob equip Contact wth hot substance Struck against object Fall from height Contact with tool Vehicle/mob equip jolting Struck by object Caught by/between objects Slipping/tripping Stepping Overexertion/strenuous movement * Consists of 19 categories, each less than 1.6% of total LTIs STATISTICAL SUMMARY MINING • There were four fatal mining accidents during 2015-16. One occurred underground in a gold mine. The other three fatalities occurred on the surface in an iron ore mine, a gold mine and an alumina refinery. • There were 377 LTIs during 2015-16, 36 less than the previous year (413 lost time injuries in 2014-15). • Lost time injuries resulted in a total of 8,596 rostered days lost and a further 11,455 rostered days of restricted work in 2015-16. • There was an average workforce of 102,343 in 2015-16, a decrease of approximately 3.4% from the previous year’s average of 105,964. • The overall LTI duration rate deteriorated by approximately 19% during 2015-16, rising from 19.1 to 22.8. • The overall LTI frequency rate for 2015-16 remained unchanged from that of 2014-15 at 2.2. • The overall injury index deteriorated by approximately 19%, rising from 42 in 2014-15 to 50 in 2015-16. • Serious LTIs in mining during 2015-16 totalled 319, 32 less than in 2014-15, however the overall serious LTIFR remained unchanged at 1.9. • The iron ore sector LTIFR deteriorated by 8% during 2015-16, rising from 1.3 to 1.4. • The bauxite and alumina sector LTIFR deteriorated slightly (by 2%) during 2015-16, rising from 4.0 to 4.1. • The gold sector LTIFR improved by 8% during 2015-16, falling from 2.5 to 2.3. • The nickel sector LTIFR improved by 9% during 2015-16, falling from 3.3 to 3.0. • There were 752 RWIs during 2015-16, 1 less than the previous year (753 RWIs reported in 2014-15) • RWIs resulted in a total of 19,649 rostered days of restricted work in 2015-16. • The overall RWI frequency rate for 2015-16 deteriorated by 10%, rising from 4.0 to 4.4. EXPLORATION • There were no exploration fatalities in 2015-16. • There were 13 LTIs reported during 2015-16, 3 more than the previous year. • Lost time injuries resulted in a total of 339 rostered days lost and a further 223 rostered days of restricted work in 2015-16. • There was an average workforce of 2,223 workers, an increase of 2% from the previous year’s average. • The overall LTIFR deteriorated by 34% in 2015-16, rising from 2.5 to 3.3. Rates for exploration such as LTIFR may vary significantly from year to year due to the low numbers of both the LTIs reported and hours worked. • There were 18 restricted work injuries reported for exploration during 2015-16, resulting in a RWI frequency rate of 4.6, 85% higher than the 2014-15 rate of 2.5. • RWIs resulted in a total of 328 rostered days of restricted work in 2015-16. * Consists of 11 categories, each less than 1.4% of total LTIs DEFINITIONS DAYS LOST Rostered days absent from work due to work injury DURATION RATE Average number of workdays lost per injury EXPLORATION Exploration activities not under the control of a Registered Mine Manager; usually associated with exploration leases. FATAL INJURY INCIDENCE RATE Number of fatal injuries per 1,000 employees for a 12 month period FREQUENCY RATE Number of injuries per million hours worked INCIDENCE RATE Number of injuries per 1,000 employees for a 12 month period INJURY INDEX Number of workdays lost per million hours worked LOST TIME INJURY (LTI) Work injury that results in an absence from work for at least one full day or shift any time after the day or shift on which the injury occurred METALLIFEROUS MINES All mines other than coal mines are classed as metalliferous mines MINOR INJURY Work injury that results in the injured person being disabled for a period of less than two weeks NOC Not otherwise classified RESTRICTED WORK INJURY (RWI) Work injury (not LTI) that results in the injured person being unable to fully perform their ordinary occupation (regular job) any time after the day or shift on which the injury occurred, regardless of whether or not the person is rostered to work, and where alternative or light duties are performed or hours are restricted SERIOUS INJURY FREQUENCY RATE The number of serious injuries per million hours worked SERIOUS INJURY Work injury that results in the injured person being disabled for a period of two weeks or more FOR MORE DETAILED INFORMATION ON SAFETY PERFORMANCE, SEE THE ANNUAL COMPILATIONS AT WWW.DMP.WA.GOV.AU/SAFETY/SAFETY-STATISTICS-16198.ASPX