RESEARCH PAPER In Vitro and In Situ Evaluation of pH-Dependence of Atazanavir Intestinal Permeability and Interactions with Acid-Reducing Agents Olena Kis & Sharon L. Walmsley & Reina Bendayan Received: 20 November 2013 /Accepted: 8 February 2014 # Springer Science+Business Media New York 2014 ABSTRACT Purpose The objectives of this study were to evaluate the effects of intestinal lumen pH, food intake, and acid-reducing agents on the intestinal permeability of atazanavir, an HIV-1 protease inhibitor. Methods Atazanavir permeability across Caco-2 cell monolayers (P app ) and in situ steady-state permeability across rat jejunum and ileum (P eff ) were evaluated in buffers of varied pH (4.5–8.5), in fasted- or fed-state simulated intestinal fluid, or in presence of acid-reducing drugs (e.g., omeprazole). Results In vitro accumulation and apical-to-basolateral P app of atazanavir increased with decreasing pH. This effect appeared to be associated with lower atazanavir efflux by P-glycoprotein at acidic pH (5.5) compared to neutral pH. In situ atazanavir P eff across rat jejunum and ileum also decreased 2.7 and 2.3-fold, respectively, when pH was increased from 4.5 to 8.5. Several acid-reducing agents (e.g., omeprazole) moderately inhibited atazanavir efflux in Caco-2 monolayers; however, this effect was not observed in situ. Fed-state buffer significantly increased atazanavir apical-to-basolateral P app (p <0.001) and in situ P eff (p <0.05) compared to fasted-state buffer. Conclusions Atazanavir permeability is sensitive to changes in intestinal lumen pH. This pH-sensitivity may contribute to atazanavir clinical interactions with acid-reducing agents and vari- able oral bioavailability. KEY WORDS acid-reducing agents . atazanavir . HIV-1 protease inhibitors . intestinal permeability . pH dependence ABBREVIATIONS AUC area under the curve C max maximum or peak plasma concentration CYP cytochrome P450 H 2 RA histamine 2 -receptor antagonist HIV human immunodeficiency virus MRP multidrug resistance-associated protein OATP organic anion transporting polypeptide Pgp P-glycoprotein PPI proton-pump inhibitor SIF simulated intestinal fluid INTRODUCTION Atazanavir is an HIV-1 protease inhibitor used in combina- tion with other antiretroviral drugs for clinical management of HIV infection (1). Although atazanavir clinical use is generally well tolerated, high interindividual variability in atazanavir pharmacokinetics and many clinically significant drug-drug interactions can compromise its efficacy and safety (2). Oral administration of 400 mg/day atazanavir in HIV-infected patients results in a maximum (peak) plasma concentration (C max ) of 3.15±2.23 μg/ml and area under the curve (AUC) of 22.3±20.2 μg•h/ml (3). In contrast, healthy individuals have higher and less variable C max (5.36±1.37 μg/ml) and AUC (29.3±8.3 μg•h/ml) (2). Although the reasons for these pharmacokinetic differences remain unclear, atazanavir ex- hibits pH-dependent aqueous solubility, which decreases when pH is increased above 3 (2,4), and HIV-infected patients are reported to have increased gastric pH due to common gastrointestinal complications associated with HIV infection (5). In addition, atazanavir bioavailability is affected by food O. Kis : R. Bendayan (*) Department of Pharmaceutical Sciences, Leslie Dan Faculty of Pharmacy University of Toronto( 144 College Street, Room 1001 Toronto( Ontario M5S 3M2, Canada e-mail: [email protected]S. L. Walmsley Department of Medicine University of Toronto Toronto( Ontario Canada S. L. Walmsley Division of Infectious Diseases University Health Network Toronto( Ontario Canada Pharm Res DOI 10.1007/s11095-014-1336-0
Transcript
RESEARCH PAPER
In Vitro and In Situ Evaluation of pH-Dependence of AtazanavirIntestinal Permeability and Interactions with Acid-ReducingAgents
Olena Kis & Sharon L. Walmsley & Reina Bendayan
Received: 20 November 2013 /Accepted: 8 February 2014# Springer Science+Business Media New York 2014
ABSTRACTPurpose The objectives of this study were to evaluate the effectsof intestinal lumen pH, food intake, and acid-reducing agents onthe intestinal permeability of atazanavir, an HIV-1 proteaseinhibitor.Methods Atazanavir permeability across Caco-2 cell monolayers(Papp) and in situ steady-state permeability across rat jejunum andileum (Peff) were evaluated in buffers of varied pH (4.5–8.5), infasted- or fed-state simulated intestinal fluid, or in presence ofacid-reducing drugs (e.g., omeprazole).Results In vitro accumulation and apical-to-basolateral Papp ofatazanavir increased with decreasing pH. This effect appeared tobe associated with lower atazanavir efflux by P-glycoprotein atacidic pH (5.5) compared to neutral pH. In situ atazanavir Peffacross rat jejunum and ileum also decreased 2.7 and 2.3-fold,respectively, when pH was increased from 4.5 to 8.5. Severalacid-reducing agents (e.g., omeprazole) moderately inhibitedatazanavir efflux in Caco-2 monolayers; however, this effect wasnot observed in situ. Fed-state buffer significantly increasedatazanavir apical-to-basolateral Papp (p<0.001) and in situ Peff(p<0.05) compared to fasted-state buffer.Conclusions Atazanavir permeability is sensitive to changes inintestinal lumen pH. This pH-sensitivity may contribute toatazanavir clinical interactions with acid-reducing agents and vari-able oral bioavailability.
ABBREVIATIONSAUC area under the curveCmax maximum or peak plasma concentrationCYP cytochrome P450H2RA histamine2-receptor antagonistHIV human immunodeficiency virusMRP multidrug resistance-associated proteinOATP organic anion transporting polypeptidePgp P-glycoproteinPPI proton-pump inhibitorSIF simulated intestinal fluid
INTRODUCTION
Atazanavir is an HIV-1 protease inhibitor used in combina-tion with other antiretroviral drugs for clinical management ofHIV infection (1). Although atazanavir clinical use is generallywell tolerated, high interindividual variability in atazanavirpharmacokinetics and many clinically significant drug-druginteractions can compromise its efficacy and safety (2). Oraladministration of 400 mg/day atazanavir in HIV-infectedpatients results in a maximum (peak) plasma concentration(Cmax) of 3.15±2.23 μg/ml and area under the curve (AUC)of 22.3±20.2 μg•h/ml (3). In contrast, healthy individualshave higher and less variable Cmax (5.36±1.37 μg/ml) andAUC (29.3±8.3 μg•h/ml) (2). Although the reasons for thesepharmacokinetic differences remain unclear, atazanavir ex-hibits pH-dependent aqueous solubility, which decreaseswhen pH is increased above 3 (2,4), andHIV-infected patientsare reported to have increased gastric pH due to commongastrointestinal complications associated with HIV infection(5). In addition, atazanavir bioavailability is affected by food
O. Kis : R. Bendayan (*)Department of Pharmaceutical Sciences, Leslie Dan Faculty of PharmacyUniversity of Toronto( 144 College Street, Room 1001Toronto( Ontario M5S 3M2, Canadae-mail: [email protected]
S. L. WalmsleyDepartment of Medicine University of TorontoToronto( Ontario Canada
S. L. WalmsleyDivision of Infectious Diseases University Health NetworkToronto( Ontario Canada
Pharm ResDOI 10.1007/s11095-014-1336-0
intake. Relative to fasting levels, atazanavir administrationwith a light meal increases its AUC and Cmax by 70% and57%, respectively, for unboosted atazanavir regimens, and33% and 40%, respectively, for ritonavir-boosted regimens(2). Since food intake is associated with the secretion of acid inthe stomach and bile salts (e.g., taurocholate) and phospho-lipids (e.g., lecithin) in the small intestine, observed enhance-ment in atazanavir oral bioavailability may be related to thechanges in atazanavir intestinal permeability mediated by pHor composition of the intestinal fluid.
Clinical use of atazanavir is associated with many drug-drug interactions involving acid-reducing agents, such asproton-pump inhibitors (PPIs), histamine2-receptor antago-nists (H2RAs), and antacids (3,6–8). Since these drugs increasegastrointestinal pH, these interactions are suggested to be pH-mediated. However, depending on the acid-reducing agentused, the magnitude of the effect on atazanavir pharmacoki-netics differs considerably. Studies in healthy volunteers re-ceiving ritonavir-boosted atazanavir demonstrated that co-administration of 40 mg of omeprazole (PPI) decreasedatazanavir AUC, Cmax, and minimum (trough) plasma con-centration by 72%, 76%, and 78%, respectively (8), while40 mg of famotidine (H2RA) reduced atazanavir AUC andCmax only by 20–25% (9). Although one potential explanationfor these differences is that omeprazole has a more potenteffect on gastric pH (10), other mechanisms independent ofthe effect of acid-reducing agents on gastric pH may contrib-ute to these clinical drug-drug interactions.
Atazanavir is a bulky azapeptide drug (free base molecularweight of 704.9) with poor aqueous solubility (3.27×10⁻³ g/l)and high lipophilicity (predicted log P value of 4.08–4.54)(http://www.drugbank.ca/drugs/DB01072) (2). However,experimentally it was shown to have lower octanol:salinepartition coefficient of 29.90±4.12 equivalent to log P of 1.48 (11). Atazanavir contains a weakly basic ionisable groupwith predicted pKa of 4.4. While at neutral pH it is primarilyuncharged, at acidic pH, the basic group becomes protonatedand positively charged, increasing atazanavir aqueous solubil-ity. Based on the predicted high permeability (log P value>1.72) and low aqueous solubility, atazanavir can be classified asa Class 2 compound in the Biopharmaceutics ClassificationSystem (BCS), with the predicted absorption of ≥90% (12).Atazanavir is also highly metabolized (approximately 80% of400-mg oral dose) primarily by cytochrome P450 (CYP) en-zymes (i.e., CYP3A4) (2). In addition, atazanavir is a substratefor membrane-associated drug transporters, such as P-glycoprotein (Pgp) and multidrug resistance-associated pro-teins (MRPs), and an unidentified uptake carrier potentiallybelonging to the organic anion transporting polypeptide(OATP) superfamily (11,13–15). Many PPIs are known tointeract with metabolic enzymes and drug transporters (10).For example, omeprazole competitively inhibits CYP3A4 andCYP2C19, induces the activity of CYP3A4, CYP2C19, and
CYP1A2, and inhibits efflux transporters, Pgp and breastcancer resistance protein (16). Similarly, H2RAs are knownto interact with several drug uptake and efflux transporters.Cimetidine can competitively inhibit organic cation trans-porters 1 and 2 as well as organic cation efflux transporters,such as multidrug and toxin extrusion transporters 1 and 2-K(17). Hence, potential pharmacokinetic interactions of thesedrugs with atazanavir transport or metabolism could contrib-ute to the observed clinical drug-drug interactions. To the bestof our knowledge, no studies evaluating the effects of PPIs orH2RAs on atazanavir intestinal permeability or demonstrat-ing that atazanavir intestinal permeability is altered by chang-es in pH are available. In this study, we used an establishedin vitro human epithelial cell line system (Caco-2) and an in situintestinal perfusion model to investigate atazanavir intestinalpermeability at various intestinal luminal pH or fasted- or fed-state conditions and assess potential pharmacokinetic interac-tions with coadministered acid-reducing agents.
MATERIALS AND METHODS
Materials
3H-Atazanavir (3 Ci/mmol) and 14C-D-mannitol(55 mCi/mmol) were purchased from Moravek Bio-chemicals (Brea, CA). Valspodar, i.e., PSC833 (chemicalname: 6-[(2S,4R,6E)-4-methyl-2-(methylamino)-3-oxo-6-octenoic acid]-7-L-valine-cyclosporin A), was a generousgift from Novartis Pharma (Basel, Switzerland). Unla-beled atazanavir was obtained from the National Insti-tutes of Health AIDS research and reference reagentprogram, Division of AIDS, National Institute of Allergyand Infectious Diseases, National Institutes of Health(Bethesda, MD). Caco-2 cells were obtained from theAmerican Type Culture Collection (Manassas, VA). Tis-sue culture reagents such as Dulbecco’s Modified Ea-gle’s Medium, L-glutamine, penicillin/streptomycin,minimal essential medium non-essential amino acids,fetal bovine serum, phosphate-buffered saline (PBS),and trypsin were obtained from Invitrogen (Grand Is-land, NY, USA). Drugs (PPIs and H2RAs), sodiumtaurocholate, egg lecithin (L-α-phosphatidylcholine), allbiological buffers, Triton X-100, and all other reagentswere purchased from Sigma-Aldrich (Oakville, Canada),unless otherwise indicated.
Preparation of Buffers for In Vitro, In Situ,and Lipophilicity Experiments
For in vitro transport assays and in situ perfusion studies, buffersof varied pH (4.5–8.5) were prepared using 135 mM NaCland 5 mM KCl stock solution supplemented with 25 mM
acetic acid for pH 4.5 buffer, 25 mM MES [chemical name:2-(N-morpholino)ethanesulfonic acid] for pH 5.5 buffer, 25 mMBES [chemical name: N,N-Bis(2-hydroxyethyl)-2-aminoethanesulfonic acid] for pH 6.5 buffer, 25 mM HEPES[chemical name: 4-(2-hydroxyethyl)-1-piperazineethanesulfonicacid] for pH 7.4 buffer, or 25 mM Tris buffer [chemical name:2-amino-2-(hydroxymethyl)propane-1,3-diol] for pH 8.5 buffer.For Transwell permeability studies, basolateral compartmentand preincubation buffers were prepared using Hanks’ balancedsalt solution (1.3 mM CaCl2, 0.49 mM MgCl2, 0.41 mMMgSO4, 5.3 mM KCl, 0.44 mM KH2PO4, 138 mM NaCl,0.34 mM Na2HPO4, and 5.6 mM D-glucose), supplementedwith 25 mM HEPES. Each buffer was adjusted to the desiredpH by addition of 1 N HCl or 1 N NaOH solution and pH wasmeasured using VWR SympHony Model SB70P pH meter(VWR, Mississauga, Canada). For in vitro accumulation andpermeability experiments, all buffers were supplemented with0.01% bovine serum albumin (BSA) to reduce the binding ofradiolabeled compounds to glass and plastic surfaces. For exper-iments examining atazanavir lipophilicity, same pH 4.5–8.5buffers were used as described above for in vitro transport studies,but without 0.01%BSA. In addition, buffers of pH 1, 2, 3, and 4were prepared using 50 mMKCl solution (for pH 1 and 2) and50 mM potassium hydrogen phthalate (for pH 3 and 4) (18).
Solutions simulating intestinal fluid in the fed or fasted statewere prepared as described previously (19). Briefly, to preparefasted-state simulated intestinal fluid (SIF), 6.2 g/l of NaCland 3.4 g/l of NaH2PO4 were dissolved in deionized waterand the pH of the solution was adjusted to pH 6.5 using 1 NNaOH. This “blank” fasted-state SIF buffer was then supple-mented with 3 mM sodium taurocholate and 0.75 mM egglecithin. To prepare fed-state SIF buffer, 11.9 g/l of NaCl and8.65 g/l of CH3COOHwere dissolved in deionized water andthe pH of the solution was adjusted to pH 5.0 using 1 NNaOH. This “blank” fed-state SIF buffer was supplementedwith 15 mM sodium taurocholate and 3.75 mM egg lecithin.Taurocholate and lecithin were stirred into the fasted- andfed-state SIF overnight using a magnetic stir plate until a clearmicellar solution was formed.
Determination of Atazanavir Lipophilicity at DifferentpH
Lipophilicity of atazanavir across a range of pH (1–8.5) wasdetermined using 1:1 mixture of 1-octanol or cyclohexane andthe aqueous buffer of varied pH (i.e., water layer). The selec-tion of the two organic solvents was based on their differencesin hydrogen bonding capacity. While 1-octanol allows hydro-gen bonding, cyclohexane does not. Prior to mixing organicand aqueous phases, 3H-labeled atazanavir (0.2 μCi/ml) so-lution, supplemented with unlabeled drug to a final concen-tration of 10 μM, was prepared in buffers of different pH (1–8.5). At 10 μMconcentration, atazanavir was fully dissolved in
the aqueous solution across this range of pH values. Samplesof each solution were taken to measure the radioactivitycorresponding to the total 10 μM atazanavir (i.e., 100%).Equal volumes of each aqueous solution (containing 3H-atazanavir) and organic solvent (1-octanol or cyclohexane)were combined and shaken repeatedly over 30 min periodand allowed to equilibrate for at least 24 h. Mixtures werethen centrifuged at 800×g for 30 min at 22°C and atazanavirconcentration remaining in the aqueous layer was determinedby liquid scintillation counting. Log D values were estimatedfrom the apparent partitioning coefficients (D = Corganic/Caqueous) determined at each pH, where Caqueous is the con-centration of atazanavir in the aqueous solvent and Corganic isthe concentration of atazanavir in the organic solvent (esti-mated by deducting atazanavir remaining in the aqueouscompartment after mixing from the total amount measuredinitially prior to mixing with the organic solvent). Log Dcoefficients describe the pH dependent partitioning of bothionized and unionized forms of the compound between theorganic and aqueous solutions, whereas log P coefficients referto the partition coefficients determined in the octanol:watermixture or the calculated partition coefficients, which areindependent of pH.
Cell Culture
Caco-2 cells were maintained at 37°C and 5% CO2 in cellculture medium consisting of Dulbecco’s Modified Eagle’sMedium (4.5 g/L glucose), 10% fetal bovine serum,2 mM L-glutamine, 1% minimal essential medium non-essential amino acids, and 1% penicillin/streptomycin. Cellswere passaged using 0.05% trypsin-EDTA upon reaching95% confluence. For atazanavir transport studies, Caco-2cells (passage number 40–55) were seeded at 6×10⁴ cells/cm2 cell density on the surface of flat-bottom 48-well plates(for intracellular accumulation assays) or 12-well, 0.4 μm poresize TranswellTM polycarbonate membrane inserts (for per-meability assays). Culture medium was replaced 24 h afterpassaging and every 2–3 days thereafter for 20–22 days post-confluence to achieve small intestine-like epithelial cell differ-entiation (20).
Transport Experiments in Caco-2 Cells
Atazanavir accumulation assays in Caco-2 cells grown on solidsupport were performed according to our previous publishedprotocol (21). Briefly, once confluent Caco-2 cell monolayerswere fully differentiated (after 20–22 days in culture post-confluence), 48-well plates were placed on a dry bath at37°C for the duration of the experiment and culture mediumin each well was replaced with blank pH 7.4 transport buffer(i.e., preincubation buffer). Cells were allowed to equilibratefor 20 min and the preincubation buffer was replaced by
pH-Dependence of Atazanavir Intestinal Permeability
radioactive transport buffer of desired pH (4.5–8.5) containing0.1 μCi/ml 3H-atazanavir supplemented with unlabeledatazanavir to reach 1 μM concentration. At the desired timeinterval, the radioactive buffer was removed and cells werewashed twice with ice-cold PBS and solubilised in 1% TritonX-100 at 37°C for 30 min. The content of each well wascollected into 7 ml vial, mixed with 2 ml of PicoFluor 40scintillation fluid (PerkinElmer, Boston, MA), and incubatedfor 10 min at room temperature. The total radioactivity ineach vial was measured using a Beckman Coulter LS6500Scintillation counter. All accumulation values were correctedusing “zero-time” uptake, which was determined in eachexperiment by measuring the amount of radiolabeledatazanavir retained by the cells after a minimum exposure,i.e., when radioactive solution was removed immediately afterit was added into the well. Uptake of the 3H-atazanavir wasnormalized to the total cellular protein content per well, whichwas measured in each experiment (average from 3 wells) usingthe BioRad DC Protein Assay kit (Bio-Rad, Mississauga,Ontario, Canada) and BSA as the standard. To evaluateinhibitory potencies of selected inhibitor drugs, cellular accu-mulation of 3H-atazanavir was evaluated in the absence(control) or presence of each drug (at specified concentration),which was added to the preincubation buffer and the radio-active transport buffer. For inhibitors dissolved initially indimethyl sulfoxide (DMSO), equal volume of DMSO wasadded to the corresponding “control” solution. To evaluatethe concentration-dependent effect, cellular accumulation of3H-atazanavir, after 60 min incubation at pH 7.4, was evalu-ated in the absence (DMSO control) or presence of differentconcentrations of omeprazole (0.01–500 μM) or cimetidine(0.01–500 μM). Omeprazole interactions were also evaluatedin the presence of 1 μM PSC833, a non-immunosuppressiveanalog of cyclosporine A and potent inhibitor of Pgp, whichwas added to the control transport buffer and all omeprazolecontaining solutions (0.01–500 μM). 3H-Atazanavir accumu-lation in the presence of various concentrations of omeprazolewas expressed as % of control, i.e.,3H-atazanavir accumula-tion in the presence of 1 μM PSC833 without omeprazoleadded. The concentrations of inhibitor drugs that result-ed in half-maximal inhibitory effect (i.e., IC50) wereestimated by fitting the data to a sigmoidal dose re-sponse equation (Eq. 1).
Atazanavir permeability across Caco-2 cell monolayerswas examined by the Transwell drug permeability assay,modified from our method described previously (13). Caco-2cells, grown on Transwell membrane inserts for 20–22 dayspost confluence, were washed with PBS at 37°C. The mono-layer integrity in each well was confirmed by measuring thetransepithelial electrical resistance across the monolayer (>600 Ω⋅cm2 used for experiments) using a Millicell-ERS(Millipore). Each well was transferred into a clean 12-wellplate, which was placed on a dry bath at 37°C for the duration
of the experiment. Basolateral compartment of each well wasfilled with 1.5 ml of basolateral buffer and PBS in the apicalcompartment was replaced with the apical preincubationbuffer of pH 7.4 and allowed to equilibrate for 20 min. Formeasuring apical-to-basolateral permeability at different api-cal pH, the buffer in the basolateral (receiver) compartmentwas replaced with 1.5 ml of fresh basolateral buffer (pH 7.4)and the buffer in the apical (donor) compartment was re-placed with 0.5 ml of radioactive solution of pH 4.5–8.5containing 1 μM 3H-atazanavir and 1 μM 14C-D-mannitol.Permeability of 14C-D-Mannitol was used as a control, toconfirm monolayer integrity for the length of the flux exper-iment. To maintain sink conditions, every 15 min (at t=15 min, 30 min, 45 min, and 60 min) each Transwell wasmoved into a new well containing fresh basolateral buffer.Atazanavir and D-mannitol concentrations in the basolateralcompartment after each time point were then measured bytaking two 250 μl samples from each well, combining eachone with 2 ml of scintillation fluid and counting 3H and 14Cradioactivity by liquid scintillation counting. For measuringbasolateral-to-apical permeability, the preincubation buffer inthe apical (receiver) compartment was replaced with 0.5 ml offresh buffer of desired pH (4.5–8.5) and each Transwell wastransferred into a new well containing 1.5 ml of 3H-atazanavir(1 μM) and 14C-D-mannitol (1 μM) radioactive solution of pH7.4 in the basolateral (donor) compartment. To maintain sinkconditions, every 15 min (at t=15 min, 30 min, 45 min, and60 min) the apical solution from each Transwell was removedinto a scintillation vial (for liquid scintillation counting) andreplaced with 0.5 ml of fresh apical buffer of the same pH(4.5–8.5). To examine the effect of fasted and fed state onatazanavir permeability, fasted- and fed-state SIF was used inthe apical (donor) compartment while pH 7.4 buffer was usedin the basolateral (receiver) compartment and the apical-to-basolateral permeability was measured as described above.For experiments examining atazanavir permeability in thepresence of inhibitor (PSC833) or acid-reducing drug (omep-razole or cimetidine), inhibitor or drug was added to bothcompartments (apical and basolateral) during the 20-minpreincubation period and 60-min transport period while theflux of atazanavir and D-mannitol was measured. Cumulativeflux of 3H-atazanavir and 14C-D-mannitol in apical-to-basolateral or basolateral-to-apical direction was determinedin each well over 0–60 min time period to estimate theapparent permeability coefficients (Papp) (Eq. 2). Wells wereincluded in the analysis only if Papp of mannitol was less than1×10−6 cm/s. Atazanavir efflux ratios at different pH or inthe presence of acid-reducing agents were determined accord-ing to Eq. 3 using the corresponding Papp coefficients forbasolateral-to-apical and apical-to-basolateral permeability.Efflux ratios demonstrate the contribution of active transportin restricting (ER>1) or facilitating (ER<1) absorptive per-meability of the drug.
Kis, Walmsley and Bendayan
In Situ Single-Pass Perfusion of Rat Intestine
Open-loop in situ single-pass perfusion studies in rat werecarried out in accordance with the study protocol approvedby the University of Toronto Animal Ethics Committee asdescribed previously (13), with some modifications. MaleSprague–Dawley rats, 300–350 g, obtained from CharlesRiver Laboratories (Wilmington, MA), were housed and han-dled according to the University of Toronto, Department ofComparative Medicine guidelines and were allowed to accli-matize for 7 days prior to experiments. Before surgery, ani-mals were anaesthetized with isoflurane inhalant anaestheticand maintained at 37°C throughout surgery and perfusionprocedures. The abdominal cavity was opened by midlineincision (3–4 cm) and proximal jejunum segment (6–8 cm inlength, starting 2 cm after the ligament of Treitz) and distalileum segment (6–8 cm in length, ending 1 cm before thececum) were exposed. Each segment was partially opened ateach end, rinsed with warmed saline, and ligated at both endsto glass cannulas (inner diameter=4mm), which were securedin place with silk sutures. Exposed intestinal segments wereplaced back into the abdominal cavity and covered withsaline-wetted gauze and parafilm. Glass cannulas were thenconnected to inlet (proximal opening) or outlet (distal opening)tubing. Each segment was perfused at a constant flow rate of0.2 ml/min using a syringe infusion pump (Harvard Appara-tus syringe pump, Model 22) with perfusion buffer containing3H-atazanavir (10 μM) and 14C-D-mannitol (10 μM), used asmarker of paracellular permeability. After atazanavir perme-ability reached steady state (approximately after 30 min), per-fusate exiting from each segment via outlet tubing was collect-ed into vials at 10 min intervals. In order to model gradualchange in pHwhich occurs during food intake or following co-administration of acidic/basic drugs or acid-reducing agents,buffer pH was gradually increased from 4.5 to 8.5(alkalinization) or gradually decreased from 8.5 to 4.5(acidification). Buffer pH was changed at 40-min intervals todetermine the effective permeability of atazanavir and D-mannitol at each pH. The first perfusion period was extendedby 30 min to allow atazanavir intestinal permeability to reachsteady state prior to determining effective permeability coeffi-cients. To change the perfusion buffer pH, approximately5 ml of perfusion buffer was used to replace the previousbuffer from the segment, followed by perfusion at constantflow rate of 0.2 ml/min. For studies examining the effect offasted- and fed-state SIF on atazanavir in situ intestinal per-meability, jejunum and ileum segments in each animal werefirst perfused with the fasted-state buffer (30 minpreincubation and 0–60 min perfusion) and then with thefed-state buffer (60–120 min perfusion), both of whichcontained 3H-atazanavir (10 μM) and 14C-D-mannitol(10 μM). For studies examining the effect of omeprazole onatazanavir permeability in the jejunum and ileum, steady-
state Peff of3H-atazanavir (10 μM) was assessed at pH 6.5,
first in the absence of omeprazole (0–60 min, control) andthen in the presence of omeprazole at 10 μM (60–100 min),50 μM (100–140 min), or 200 μM (140–180 min) concentra-tions. In a separate set of animals, the pH of the perfusateexiting the segment was evaluated using VWR SympHonypH Meter, model SB70P (VWR International, Mississauga,Ontario). For all pH buffers (4.5–8.5) used in sequence, in theabsence or presence of 200 μMomeprazole, the pHmeasuredin the perfusate exiting each segment was within 0.3 log unitsof the pH value of the corresponding inflow buffer, suggestingthat the desired pH within each segment was maintainedthroughout the perfusion period (data not shown). Allcollected perfusate samples were weighed in order todetermine the change in weight between perfusion buff-er entering and exiting each segment. Atazanavir andD-mannitol concentrations in perfusate were measuredby 3H and 14C radioactivity counting, respectively. The-se concentrations were corrected for water reabsorptionby gravitational method (using the ratio of inflow/outflow weight). The corrected outlet concentrations ofatazanavir and D-mannitol were then used to determinethe effective permeability coefficients (Peff) in each intes-tinal segment at steady state according to Eq. 4.
Data Analysis
For in vitro studies evaluating concentration-dependent effectof omeprazole or cimetidine on atazanavir accumulation, theIC50 concentrations corresponding to half-maximum inhibi-tory effect were determined by fitting the data to a sigmoidaldose–response equation (Eq. 1) (21):
Vi ¼ Vc
1þ I½ �=IC50ð Þn ð1Þ
where Vc and Vi represent atazanavir uptake rate in theabsence (control) or presence of inhibitor, respectively; [I] isthe inhibitor concentration; and n is the Hill coefficient (thelargest absolute value for the slope of the curve). Data fittinginto the sigmoidal equation was performed by nonlinear least-squares analysis using GraphPad Prism® version 5.01software.
To determine atazanavir permeability across the Caco-2cell monolayers grown on Transwell membrane inserts, thedata for time-dependent atazanavir flux in the apical-to-basolateral or basolateral-to-apical direction was fitted intoEq. 2 (20):
Papp ¼ ΔQΔt
� 1A � Co
ð2Þ
pH-Dependence of Atazanavir Intestinal Permeability
where Papp is the apparent permeability coefficient (cm/s);ΔQ/Δt is the rate of solute flux (mol/s) from donor into thereceiver compartment at steady state; A is the surface area ofthe filter insert (cm2) and Co is the initial solute concentration(mol/cm3) in the donor compartment.
To evaluate the role of active transport in atazanavirdirectional permeability, the efflux ratio, defined as the quo-tient of the secretory permeability and the absorptive perme-ability, was determined according to Eq. 3 (20):
ER ¼Papp B−Að ÞPapp A−Bð Þ
ð3Þ
where ER is the efflux ratio; Papp (B−A) is the apparent perme-ability coefficient determined across Caco-2 cell monolayersin the basolateral-to-apical direction; Papp (A−B) is the apparentpermeability coefficient determined across Caco-2 mono-layers in the apical-to-basolateral direction.
When evaluating atazanavir and D-mannitol intestinalpermeability by in situ single-pass perfusion of rat intestine,atazanavir and D-mannitol concentrations in the perfusateexiting each segment were corrected for water reabsorptionaccording to the gravitational method, i.e., determining thechange in weight between perfusion buffer entering andexiting each segment and adjusting solute concentrationsmeasured in the perfusate accordingly. The corrected outflowconcentrations of atazanavir and D-mannitol were then usedto determine the effective permeability coefficients in eachintestinal segment at steady state (Peff) according to Eq. 4 (22):
P eff ¼ −Q � ln Cout=Cinð Þ2πRL
ð4Þ
where Peff is the effective steady-state permeability coefficient(cm/s); Q is the flow rate (0.2 ml/min, converted to cm3/s);Cout/Cin is the ratio of the outlet atazanavir or D-mannitolconcentration (corrected for water reabsorption) and the cor-responding inlet atazanavir or D-mannitol concentration(10 μM); R is the radius of the intestinal segment (0.18 cm);and L is the length of the intestinal segment measured aftercompletion of perfusion (approximately 6–8 cm).
Statistical Analysis
Each in vitro (Caco-2 cell) experiment was repeated at leastthree times using cells from different passages. In an individualexperiment, each point represents triplicate trials. All the in situexperiments were performed in 4–6 animals and all steady-state permeability coefficients were calculated based on atleast 3 separate concentration measurements for the corre-sponding perfusion interval. Results are presented as mean ±
S.E.M. Statistical analysis was performed using GraphPadPrism®, version 5.01 for Microsoft Windows, Graph PadSoftware (San Diego, CA, U.S.A.). Statistical significancewas assessed by applying the two-tailed Student’s t-test forunpaired or paired experimental values, or the one-way anal-ysis of variance (ANOVA), the repeated-measures ANOVA,as appropriate. A p value <0.05 was considered statisticallysignificant.
RESULTS
Effect of pH on Atazanavir Accumulation by Caco-2Cells
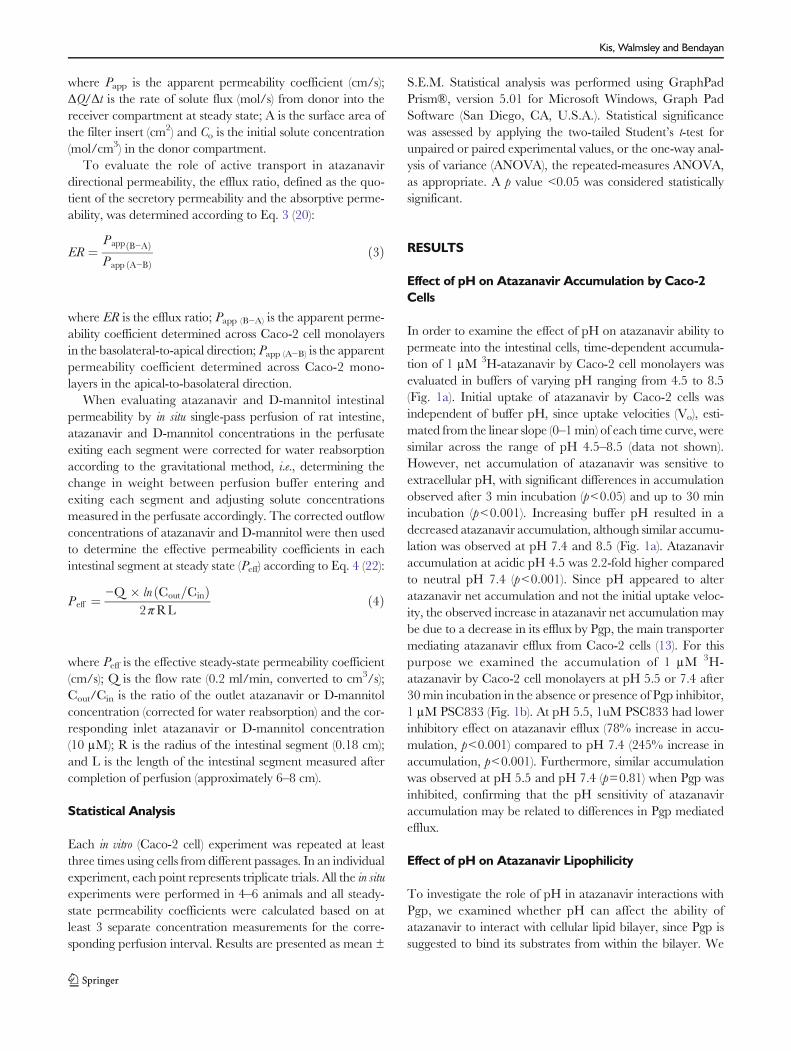
In order to examine the effect of pH on atazanavir ability topermeate into the intestinal cells, time-dependent accumula-tion of 1 μM 3H-atazanavir by Caco-2 cell monolayers wasevaluated in buffers of varying pH ranging from 4.5 to 8.5(Fig. 1a). Initial uptake of atazanavir by Caco-2 cells wasindependent of buffer pH, since uptake velocities (Vo), esti-mated from the linear slope (0–1min) of each time curve, weresimilar across the range of pH 4.5–8.5 (data not shown).However, net accumulation of atazanavir was sensitive toextracellular pH, with significant differences in accumulationobserved after 3 min incubation (p<0.05) and up to 30 minincubation (p<0.001). Increasing buffer pH resulted in adecreased atazanavir accumulation, although similar accumu-lation was observed at pH 7.4 and 8.5 (Fig. 1a). Atazanaviraccumulation at acidic pH 4.5 was 2.2-fold higher comparedto neutral pH 7.4 (p<0.001). Since pH appeared to alteratazanavir net accumulation and not the initial uptake veloc-ity, the observed increase in atazanavir net accumulation maybe due to a decrease in its efflux by Pgp, the main transportermediating atazanavir efflux from Caco-2 cells (13). For thispurpose we examined the accumulation of 1 μM 3H-atazanavir by Caco-2 cell monolayers at pH 5.5 or 7.4 after30min incubation in the absence or presence of Pgp inhibitor,1 μM PSC833 (Fig. 1b). At pH 5.5, 1uM PSC833 had lowerinhibitory effect on atazanavir efflux (78% increase in accu-mulation, p<0.001) compared to pH 7.4 (245% increase inaccumulation, p<0.001). Furthermore, similar accumulationwas observed at pH 5.5 and pH 7.4 (p=0.81) when Pgp wasinhibited, confirming that the pH sensitivity of atazanaviraccumulation may be related to differences in Pgp mediatedefflux.
Effect of pH on Atazanavir Lipophilicity
To investigate the role of pH in atazanavir interactions withPgp, we examined whether pH can affect the ability ofatazanavir to interact with cellular lipid bilayer, since Pgp issuggested to bind its substrates from within the bilayer. We
Kis, Walmsley and Bendayan
proposed that the extent to which atazanavir partitions intothe lipid bilayer might in turn influence the amount ofatazanavir available for efflux by Pgp, thereby affecting itsability to accumulate within the cell. To determine the lipidphase partitioning of atazanavir from aqueous solution,atazanavir was dissolved in aqueous solution of varied pH(1–8.5) and its partitioning into organic solvent was deter-mined using 1-octanol, which allows hydrogen bonding(Fig. 2a), or cyclohexane, which does not permit hydrogenbonding (Fig. 2b). Atazanavir partitioned poorly into cyclo-hexane across a range of pH (negative log D values), with only2–3% of total atazanavir entering from aqueous solvent intothe organic layer at pH 3 or below. With increase in pH,higher fraction of atazanavir was able to enter into cyclohex-ane layer, gradually increasing to 16% at pH 7.4. The stron-gest change was observed between pH 4 and 5, near the pKaof atazanavir basic group (4.4), suggesting that atazanavirprotonation state and change in charge (from positive toneutral) can strongly influence its ability to partition intocyclohexane. As the pH of the aqueous buffer was decreasedfrom 8.5 to 1, the apparent log D values of atazanavir deter-mined in the cyclohexane:buffer mixture decreased from−0.75 to −1 (Fig. 2a). In contrast, when 1-octanol was usedas the organic solvent, atazanavir partitioned very well fromthe aqueous solution into 1-octanol with more than 96% oftotal atazanavir entering the organic layer at pH 3 or above.The apparent log D values of atazanavir determined in the 1-octanol:water mixture decreased from 1.78 to 0.65 whenbuffer pH was decreased from 8.5 to 1 (Fig. 2b).
Effect of pH on Atazanavir Caco-2 Cell MonolayerPermeability
To further assess whether pH affects atazanavir permeabilityacross intestinal epithelium, we examined atazanavirtransepithelial flux across Caco-2 cell monolayers grown onpolycarbonate Transwell membrane inserts while varying thepH of the luminal (apical compartment) buffer and keepingbasolateral buffer pH at 7.4. Atazanavir absorptive perme-ability, estimated by the apical-to-basolateral Papp coefficients(Fig. 3a), was sensitive to changes in luminal pH (p<0.01).When pH was gradually increased from acidic (pH 4.5) toneutral (pH 7.4), atazanavir apical-to-basolateral Papp gradu-ally decreased from 2.5±0.3×10⁻⁶ cm/s to 1.4±0.1×10⁻⁶
cm/s (p<0.05). To evaluate the effect of luminal pH onatazanavir secretory permeability (Papp (B−A)), 1 μM 3H-atazanavir was introduced into the basolateral compartmentbuffered at pH 7.4 and its appearance in the apical compart-ment containing buffers of pH 4.5 to 8.5 was measured overtime (Fig. 3b). In contrast to absorptive permeability,atazanavir basolateral-to-apical Papp was not sensitive tochanges in pH of the luminal buffer. Increase in pH wasassociated with a proportional increase (R2=0.95, p<0.01)
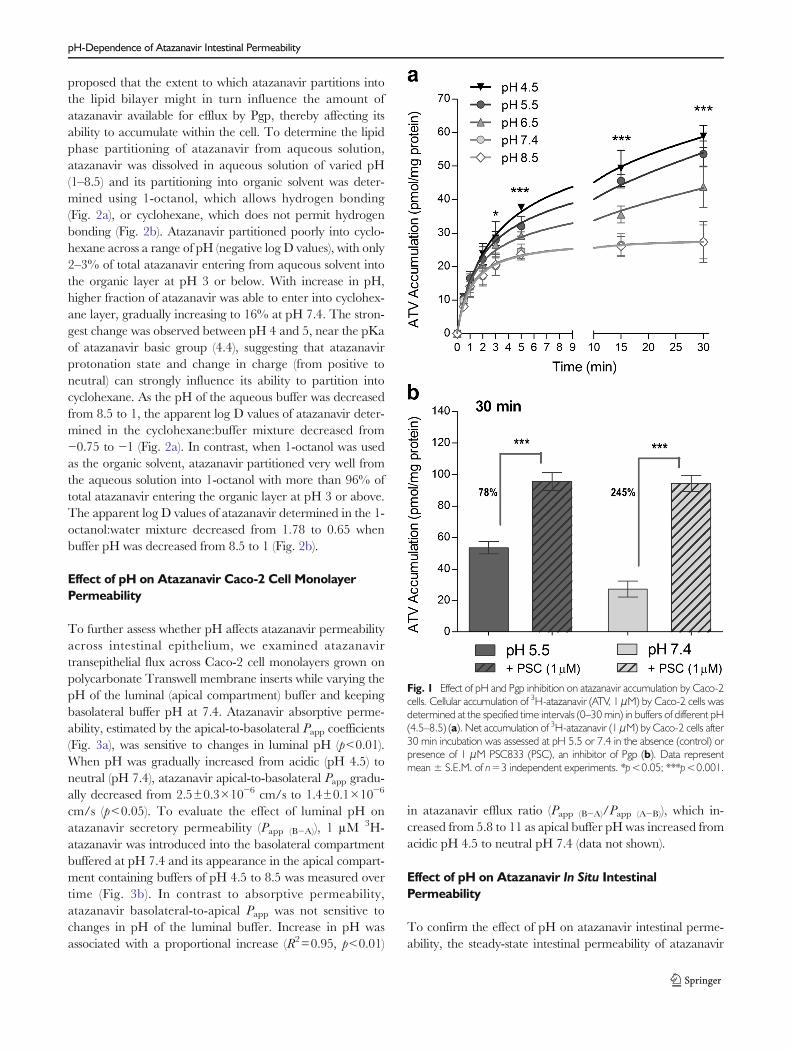
in atazanavir efflux ratio (Papp (B−A)/Papp (A−B)), which in-creased from 5.8 to 11 as apical buffer pH was increased fromacidic pH 4.5 to neutral pH 7.4 (data not shown).
Effect of pH on Atazanavir In Situ IntestinalPermeability
To confirm the effect of pH on atazanavir intestinal perme-ability, the steady-state intestinal permeability of atazanavir
Fig. 1 Effect of pH and Pgp inhibition on atazanavir accumulation by Caco-2cells. Cellular accumulation of 3H-atazanavir (ATV, 1 μM) by Caco-2 cells wasdetermined at the specified time intervals (0–30 min) in buffers of different pH(4.5–8.5) (a). Net accumulation of 3H-atazanavir (1 μM) by Caco-2 cells after30 min incubation was assessed at pH 5.5 or 7.4 in the absence (control) orpresence of 1 μM PSC833 (PSC), an inhibitor of Pgp (b). Data representmean ± S.E.M. of n=3 independent experiments. *p<0.05; ***p<0.001.
pH-Dependence of Atazanavir Intestinal Permeability
(Peff) was evaluated at various luminal pH values by in situsingle-pass perfusion of rat intestinal segments (Fig. 4). Jeju-num and ileum segments in each animal were perfused at0.2 ml/min flow rate with 10 μM 3H-atazanavir solution atvarying buffer pH (4.5–8.5) over a 3.5-h period. To avoidtime-dependent bias, three animals were perfused initiallywith pH 4.5 buffer, followed by pH 5.5, 6.5, 7.4, and finally8.5 buffer (solid circles, Rat 1, 3, 5). The second set of animalswas perfused initially with pH 8.5 buffer followed by pH 7.4,6.5, 5.5 and finally 4.5 buffer (open circles, Rat 2, 4, 6).Atazanavir concentrations in the perfusate exiting from eachsegment, corrected for water reabsorption, were used to de-termine the steady-state Peff of atazanavir at different bufferpH (Fig. 4). Atazanavir steady-state permeability was highlysensitive to changes in intestinal lumen pH. Combined datafrom six animals demonstrated that a gradual increase inluminal pH from acidic (pH 4.5) to basic pH 8.5 is associatedwith a gradual decrease in steady-state Peff measured acrossrat jejunum (2.7-fold, p<0.001) and ileum (2.3-fold, p<0.001).Furthermore, this effect was independent of the experimentaldesign, i.e., increasing pH from 4.5 to 8.5 versus decreasing pHfrom 8.5 to 4.5, or the intestinal segment examined, withsimilar effect observed in jejunum and ileum.
Effect of Acid-Reducing Agents on AtazanavirAccumulation by Caco-2 Cells
In order to identify potential pharmacokinetic interactions ofPPIs and H2RAs with atazanavir transport, which are inde-pendent of their effect on the gastrointestinal pH, all in vitrodrug-drug interaction experiments were performed at con-stant pH and were evaluated at both neutral pH 7.4 andacidic pH 5.5. Because the findings at neutral and acidic pHwere similar, only pH 7.4 data are presented in this manu-script. The concentrations of acid-reducing agents used in the
interaction studies were selected based on the estimated intes-tinal concentrations of these drugs during intestinal absorp-tion. Although plasma concentrations of acid-reducing agentsare in the low micromolar range (10,23), much higher con-centrations are predicted in the intestinal lumen, if oral dose ofthe drug is completely dissolved in 250 ml volume of gastricfluid (12,22). Based on the estimated intestinal concentrationsof omeprazole (116–463 μM for 10–40 mg dose),esomeprazole (107–214 μM for 20–40 mg dose), lansoprazole(162–325 μM for 15–30 mg dose), pantoprazole (197–395 μM for 20–40 mg dose), and rabeprazole (210 μM for20 mg dose), 200 μM concentrations of these PPIs were usedin the initial screening. For H2RAs, the concentrations esti-mated in the intestinal fluid varied between different agents:concentrations of famotidine (237–474 μM for 20–40 mgdose) were lower than other drugs in this class (cimetidine,ranitidine, and nizatidine were estimated to reach>1 M con-centrations in the intestinal fluid). Hence, 500 μM concentra-tions of H2RAs were used in the initial screening (Table I). Netaccumulation of 1 μM 3H-atazanavir by Caco-2 cells, after60 min incubation in the absence (control) or presence of eachdrug, was increased in the presence of PPIs, omeprazole(36%, p<0.01), esomeprazole (31%, p<0.01), rabeprazole(38%, p<0.001), and lansoprazole (14%, p<0.05), but notpantoprazole. In contrast, H2RAs, cimetidine, nizatidine,famotidine, and ranitidine, did not interfere with atazanaviraccumulation by Caco-2 cells.
Omeprazole and Cimetidine Interactionswith Atazanavir In Vitro Transport and Permeability
For a detailed investigation of potential pharmacokineticdrug-drug interactions between atazanavir and acid-reducing agents, one drug from each mechanistic class, omep-razole (PPI) and cimetidine (H2RA), was selected for further
Fig. 2 Effect of pH on atazanavirlipophilicity. Aqueous solutions ofdifferent pH (1–8.5) containing10 μM 3H-atazanavir (ATV) werecombined in 1:1 ratio with organicsolvent, cyclohexane (a) or 1-octanol (b). The apparent log Dcoefficients, determined as log(Corganic/Caqueous), were calculatedin each solvent and plotted as afunction of pH of the solution. Datarepresent mean ± S.E.M. of n=3independent experiments.
Kis, Walmsley and Bendayan
in vitro studies in Caco-2 cells (Fig. 5). In the presence of200 μM omeprazole, initial rate of atazanavir uptake byCaco-2 cells was increased 1.9-fold (p<0.01) compared tothe DMSO control, but was unchanged in the presence of500 μM cimetidine (Fig. 5a). The concentration-dependenteffect of omeprazole and cimetidine on atazanavir accumula-tion by Caco-2 cells was measured after 60 min incubation inthe absence (control) or presence of increasing concentrations(0.01 – 500 μM) of omeprazole (diamonds) or cimetidine(triangles) (Fig. 5b). Cimetidine did not affect atazanavir ac-cumulation at the range of concentrations tested. In contrast,
omeprazole demonstrated a concentration-dependent inhibi-tory effect on atazanavir efflux, increasing its accumulation atconcentrations above 1 μM, with IC50 value of 62 μM. Sinceatazanavir efflux in Caco-2 cells is primarily mediated by Pgp(13), the effect of omeprazole on atazanavir accumulation wasexamined in the absence or presence of a potent Pgp inhibitor,PSC833 (Fig. 5c). Inhibitory effect of 200 μM omeprazole onatazanavir efflux was less potent compared to 1 μM PSC833(1.4-fold versus 3.1-fold increase in accumulation, respectively).Moreover, when used in combination, omeprazole (200 μM)and PSC833 (1 μM) increased atazanavir accumulation 2.5fold, a significantly lower inhibitory effect compared to 1 μMPSC833 alone (p<0.05), suggesting that omeprazole may alsoinhibit atazanavir uptake by Caco-2 cells. When Pgp-mediated efflux was blocked by PSC833, omeprazoleinhibited cellular uptake of atazanavir (i.e., decreasedatazanavir accumulation) in a concentration-dependent man-ner with IC50 concentration of 170 μM (Fig. 5d). To examinethe effect of omeprazole and cimetidine on atazanavir perme-ability across Caco-2 cell monolayers grown on Transwellmembrane inserts, 200 μMomeprazole or 500 μMcimetidinewas added to the apical and basolateral compartment buffersduring 20-min preincubation period and 60-min atazanavirpermeability assay (Fig. 5e). When compared to DMSO con-trol, presence of 200 μM omeprazole resulted in 3.6-foldincrease in atazanavir apical-to-basolateral Papp (p<0.01)and 45% decrease in its basolateral-to-apical Papp (p<0.01),leading to reduction in atazanavir efflux ratio from 11 to 1.6,consistent with the inhibition of Pgp-mediated efflux at theapical membrane of Caco-2 cells. In contrast, cimetidine didnot alter atazanavir permeability in the apical-to-basolateralor basolateral-to-apical direction.
Effect of Omeprazole on Atazanavir In Situ IntestinalPermeability
In situ single-pass intestinal perfusion model was used to fur-ther evaluate the effect of PPI, omeprazole, on the steady-stateintestinal permeability of atazanavir in the Sprague–Dawleyrat model. Proximal jejunum (Fig. 6a) and distal ileum(Fig. 6b) segments in each animal were perfused with10 μM3H-atazanavir buffer (at pH 6.5) in the absence (con-trol; 0–60 min interval) or presence of omeprazole at 10 μM(60–100 min), 50 μM (100–140 min), or 200 μM (140–180 min) concentrations. Atazanavir concentrations in theperfusate exiting each segment, corrected for water reabsorp-tion, were used to determine atazanavir steady-state Peff coef-ficient for each perfusion period (control, 10 μM, 50 μM, or200 μMomeprazole). Repeated-measures analysis of variancedemonstrated a lack of significant effect of omeprazole onatazanavir steady-state permeability. Furthermore, paired stu-dent t test comparing Peff values obtained for control versus10 μM, 50 μM, or 200 μM omeprazole separately did not
Fig. 3 pH- Dependence of atazanavir in vitro intestinal permeability.Atazanavir (ATV) absorptive (Papp (A−B)) (a) and secretory (Papp (B−A)) (b)permeability coefficients were determined across Caco-2 cell monolayersgrown on Transwell membrane inserts at different apical buffer pH (4.5–8.5), while basolateral buffer pH was maintained at 7.4, as described inMaterials and Methods. Data represent mean ± S.E.M. of n=3 independentexperiments. NS: not significant; **p<0.01.
pH-Dependence of Atazanavir Intestinal Permeability
reach statist ical signif icance for any omeprazoleconcentration.
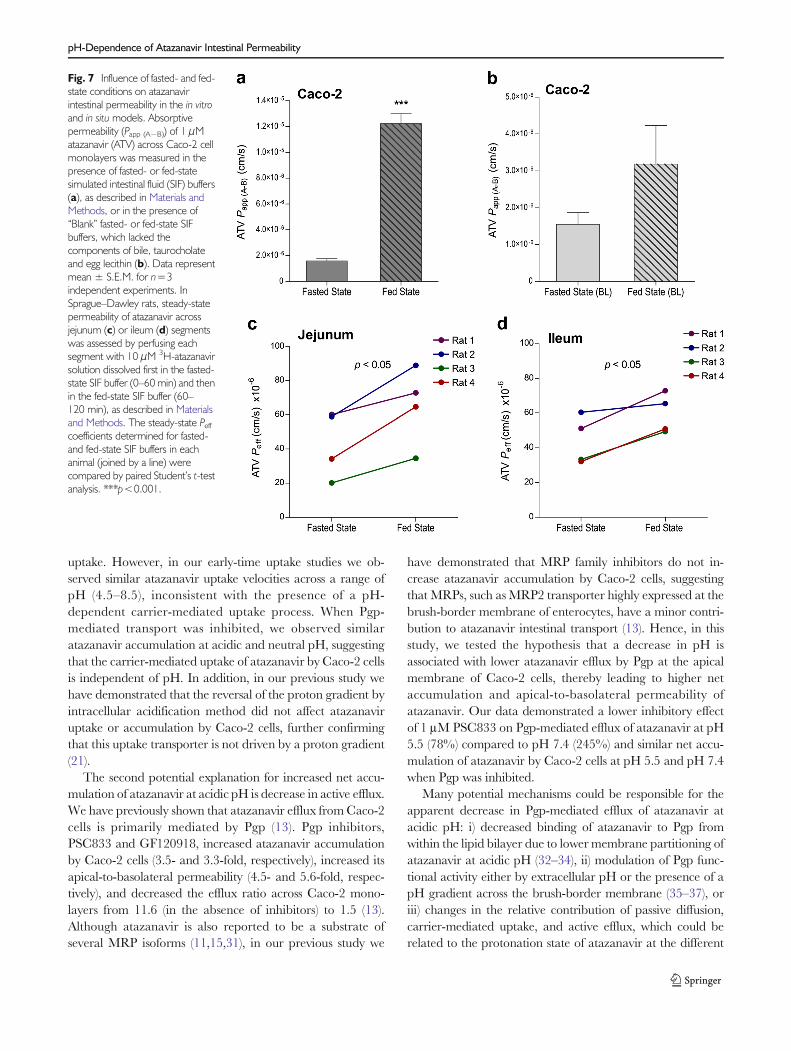
Effect of Fasted and Fed State on Atazanavir IntestinalPermeability
Food intake is known to trigger the release of gastric acid,which lowers gastric pH, consequently leading to a decrease inintestinal lumen pH from 6.5 in fed state to 5.0 in fasted state.In addition, food intake is associated with the release of bilesalts (e.g., taurocholate) and phospholipids (e.g., lecithin) in theintestinal tract, which can facilitate drug dissolution and im-prove solubility. Since atazanavir bioavailability is reported tobe influenced by food intake, we proposed that the change inintestinal pH and/or increase in the secretion of bile under
fed-state conditions can increase atazanavir intestinal perme-ability. In agreement with this hypothesis, fed-state buffer (pH5.0, 15 mM taurocholate, 3.75 mM lecithin) dramaticallyincreased atazanavir absorptive permeability across Caco-2cell monolayers compared to the fasted-state buffer (pH 6.5,five-fold lower concentrations of taurocholate and lecithin)(Fig. 7a). This effect was much higher than the expectedchange due to a decrease in pH from 6.5 to 5.0. To furthertest whether this effect is mediated in part by the increase inconcentrations of bile components (i.e., taurocholate and lec-ithin), “blank” fed- and fasted-state buffers (lackingtaurocholate and lecithin) were also tested (Fig. 7b). In theabsence of taurocholate and lecithin, the fed-state buffer onlymoderately increased atazanavir apical-to-basolateral perme-ability (approximately 2-fold increase, not significant) com-pared to the fasted-state buffer. Hence, the enhancement inatazanavir in vitro permeability under fed-state conditions ap-pears to be largely mediated by the increase in the concentra-tions of bile components. In situ intestinal permeability ofatazanavir across rat jejunum (Fig. 7c) and ileum (Fig. 7d)was also significantly higher in fed-state buffer when com-pared to fasted-state buffer, confirming that fed-state condi-tions stimulate intestinal permeability of atazanavir.
DISCUSSION
The goal of this study was to investigate several mechanismspotentially implicated in atazanavir intestinal absorption andclinical drug-drug interactions with acid-reducing agents.Atazanavir is reported to have pH-dependent aqueous solu-bility (2) and clinically significant drug-drug interactions withmany acid-reducing agents and especially PPIs, which irre-versibly block the secretion of gastric acid (24). In this study,we investigated the effect of pH on atazanavir intestinal
Fig. 4 Effect of pH on atazanavir in situ permeability. Atazanavir (ATV) permeability across proximal jejunum (a) and distal ileum (b) segments was measured inSprague–Dawley rats. Each segment was perfused at a constant flow rate of 0.2 ml/min with perfusion buffer containing 3H-atazanavir (10 μM) and 14C-D-mannitol (10 μM), used as a marker of paracellular permeability. The pH of the perfusion buffer was changed every 40 min, gradually increasing from pH 4.5 to8.5 (solid circles) or decreasing from pH 8.5 to pH 4.5 (open circles). Atazanavir steady-state permeability (Peff) coefficients were determined at each pH (4.5–8.5)and compared within each animal by repeated-measures ANOVA.
Table I Effect of Acid-Reducing Agents (PPIs and H2RAs) on AtazanavirAccumulation by Caco-2 Cell Monolayers
Inhibitordrug
Inhibitor drugconcentration
Atazanavir accumulation(% Control)
Control 100±4.4
Proton Pump Inhibitors (PPIs)
Omeprazole 200 μM 136±10**
Esomeprazole 200 μM 131±9**
Rabeprazole 200 μM 138±4***
Pantoprazole 200 μM 99±4
Lansoprazole 200 μM 114±7*
Histamine2-Receptor Antagonists (H2RAs)
Cimetidine 500 μM 94±6
Famotidine 500 μM 93±11
Ranitidine 500 μM 92±4
Nizatidine 500 μM 98±9
*p<0.05, **p<0.01, ***p<0.001
Kis, Walmsley and Bendayan
permeability using Caco-2 cell system, an in vitro model ofintestinal permeability, and in situ single-pass intestinalperfusion.
Atazanavir is a bulky organic base, which can be classifiedinto the BCS class 2 due to its low solubility and high perme-ability, estimated from the high predicted log P values of 4.08–4.54, which is above the log P of metoprolol (1.67) (2,12).
Based on this classification, atazanavir is predicted to havehigh absorption (≥ 90%) (12). However, in this study we reportexperimental partition coefficients for atazanavir in 1-octanol:buffer mixture that are much lower (log D of 1.43–1.57 for pH 3–7.4) than the predicted log P values (4.08–4.54),which are also in agreement with previously reported exper-imental partition coefficient for atazanavir in 1-octanol:saline
Fig. 5 Interactions of omeprazoleand cimetidine with atazanavirtransport and permeability in Caco-2 cells. Effect of omeprazole (OME,200 μM) and cimetidine (CIM,500 μM) on the initial rate ofatazanavir (ATV, 1 μM) uptake byCaco-2 cells was determined at pH7.4 from the slope of the linearportion (0–1 min) of the time-dependent uptake curve (a). Netintracellular accumulation of 1 μM3H-atazanavir by Caco-2 cells after30 min incubation was assessed inthe absence or presence ofincreasing concentrations ofomeprazole (0.01–500 μM) orcimetidine (0.01–500 μM) (b). Theeffect of omeprazole was alsoevaluated in the presence of 1 μMPSC833 (PSC), an inhibitor of Pgp,either at constant omeprazoleconcentration of 200 μM (c) orincreasing omeprazoleconcentrations (0.01–500 μM) (d).Absorptive (Papp (A−B)) or secretory(Papp (B−A)) permeability ofatazanavir was measured in theabsence or presence of omeprazole(OME, 200 μM) or cimetidine(CIM, 500 μM) (e). Data representmean ± S.E.M. of n=3independent experiments.*p<0.05; **p<0.01;***p<0.001; #p<0.05;##p<0.01.
pH-Dependence of Atazanavir Intestinal Permeability
mixture (log P of 1.48) (11). Hence, atazanavir may belong tothe BCS class 4, which includes drugs with low solubility andlow permeability that are predicted to have incomplete absorp-tion (12). Previous studies correlating the permeability of drugsacross Caco-2 monolayers with their extent of oral absorptionin humans have defined the low/high drug permeabilityboundary to be between 5.0×10⁻⁶ and 14.0×10⁻⁶ cm/s, sincemodel compounds with known low permeability (fractionabsorbed<90%) had Papp<5.0×10⁻⁶ cm/s, while high-permeability compounds (fraction absorbed ≥90%) had P-appcm/s (25,26). Hence, based on our in vitro Caco-2 perme-ability data, atazanavir can be classified as a low-permeabilitycompound. Similarly, human extent of absorption has been
previously correlated with the in situ Peff values determinedacross rat jejunum at pH 6.5 (26–28). Low permeability modelcompounds had Peff<42×10
−6 cm/s, while high-permeabilitycompounds had Peff>50.9×10
−6 cm/s (27). In this study,atazanavir permeability across rat jejunum at pH 6.5 was equalto 47±11×10−6 cm/s, which falls within the borderline region,highlighting the difficulty in classifying atazanavir as low or highpermeability drug. At neutral pH, the Peff decreases to 37±12×10−6 cm/s and falls in the low permeability range. Giventhe high variability and pH dependence of the in situatazanavir permeability, as well as the low permeabilityof atazanavir observed in vitro across Caco-2 mono-layers, we believe that atazanavir may behave as a lowpermeability/low solubility compound and hence,should belong to the BCS class 4. Interestingly, intesti-nal absorption of class 4 drugs is predicted to be influ-enced by drug uptake and efflux processes (29).
Atazanavir was traditionally believed to enter the cell bysimple diffusion. Since its predicted pKa of 4.4 falls in the rangeof physiological pH observed in the gastrointestinal tract, itsabsorption can be affected by the equilibrium between theionized and unionized forms. At acidic pH, atazanavir basicgroup gains a proton and forms a charged species (organiccation), resulting in improved aqueous solubility (2). However,formation of a charged species may have a negative impact onatazanavir interactions with the lipid bilayer, potentially reduc-ing its membrane permeability during intestinal absorption.Contrary to this prediction, atazanavir accumulation byCaco-2 cells and apical-to-basolateral permeability were in-creased at acidic pH, when its diffusion across the cell mem-brane is predicted to be lower. Even after 30 min incubation,when the net accumulation at all pH values reached a steadystate, the total amount of atazanavir able to accumulate withinthe cell was significantly higher under acidic conditions, sug-gesting potential involvement of a pH-dependent carrier-mediated transport process. Since Caco-2 cells express a varietyof drug uptake and efflux transporters and have a negligibleexpression of CYP3A4 (30), higher steady-state accumulationof atazanavir at acidic pHmay be related to increase in uptake,decrease in efflux, or a combination of these mechanisms.Furthermore, the relative contribution of passive diffusion,carrier-mediated uptake, and active efflux could be affectedby the pH of the intestinal lumen.
Our group and others have previously demonstrated thatatazanavir cellular uptake is in part carrier-mediated andsensitive to inhibition by several OATP family inhibitors(11,13). Hence, higher accumulation of atazanavir at acidicpH may result from increased uptake by this OATP-liketransporter. If this uptake carrier preferentially transportsthe protonated (charged) form of atazanavir abundant atacidic pH, has higher transport activity at acidic pH, or usesan inwardly-directed proton gradient as a driving force, de-crease in pH would lead to an increase in atazanavir cellular
Fig. 6 Effect of omeprazole on atazanavir in situ intestinal permeability. In situintestinal permeability (Peff) of atazanavir (ATV) across proximal jejunum (6–8 cm in length, starting 2 cm after the ligament of Treitz) (a) and distal ileum(6–8 cm in length, ending 1 cm before the cecum) (b) of Sprague–Dawleyrats was measured by single-pass intestinal perfusion method in the absenceor presence of omeprazole (OME). Each segment was perfused at a constantflow rate of 0.2 ml/min with pH 6.5 perfusion buffer containing 3H-atazanavir(10 μM) and 14C-D-mannitol (10 μM), first in the absence of omeprazole(control, 0–60 min) and then in the presence of omeprazole at 10 μM (60–100 min), 50 μM (100–140 min), or 200 μM (140–180 min) concentrations.The steady-state Peff coefficients were determined in each animal during thefour intervals (joined by a line) and compared by repeated measures ANOVA.
Kis, Walmsley and Bendayan
uptake. However, in our early-time uptake studies we ob-served similar atazanavir uptake velocities across a range ofpH (4.5–8.5), inconsistent with the presence of a pH-dependent carrier-mediated uptake process. When Pgp-mediated transport was inhibited, we observed similaratazanavir accumulation at acidic and neutral pH, suggestingthat the carrier-mediated uptake of atazanavir by Caco-2 cellsis independent of pH. In addition, in our previous study wehave demonstrated that the reversal of the proton gradient byintracellular acidification method did not affect atazanaviruptake or accumulation by Caco-2 cells, further confirmingthat this uptake transporter is not driven by a proton gradient(21).
The second potential explanation for increased net accu-mulation of atazanavir at acidic pH is decrease in active efflux.We have previously shown that atazanavir efflux fromCaco-2cells is primarily mediated by Pgp (13). Pgp inhibitors,PSC833 and GF120918, increased atazanavir accumulationby Caco-2 cells (3.5- and 3.3-fold, respectively), increased itsapical-to-basolateral permeability (4.5- and 5.6-fold, respec-tively), and decreased the efflux ratio across Caco-2 mono-layers from 11.6 (in the absence of inhibitors) to 1.5 (13).Although atazanavir is also reported to be a substrate ofseveral MRP isoforms (11,15,31), in our previous study we
have demonstrated that MRP family inhibitors do not in-crease atazanavir accumulation by Caco-2 cells, suggestingthat MRPs, such as MRP2 transporter highly expressed at thebrush-border membrane of enterocytes, have a minor contri-bution to atazanavir intestinal transport (13). Hence, in thisstudy, we tested the hypothesis that a decrease in pH isassociated with lower atazanavir efflux by Pgp at the apicalmembrane of Caco-2 cells, thereby leading to higher netaccumulation and apical-to-basolateral permeability ofatazanavir. Our data demonstrated a lower inhibitory effectof 1 μM PSC833 on Pgp-mediated efflux of atazanavir at pH5.5 (78%) compared to pH 7.4 (245%) and similar net accu-mulation of atazanavir by Caco-2 cells at pH 5.5 and pH 7.4when Pgp was inhibited.
Many potential mechanisms could be responsible for theapparent decrease in Pgp-mediated efflux of atazanavir atacidic pH: i) decreased binding of atazanavir to Pgp fromwithin the lipid bilayer due to lower membrane partitioning ofatazanavir at acidic pH (32–34), ii) modulation of Pgp func-tional activity either by extracellular pH or the presence of apH gradient across the brush-border membrane (35–37), oriii) changes in the relative contribution of passive diffusion,carrier-mediated uptake, and active efflux, which could berelated to the protonation state of atazanavir at the different
Fig. 7 Influence of fasted- and fed-state conditions on atazanavirintestinal permeability in the in vitroand in situ models. Absorptivepermeability (Papp (A−B)) of 1 μMatazanavir (ATV) across Caco-2 cellmonolayers was measured in thepresence of fasted- or fed-statesimulated intestinal fluid (SIF) buffers(a), as described in Materials andMethods, or in the presence of“Blank” fasted- or fed-state SIFbuffers, which lacked thecomponents of bile, taurocholateand egg lecithin (b). Data representmean ± S.E.M. for n=3independent experiments. InSprague–Dawley rats, steady-statepermeability of atazanavir acrossjejunum (c) or ileum (d) segmentswas assessed by perfusing eachsegment with 10 μM 3H-atazanavirsolution dissolved first in the fasted-state SIF buffer (0–60 min) and thenin the fed-state SIF buffer (60–120 min), as described in Materialsand Methods. The steady-state Peffcoefficients determined for fasted-and fed-state SIF buffers in eachanimal (joined by a line) werecompared by paired Student’s t-testanalysis. ***p<0.001.
pH-Dependence of Atazanavir Intestinal Permeability
pH conditions. In this study, we have demonstrated thatatazanavir partitioned favourably into 1-octanol (> 96%)across a range of pH (3–8.5) with log D values similar to theoctanol:saline partition coefficient (log P of 1.48) reportedpreviously (11). However, atazanavir interactions with a morelipophilic solvent were not favourable and were strongly in-fluenced by changes in pH. Only 2–3% of total atazanavirpartitioned into cyclohexane at pH 3 or lower, whenatazanavir was primarily positively charged, compared to16% partitioning at pH 7.4, when atazanavir was primarilyunionized (neutral). Atazanavir partitioning into the lipidbilayer (also lipophilic) may be similarly reduced at acidicpH. Further studies are needed to examine the link betweenthese membrane partitioning properties of atazanavir, its in-testinal membrane permeability, and Pgp-mediated efflux.
In the in situ intestinal perfusion model, atazanavir permeabil-ity was also sensitive to changes in luminal pH. Within eachanimal, gradual alkalinization of the perfusion buffer, whichimitates the increase in pH of intestinal lumen following admin-istration of acid-reducing agents, resulted in lower steady-statepermeability of atazanavir across rat jejunum and ileum. Thesefindings agree with the clinically reported decrease in atazanavirplasma concentrations when co-administered with acid-reducingagents, which pharmacologically increase gastric and conse-quently intestinal pH. Atazanavir Peff coefficients determined injejunum and ileum were similar. Pgp expression has been re-ported to increase from proximal to distal segments of the ratintestine (38,39). While some studies report higher expression ofPgp in the ileum as compared to jejunum (39), others demon-strate similar Mdr1a gene and Pgp protein expression in thesetwo segments (38). In addition, similar efflux ratios for digoxinacross rat jejunum (4.4±1) and ileum (4.2±0.5) were reportedby ex vivo Ussing chamber method (40). Furthermore, in ourprevious study examining the role of drug transporters inatazanavir intestinal permeability, we reported similar effect ofthe Pgp inhibitor, PSC833, on atazanavir in situ permeabilityacross rat jejunum and ileum, i.e., 78% and 79% increase inatazanavir Peff, respectively, determined in 10 animals (13). Col-lectively, these findings suggest that the functional activity of Pgpin rodents may be similar in rat jejunum and ileum.
Clinical drug-drug interactions of atazanavir with acid-reducing agents are likely to be resulting from pharmacolog-ical pH changes induced by these drugs, which increase gastricpH above 3 and are also reported as indirectly increase the pHof the intestinal lumen (10). However, since PPIs and H2RAsare also known to interact with drug transporters, we investi-gated potential interactions between atazanavir and co-administered PPIs and H2RAs in the intestine. In vitro, all PPIsexcept pantoprazole moderately increased atazanavir accu-mulation (14–38%), while no significant interactions wereobserved between atazanavir and H2RAs. The increase inatazanavir accumulation by PPIs, and in particular omepra-zole, was most likely due to Pgp inhibition. Omeprazole was
previously shown to inhibit Pgp-mediated efflux of digoxin, anestablished Pgp substrate, with an IC50 concentration of17.7 μM and 2.6-fold increase in the apical-to-basolateralpermeability of digoxin across Caco-2 cell monolayers(41,42). The effect of omeprazole on atazanavir accumulationwas less profound with an IC50 concentration of 62 μM. Al-though in vitro, omeprazole inhibited atazanavir efflux and, to alesser extent, uptake by Caco-2 cells, in situ permeability ofatazanavir was not significantly altered by omeprazole. Thesediscrepancies between the findings from in situ and in vitromodelscould be potentially explained by the species differences in theexpression and functional activity of drug transporter such as Pgpand OATPs, as well as the increased complexity of the in situmodel, which accounts for drug metabolism andmucosal micro-environment at the brush-border membrane, unlike the Caco-2cell system (27,30). Furthermore, the expression of Pgp is report-ed to be higher in Caco-2 cells compared to human or ratjejunum (43). Thus, Pgp-mediated interactions may beoverestimated in this in vitro model. Given that omeprazole onlymoderately inhibited atazanavir efflux and uptake in Caco-2cells, these pharmacokinetic interactions are expected to play aminor role in vivo, suggesting that the pharmacological effect ofomeprazole on gastrointestinal pH is responsible for the observedclinical drug-drug interactions.
Since atazanavir is reported to have improved oral bioavail-ability under fed-state conditions associated with the release ofgastric acid and secretion of bile, we investigated the effect of“food intake” on atazanavir intestinal permeability using previ-ously established buffers simulating intestinal fluid under fasted-and fed-state conditions (19). Under fed-state conditions,atazanavir absorptive permeability was significantly higherand this effect required the presence of bile components (five-fold higher under fed-state conditions), suggesting thatatazanavir intestinal permeability is dependent not only onthe change in pH but also on the composition of the intestinalfluid. Bile components released after food intake, such as bilesalts (e.g., taurocholate) and phospholipids (e.g., lecithin), areknown to facilitate the wetting of solids and solubilization oflipophilic drugs into mixed micelles (44). However, in this studyatazanavir was fully solubilized in the aqueous buffer at 1 μM(in vitro) or 10 μM (in situ) concentrations, making further en-hancement in atazanavir solubility unlikely. Nonetheless,atazanavir in vitro and in situ permeability was increased in fed-state buffer, in part due to the presence of five-foldhigher concentrations of bile components. Interestingly,some phospholipids are known to act as permeabilityenhancers (45,46). Presence of these molecules in theintestinal lumen has been associated with destabilizationof cell membranes and lipid-induced alterations in in-tracellular events, which can lead to intestinal cell dam-age and alteration of tight junctions between the gas-trointestinal epithelial cells, thereby changing the integ-rity of the intestinal membrane (45). Further studies are
Kis, Walmsley and Bendayan
needed to elucidate the nature of atazanavir interactionswith various bile salts and phospholipids released duringfood intake.
CONCLUSION
Our in vitro and in situ data demonstrate for the first time thatatazanavir intestinal permeability can be influenced by chang-es in intestinal pH and the amount of bile salts and phospho-lipids present during absorption. These findings agree with theclinical studies reporting that atazanavir plasma concentra-tions are highly sensitive to interactions with drugs that mod-ulate gastric pH and food intake, which triggers the release ofgastric acid and the secretion of bile. Considering the com-plexity of atazanavir oral absorption, it is not surprizing thatbioavailability and plasma pharmacokinetics of atazanavirvary greatly between individuals. High variability inatazanavir pharmacokinetics reported clinically could poten-tially be explained by: i) interindividual differences in gastricpH and bile output; ii) high variability in Pgp and CYP3A4expression and activity; and iii) the effect of co-administereddrugs, diet, and disease state on the gastrointestinal pH andCYP3A4 and Pgp expression and activity. In the context ofHIV infection, HIV disease progression and antiretroviraltreatment are associated with many gastrointestinal abnor-malities which have been reported to alter the acidity of thegastrointestinal fluid causing hypohydrochloria (5). Interest-ingly, atazanavir Cmax and AUC are reported to be signifi-cantly lower in HIV-infected patients (2). We believe that thisobservation could be explained by reduced absorption ofatazanavir, due to lower solubility and/or lower intestinalpermeability of atazanavir as a result of increased gastricand intestinal pH. This could provide a potential strategy forimproving atazanavir oral bioavailability by manipulatinggastrointestinal pH. In addition, the expression of Pgp andCYP3A4 may differ in HIV-infected patients compared tohealthy subjects, since many enzymes and drug transportersare reported to be regulated by antiretroviral drugs and otherco-administered medications as well as inflammatory path-ways associated with the HIV infection of the gut-associatedlymphoid tissue (14,47,48). Further studies are necessary tofully elucidate the effect of HIV infection and its treatment ongastric and intestinal pH, the expression of intestinal drugtransporters and metabolic enzymes, and the bioavailabilityof antiretroviral drugs to further optimize current and futureantiretroviral regimens in HIV-infected patients.
ACKNOWLEDGMENTS AND DISCLOSURES
This work is supported by an operating grant from the Cana-dian Foundation for AIDS Research Grant #20023, awarded
to Dr. Reina Bendayan. Drs. Reina Bendayan and SharonWalmsley are recipients of the Ontario HIV Treatment Net-work (OHTN) Career Scientist award. Ms. Olena Kis wassupported by Ph.D. studentships from theOHTN,Ministry ofHealth of Ontario, and the Canadian Institutes of HealthResearch (CIHR) Frederick Banting and Charles Best – Can-ada Graduate Scholarship.
We thank Dr. David E. Smith, Department of Pharmaceu-tical Sciences, University of Michigan College of Pharmacy,for excellent guidance with the implementation of the rodentin situ single-pass perfusion technique and Dr. CarolynCummins, Department of Pharmaceutical Sciences, Univer-sity of Toronto, for helpful advice in the design of in vitro and insitu experiments.
REFERENCES
1. Panel on Antiretroviral Guidelines for Adults and Adolescents.Guidelines for the use of antiretroviral agents in HIV-1 infectedadults and adolescents. Department of Health and HumanServices; 2013 February 12. Available from: http://aidsinfo.nih.gov/ContentFiles/AdultandAdolescentGL.pdf.
4. Busti AJ, Hall RG, Margolis DM. Atazanavir for the treatment ofhuman immunodeficiency virus infection. Pharmacotherapy.2004;24(12):1732–47.
5. Welage LS, Carver PL, Revankar S, Pierson C, Kauffman CA.Alterations in gastric acidity in patients infected with human immu-nodeficiency virus. Clin Infect Dis. 1995;21(6):1431–8.
6. Zhu L, Persson A,Mahnke L, Eley T, Li T, Xu X, et al. Effect of low-dose omeprazole (20 mg daily) on the pharmacokinetics of multiple-dose atazanavir with ritonavir in healthy subjects. J Clin Pharmacol.2011;51(3):368–77.
7. Luber AD, Brower R, Kim D, Silverman R, Peloquin CA, Frank I.Steady-state pharmacokinetics of once-daily fosamprenavir/ritonavirand atazanavir/ritonavir alone and in combination with 20 mgomeprazole in healthy volunteers. HIV Med. 2007;8(7):457–64.
8. Agarwala S, Gray K, Wang Y, Grasela D. Pharmacokinetic effect ofomeprazole on atazanavir coadminstered with ritonavir in healthysubjects. 12th Conference on Retroviruses and OpportunisticInfections. 2005 February 22.
9. Wang X, Boffito M, Zhang J, Chung E, Zhu L,Wu Y, et al. Effects ofthe H2-receptor antagonist famotidine on the pharmacokinetics ofatazanavir-ritonavir with or without tenofovir in HIV-infected pa-tients. AIDS Patient Care STDS. 2011;25(9):509–15.
10. Shin JM, Kim N. Pharmacokinetics and pharmacodynamics of theproton pump inhibitors. J Neurogastroenterol Motil. 2013;19(1):25–35.
11. JannehO, Anwar T, Jungbauer C, Kopp S, Khoo SH, Back DJ, et al.P-glycoprotein, multidrug resistance-associated proteins and humanorganic anion transporting polypeptide influence the intracellularaccumulation of atazanavir. Antivir Ther. 2009;14(7):965–74.
pH-Dependence of Atazanavir Intestinal Permeability
12. Dahan A, Miller JM, Amidon GL. Prediction of solubility andpermeability class membership: provisional BCS classification of theworld’s top oral drugs. AAPS J. 2009;11(4):740–6.
13. Kis O, Zastre JA, Hoque MT, Walmsley SL, Bendayan R. Role ofdrug efflux and uptake transporters in atazanavir intestinal perme-ability and drug-drug interactions. Pharm Res. 2013;30(4):1050–64.
14. Kis O, Robillard K, Chan GN, Bendayan R. The complexities ofantiretroviral drug-drug interactions: role of ABC and SLC trans-porters. Trends Pharmacol Sci. 2010;31(1):22–35.
15. BiermanWF, Scheffer GL, Schoonderwoerd A, Jansen G, van AgtmaelMA, Danner SA, et al. Protease inhibitors atazanavir, lopinavir andritonavir are potent blockers, but poor substrates, of ABC transportersin a broad panel of ABC transporter-overexpressing cell lines. JAntimicrob Chemother. 2010;65(8):1672–80.
16. Li W, Zeng S, Yu LS, Zhou Q. Pharmacokinetic drug interactionprofile of omeprazole with adverse consequences and clinical riskmanagement. Ther Clin Risk Manag. 2013;9:259–71.
17. Ito S, Kusuhara H, Yokochi M, Toyoshima J, Inoue K, Yuasa H,et al. Competitive inhibition of the luminal efflux by multidrug andtoxin extrusions, but not basolateral uptake by organic cation trans-porter 2, is the likely mechanism underlying the pharmacokineticdrug-drug interactions caused by cimetidine in the kidney. JPharmacol Exp Ther. 2012;340(2):393–403.
18. Moss DM, Siccardi M, Murphy M, Piperakis MM, Khoo SH, BackDJ, et al. Divalent metals and pH alter raltegravir disposition in vitro.Antimicrob Agents Chemother. 2012;56(6):3020–6.
19. Klein S. The use of biorelevant dissolution media to forecast thein vivo performance of a drug. AAPS J. 2010;12(3):397–406.
20. Hubatsch I, Ragnarsson EG, Artursson P. Determination of drugpermeability and prediction of drug absorption in Caco-2 mono-layers. Nat Protoc. 2007;2(9):2111–9.
21. Kis O, Zastre JA, Ramaswamy M, Bendayan R. pH dependence oforganic anion-transporting polypeptide 2B1 inCaco-2 cells: potentialrole in antiretroviral drug oral bioavailability and drug-drug interac-tions. J Pharmacol Exp Ther. 2010;334(3):1009–22.
22. Dahan A, Amidon GL. Segmental dependent transport of low per-meability compounds along the small intestine due to P-glycoprotein:the role of efflux transport in the oral absorption of BCS class IIIdrugs. Mol Pharm. 2009;6(1):19–28.
23. Lin JH. Pharmacokinetic and pharmacodynamic properties of hista-mine H2-receptor antagonists. Relationship between intrinsic poten-cy and effective plasma concentrations. Clin Pharmacokinet.1991;20(3):218–36.
24. Fulco PP, Vora UB, Bearman GM. Acid suppressive therapy and theeffects on protease inhibitors. Ann Pharmacother. 2006;40(11):1974–83.
25. Volpe DA, Faustino PJ, Ciavarella AB, Asafu-Adjaye EB, EllisonCD, Yu LX, et al. Classification of drug permeability with a Caco-2cell monolayer assay. Clin Res Regul Aff. 2007;24(1):39–47.
26. Volpe DA. Application of method suitability for drug permeabilityclassification. AAPS J. 2010;12(4):670–8.
27. Zakeri-Milani P, Valizadeh H, Tajerzadeh H, Islambulchilar Z. Theutility of rat jejunal permeability for biopharmaceutics classificationsystem. Drug Dev Ind Pharm. 2009;35(12):1496–502.
28. Kim JS, Mitchell S, Kijek P, Tsume Y, Hilfinger J, Amidon GL. Thesuitability of an in situ perfusion model for permeability determina-tions: utility for BCS class I biowaiver requests. Mol Pharm.2006;3(6):686–94.
29. Benet LZ. Predicting drug disposition via application of aBiopharmaceutics Drug Disposition Classification System. BasicClin Pharmacol Toxicol. 2010;106(3):162–7.
30. Taipalensuu J, Tornblom H, Lindberg G, Einarsson C, Sjoqvist F,Melhus H, et al. Correlation of gene expression of ten drug effluxproteins of the ATP-binding cassette transporter family in normalhuman jejunum and in human intestinal epithelial Caco-2 cell mono-layers. J Pharmacol Exp Ther. 2001;299(1):164–70.
31. Zastre JA, Chan GN, Ronaldson PT, RamaswamyM, Couraud PO,Romero IA, et al. Up-regulation of P-glycoprotein by HIV proteaseinhibitors in a human brain microvessel endothelial cell line. JNeurosci Res. 2009;87(4):1023–36.
32. Simon S, Roy D, Schindler M. Intracellular pH and the control ofmultidrug resistance. Proc Natl Acad Sci U S A. 1994;91(3):1128–32.
33. Aller SG, Yu J, Ward A, Weng Y, Chittaboina S, Zhuo R, et al.Structure of P-glycoprotein reveals a molecular basis for poly-specificdrug binding. Science. 2009;323(5922):1718–22.
34. Clay AT, Sharom FJ. Lipid bilayer properties control membranepartitioning, binding, and transport of p-glycoprotein substrates.Biochemistry. 2013;52(2):343–54.
35. Thews O, Dillenburg W, Fellner M, Buchholz HG, Bausbacher N,Schreckenberger M, et al. Activation of P-glycoprotein (Pgp)-mediat-ed drug efflux by extracellular acidosis: in vivo imaging with 68Ga-labelled PET tracer. Eur J Nucl Med Mol Imaging. 2010;37(10):1935–42.
36. Thews O, Dillenburg W, Rosch F, Fellner M. PET imaging of theimpact of extracellular pH and MAP kinases on the p-glycoprotein(Pgp) activity. Adv Exp Med Biol. 2013;765:279–86.
37. Lotz C, Kelleher DK, Gassner B, Gekle M, Vaupel P, Thews O.Role of the tumor microenvironment in the activity and expression ofthe p-glycoprotein in human colon carcinoma cells. Oncol Rep.2007;17(1):239–44.
38. MacLean C, Moenning U, Reichel A, Fricker G. Closing the gaps: afull scan of the intestinal expression of p-glycoprotein, breastcancer resistance protein, and multidrug resistance-associatedprotein 2 in male and female rats. Drug Metab Dispos.2008;36(7):1249–54.
39. Dahan A, Sabit H, Amidon GL. Multiple efflux pumps are involvedin the transepithelial transport of colchicine: combined effect of p-glycoprotein and multidrug resistance-associated protein 2 leads todecreased intestinal absorption throughout the entire small intestine.Drug Metab Dispos. 2009;37(10):2028–36.
40. Stephens RH, O’Neill CA, Warhurst A, Carlson GL, Rowland M,Warhurst G. Kinetic profiling of P-glycoprotein-mediated drug effluxin rat and human intestinal epithelia. J Pharmacol Exp Ther.2001;296(2):584–91.
41. Pauli-Magnus C, Rekersbrink S, Klotz U, FrommMF. Interaction ofomeprazole, lansoprazole and pantoprazole with P-glycoprotein.Naunyn Schmiedebergs Arch Pharmacol. 2001;364(6):551–7.
42. Collett A, Tanianis-Hughes J, Carlson GL, HarwoodMD,WarhurstG. Comparison of P-glycoprotein-mediated drug-digoxin interac-tions in Caco-2 with human and rodent intestine: relevance toin vivo prediction. Eur J Pharm Sci. 2005;26(5):386–93.
43. Hilgendorf C, Ahlin G, Seithel A, Artursson P, Ungell AL, KarlssonJ. Expression of thirty-six drug transporter genes in human intestine,liver, kidney, and organotypic cell lines. Drug Metab Dispos.2007;35(8):1333–40.
44. Carey MC, Small DM. Micelle formation by bile salts. Physical-chemical and thermodynamic considerations. Arch Intern Med.1972;130(4):506–27.
45. Ilback NG, NyblomM,Carlfors J, Fagerlund-AspenstromB, TavelinS, Glynn AW. Do surface-active lipids in food increase the intestinalpermeability to toxic substances and allergenic agents? MedHypotheses. 2004;63(4):724–30.
46. Cao X, Yu L, Sun D. Drug absorption principles. In: Krishna R, YuL, editors. Biopharmaceutics applications in drug development.USA: Springer; 2008. p. 75–100.
47. Urquhart BL, Tirona RG, Kim RB. Nuclear receptors and theregulation of drug-metabolizing enzymes and drug transporters:implications for interindividual variability in response to drugs. JClin Pharmacol. 2007;47(5):566–78.
48. Koutsounas I, Theocharis S, Patsouris E, Giaginis C. Pregnane Xreceptor (PXR) at the crossroads of human metabolism and disease.Curr Drug Metab. 2013;14(3):341–50.