Human Brain Mapping 3:35-55(1995) In Vivo Imaging of Neuromodulation Using Positron Emission Tomography: Optimal Ligand Characteristics and Task Length for Detection of Activation Evan D. Morris, Ronald E. Fisher, Nathaniel M. Alpert, Scott L. Rauch, and Alan J. Fischman Radiology (E.D.M., R.E.F., N.M.A., A.J.F.) and Psychiatry (S.L.R.) Departments, Massachusetts General Hospital and Harvard Medical School, Boston, Massachusetts Abstract: Considerable evidence suggests that cognitive state affects local levels of neurotransmitter in the brain. We introduce a compartment model of neuroreceptor ligand kinetics to describe the effect of change in cognitive state on positron emission tomography (PET) signal dynamics. The model is used to establish optimal experimental conditions, timing of activation, and ligand characteristics, for detecting cognitive activation. The model, which follows free and bound endogenous neurotransmitter, describes the PET curve predicted for a single injection of radioligand in the presence or absence of activation. Activation was conceptualized as the performance of a task that raises the level of neurotransmitter that competes for receptor sites with the radioligand. Simulating the dopamine system, for example, required making assumptions regarding the kinetic rate constants for binding/dissociation of endogenous dopamine to/from the receptor and dopamine concentrations in the synapse. Simulations suggest that activation of dopamine should be detectable with PET and the D2 receptor ligand [llC]raclopride, although this ligand might not be optimal. Aspects of experimental design can be modified to optimize the likelihood of detecting neurotransmitter changes. The ideal radioligand for these studies should bind irreversibly to its receptor. Furthermore, the task should commence at injection time and last for at least 7 minutes. Optimal task duration depends on the dynamics of free radioligand in the tissue and can be determined via model simulationsfor any well-characterized receptor ligand.Flow effects were shown to be distinguishablefrom those of neurotransmitter activation. General principles regarding desirable ligand characteristics and activation timing held for both the D2 receptor and the dopamine transporter site. o 1995 Wiley-Liss, Inc. Key words: endogenous, dopamine, receptor, activation, mathematical model, optimization + + INTRODUCTION The basic idea of this work is that it may be possible to have subjects perform a cognitive, sensory, or motor task that would increase the level of a neurotransmit- Received for publication November 11,1994; revision accepted June 5,1995. Address reprint requests to Dr. Alan Fischman, Division of Nuclear Medicine, MZ-TIL-201,Massachusetts General Hospital, Fruit Street, Boston, MA 02114. ter in the synaptic cleft, which would, in turn, change the kinetics of a corresponding receptor ligand. To assess the likelihood of detecting the activation of a particular neurotransmitter system with positron emis- sion tomography (PET), we performed simulations of a compartmental model of receptor binding that was modified to account for the competition between endogenous transmitter and radioactive ligand for the same class of (receptor) binding sites. The evolution of receptor-binding models in PET began with the Mintun formulation, which proposed o 1995 Wiley-Liss, Inc.
Transcript
Human Brain Mapping 3:35-55(1995)
In Vivo Imaging of Neuromodulation Using Positron Emission Tomography: Optimal Ligand
Characteristics and Task Length for Detection of Activation
Evan D. Morris, Ronald E. Fisher, Nathaniel M. Alpert, Scott L. Rauch, and Alan J. Fischman
Radiology (E.D.M., R.E.F., N.M.A., A.J.F.) and Psychiatry (S.L.R.) Departments, Massachusetts General Hospital and Harvard Medical School, Boston, Massachusetts
Abstract: Considerable evidence suggests that cognitive state affects local levels of neurotransmitter in the brain. We introduce a compartment model of neuroreceptor ligand kinetics to describe the effect of change in cognitive state on positron emission tomography (PET) signal dynamics. The model is used to establish optimal experimental conditions, timing of activation, and ligand characteristics, for detecting cognitive activation. The model, which follows free and bound endogenous neurotransmitter, describes the PET curve predicted for a single injection of radioligand in the presence or absence of activation. Activation was conceptualized as the performance of a task that raises the level of neurotransmitter that competes for receptor sites with the radioligand. Simulating the dopamine system, for example, required making assumptions regarding the kinetic rate constants for binding/dissociation of endogenous dopamine to/from the receptor and dopamine concentrations in the synapse. Simulations suggest that activation of dopamine should be detectable with PET and the D2 receptor ligand [llC]raclopride, although this ligand might not be optimal. Aspects of experimental design can be modified to optimize the likelihood of detecting neurotransmitter changes. The ideal radioligand for these studies should bind irreversibly to its receptor. Furthermore, the task should commence at injection time and last for at least 7 minutes. Optimal task duration depends on the dynamics of free radioligand in the tissue and can be determined via model simulations for any well-characterized receptor ligand. Flow effects were shown to be distinguishable from those of neurotransmitter activation. General principles regarding desirable ligand characteristics and activation timing held for both the D2 receptor and the dopamine transporter site. o 1995 Wiley-Liss, Inc.
The basic idea of this work is that it may be possible to have subjects perform a cognitive, sensory, or motor task that would increase the level of a neurotransmit-
Received for publication November 11,1994; revision accepted June 5,1995. Address reprint requests to Dr. Alan Fischman, Division of Nuclear Medicine, MZ-TIL-201, Massachusetts General Hospital, Fruit Street, Boston, MA 02114.
ter in the synaptic cleft, which would, in turn, change the kinetics of a corresponding receptor ligand. To assess the likelihood of detecting the activation of a particular neurotransmitter system with positron emis- sion tomography (PET), we performed simulations of a compartmental model of receptor binding that was modified to account for the competition between endogenous transmitter and radioactive ligand for the same class of (receptor) binding sites.
The evolution of receptor-binding models in PET began with the Mintun formulation, which proposed
o 1995 Wiley-Liss, Inc.
+ Morris et al.
compartments for plasma, free, and bound species while assuming that nonspecific binding was instanta- neous [Mintun et al., 19841. The standard model was subsequently modified [Bahn et al., 1989; Huang et al., 19891 by the introduction of a bound-to-specific activ- ity ratio as a means of accounting for the effect of unlabeled ligand as a competitor for radioligand bind- ing sites. Delforge et al. [1990] proposed parallel models for following both the "hot" and "cold' exogenous ligands separately (i.e., with separate com- partments). We chose to begin with the formulation of Delforge et al. [1990] because it is the most comprehen- sive approach [Morris et al., submitted]. In essence, what needed to be added to the standard model were the equations that describe the effect of yet another competitor-the endogenous neurotransmitter-for the binding sites of interest. Logan et al. [1991] have attempted a similar analysis using a different formula- tion than the one proposed herein, adding compart- ments to the conventional model and specifying a loss rate for endogenous material from the free compart- ment.
We present a series of simulations of a deterministic compartmental system subjected to transient step changes in endogenous competitor concentration to model the effect of cognitive activation. Neurochemi- cal transmission involves intermittent synaptic release of transmitter on the millisecond and micron scale. Before we could predict the effect of synaptic activa- tion on a PET signal, these microphenomena had to be related to macroscopic ones on the time and spatial scales of phenomena that are measured with PET. That process of translating published data from in vivo and in vitro results into receptor modeling assumptions is discussed in detail in the accompany- ing paper [Fisher et al., this issue]. The simulations presented herein were based on data for existing ligands (raclopride, CFT) (WIN 35,428) and extended to hypothetical ligands whose kinetic properties were varied. In the course of our theoretical investigations, we discovered that certain characteristics of timing and kinetics could amplify the predicted effect of activation, leading to greater detectability with PET. We attempt to formalize the optimization of future PET studies geared to identifying task-driven activa- tion of specific neurochemical systems using the dopa- mine system as an example.
METHODS
Theory
To the Delforge model (Equations 1-6) we added a differential equation describing the receptor binding
(and dissociation) of free endogenous neurotransmit- ter. The free endogenous chemical concentration pre- sented to the receptor (i.e., in the synaptic cleft) was modeled simply as a step function; step up for activa- tion of the neurotransmitter and step down for return of the endogenous level to the resting state. As suggested by Logan et al. 119911, the actual fluctuation of endogenous neurotransmitter in the synaptic cleft is far more complicated than a step function and certainly varies on the millisecond time scale; how- ever, the low temporal resolution of PET (seconds to minutes) requires that such changes be detected as shifts in average level. Logan et al. [1991] made model modifications similar to ours to study the effect of transient changes in endogenous chemical on the measured density of dopamine (D2) receptors. Their concern was that unintended transients in endog- enous dopamine concentration might alter the esti- mated value of available D2 receptors, B',,,, as mea- sured with [lsF]N-methylspiroperidol ([l8F]NMS). Consequently, they modeled the possible rapid change in dopamine concentration in the free space via an additional differential equation with a first order term. Since we are concerned with intentional and sus- tained alterations in endogenous transmitter level via a motor or cognitive task, a step function was chosen to describe these alterations.
The model used for simulations is described sche- matically in Figure 1. Both labeled ("hot") and unla- beled ("cold') exogenous ligand are introduced into the system via the plasma. Together they enter and exit the brain according to the transport parameters, K1 and k2. These are the only model parameters that are influenced by blood flow. Once in the brain the ligand experiences three possible fates: diffusion back to the plasma compartment, binding nonspecifically as indicated by the NS and NSc compartments, or bind- ing at the saturable receptor site B or Bc. Note that the superscript c means cold and superscript en means endogenous. The dotted box drawn around the bind- ing compartments indicates that the cold and hot ligand compete for a limited number of common sites, B + Bc. Of course, only the hot ligand is detected by PET, as indicated by the solid box labeled "PET pixel." The inclusion of the endogenous chemical in the model is diagrammed by the two compartments below the dotted line. For the purposes of our model, the endogenous chemical is introduced into the system at the free compartment, Fen, whose value is specified at any time (by equation 8). The endogenous chemical can bind to the receptor sites, Ben. As indicated by its inclusion in the dotted box, the pool of possible binding sites for endogenous material are the same
36 +
+ PET Imaging of Neuromodulation: Optimal Design
pool as those for exogenous ligand, [B,,, - B + Bc + Ben]. Mathematically, this means that the differen- tial equations describing accumulation of the exog- enous species (labeled and unlabeled) are coupled to the equations for the endogenous species via the three binding compartment variables (see equations 1, 2, 4, 5, and 7). It is important to note that the total number of receptor sites B,,, specified by this enhanced PET model is not the same as the receptor density term measured in studies that assume the endogenous transmitter to be in steady state. That term, which refers only to the number of sites not bound on average to endogenous material, is appropriately des- ignated B',,, to distinguish it from the theoretical total number of receptor sites.
Model equations
Compartments of labeled ligand:
dF d t - = KICp(t) - kzF - k,,F [B,,, - B - B' - Ben]
+ k,,B - ksF + k,NS - AF
d B d t - = k,,F[B,,, - B - B' - Ben] - k,BB - XB
d N S d t ~- - k,F - k6NS - ANS.
Compartments of unlabeled ligand:
dFc d t _ - - K,Ci(t) - kzF' - k,,F'[B,,, - B - B' - Ben]
+ k,HB'- k,FC + k6NS'
dB' d t - = konF'[B,,, - B - B' - Ben] - k,HB'
dNS' d t
-- - k,FC - k6NS'.
PET pixel hot ligand
kenon Bmax i kenoff i
- . t
Figure I . Schematic corresponding to model described in Equations 1 4 3 . The diagram is composed of three sections corresponding to the three chemical species of interest: radiolabeled exogenous ligand (hot), unlabeled exogenous ligand (cold) and endogenous transmit- ter. Each section contains boxes (i.e., Compartments) representing the possible states of the particular species. Hot ligand can exist in the plasma state (P), free state (F), receptor-bound state (B), or nonspecifically bound state (NS). Cold ligand can exist in the plasma state (Pc), free state (Fc), receptor-bound state (BC), or nonspecifi- cally bound state (NSC). Endogenous transmitter is modeled as existing either in the free state (Fen) or the bound state (Ben). The heavy dashed box around the three bound compartments indicates that all three chemical species are in competition for the same binding sites, which are limited in number. Appropriate first order rate constants (labeling each arrow) govern the transition of ligand from one state to another. Free ligand is transformed to bound ligand via its bimolecular association with available receptor sites, hence the shorthand label bnB,, for the corresponding arrow. The receptor modeling approach of Delforge et al. [ 19901. diagrammed above the dashed line, has been appended by the inclusion of compartments for endogenous transmitter, below the line.
(1)
(2)
(3)
(4)
(5)
(6)
Rate constants governing transfer of ligand between compartments (kz, kff, ks, &) are expressed in (rnin-l), K1 is measured in (m1/min)(g1), and k,, is in (pmol/ ml)-l(min-l); A (min-') is the radioactive decay constant. B,,, is measured in concentration units (pmol/ml) as are all the state variables in the above equations (F, Fc, Fen, B, B', Ben, NS, NS'). Fen(0) is the
Compartments of endogenous transmitter:
dBen d t - = k~Fen[B , , , - B - B' - Ben] - k z B e n (7)
Fen = Fen(0) + A. U(t - tup) - A . U(t - tdown). (8)
+ 37 +
Morris et al.
basal level of endogenous transmitter in the free compartment. U(t - tup) and U(t - tdown) are the unit step functions at times t,, and tdown, respectively. The magnitude of the step change is A (pmol/ml). Cp and Cp' are the metabolite-corrected plasma concentra- tions for the labeled and unlabeled ligand, respec- tively. For a single injection, the plasma functions are related by the specific activity of the injected material.
Protocol for simulation experiments
All of the computer simulations presented below follow a uniform protocol. Each simulation is based on a single injection of high specific activity radiolabeled receptor ligand. The specific activity and activity of the injectate are known at the time of injection. The dynamic PET activity is predicted for 60 minutes following injection in 1 minute time intervals. The metabolite-corrected plasma activity during the dura- tion of the scan is assumed to be known. The activa- tion task, which is modeled as having an immediate effect on the free endogenous neurotransmitter level, starts at the time of injection unless otherwise speci- fied.
Parameter values used for simulations
For detecting activation at the post-synaptic D2 receptor, the model time-activity curves were gener- ated using parameter values reported by Farde et al. [1989] for [lTIraclopride binding in the putamen of normal subjects. These values are based on a three- compartment model that ignores nonspecific binding. Thus, in our simulations of raclopride and other D2 receptor ligands, the nonspecific binding rate con- stants, k5 and &, were set to 0. The other raclopride parameter values are given in the last footnote of Table I; the specific activity of the injection was set at 900 mCi/kmol. Simulations of studies to detect activa- tion at the dopamine transporter site were generated using parameters determined for ["CICFT in monkey studies in our lab (unpublished data). The parameter values are given in the last footnote of Table 11; the specific activity of the injection was set at 1,000 mCi/Fmol.
As we discussed at length elsewhere [Fisher et al., 19951, we had to estimate a steady state concentration of endogenous dopamine and its KD from the litera- ture [see Table I in Fisher et al., 1995, for a summary of sources]. When modeling radioligand behavior at the D2 receptor site, the free compartment in our model corresponds to the micro-environment surrounding the post-synaptic receptor. Our interpretation of pub- lished in vivo studies is that the average concentration
of dopamine in that region is in the 100 nM range at rest and 200 nM during activation [Fisher et al., 19951. By varying the value of the dopamine concentration, we checked the sensitivity of our results to this interpretation. The KD for endogenous neurotransmit- ter is taken to be 100 nM [Gingrich and Caron, 19931. Because we assume that binding and release of ligand at the D2 site must be fast, we chose k:: and kz; values of 0.25 ml/(pmol. min) and 25.0 min-', respectively. When modeling binding at the dopamine transporter site, which is likely to be both intra- and extra-synaptic [Iversen and Kelly, 1975; Cerruti et al., 19911, the free endogenous concentration is estimated to be 30 nM at rest and 90 nM during activation [Fisher et al., 19951. For transporter site simulations we chose values of 0.75 ml/(pmol. min) and 25.0 min-l, respectively, for k:: and k:: so that action of the endogenous transmit- ter would still be fast relative to the exogenous ligand and the transporter operates near its KD when the organism is at rest (KD = kz$//k:: = 33.3 nM).
Numerical, statistical methods
The model depicted in equations 1-8 was solved numerically using an ordinary differential equation solver employing the Adams-Gear method as pro- vided in the IMSL/IDL programming language (IMSL Inc., Sugar Land, TX). The plasma input function, Cp(t), used for the simulations was an analytical bi-exponential decay function based on prior measure- ments. The chi-square statistic (xz), was used to rank activated PET curves by how different they were from their corresponding resting PET curve. The parameter was calculated as the weighted sum of the squares of the distances between the activated (a) and control (c) curves: x2 = C [(a - ~ ) ~ / q ] ~ [Press et al., 19921. The variance of each simulated data point, q, was modeled as ui = f . ci/Ati, where f is a proportionality factor that was kept constant for a set of simulations to be compared with each other, ci is the value of the control curve at the ith time point, and Ati is the length of the PET scan for the ith time point.
Ligand nomenclature
Each simulated dynamic PET activity curve re- ported below requires a set of hnetic parameters for a given ligand. Some of the ligands discussed, such as [llCIraclopride, or [llC]CFT, are currently in use and therefore the necessary parameter estimates are known. In order to establish optimal kinetic character- istics, we also present model-based predictions for hypothetical ligands that do not currently exist. Thus,
+ PET Imaging of Neuromodulation: Optimal Design
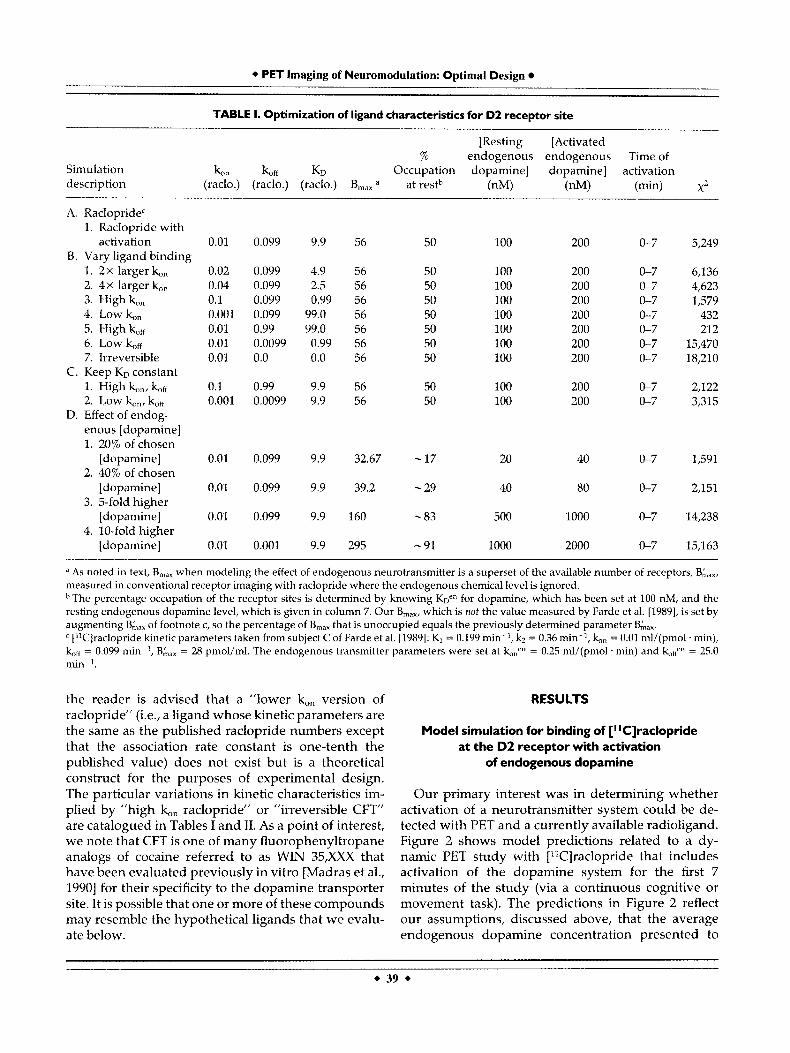
TABLE 1. Optimization of ligand characteristics for D2 receptor site
[Resting [Activated % endogenous endogenous Time of
Simulation kon koff K D Occupation dopamine] dopamine] activation description (raclo.) (raclo.) (raclo.) B,,, a at restb (nM) (nM) (min) X I
a As noted in text, B,,, when modeling the effect of endogenous neurotransmitter is a superset of the available number of receptors, B,!,,,,, measured in conventional receptor imaging with raclopride where the endogenous chemical level is ignored.
The percentage occupation of the receptor sites is determined by knowing K D ~ ~ for dopamine, which has been set at 100 nM, and the resting endogenous dopamine level, which is given in column 7. Our B,,,, which is not the value measured by Farde et al. [1989], is set by augmenting B,& of footnote c, so the percentage of B,,, that is unoccupied equals the previously determined parameter Kax.
["Clraclopride kinetic parameters taken from subject C of Farde et al. [1989]: K1 = 0.199 min-I, kz = 0.36 min-', bn = 0.01 ml/(pmol. min), bfi = 0.099 min-I, B,!,,,, = 28 pmol/ml. The endogenous transmitter parameters were set at bne" = 0.25 ml/(pmol . min) and bfien = 25.0 min-'.
the reader is advised that a "lower &,, version of raclopride" (i.e., a ligand whose kinetic parameters are the same as the published raclopride numbers except that the association rate constant is one-tenth the published value) does not exist but is a theoretical construct for the purposes of experimental design. The particular variations in kinetic characteristics im- plied by "high &,, raclopride" or "irreversible CFT" are catalogued in Tables I and 11. As a point of interest, we note that CFT is one of many fluorophenyltropane analogs of cocaine referred to as WIN 35,XXX that have been evaluated previously in vitro [Madras et al., 19901 for their specificity to the dopamine transporter site. It is possible that one or more of these compounds may resemble the hypothetical ligands that we evalu- ate below.
RESULTS
Model simulation for binding of ["C]raclopride at the D2 receptor with activation
of endogenous dopamine
Our primary interest was in determining whether activation of a neurotransmitter system could be de- tected with PET and a currently available radioligand. Figure 2 shows model predictions related to a dy- namic PET study with ["Clraclopride that includes activation of the dopamine system for the first 7 minutes of the study (via a continuous cognitive or movement task). The predictions in Figure 2 reflect our assumptions, discussed above, that the average endogenous dopamine concentration presented to
+ 39 +
+ Morris et al. +
TABLE II . Optimization of ligand characteristics for dopamine transporter site
[Resting [Activated % endogenous endogenous Time of
Simulation I b n koa Occupation dopamine] dopamine] activation description (CFT) (CFT) KD BmaXa--' a t res t (nM) (nM) (min) x2
A. CFTd
B. Vary ligand binding 1. CFT with activation 0.00153 0.062 40.5 1,358 - 50 30 90 0-7 1,310
1. High kn 0.0153 0.062 4.05 1,358 - 50 30 90 0-7 46 2. Low&, 0.000153 0.062 405 1,358 - 50 30 90 0-7 763 3. H i g h k f f 0.00153 0.62 405 1,358 - 50 30 90 0-7 400 4. Low&ff 0.00153 0.0062 4.05 1,358 - 50 30 90 0-7 1,592 5. Irreversible 0.00153 0.0 0.0 1,358 - 50 30 90 0-7 5,433
a As noted in text, B,,, when modeling the effect of endogenous neurotransmitter is a superset of the number of receptors, B,',,,,, measured with conventional receptor imaging. b The percentage occupation of the receptor sites is determined from KDen for dopamine transporter, which has been estimated at 30 nM, and the resting endogenous dopamine level at the (extra-synaptic) site, given in column 7. B,,, is set by augmenting BLaX of footnote d, so the percentage of B,n,, that is unoccupied equals the previously determined parameter Bb,,. cB,,, value of 1,358 pmol/ml may seem quite high but it should be noted that the corresponding B,',,,, value of 679 that we measured in baboons via PET is not too far from the in vitro estimate of -350 pmol/g published by Madras et al. [1989]. d ["CICFT kinehc parameters taken from model fits to preliminary monkey data obtained in our lab: K1 = 0.3 min-', kz = 0.118 min-', k,, = 0.00153 ml/(pmol min), lq,fi = 0.062 min-', Bkax = 679 pmol/ml, ks = 0.00217, = 0.000175. The endogenous transmitter parameters were set at k z = 0.75 ml/(pmol . min) and k:; = 25.0 min-'.
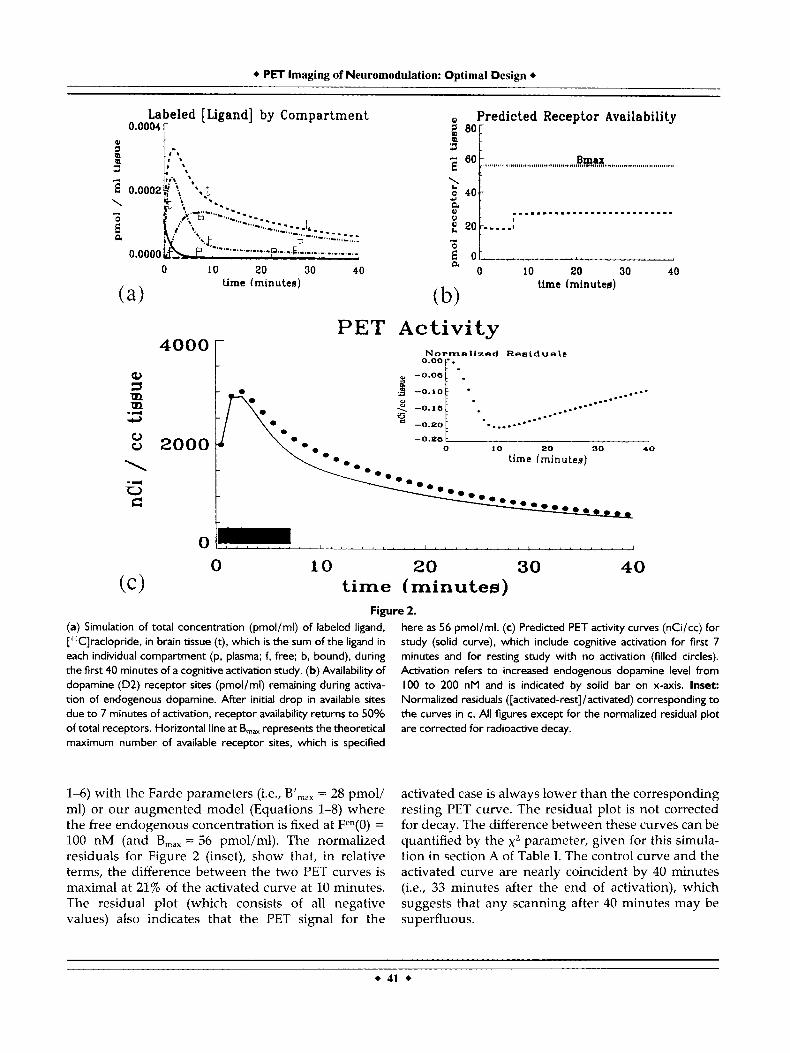
the post-synaptic receptors is 100 nM at rest and can be doubled by the increased frequency of firing of dopaminergic neurons. The dynamic concentration curve for each model compartment (p, plasma; f, free; b, bound) multiplied by its respective volume fraction is shown in Figure 2a. The total curve (t), which is proportional to the predicted PET activity curve, is the sum of these curves. This figure is corrected for radioactive decay. The raclopride parameters for this simulation were taken from Farde et al. [1989; see footnote to Table I] who were able to model PET activity without a nonspecific binding compartment, hence the absence of a nonspecific curve in Figure 2b. It is important to note that the concentration of labeled ligand in the free compartment ( f ) rises sharply after injection and peaks by 5 minutes. This amount of exogenous radioligand in the free compartment is the sole pool of radioactive signal that can respond to the abrupt change in concentration of endogenous com- petitor that we have hypothesized.
All the rate constants determined by Farde et al. [1989] should apply to the model presented above with the exception of the receptor density. As men- tioned previously, the term B,,, in our model repre- sents the total possible binding sites for any of three species, labeled and unlabeled raclopride as well as endogenous dopamine in the synapse. Thus, the
model must be constrained so that the difference between B,,, and the number of receptors occupied by endogenous dopamine at steady state equals the B',,, value determined by other groups. This con- straint on B,,, is displayed graphically in Figure 2b. The total number of receptor sites that potentially can be bound by any of the three species is designated by the constant curve at 56 pmol/ml. The rise in number of available receptors (dashed curve) reflects the abrupt drop in endogenous dopamine that we expect with termination of the cognitive activation task at 7 min- utes. Activation tasks of other durations are analyzed in a section below. The model indicates that once the activation has ceased (i.e., subject is in the resting state), the number of available receptors is 28 pmol/ml [Farde et al., 19891. The fraction of occupied receptor sites at rest (50%) is consistent with our assumption that the endogenous ligand is operating at its KD (average post-synaptic dopamine concentration = 100 nM = KD).
The effect of activation on the dynamic PET curve is illustrated in Figure 2c; the period of activation is indicated by the horizontal bar on the time-axis. The solid curve is the activity corresponding to the total concentration curve in Figure 2b. The dotted curve is the control curve, that is, the PET signal predicted by either the conventional receptor model (Equations
+ 40 +
+ PET Imaging of Neuromodulation: Optimal Design +
Figure 2. (a) Simulation of total concentration (pmol/ml) of labeled ligand, ["Clraclopride, in brain tissue (t), which is the sum of the ligand in each individual compartment (p, plasma; f, free; b, bound), during the f irst 40 minutes of a cognitive activation study. (b) Availability of dopamine (D2) receptor sites (pmol/ml) remaining during activa- tion of endogenous dopamine. After initial drop in available sites due to 7 minutes of activation, receptor availability returns to 50% of total receptors. Horizontal line at B,, represents the theoretical maximum number of available receptor sites, which is specified
here as 56 pmol/ml. (c) Predicted PET activity curves (nCi/cc) for study (solid curve), which include cognitive activation for first 7 minutes and for resting study with no activation (filled circles). Activation refers to increased endogenous dopamine level from 100 to 200 nM and is indicated by solid bar on x-axis. Inset: Normalized residuals ([activated-rest]/activated) corresponding to the curves in c. All figures except for the normalized residual plot are corrected for radioactive decay.
1-6) with the Farde parameters (i.e., B',,, = 28 pmol/ ml) or our augmented model (Equations 1-8) where the free endogenous concentration is fixed at Fen(0) = 100 nM (and B,,, = 56 pmol/ml). The normalized residuals for Figure 2 (inset), show that, in relative terms, the difference between the two PET curves is maximal at 21% of the activated curve at 10 minutes. The residual plot (which consists of all negative values) also indicates that the PET signal for the
activated case is always lower than the corresponding resting PET curve. The residual plot is not corrected for decay. The difference between these curves can be quantified by the x2 parameter, given for this simula- tion in section A of Table I. The control curve and the activated curve are nearly coincident by 40 minutes (i.e., 33 minutes after the end of activation), which suggests that any scanning after 40 minutes may be superfluous.
+ 41 +
+ Morris et al. +
Lgbeled [ Ligand] by Compartment 6 . 0 ~ 1 0 E
0 10 20 30 40 time (minutes)
Predicted Receptor Availability
3
% % 0 10 20 30 40 t o
time (minutes)
(b) PET Activity
5000
a2 3 m m 3 u 0
\ .H u c
3000 i/ 2000
Normalized R e o i d u e l s
O.OO F
tlme Imlnulsa)
1000 1 -0.08 t 0 10 20 30 40
-0.08 F 0 10 20 30 40
tlme Imlnulsa)
1000
0 I . . . . . . . . . l . . . . . . . . . I
0 10 20 30 40 (c> time (minute@)
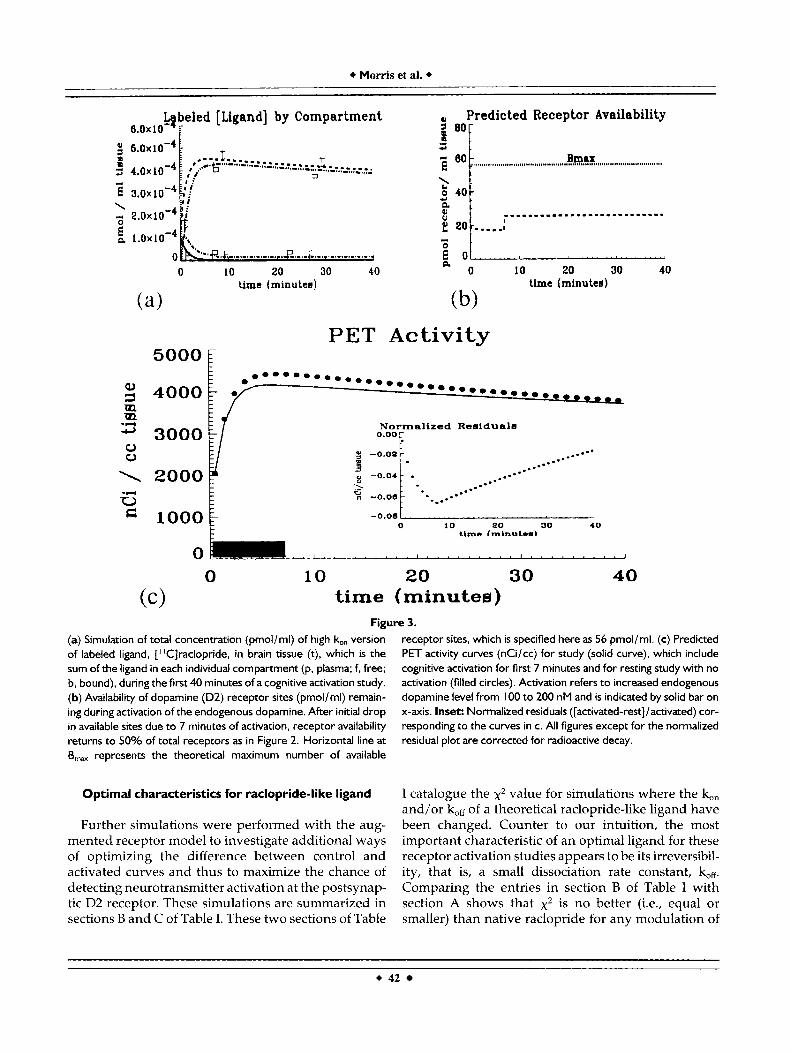
Figure 3. (a) Simulation of total concentration (pmol/ml) of high bn version of labeled ligand, [''Clraclopride, in brain tissue (t), which is the sum of the ligand in each individual compartment (p. plasma; f, free; b, bound), during the first 40 minutes of a cognitive activation study. (b) Availability of dopamine (D2) receptor sites (pmol/ml) remain- ing during activation of the endogenous dopamine. After initial drop in available sites due to 7 minutes of activation, receptor availability returns to SOYO of total receptors as in Figure 2. Horizontal line at B,, represents the theoretical maximum number of available
receptor sites, which is specified here as 56 pmol/ml. (c) Predicted PET activity curves (nCi/cc) for study (solid curve), which include cognitive activation for first 7 minutes and for resting study with no activation (filled circles). Activation refers to increased endogenous dopamine level from I00 to 200 nM and is indicated by solid bar on x-axis. Inset: Normalized residuals ([activated-rest]/activated) cor- responding to the curves in c. All figures except for the normalized residual plot are corrected for radioactive decay.
Optimal characteristics for raclopride-like ligand
Further simulations were performed with the aug- mented receptor model to investigate additional ways of optimizing the difference between control and activated curves and thus to maximize the chance of detecting neurotransmitter activation at the postsynap- tic D2 receptor. These simulations are summarized in sections B and C of Table I. These two sections of Table
I catalogue the x2 value for simulations where the &,, and/or &e of a theoretical raclopride-like ligand have been changed. Counter to our intuition, the most important characteristic of an optimal ligand for these receptor activation studies appears to be its irreversibil- ity, that is, a small dissociation rate constant, kfi. Comparing the entries in section B of Table I with section A shows that x2 is no better (i.e., equal or smaller) than native raclopride for any modulation of
+ 42
+ PET Imaging of Neuromodulation: Optimal Design +
. . . . . . . . l . . . . . . . . . l . . . . . t h e (minutea) . . . . I
0 10 20 30 40 time (minutes) (b)
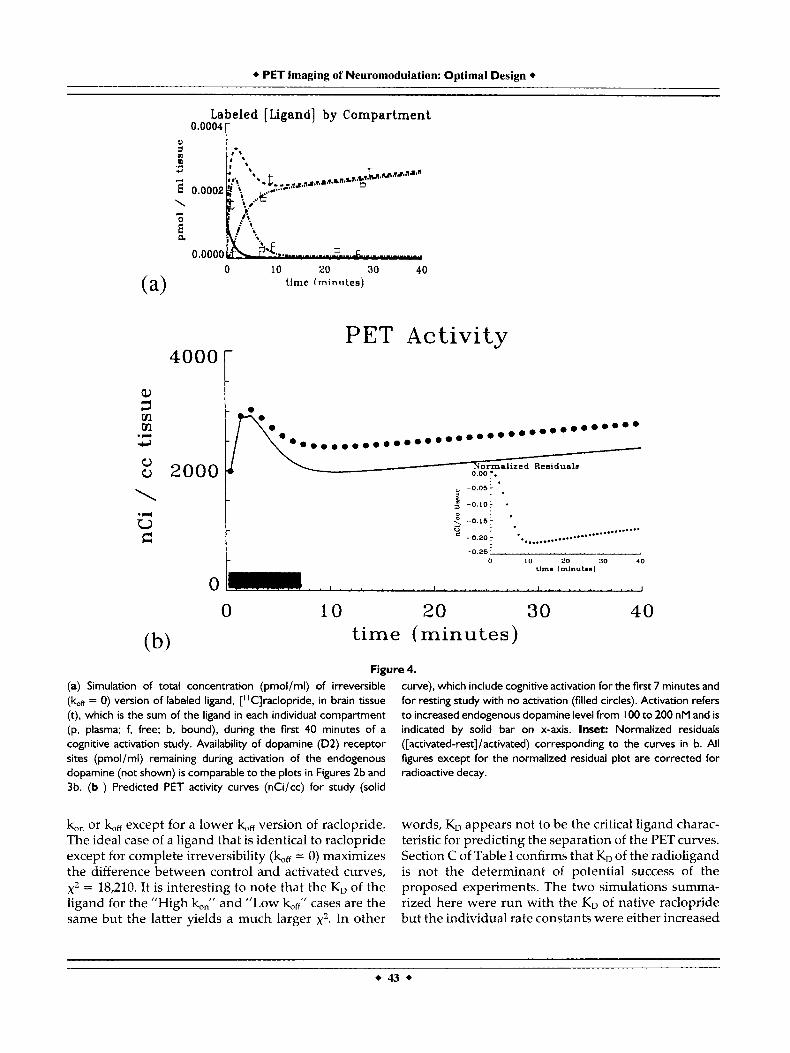
Figure 4. (a) Simulation of total concentration (pmol/ml) of irreversible (bw = 0) version of labeled ligand, [“C]raclopride, in brain tissue (t), which is the sum of the ligand in each individual compartment (p, plasma; f, free; b. bound), during the f irst 40 minutes of a cognitive activation study. Availability of dopamine (D2) receptor sites (pmol/ml) remaining during activation of the endogenous dopamine (not shown) is comparable to the plots in Figures 2b and 3b. (b ) Predicted PET activity curves (nCi/cc) for study (solid
curve), which include cognitive activation for the first 7 minutes and for resting study with no activation (filled circles). Activation refers to increased endogenous dopamine level from I00 to 200 nM and is indicated by solid bar on x-axis. Inset: Normalized residuals ([activated-rest]/activated) corresponding to the curves in b. All figures except for the normalized residual plot are corrected for radioactive decay.
kn or kff except for a lower kff version of raclopride. The ideal case of a ligand that is identical to raclopride except for complete irreversibility (koB = 0) maximizes the difference between control and activated curves, x2 = 18,210. It is interesting to note that the KD of the ligand for the ”High kn” and “Low kffl’ cases are the same but the latter yields a much larger x2. In other
words, KD appears not to be the critical ligand charac- teristic for predicting the separation of the PET curves. Section C of Table I confirms that KD of the radioligand is not the determinant of potential success of the proposed experiments. The two simulations summa- rized here were run with the KD of native raclopride but the individual rate constants were either increased
Morris et al.
or decreased simultaneously. Neither change gave x2 values as large as the original raclopride simulation.
Figure 3 is analogous to Figure 2 for a ligand identical to [llC]raclopride in all respects except that its bn is 10-fold higher (see entry 8-3 in Table I). The resting and activated levels of dopamine are identical to those for Figure 2. Figure 3a shows the predicted radioligand concentrations by compartment. As would be expected with a very fast binding ligand, the total signal is primarily made up of bound ligand. The reserve of free radioligand in the crucial first 10 minutes of the study is much less than in Figure 2b. The appearance of the PET curves in Figure 3c confirms the x2 entry in Table I, namely, the activated (solid curve) and control curve (dotted) are less differ- ent than are the curves for native raclopride in Figure 2c. The plot of receptor availability (Fig. 3b) for this theoretical ligand is nearly identical to that of native raclopride because the rate constants for endogenous dopamine have not been changed and the majority of occupied receptor sites in a high specific activity injection study are occupied by endogenous transmit- ter. As with the native raclopride simulation, the residual plot (inset) is entirely negative and peaks early although it reaches a maximum value of only 6.5% of the activated PET signal.
The results of simulating the comparable activation study with an irreversible form of raclopride are presented in Figure 4. The endogenous input function is the same 7 minute step function as in the previous two studies. The compartment concentrations (Fig. 4a) show that the free compartment is completely and irrevocably depleted by 15 minutes, after which the slowly rising total tissue concentration is comprised entirely of bound ligand. The figure is corrected for radioactive decay. The receptor availability plot (not shown) is also similar to previous ones (refer to Fig. 2b). The normalized residuals plot is all negative; it peaks at approximately 10 minutes (inset) and is similar to the native raclopride simulation. However, unlike Figure 2, the normalized residuals for the irreversible ligand never get smaller than 15% of the activated signal within the first 60 minutes of scan- ning. This phenomenon is borne out by the PET curves in Figure 4b, which show a greater separation between the activated and control curves than in the previous simulations. Entry B-7 in Table I confirms that the sum of squared distances between activated and control curves, x2, is maximal for this theoretical ligand.
Sensitivity of results to estimate of endogenous dopamine levels
As discussed elsewhere [Fisher et al., 19951, there is some question as to the appropriate average intra- synaptic dopamine levels for the rest and activated states to input into the model. Examination of pub- lished results leads us to estimates of 100 nM at rest and 200 nM during activation. This estimate is in accordance with the intuitively attractive presump- tion that the receptor operates in an environment whose average endogenous ligand concentration is at or near the K F and thus equally sensitive to circum- stances that cause the level of endogenous transmitter to drop or rise. To ascertain the sensitivity of our results to the particular endogenous concentration levels chosen we ran additional simulations at alterna- tive levels. Section D of Table I indicates that based on calculation of the x2 statistic, resting average concentra- tions of 500 or 1,000 nM dopamine in the vicinity of the post-synaptic receptor would enhance the effect of activation compared with the assumed level of 100 nM. On the other hand, if the average dopamine concentration were only 20 or 40 nM but the K F were to remain unchanged, the detection of activation with raclopride would be more difficult (x2 = 1,591 or 2,151, respectively). If the endogenous dopamine is set at 40 nM the x2 value can still be increased by more than three times by using an irreversible version of raclo- pride (data not shown). Because the K g of dopamine was held constant at 100 nM throughout all the simulations summarized in Table I, stipulating higher levels of dopamine dictates that a higher percentage of receptors be occupied at all times. Note that the modified levels of receptor occupancy are reflected in column 6 of section D of Table I. Figure 5 displays the simulation corresponding to entry 4 in section D of Table I. The endogenous input to the system is a step function that steps up to 2,000 nM for the 7 minutes of activation and then returns to a basal level of 1,000 nM of endogenous chemical after the activation is com- pleted. The compartmental curves (not shown) look very similar to the native raclopride simulations. Nevertheless, there are slight differences from the curves in Figure 2. The receptor availability plot in Figure 5a shows graphically the effect of the endog- enous concentration level being 10 times the equilib- rium dissociation constant of dopamine, KF. Accord- ing to the definition of equilibrium dissociation constant, approximately 91% of all receptors must be occupied at rest. Recall that Farde et al. [1989] have already determined with raclopride that the available
44
+ PET Imaging of Neuromodulation: Optimal Design +
Predicted Receptor Availability 400[
.-
PET Activity 4000 r
2000
0
P \ - * * * -
N o r m a l i z e d R e s i d u a l s
O . O r * *
- ...- ... -0.4 *.....-*-
0 10 20 30 40 I \ - - 0 -
t time (minutes)
0 1 0 20 30 40 time (minutes) (b)
Figure 5. Simulation of labeled ligand, ['lC]raclopride. in brain tissue during the f irst 40 minutes of a cognitive activation study assuming higher levels of resting and activated dopamine than in previous figures. Concentration curves by compartment (not shown) are reminis- cent of Figure 2a. (a) Availability of dopamine (D2) receptor sites (pmol/ml) remaining during activation of endogenous dopamine. After initial drop in available sites due to 7 minutes of activation, receptor availability returns to approximately 10% of total recep- tors (i.e., simulation assumes 90% occupation of receptors at rest). Horizontal line at B,, represents the theoretical maximum num-
ber of available receptor sites, which is specified here as 295 pmol/ml. (b) Predicted PET activity curves (nCi/cc) for study (solid curve), which include cognitive activation for the first 7 minutes and for resting study with no activation (filled circles). Activation refers to increased endogenous dopamine level from 1,000 to 2,000 nM and is indicated by double thickness solid bar on x-axis. Inset: Normalized residuals ([activated-rest]/activated) corresponding to the curves in b. All figures except for the normalized residual plot are corrected for radioactive decay.
number of D2 receptors at steady state (Bfmax) is 28 nM. To satisfy both of these criteria, the total concentration of receptors (Bmax) for this simulation had to be specified as 295 nM. Although the compartmental concentrations (not shown) are similar to the values in Figure 2, there is slightly less receptor binding of the
labeled ligand in this case-presumably due to in- creased competition with more endogenous dopa- mine. Less labeled ligand in the bound compartment means more in the free compartment, particularly during the critical activation period. Like Figure 2, the PET curves for control and activated in Figure 5b
+ 45 +
+ Morris et al.
converge by 40 minutes; however, the differences between them are greater during those 40 minutes than for the simulations with 100 nM endogenous dopamine. The shape of the residuals plot (inset) is similar to the plot of raclopride residuals but the scale in Figure 5 is larger.
Flow effects versus neurotransmitter activation
In practice, it is very likely that the tasks that will be employed to raise levels of neuromodulatory chemical will also cause an increase in local blood flow to the brain region of interest. Of course, this is the basis for conventional activation studies with PET. Thus, it is important to be able to demonstrate that we will be able to distinguish flow effects from neurotransmitter activation. As we discuss elsewhere [Fisher et al., 19951, we expect that increased local flow will lead to increased delivery of injected ligand and therefore a larger PET signal over time compared with the resting case. Such a change would be opposite in direction to the effect of competition between endogenous trans- mitter and exogenous radioligand. Figure 6 confirms our intuition for an ["Clraclopride study. We com- pared the theoretical case of increased blood flow during the "activation" period of the study but no neurotransmitter activation during that time to the resting case. Figure 6a shows that the receptor availabil- ity during the study is a constant 28 pmol/ml (an initial dip in the curve is the normal effect on receptor sites of a high specific activity injection). Increased blood flow transiently was simulated as a threefold increase in the blood flow parameters, K1 and k,, from 0 to 7 minutes. These conditions yield a PET curve (Fig. 6b) that is consistently higher and sharper than the control (filled circles). Significantly, the plot of the residuals (inset) in Figure 6 is quite different in shape and in sign (i.e., + or -) from plots for all the simulations we have examined (Figs. 2-5) that include neurotransmitter activation. Rather than peaking at or near the time at which the activation task is discontin- ued, the residuals in this simulation are maximal at time 0 and are fairly constant after 10 minutes.
Model simulation for uptake of ["ClCFT at the transporter site with activation
of endogenous dopamine
We also investigated whether the activation of the dopamine system might be detectable at the site of dopamine reuptake by its transporter molecule on the presynaptic terminal. An activation study with the
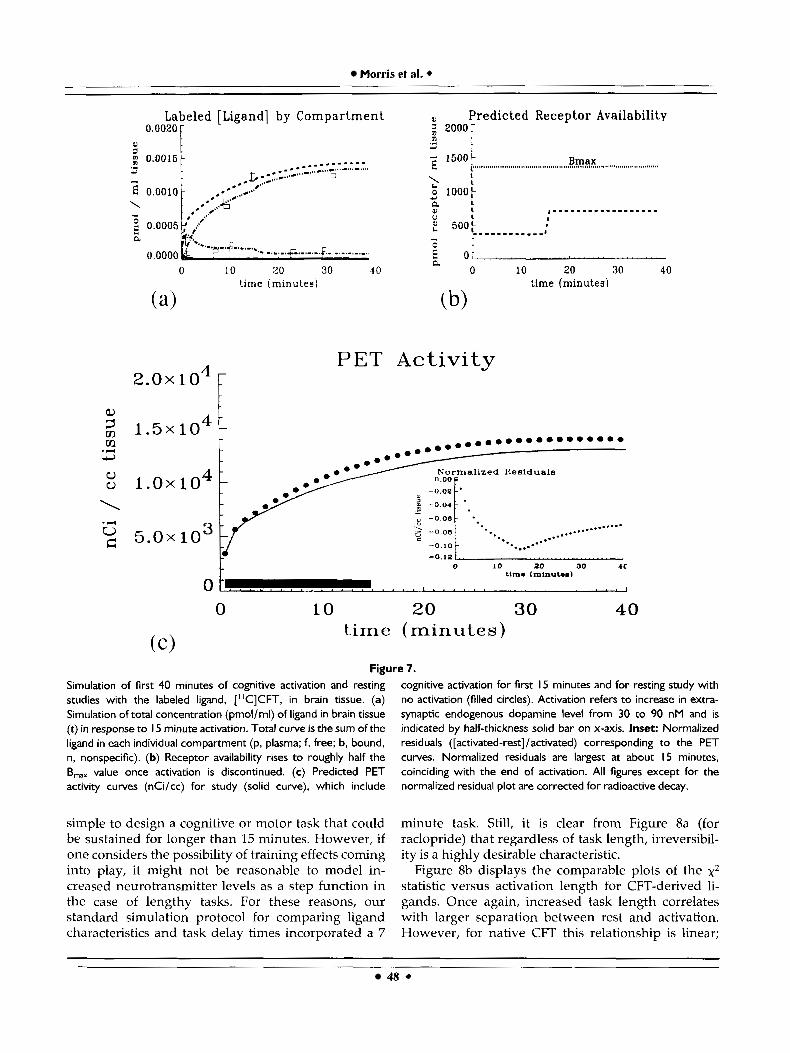
transporter ligand [llC]CFT and a 15 minute activation period is simulated in Figure 7. Kinetics of the trans- porter ligand were satisfactorily modeled with the same receptor model used for raclopride (Fig. l), specifically including some nonspecific binding and some reversible specific binding. The activation was modeled, conservatively, as inducing a step in endog- enous dopamine concentration from 30 to 90 nM in the neighborhood of the dopamine transporter site. These levels of dopamine are lower than in other simulations because the transporter site may be extra- synaptic. Although the total curve in Figure 7a is primarily made up of bound radioligand, there is still a noticeable pool of free radioligand that is affected by the activation. Note the drop in free concentration and concomitant rise in binding when activation is turned off at 15 minutes. As in previous simulations, the free endogenous concentration at rest is set approximately equal to the equilibrium constant for endogenous dopamine, Kg. Thus, slightly less than half of the receptors are occupied after activation is turned off (refer to section A, Table 11). Figure To indicates that B,,, has been set at 1,358 nM. The predicted PET curves are broader than those predicted for raclopride and the difference between the control and activated ["CICFT curves is less impressive for comparable activation times, hence our decision to !consider longer activation times for CFT. Nevertheless, it is important to observe that the normalized residuals plot (inset) displays the same characteristic (negative) peak when the activation is terminated as do the simulations for raclopride and related ligands. The residuals for the 15 minute activation paradigm peak at approximately 11 percent of the activated curve.
Optimal characteristics for CFT-like ligand
Section B of Table I1 contains x2 results for simula- tions with theoretical ligands that derive from the native ["CICFT. The activation length in this series of tests was held at 7 minutes, beginning at time 0. The only change to the CFT binding parameters that increases the value of the x2 measure is significant reduction in the dissociation rate constant, k,*. When kfi is reduced by at least an order of magnitude the resulting simulations yield roughly 20% improvement in x2 value compared with the native CFT simulation (listed in section A, Table IT). The optimal quality of the irreversible ligand is reminiscent of our findings with raclopride.
+ PET Imaging of Neuromodulation: Optimal Design +
Predicted Receptor Availability aor
Figure 6. Simulation of labeled ligand, [ I 'Clraclopride, in brain tissue during the f irst 40 minutes of an "activation" study that assumes a threefold increase in plasma-tissue transport parameters, K, and k2, for the period 0-7 minutes, but no increase in levels of activated dopamine relative to rest. (a) Plot of availability of receptor sites. Near constancy of the receptor availability at 50% of B,, confirms that there is no modulation of endogenous transmitter in this
simulation. (b) Dynamic PET activity curve for resting state (filled circles) is plotted on same axis as PET activity for increased blood flow but no change in endogenous dopamine during 0-7 minute activation period (solid curve). Inset: Normalized residuals ([acti- vated-rest]/activated) corresponding to the PET curves. All figures except for the normalized residual plot are corrected for radioac- tive decay.
Optimization of activation paradigm
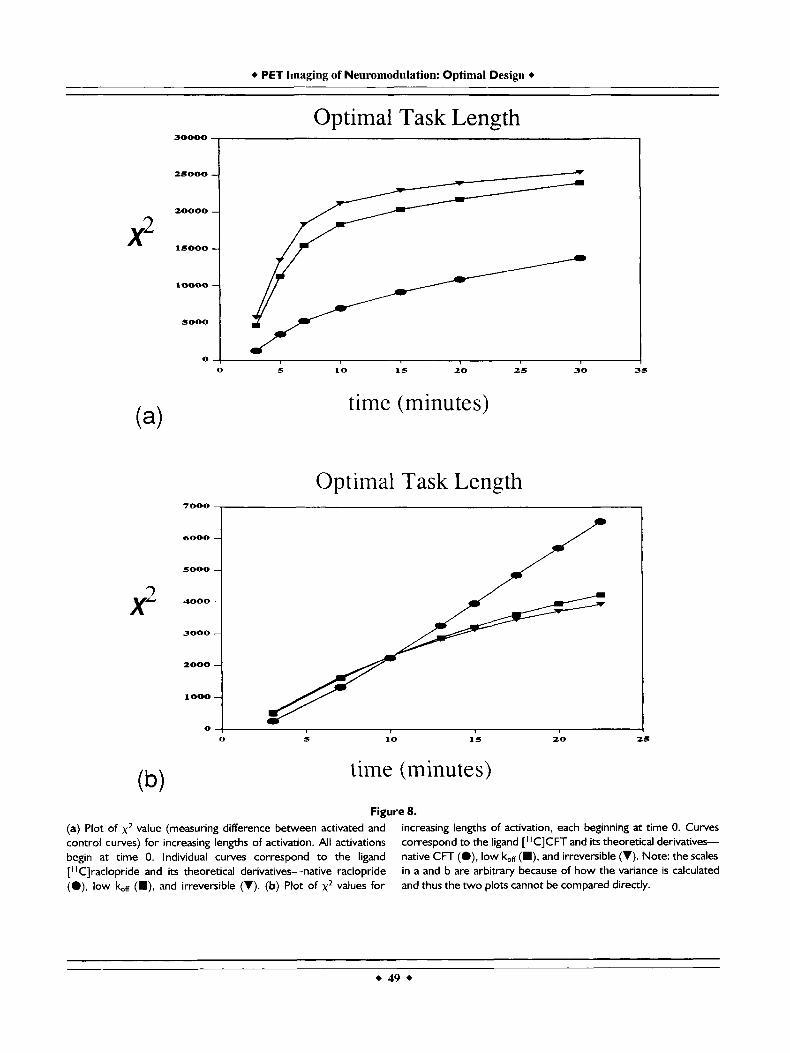
Having found what appears to be a crucial character- istic of a good receptor/activation ligand, namely, irreversibility, we sought to examine the role of the start and stop times for the activation task in order to enhance detectability. Figure 8a displays the depen- dence of detectability of activation (via the x2 statistic) on length of activation for raclopride-derived ligands.
Specifically, we plotted this relationship for the native compound as well as the "low k,,ffl' and irreversible versions of raclopride. As one might expect, in all cases the x2 parameter grows as the length of activation grows. There appears to be a definite phenomenon of diminishing returns in x2 for the more irreversible ligands but less so for raclopride itself. Each of the activation tasks represented in Figure 8 was specified to begin at the time of injection. At first, it may seem
47 +
Morris et al. +
Labeled [Ligand] by Compartment 0.0020
J ; 0.0015 .- - d - 6 0.0010 \ -
0.0005
0.0000 a
I
Predicted Receptor Availability 2 2oooi m 3 - E 1500F c Bmax ........................................................................................
1 ................... P
P 0 10 20 30 40 0 10 20 30 40
time (minutes) time (minutes)
0
PET Activity
0 ........... 0 ........ ........ 2 -0.08
-0.10 ........ -0.121
0 10 20 30 4c
t . . . . . . . . . . . . . . . . . . . I I
time (minut..)
. . . . . . 0 10 20 30 40
time (minutes)
Figure 7. Simulation of first 40 minutes of cognitive activation and resting studies with the labeled ligand, ["CICFT, in brain tissue. (a) Simulation of total concentration (pmol/ml) of ligand in brain tissue (t) in response to I 5 minute activation. Total curve is the sum of the ligand in each individual compartment (p. plasma; f, free; b, bound, n, nonspecific). (b) Receptor availability rises to roughly half the B,, value once activation is discontinued. (c) Predicted PET activity curves (nCi/cc) for study (solid curve), which include
simple to design a cognitive or motor task that could be sustained for longer than 15 minutes. However, if one considers the possibility of training effects coming into play, it might not be reasonable to model in- creased neurotransmitter levels as a step function in the case of lengthy tasks. For these reasons, our standard simulation protocol for comparing ligand characteristics and task delay times incorporated a 7
cognitive activation for first I 5 minutes and for resting study with no activation (filled circles). Activation refers to increase in extra- synaptic endogenous dopamine level from 30 to 90 nM and is indicated by half-thickness solid bar on x-axis. Inset: Normalized residuals ([activated-rest]/activated) corresponding to the PET curves. Normalized residuals are largest at about 15 minutes, coinciding with the end of activation. All figures except for the normalized residual plot are corrected for radioactive decay.
minute task. Still, it is clear from Figure 8a (for raclopride) that regardless of task length, irreversibil- ity is a highly desirable characteristic.
Figure 8b displays the comparable plots of the xz statistic versus activation length for CFT-derived li- gands. Once again, increased task length correlates with larger separation between rest and activation. However, for native CFT this relationship is linear;
48 +
+ PET Imaging of Neuromodulation: Optimal Design +
25000 -
20000 -
15000 -
l o o 0 0 -
sooo -
o r
X2
sooo -
4000 -
3000 -
2000 -
1000 -
X2
7000
6000 -
sooo -
4000 -
3000 -
2000 -
1000 -
0 ,
Optimal Task Length
4 30000
10 15 20 2s
time (minutes)
Optimal Task Length
30 35
7000
6000 -
0 s 10 15 20 25
time (minutes)
Figure 8. (a) Plot of x 2 value (measuring difference between activated and control curves) for increasing lengths of activation. All activations begin at time 0. Individual curves correspond to the ligand ["Clraclopride and its theoretical derivatives-native raclopride (O), low br (m), and irreversible (V). (b) Plot of x 2 values for
increasing lengths of activation, each beginning at time 0. Curves correspond to the ligand [' 'CICFT and its theoretical derivatives- native CFT (.), low k.,H (m), and irreversible (V). Note: the scales in a and b are arbitrary because of how the variance is calculated and thus the two plots cannot be compared directly.
+ Morris et al. +
there is no apparent point of diminishing returns. The more irreversible forms of the transporter ligand are more similar to the plots in Figure 8a in that they begn to saturate (albeit slowly) at long activation times. Although the scales are somewhat arbitrary for x2 (based on our model of the error in the PET signal) and the two graphs for the respective families of ligands cannot be compared directly, there is some suggestion that CFT would be a preferable ligand for use with long activation paradigms because the sepa- ration of the PET curves will continue to grow even at long times.
For a given task length (7 minutes) we also exam- ined the effect on x2 of delaying the beginning of the task for some time after the injection of radioligand and start of scanning. In contrast to the effect of activation length, the effect of task delay is essentially the same for raclopride and CFT. Figure 9a (raclopride- derived ligands) and Figure 9b (CFT-derived ligands) both indicate that delaying the activation task by as little as 1, 2, or 3 minutes from the moment of the injection can be expected to reduce the difference between activation and control curves. Longer delays lead to progressively smaller x2 values. Finally, it must be emphasized that delaying onset of the task by just 10 minutes was enough to obliterate completely the effect of neurotransmitter activation for any of the ligands examined.
DISCUSSION
How is what we are proposing different from other studies?
There has been some recent attention in the field of receptor-ligand imaging with PET directed toward detecting or at least accounting for changes in neuro- transmitter levels and their effect on conventional receptor imaging assays. Much of this work was initially motivated by the desire to resolve the contro- versy over D2 receptor measurements with raclopride and spiperone in schizophrenics [Wong et al., 1986; Farde et al., 1987; Andreasen et al., 19871. In contrast to the current study, Logan et al. [1991] viewed variable levels of dopamine as a potential source of error in attempts to estimate D2 receptor density. Neverthe- less, through extensive simulations they contributed greatly to our understanding of the interaction be- tween exogenous and endogenous receptor ligands. In that study, a model similar to the one presented here was used to assess the impact of either different constant levels or transient changes in endogenous
dopamine on ['*F]NMS measures of receptor availabil- ity and density. The authors concluded that the halftime for a radioligand in the tissue (along with its equilibrium constant) is an important factor in deter- mining its sensitivity to changes in endogenous neuro- transmitter levels. In turn, they claimed that halftime is a function of the tissue to plasma rate constant, K, and thus cited it as an important parameter in deter- mining the sensitivity of the ligand to changes in endogenous neurotransmitter levels. In general, we agree that the issue of competition between an endog- enous chemical and a short-lived exogenous radioli- gand is a kinetic one. However, because this is a kinetic rather than an equilibrium phenomenon, we believe our results show that the equilibrium constant, KD, has little or no effect on our ability to detect competition while the rate of dissociation, koff, is highly correlated with the degree of separation be- tween the activated and control curves. This issue is explained more fully below.
The researchers from Brookhaven National Labs followed their simulation studies with a series of studies focusing on inducing changes in endogenous neurotransmitter levels pharmacologically [Dewey et al., 1991, 1992, 19931. Researchers from Hammersmith Hospital have observed neuromodulation indirectly by imaging blood flow changes with PET during cognitive tasks before and after pharmacologic inter- vention [Friston et al., 19921. Studies have been re- ported that tried to look at either the effects of activating the dopamine system via SPECT imaging of [lZ3I]IBZM [Childress et al., 19931 or the release of endogenous opioids with PET [Duncan et al., 19921. The former study proposed using a reversible ligand and commencing activation 1 hour post injection and the latter study proposed activating 3040 minutes post injection of [llC]diprenorphine. Our simulation results suggest that these experimental designs may have been suboptimal for detecting activation. We hope to be able to model, detect, and quantify the average change in endogenous transmitter levels by PET to investigate the connection between specific brain functions and activity of neuromodulatory neu- rons. In order to predict whether such an assay would be possible, and even optimal, we turned to model simulation studies.
Can we detect activation of a particular neurotransmitter system with PET?
Our simulations have not accounted for noise that is certain to be included in the actual control and
+ 50 +
+ PET Imaging of Neuromodulation: Optimal Design +
20000
15000
so00
0
Optimal Task Delay
0 5 10 15
t iine (minutes)
Optimal Task Delay
20
1800
1600
1400
1200
x2 loo0 800
600
400
200
0
0 5 10 20
time (minutes)
Figure 9. (a) Plot of x2 value (measuring difference between activated and control curves) for increasing lengths of delay between time of injection and time of activation. All activations are 7 minutes long. Individual curves correspond to the ligand ["Clraclopride and its theoretical derivatives-native raclopride (O), low 16" (W), and
irreversible (V). (b) Plot of x2 value for increasing delay time; activation length is 7 minutes. Curves correspond to the ligand [IICICFT and its theoretical derivatives-native CFT (O), low kH (m), and irreversible (V). Note: the scales in a and b are arbitrary and cannot be compared directly.
+ 51 +
+ Morris et al. +
activated curves. Nevertheless, based on the differ- ence in simulated curves presented above we believe there is reason to be optimistic that endogenous neurotransmitter activation could be detectable. Our PET camera, (PC4096, Scanditronix) has a typical signal to noise ratio of 10 at the peak concentration (10% error) whereas the differences conservatively predicted herein between activation and control using native raclopride were on the order of 20%. Although the results of simulations with the D2 receptor ligand (raclopride) predicted more dramatic effects of activa- tion than did our simulations of the dopamine trans- porter ligand, there seems to be sufficient change in the predicted PET curves for [llC]CFT to warrant pilot studies with either ligand given an appropriate task. It is also apparent that detectability can be enhanced by properly timing the activation task in accordance with the dynamics of the radioligand in the free space and by choosing a ligand whose binding is nearly irrevers- ible.
Why is an irreversible ligand desirable?
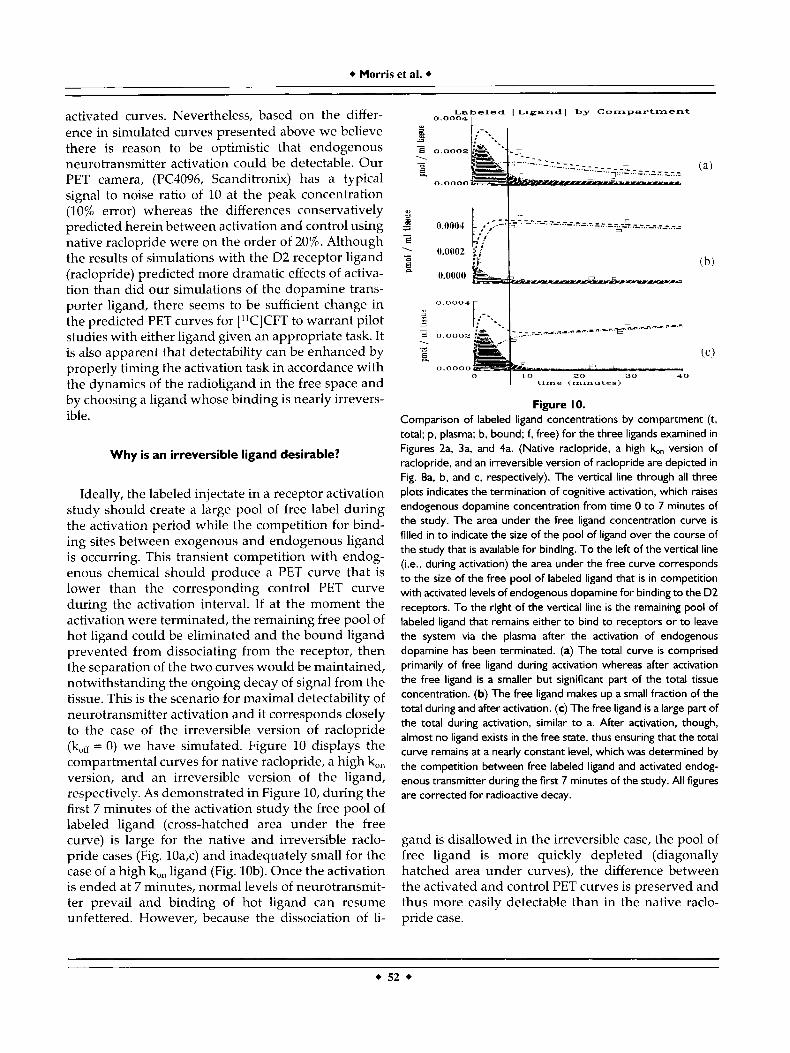
Ideally, the labeled injectate in a receptor activation study should create a large pool of free label during the activation period while the competition for bind- ing sites between exogenous and endogenous ligand is occurring. This transient competition with endog- enous chemical should produce a PET curve that is lower than the corresponding control PET curve during the activation interval. If at the moment the activation were terminated, the remaining free pool of hot ligand could be eliminated and the bound ligand prevented from dissociating from the receptor, then the separation of the two curves would be maintained, notwithstanding the ongoing decay of signal from the tissue. This is the scenario for maximal detectability of neurotransmitter activation and it corresponds closely to the case of the irreversible version of raclopride (kH = 0) we have simulated. Figure 10 displays the compartmental curves for native raclopride, a high k, version, and an irreversible version of the ligand, respectively. As demonstrated in Figure 10, during the first 7 minutes of the activation study the free pool of labeled ligand (cross-hatched area under the free curve) is large for the native and irreversible raclo- pride cases (Fig. 10a,c) and inadequately small for the case of a high k,, ligand (Fig. lob). Once the activation is ended at 7 minutes, normal levels of neurotransmit- ter prevail and binding of hot ligand can resume unfettered. However, because the dissociation of li-
Labeled L i g a n d ] by Compartment 0.0004 -
n 3"
I t i r n x e (minutes)
Figure 10. Comparison of labeled ligand concentrations by compartment (t, total; p, plasma; b, bound; f, free) for the three ligands examined in Figures 2a, 3a, and 4a. (Native raclopride, a high 16" version of raclopride, and an irreversible version of raclopride are depicted in Fig. 8a. b, and c, respectively). The vertical line through all three plots indicates the termination of cognitive activation, which raises endogenous dopamine concentration from time 0 to 7 minutes of the study. The area under the free ligand concentration curve is filled in to indicate the size of the pool of ligand over the course of the study that is available for binding. To the left of the vertical line (i.e., during activation) the area under the free curve corresponds to the size of the free pool of labeled ligand that is in competition with activated levels of endogenous dopamine for binding to the D2 receptors. To the right of the vertical line is the remaining pool of labeled ligand that remains either to bind to receptors or to leave the system via the plasma after the activation of endogenous dopamine has been terminated. (a) The total curve is comprised primarily of free ligand during activation whereas after activation the free ligand is a smaller but significant part of the total tissue concentration. (b) The free ligand makes up a small fraction of the total during and after activation. (c) The free ligand is a large part of the total during activation, similar to a. After activation, though, almost no ligand exists in the free state, thus ensuring that the total curve remains at a nearly constant level, which was determined by the competition between free labeled ligand and activated endog- enous transmitter during the f irst 7 minutes of the study. All figures are corrected for radioactive decay.
gand is disallowed in the irreversible case, the pool of free ligand is more quickly depleted (diagonally hatched area under curves), the difference between the activated and control PET curves is preserved and thus more easily detectable than in the native raclo- pride case.
+ PET Imaging of Neuromodulation: Optimal Design +
How to chose the right ligand and the right timing of activation
As we have demonstrated, the likelihood of success of an activation study seems to correlate very closely with the area under the free compartment curve during the time of activation. On the other hand, one may be able to prolong the persistence of a significant free pool via extended activation using a ligand (such as ["CICFT), with a slower k2 value and a much larger binding capacity (B,,, = 1,358 pmol/ml) than raclo- pride (Fig. 7). The fact that these results are not intuitive is an argument in favor of the type of simulation study presented here. In all cases, longer activations lead to greater detectability but an experi- menter must factor in the ability of a subject to sustain a task, which we have not considered in our simula- tions. Furthermore, it is important to continue charac- terizing new receptor ligands (and re-evaluating old ligands) via compartmental modeling and parameter estimation, since our simulations would be meaning- less without reliable estimates of receptor model pa- rameters. Regardless of the ligand, though, the finding that the activation task must begin at the same time as the injection and not be delayed seems universal.
Spiperone versus Raclopride
The finding that irreversibility of the ligand is optimal for detection of neurotransmitter levels sug- gests that N-methyl-spiperone, which is often mod- eled as irreversible, may be preferable to raclopride for studies of dopamine activation. Unfortunately, spiper- one has been shown to bind to the serotonin 5HT site and therefore would be of dubious value in trying to establish the relative dopaminergic versus serotoner- gic qualities of a particular cognitive task.
How to account for flow effects of activation?
We have demonstrated (in Fig. 6) that the flow effects typically associated with cognitive activation run counter to the expected effect on the PET curve from increased competition with endogenous chemi- cal. Thus, it is unlikely that increased flow of blood to a region of the brain could be confused with increased concentration of a neurotransmitter due to activation. Nevertheless, this issue brings out an important consid- eration for the design of experiments. A possible receptor activation study might involve dynamic scan- ning after injection of an irreversible D2 receptor ligand and a motor task that could be expected to
activate the basal ganglia unilaterally. In this way, the ipsilateral nonactivated brain region could be used to generate the control curve in the same study. How- ever, in such a case the control region would have to be modeled with resting values for transport param- eters, K1 and k2, while the activated, contralateral region would be correctly described by parameters adjusted for increased regional cerebral blood flow (rCBF). Thus, it might be necessary to perform addi- tional PET studies with a blood flow tracer (e.g., Hi50) under the same activation conditions in order to gauge the increase in rCBF between the two sides during activation. If a lateralized task were not pos- sible, a stepwise procedure for identifying increases (or decreases) in rCBF during activation via Hi50 imaging followed by model-based simulation of con- trol curves might be necessary. In outline form, the general procedure for any task might be as follows: 1) perform resting and activation PET receptor studies that yield "activation" and "control" curves; 2) using a model-sans activation-fit a curve to the control data yielding model parameters for no rCBF change and no synaptic activation; 3) adjust the blood flow param- eters (K, and k2) from step 2 in accord with the flow changes detected via H F 0 PET; 4) simulate the theo- retical control curve corresponding to increased (or decreased) CBF and no change in synaptic activity; and 5) compare the curve in step 4 with the activation curve from step 1. If need be, multiple (1 minute) rCBF measurements could be made in order to construct a piecewise continuous profile of the blood flow through- out a 7 minute activation.
The second important point to be taken from the examination of blood flow effects on the simulations of receptor activation is the appearance of the normal- ized residual plot. The residual plot for the simulation of increased K1 and k2 during the first 7 minutes of the study (Fig. 6) is dramatically different from the re- sidual plots for simulations containing neurotransmit- ter activation. In the residual plot of the same figure (inset), the residuals at all times are positive, reflecting the increased PET activity characteristic of increased flow, not increased competition with endogenous ligand. The characteristic (negative) peak in the residu- als that corresponds closely to the time of task termina- tion is absent. When we followed the scheme outlined above for comparing an activated PET curve with its proper control, the resulting residual plot displayed the characteristic minimum at or near the end of the activation period (data not shown).
+ Morris et al. +
Use of residual plot as confirmation of augmented model
In all activation cases the normalized residuals consisted of a unimodal curve that was necessarily 0 at time 0, a minimum at approximately the time of cessation of activation, and asymptotically approached 0 at long time. We suggest that the appearance of such a peak in experimental data might be considered a confirmation of the simple model proposed in this paper to describe the contribution of change in endog- enous neurotransmitter levels to the conventional receptor-binding model. Furthermore, we acknowl- edge that the reliance on x2 values alone as a means of detecting differences in curves due to activation is limited and ignores temporal information in the data. We therefore propose a two-part process for identify- ing neurotransmitter activation: sufficiently high x2 values and the identification of the single peak in the normalized residuals at or near the end of activation.
For very high kn simulations we note that the (minimum) peak in the residuals coincided exactly with the end of activation whereas in the case of slower k,, values, the peak was slightly delayed. This behavior agrees with our intuition that the 16, value for the hot ligand determines how fast the system can respond to the abrupt drop in endogenous neurotrans- mitter level. Neglecting the effect of noise for the moment, it is exciting to speculate that for a well- characterized ligand whose 16, is known one might use the residual plot to identify the end of activation of one particular neuromodulatory system among many systems that are activated by a complex cogni- tive task. Alternatively, in the case of a k,, that is not well known, but a task that is well characterized, the time of the residuals peak in relation to the known end of activation time might be used to infer the k,, value.
BLa versus B,,
endogenous competitor in the tissue. Thus, the model for analyzing receptor activation studies (Equations 1-8) has a parameter B,,,. A possible advantage of the studies proposed herein is that they may lead to an estimate of the total number of receptors, B,,,, which is not available from analysis of a conventional recep- tor imaging study with PET. Similarly, the model presented introduces two other parameters not found in the standard receptor model. Fen(0) and A are, respectively, the average basal level of neurotransmit- ter in the free space and the change in level during activation. In theory at least, it should be possible to estimate these parameters from the type of receptor activation study we have proposed, provided that enough of the remaining model parameters are suffi- ciently well known or could be constrained based on prior knowledge.
CONCLUSIONS
To answer the question of whether or not PET could be used to detect changes in neurotransmitter levels, we constructed a model of receptor binding in the presence of endogenous neurotransmitter. Using pub- lished rate constants, we were able to simulate and compare predicted PET curves assuming a high spe- cific activity injection of ["Clraclopride into subjects either at rest or in a state of dopamine activation. We found that the PET curves for activated dopamine levels were predicted to be different from control. Additionally, these differences, and hence detectabil- ity, could be maximized through the choice of ligand characteristics and the proper activation task. We now believe that PET studies designed to detect cognitive or motor activation of a specific neurotransmitter system are worth considering. Such experiments could certainly be optimized by timing activation tasks to coincide with the presence of a large pool of radioli- gand in the free compartment (always starting at time 0) and through the use of irreversibly binding receptor ligands.
Inherent in the standard receptor model is the assumption that endogenous neurotransmitter levels are in steady state and therefore can be ignored when modeling the availability of binding sites. As such, the number of available receptor sites prior to the injec- tion of radioligand, B',,,, is taken to be a constant property of the system. That is, B',,, is a parameter of the standard receptor model to be determined by fitting model curves to experimental data. The aug- mented receptor model, which includes the effect of nonsteady levels of endogenous neurotransmitter, must consider all possible binding sites for ligand and
ACKNOWLEDGMENTS
Dr. Morris acknowledges the support of the PHS training grant T32 CA 09362. Dr. Rauch acknowledges the support of the National Institute of Mental Health (MH01215) and the Pfizer-sponsored Harvard-MIT Clinical Investigator Training Program.
REFERENCES
Andreasen NC, Carson R, Diskic M, Evans A, Farde L, Gjedde A, Halurn A, La1 S, Nair N, Sedvall G, Tune L, Wong D (1988):
54 +
PET Imaging of Neuromodulation: Optimal Design
Workshop on schizophrenia, PET and dopamine D2 receptors in human neostriatum. Schizophr Bull 14:471-484.
Bahn MM, Huang S-C, Hawkins RA, Satyamurthy N, Hoffman JM, Barrio JR, Mazziotta JC, Phelps ME (1989): Models for in vivo kinetic interactions of dopamine DZneurorcceptors and 3-(2'- [I8F] fluoroethy1)spiperone examined with positron emission tomography. J Cereb Blood Flow Metab 9:840-849.
Childress AR, Kung HF, Malison RT, Alavi A, Mozley D, Fitzgerald J, Kushner S, OBrien CP (1993): Brain correlates of induced cocaine craving. Soc Neurosci. Abstr. 19:1864 (abs).
Cerruti C, Drian MJ, Kamenka JM, Privat A (1991): Localization of dopamine carriers by BTCP, a dopamine uptake inhibitor, on nigral cells cultured in vitro. Brain Res 555:51-57.
Delforge J, Syrota A, Mazoyer BM (1990): ldcntifiability analysis and parameter identification of an in vivo ligand-receptor model from PET data. IEEE Trans Biomed Eng 37:653-661.
Dewey SL, Logan J, Wolf AP, Brodie JD, Angrist B, Fowler JS, Volkow ND (1991): Amphetamine induced decreases in (lSF)-N- methylspiroperidol binding in the baboon brain using positron emission tomography (PET). Synapse 7:324-327.
Dewey SL, Smith GS, Logan J, Brodie JD, Yu DW, Ferrieri RA, King PT, MacGregor RR, Martin TP, Wolf AP, Volkow ND, Fowler JS, Meller E (1992): GABAergic inhibition of endogenous dopamine release measured in vivo with 11C-raclopride and positron emission tomography. J Neurosci 123773-3780.
Dewey SL, Smith GS, Logan J, Brodie JD, Simkowitz P, MacGregor RR, Fowler JS, Volkow ND, Wolf AP (1993): Effects of central cholinergic blockade on striatal dopamine release measured with positron emission tomography in normal human subjects. Proc Natl Acad Sci USA 90:11816-11820.
Duncan JS, Bartenstein PA, Prevett M, Cunningham VJ, Fish DR, Luthra SK, Sawle GV, Frackowiak RSJ, Brooks DJ (1992): Detec- tion of ictal opioid release in vivo, using positron emission tomography. Neurology 42(Suppl3):297 (abs).
Farde L, Wiesel FA, Hall H, Halldin C, Stone-Elander S, Sedvall G (1987): No D2 receptor increase in PET study of schizophrenia. Arch Gen Psychiatry 11:671-672.
Farde L, Eriksson L, Blomquist G, Halldin C (1989): Kinetic aralysis of central ["Clraclopride binding to D2-dopamine receptors studied by PET-a comparison to the equilibrium analysis. J Cereb Blood Flow Metab 9:696-708.
Fisher RE, Morris ED, Alpert NM, Fischman AJ (1995): In vivo imaging of neuromodulatory synaptic transmission using PET: A critical review of relevant neurophysiology. Hum Brain Mapp
Friston KJ, Grasby PM, Bench CJ, Frith CD, Cowen PJ, Liddle PF, Frackowiak RSJ, Dolan R (1992): Measuring the neuromodula-
3:24-34.
tory effects of drugs in man with positron emission tomography. Neurosci Lett 141:106-110.
Gingrich JA, Caron MG (1993): Recent advances' in the molecular biology of dopamine receptors. Annu Rev Neurosci 16299-321.
Hall H, Wedel I, Halldin C, Kopp J, Farde L (1990): Comparison of the in vitro receptor binding properties of N-["HI-methylspiper- one and [3H]raclopride to rat and human brain membranes. J Neurochem 55:2048-2057.
Huang S-C, Bahn MM, Barrio JR, Hoffman JM, Satyamurthy N, Hawkins RA, Mazziotta JC, Phelps ME (1989): A double-injection technique for the in vivo measurement of dopamine DZreceptor density in monkeys with 3-(2'-[18F] fluoroethy1)spiperone and dynamic positron emission tomography. J Cereb Blood Flow Metab 95350-858.
Iversen LL, Kelly JS (1975): Uptake and metabolism of gamma- amino butyric acid by neurones and glial cells. Biochem Pharma- col24:933-938.
Logan J, Dewey SL, Wolf AP, Fowler JS, Brodie JD, Angrist B, Volkow ND, Gatley SJ (1991): Effects of endogenous dopamine on measures of [18F]N-methylspiroperidol binding in the basal ganglia: Comparison of simulations and experimental results from PET studies in baboons. Synapse 9:195-207.
Madras BK, Spealman RD, Fahey MA, Neumeyer JL, Saha JK, Milius RA (1989): Cocaine receptors labeled by [3H]2P-carbomethoxy-3P- (4-fluoropheny1)tropane. Mol Pharmacol36:518-524.
Madras BK, Kamien JB, Fahey MA, Canfield DR, Milius RA, Saha JK, Neumeyer JL, Spealman RD (1990): N-modified fluorophenyltro- pane analogs of cocaine with high affinity for cocaine receptors. Pharmacol Biochem Behav 35:949-953.
Mintun MA, Raichle ME, Kilbourn MR, Wooten GF, Welch MJ (1984): A quantitative model for the in vivo assessment of drug binding sites with positron emission tomography. Ann Neurol 15:217-227.
Morris ED, Alpert NM, Fischman AJ (submitted): Comparison of two compartmental models for describing receptor ligand kinetics and receptor availability in multiple injection PET studies.
Press WH, Teukolsky SA, Vetterling WT, Flannery BP (1992): Numerical Recipes in C, The Art of Scientific Computing. Cambridge: Cambridge University Press.
Wong DF, Wagner HN, Tune LE, Dannals RF, Pearlsson GD, Links JM, Tamminga CA, Brouselle El', Ravert HT, Wilson AA, Toung JKT, Malat J, Williams FA, OTuama LA, Snyder SH, Kuhar MJ, Gjedde A (1986): Positron emission tomography reveals elevated D2 dopamine receptors in drug-naive schizophrenics. Science 234:1558-1563.


![Ivyspring International Publisher Theranostics17]. Therefore, imaging of system xcin vivo-with positron emission tomography (PET) technique might be crucial to further understanding](https://static.documents.pub/doc/80x56/5fba48d4a9d7877d5725f90c/ivyspring-international-publisher-theranostics-17-therefore-imaging-of-system.jpg)


