IN VIVO MRI OF THROMBI IN ADVANCED ATHEROSCLEROTIC CAROTID ARTERY Vincent Cappendijk 1 Kitty Cleutjens 1 Sylvia Heeneman 1 Geert Willem Schurink 1 Rob Welten 2 Fons Kessels 1 Mat Daemen 1 Jos van Engelshoven 1 Eline Kooi 1 1 University Hospital of Maastricht, Cardiovascular Research Institute Maastricht (CARIM), 2 Atrium Hospital Heerlen, Netherlands
Transcript
IN VIVO MRI OF THROMBI IN ADVANCED ATHEROSCLEROTIC
CAROTID ARTERYVincent Cappendijk1
Kitty Cleutjens1
Sylvia Heeneman1
Geert Willem Schurink1
Rob Welten2
Fons Kessels1
Mat Daemen1
Jos van Engelshoven1
Eline Kooi1
1University Hospital of Maastricht, Cardiovascular Research Institute Maastricht (CARIM), 2Atrium Hospital Heerlen,
Netherlands
Background (1)• Atherosclerosis is a major source of morbidity and mortality
-61,800,000 Americans have one or more types of
cardiovascular disease (CVD)
-Mortality CVD: 958,775 yearly
-Costs: 329.2 billion DollarSource: American Heart Association Website
Background (2)• Plaque composition rather than plaque size
(degree of stenosis) is the predictor of risk on thrombo-embolic events
• High-resolution multi-contrast MRI can subjectively detect atherosclerotic plaque components in vivo1,2
• Thrombus, a component in advanced (high-risk) lesions is still difficult to detect
1 Yuan et al. Radiology 2001; 221: 2852 Fayad et al. Circulation Research 2001; 89: 305
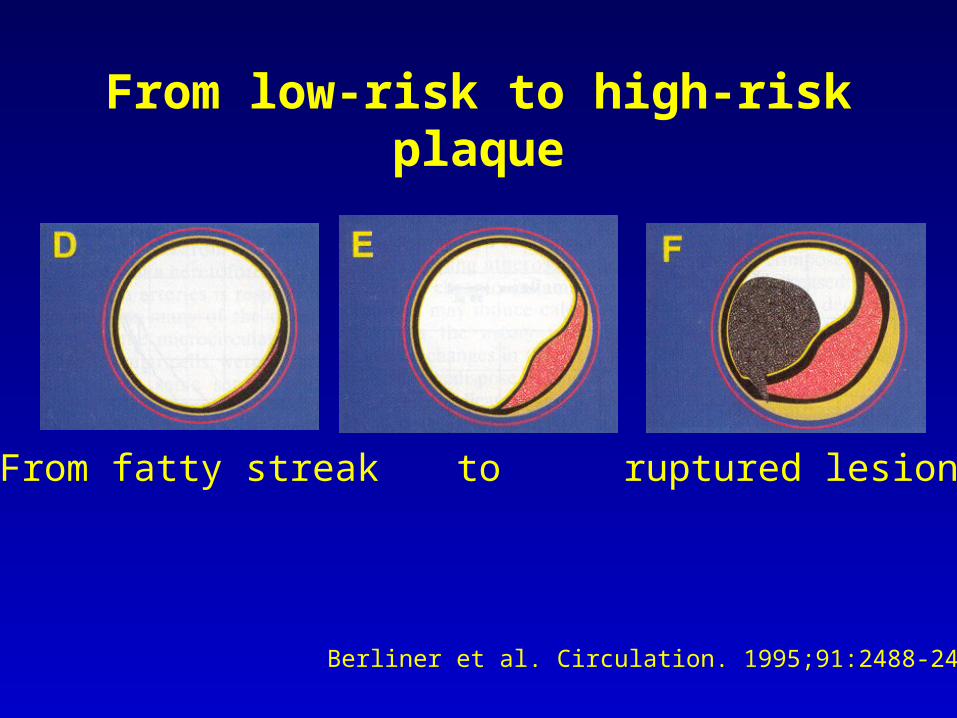
From low-risk to high-risk plaque
From fatty streak to ruptured lesion
Berliner et al. Circulation. 1995;91:2488-2496
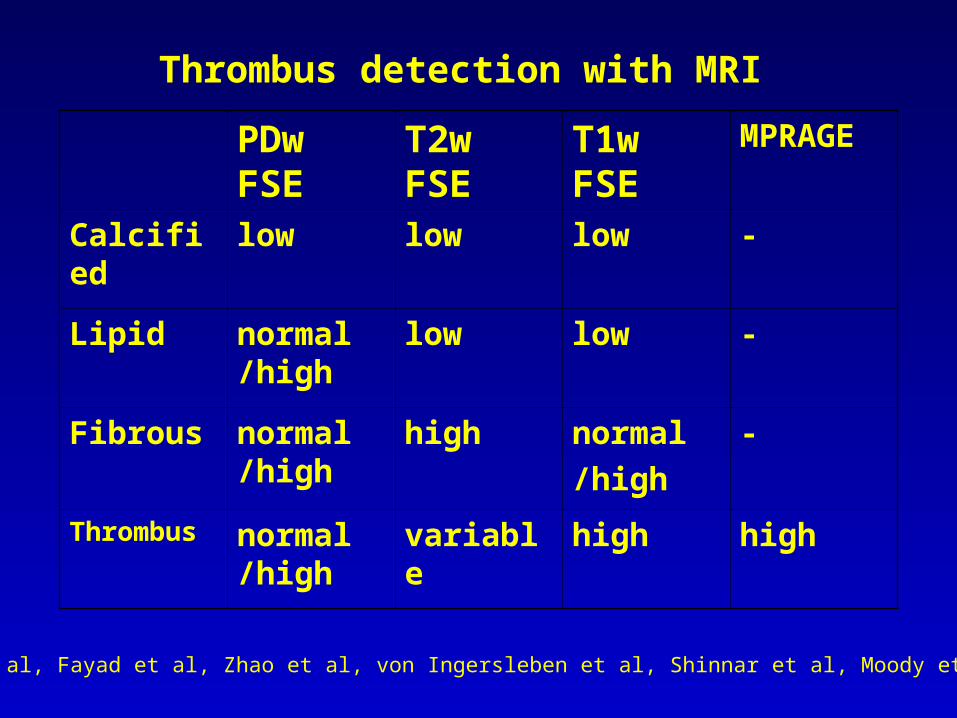
Thrombus detection with MRIPDw FSE
T2w FSE
T1w FSE
MPRAGE
Calcified
low low low -
Lipid normal /high
low low -
Fibrous normal /high
high normal/high
-
Thrombus
normal /high
variable high high
Yuan et al, Fayad et al, Zhao et al, von Ingersleben et al, Shinnar et al, Moody et al.
Aim of the present study
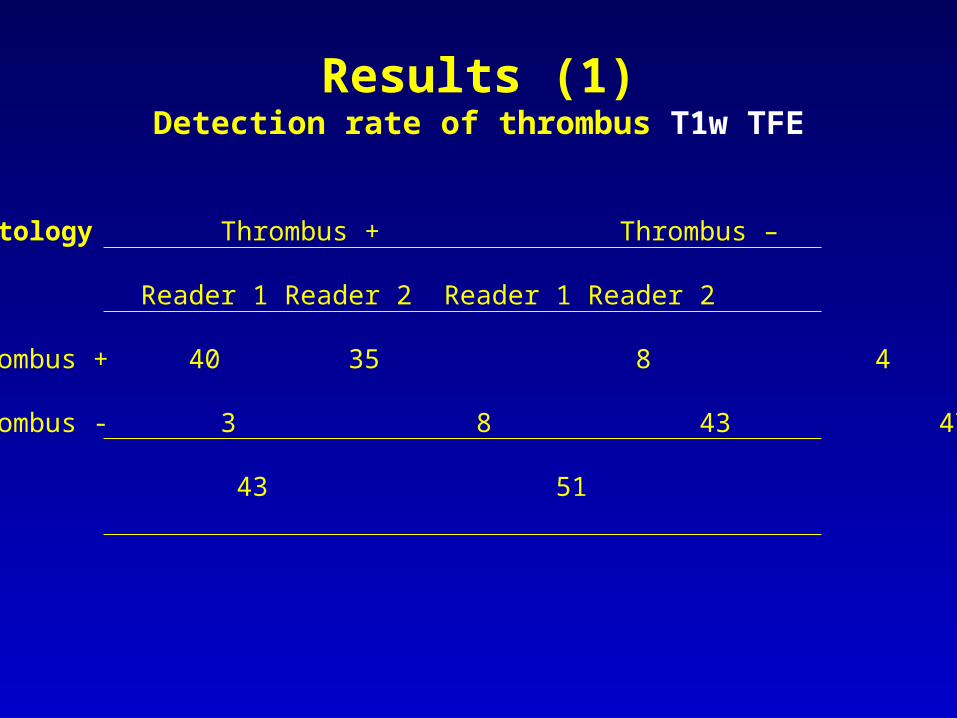
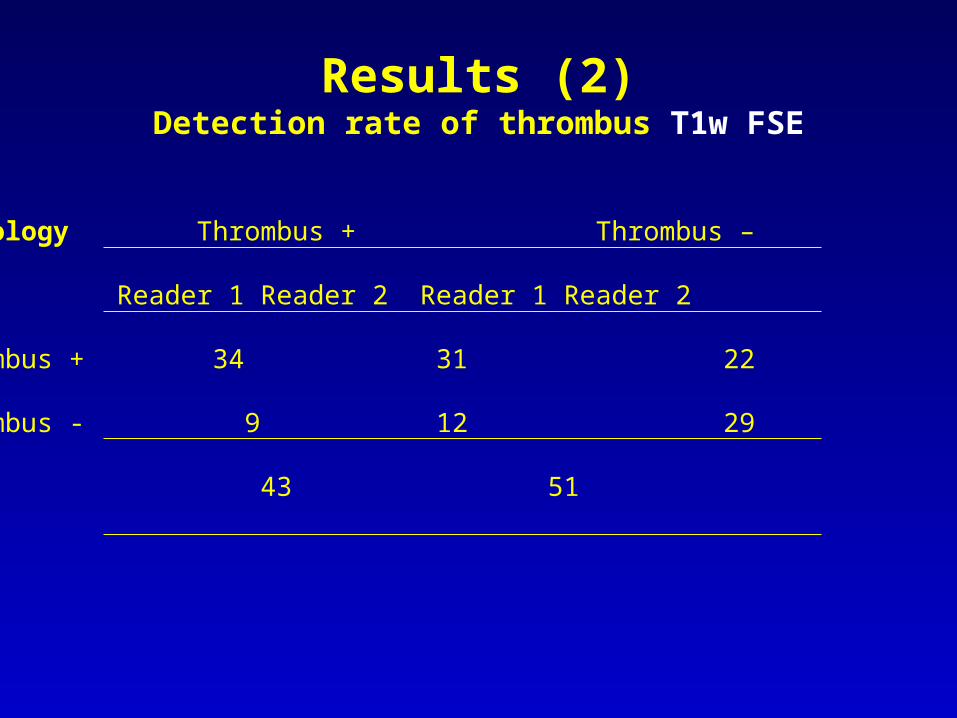
• Identification of thrombus in the carotid artery with high-resolution MRI and T1w Turbo Field Echo technique (T1w TFE or MPRAGE)
• Compare this technique with T1w Fast Spin Echo (FSE)
• Determine the performance and agreement of two observers for both techniques
Subjects & Methods (1)
• 11 symptomatic patients with a carotid stenosis of more than 70%
• Pre-operative MRI scan (mean 5 +/- 4 days)
• Pathology is gold standard
• High MR signal relative to muscle tissue = positive test result
Subjects & Methods (2)
• MRI slices were matched with the corresponding histological slices by Reader 1 (bifurcation, ink, gross morphological features)
╸╹
Subjects & Methods (3)• Reader 2 scored the same by Reader 1 marked locations (unaware of the results of Reader 1)
Histology:
• Gross assignment of major plaque components (fibrous tissue, lipid core, calcification, thrombus)
• Only areas with pre-dominantly one of these tissue types were marked
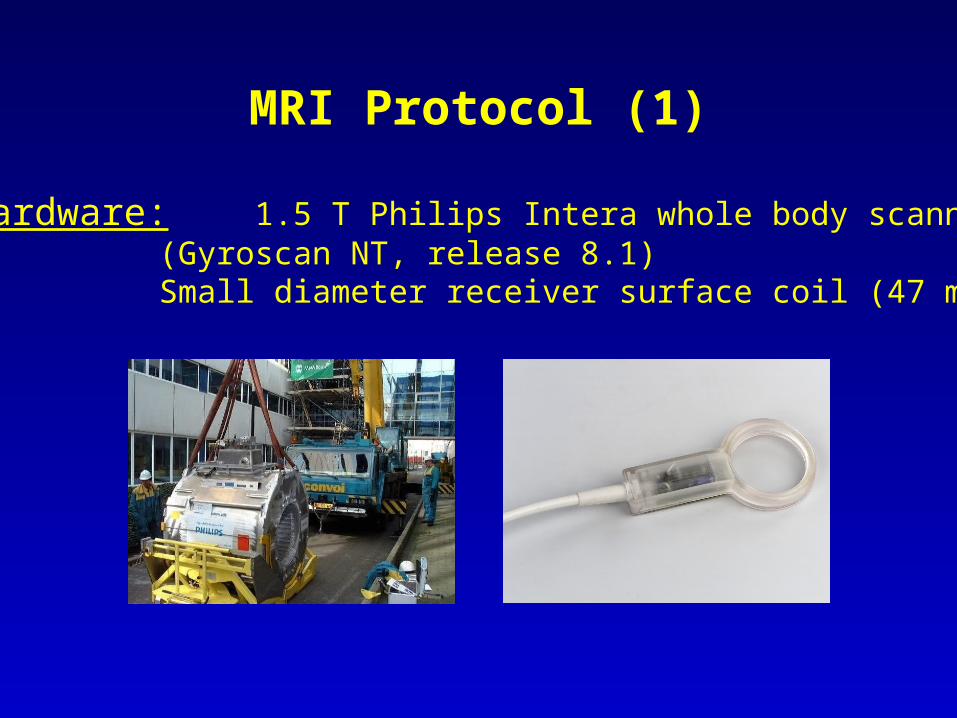
MRI Protocol (1)
Hardware: 1.5 T Philips Intera whole body scanner(Gyroscan NT, release 8.1)Small diameter receiver surface coil (47 mm)
MRI Protocol (2) Technique turbo field echo fast spin echo
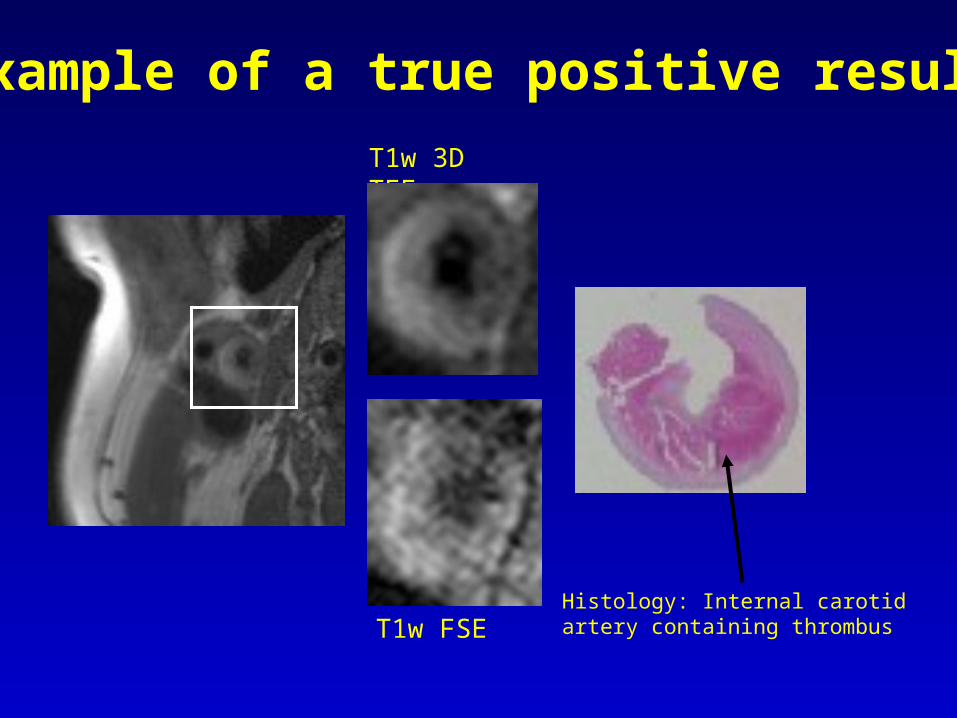
Carotid bifurcation; The arrows indicate two areas of histological proved fibrous tissue in the internal and external carotid artery. These areas have high signal intensity in FSE, but not in TFE
T1w 3D TFET1w FSE
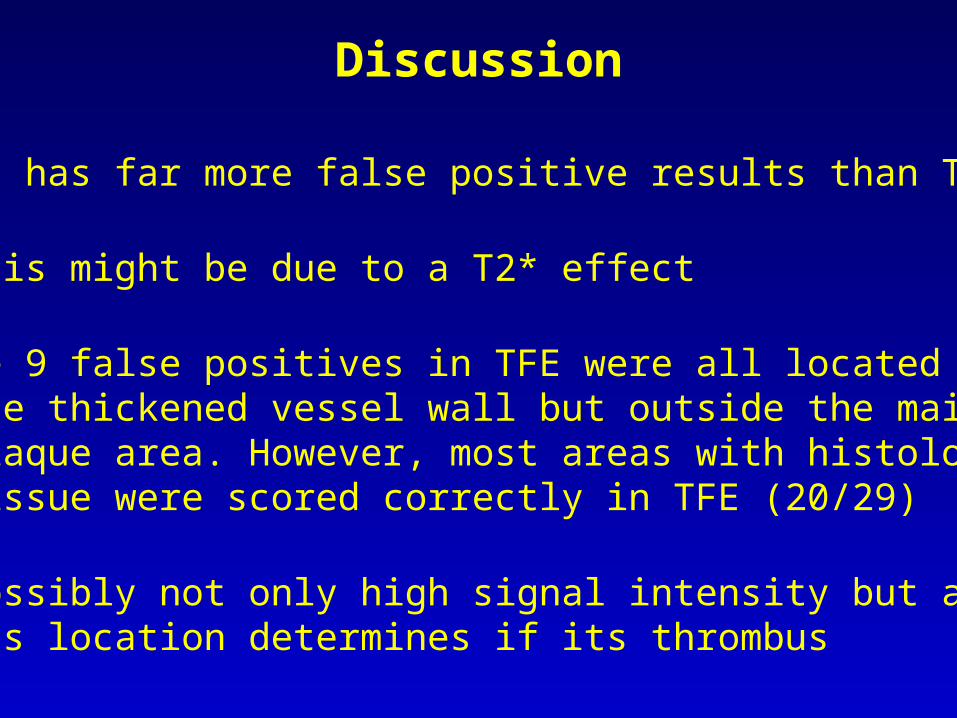
Discussion
• FSE has far more false positive results than TFE
-this might be due to a T2* effect
• The 9 false positives in TFE were all located within the thickened vessel wall but outside the main plaque area. However, most areas with histological tissue were scored correctly in TFE (20/29)
-possibly not only high signal intensity but also its location determines if its thrombus
Conclusions
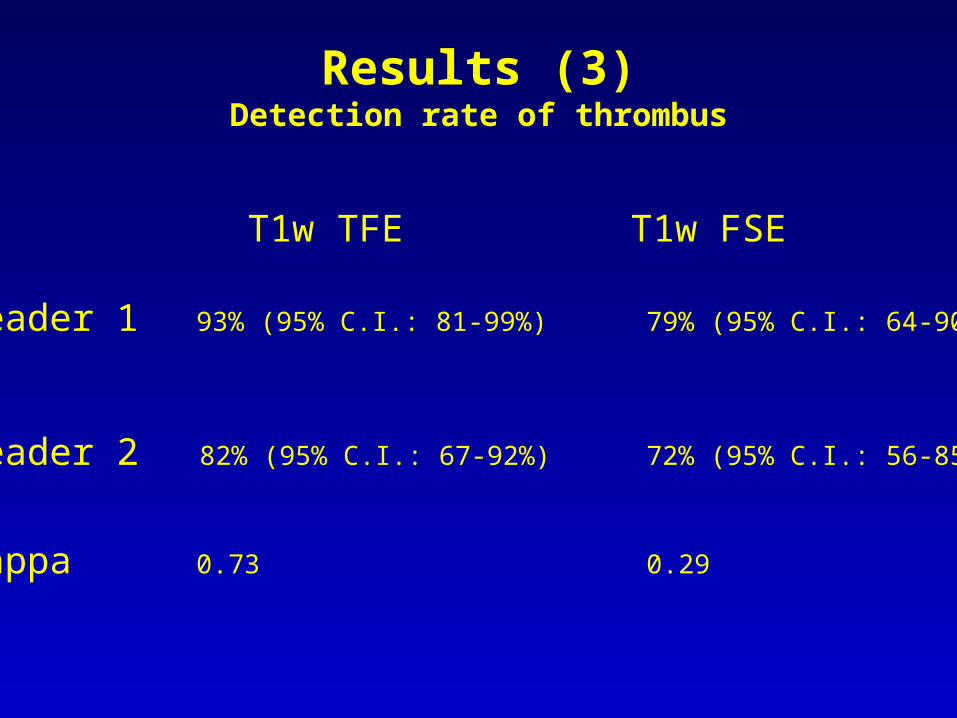
• Thrombus can be accurately detected with T1w TFEhigh-resolution MRI
• FSE performed significantly worse
• Two readers could detect more than 80% of histological proven thrombi using T1w TFE (Kappa=0.73)