6.1 INTRODUCTION Objective of financial management is to maximize wealth. Here wealth means market value. Value is directly related to performance of company and inversely related to expectation of investors. In turn expectation of investor is dependent on risk of the company. Therefore, to maximize value company should try to manage its risk. This risk may be business risk, financial risk or both. In this chapter we will discuss factors that influence business and financial risks.
6.2 MEANING AND TYPES OF LEVERAGE 6.2.1 Meaning of Leverage
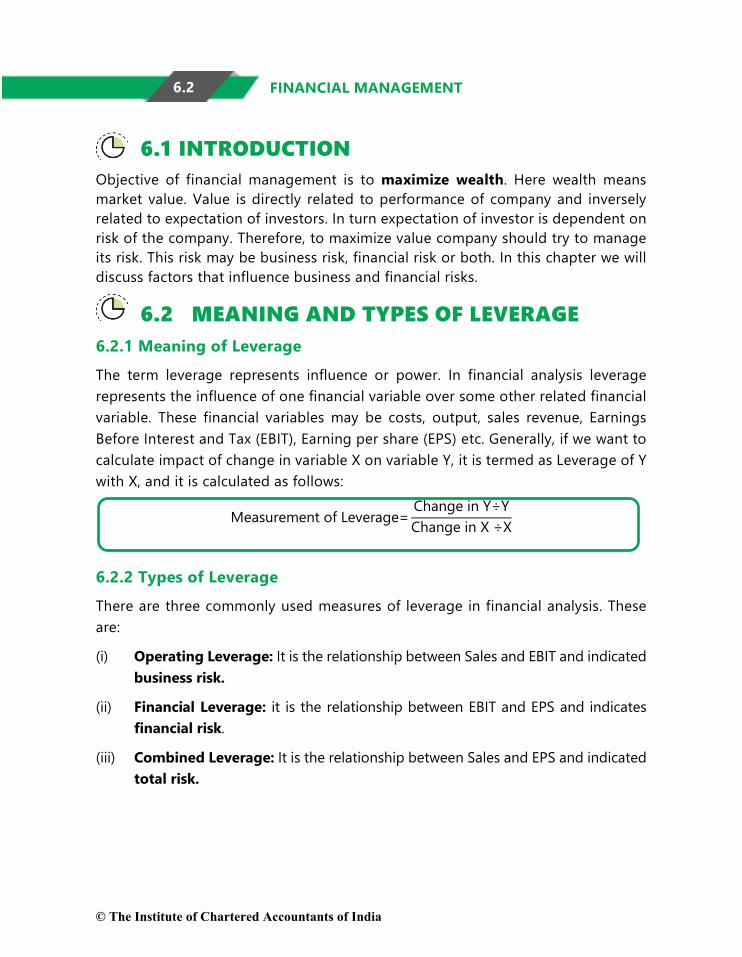
The term leverage represents influence or power. In financial analysis leverage represents the influence of one financial variable over some other related financial variable. These financial variables may be costs, output, sales revenue, Earnings Before Interest and Tax (EBIT), Earning per share (EPS) etc. Generally, if we want to calculate impact of change in variable X on variable Y, it is termed as Leverage of Y with X, and it is calculated as follows:
Measurement of Leverage=Change in Y÷YChange in X ÷X
6.2.2 Types of Leverage
There are three commonly used measures of leverage in financial analysis. These are:
(i) Operating Leverage: It is the relationship between Sales and EBIT and indicated business risk.
(ii) Financial Leverage: it is the relationship between EBIT and EPS and indicates financial risk.
(iii) Combined Leverage: It is the relationship between Sales and EPS and indicated total risk.
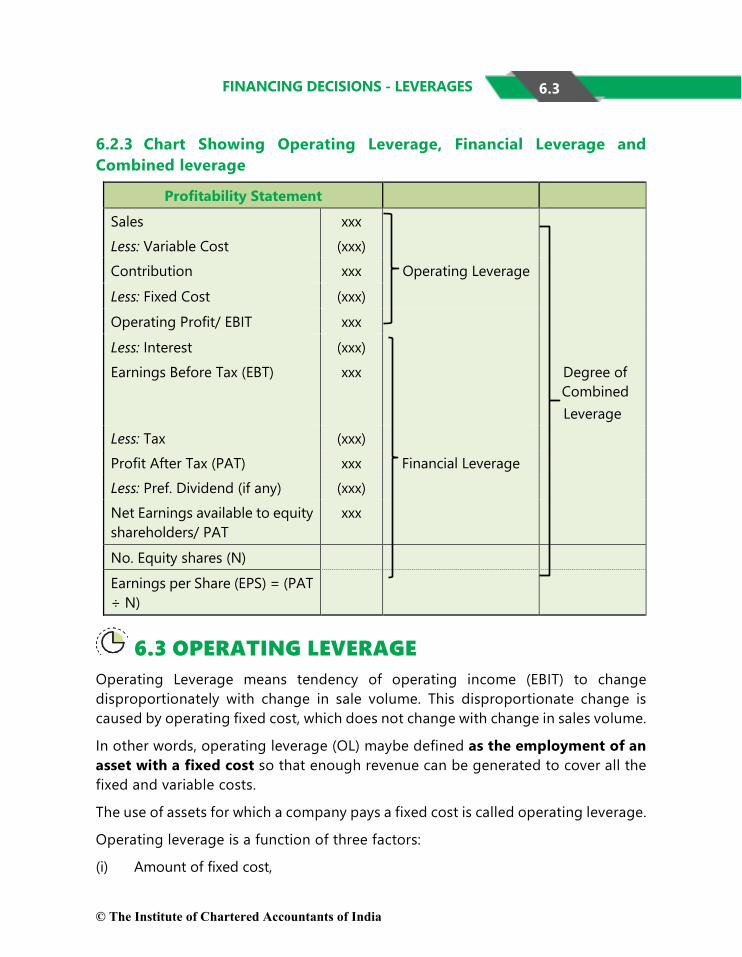
6.3 OPERATING LEVERAGE Operating Leverage means tendency of operating income (EBIT) to change disproportionately with change in sale volume. This disproportionate change is caused by operating fixed cost, which does not change with change in sales volume.
In other words, operating leverage (OL) maybe defined as the employment of an asset with a fixed cost so that enough revenue can be generated to cover all the fixed and variable costs.
The use of assets for which a company pays a fixed cost is called operating leverage.
Operating leverage is a function of three factors:
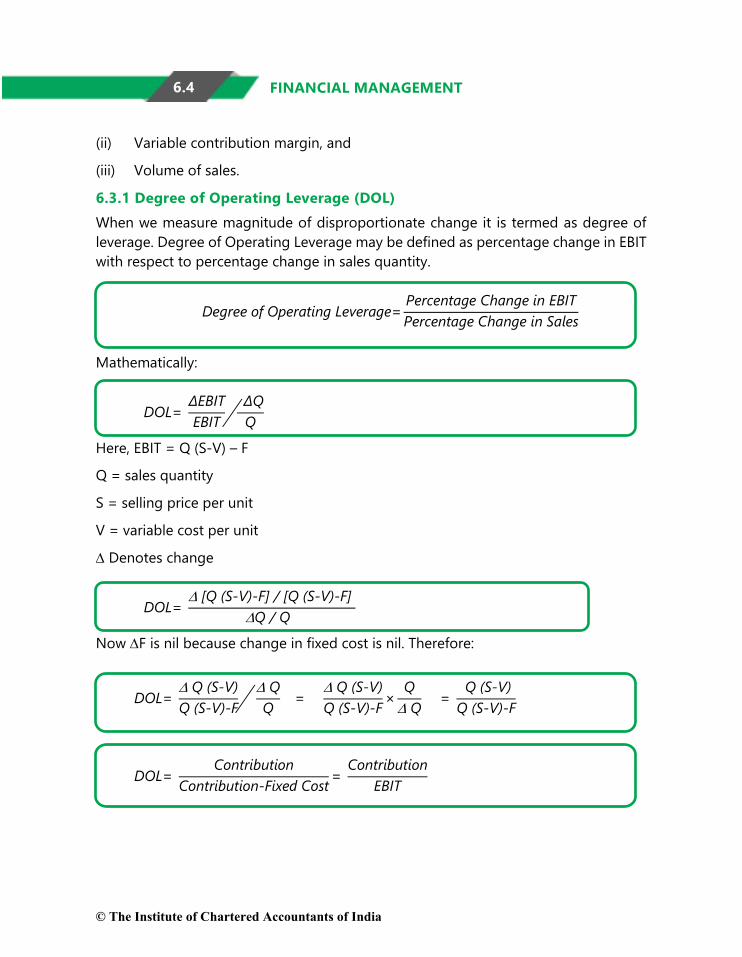
6.3.1 Degree of Operating Leverage (DOL) When we measure magnitude of disproportionate change it is termed as degree of leverage. Degree of Operating Leverage may be defined as percentage change in EBIT with respect to percentage change in sales quantity.
Degree of Operating Leverage=Percentage Change in EBITPercentage Change in Sales
Mathematically:
DOL= ∆EBITEBIT
∆QQ
�
Here, EBIT = Q (S-V) – F
Q = sales quantity
S = selling price per unit
V = variable cost per unit
∆ Denotes change
DOL= ∆ [Q (S-V)-F] / [Q (S-V)-F]
∆Q / Q
Now ∆F is nil because change in fixed cost is nil. Therefore:
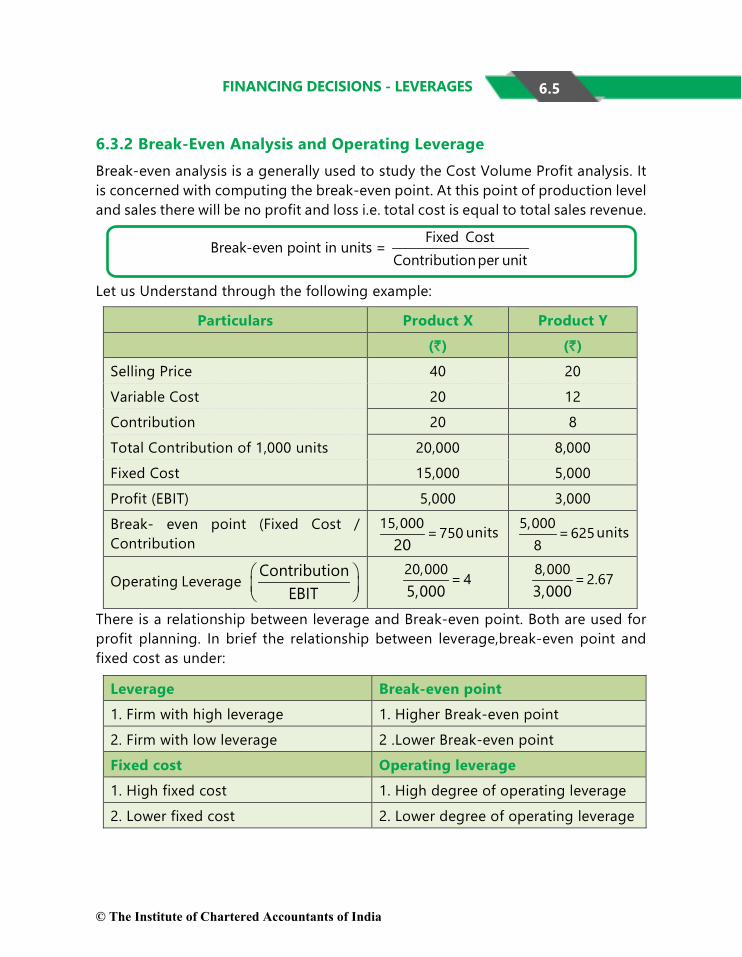
6.3.2 Break-Even Analysis and Operating Leverage Break-even analysis is a generally used to study the Cost Volume Profit analysis. It is concerned with computing the break-even point. At this point of production level and sales there will be no profit and loss i.e. total cost is equal to total sales revenue.
Break-even point in units = Fixed Cost
Contribution per unit
Let us Understand through the following example:
Particulars Product X Product Y (`) (`) Selling Price 40 20 Variable Cost 20 12 Contribution 20 8 Total Contribution of 1,000 units 20,000 8,000 Fixed Cost 15,000 5,000 Profit (EBIT) 5,000 3,000 Break- even point (Fixed Cost / Contribution
15,000 = 75020
units 5,000 = 6258
units
Operating Leverage Contribution
EBIT
20,000 = 45,000
8,000 = 2.673,000
There is a relationship between leverage and Break-even point. Both are used for profit planning. In brief the relationship between leverage,break-even point and fixed cost as under:
Leverage Break-even point 1. Firm with high leverage 1. Higher Break-even point 2. Firm with low leverage 2 .Lower Break-even point Fixed cost Operating leverage 1. High fixed cost 1. High degree of operating leverage 2. Lower fixed cost 2. Lower degree of operating leverage
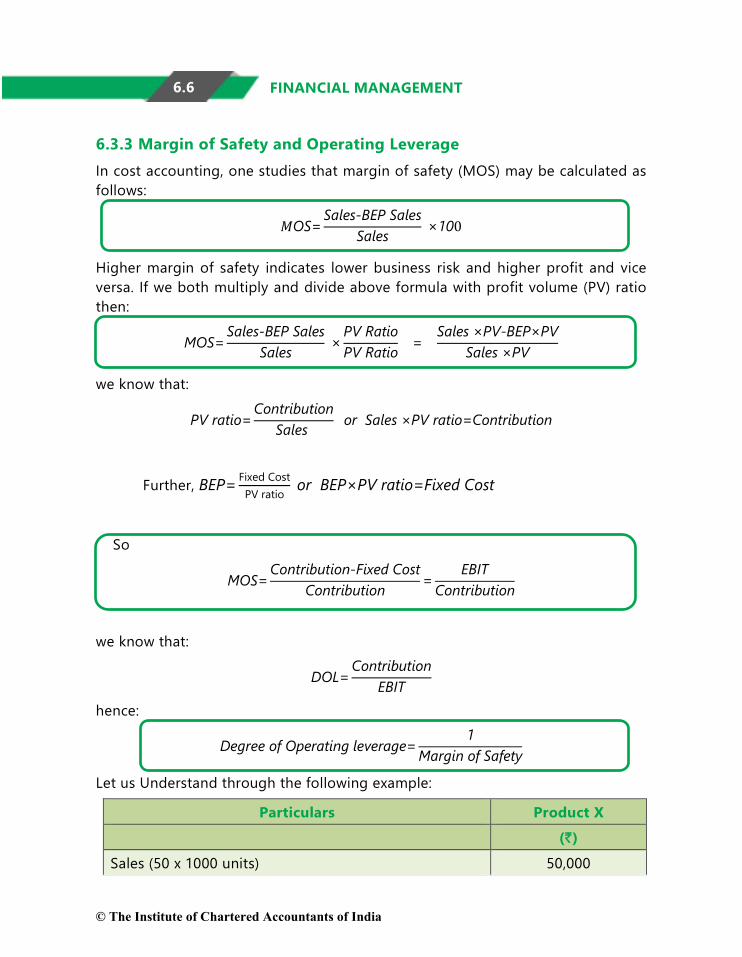
6.3.3 Margin of Safety and Operating Leverage In cost accounting, one studies that margin of safety (MOS) may be calculated as follows:
𝑀𝑀OS=Sales-BEP Sales
Sales ×100
Higher margin of safety indicates lower business risk and higher profit and vice versa. If we both multiply and divide above formula with profit volume (PV) ratio then:
MOS=Sales-BEP Sales
Sales ×
PV RatioPV Ratio
= Sales ×PV-BEP×PV
Sales ×PV
we know that:
PV ratio=Contribution
Sales or Sales ×PV ratio=Contribution
Further, BEP= Fixed CostPV ratio
or BEP×PV ratio=Fixed Cost
So
MOS=Contribution-Fixed Cost
Contribution=
EBITContribution
we know that:
DOL=Contribution
EBIT
hence:
Degree of Operating leverage=1
Margin of Safety
Let us Understand through the following example:
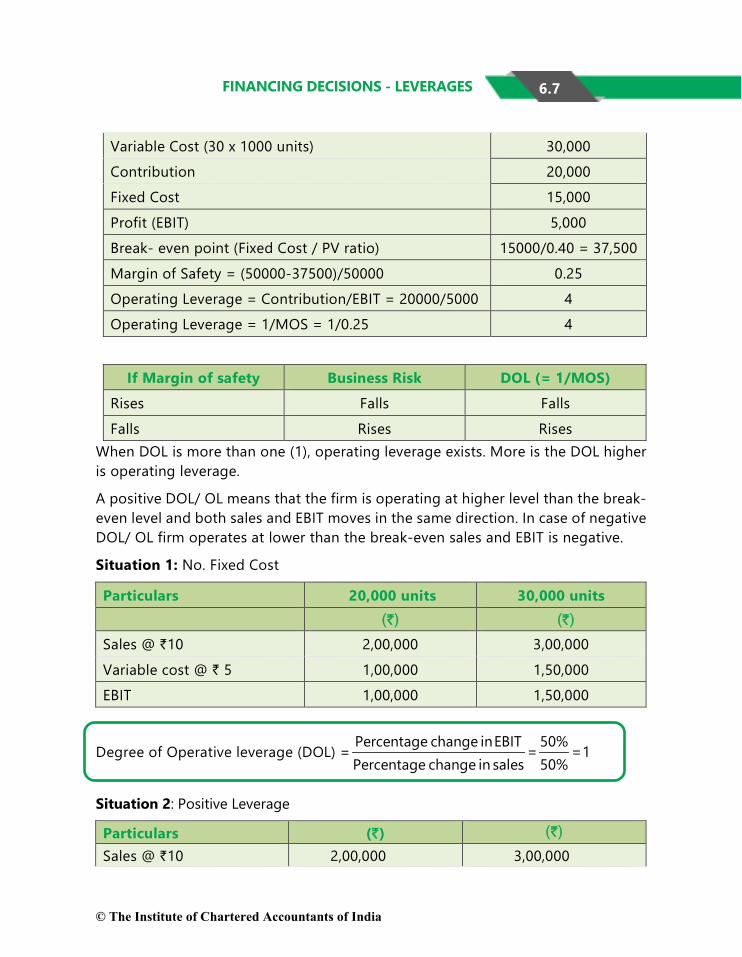
Particulars Product X (`) Sales (50 x 1000 units) 50,000
If Margin of safety Business Risk DOL (= 1/MOS) Rises Falls Falls Falls Rises Rises
When DOL is more than one (1), operating leverage exists. More is the DOL higher is operating leverage.
A positive DOL/ OL means that the firm is operating at higher level than the break- even level and both sales and EBIT moves in the same direction. In case of negative DOL/ OL firm operates at lower than the break-even sales and EBIT is negative.
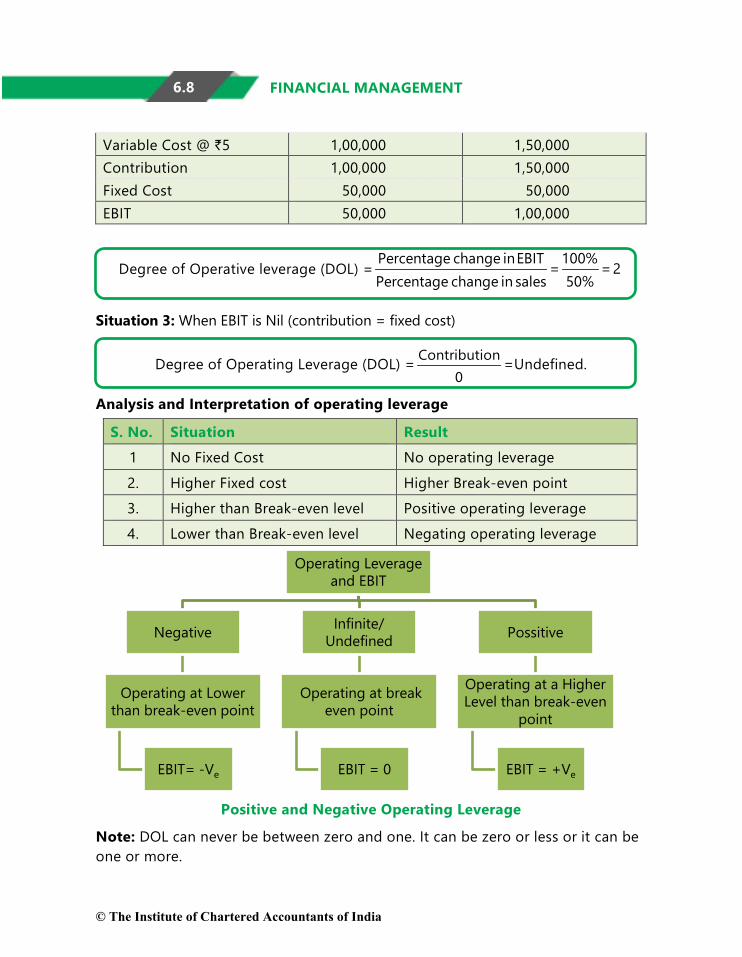
Degree of Operative leverage (DOL) =Percentage change in EBIT 100% = = 2Percentage change in sales 50%
Situation 3: When EBIT is Nil (contribution = fixed cost)
Degree of Operating Leverage (DOL) = Contribution0
=Undefined.
Analysis and Interpretation of operating leverage
S. No. Situation Result 1 No Fixed Cost No operating leverage 2. Higher Fixed cost Higher Break-even point 3. Higher than Break-even level Positive operating leverage 4. Lower than Break-even level Negating operating leverage
Positive and Negative Operating Leverage
Note: DOL can never be between zero and one. It can be zero or less or it can be one or more.
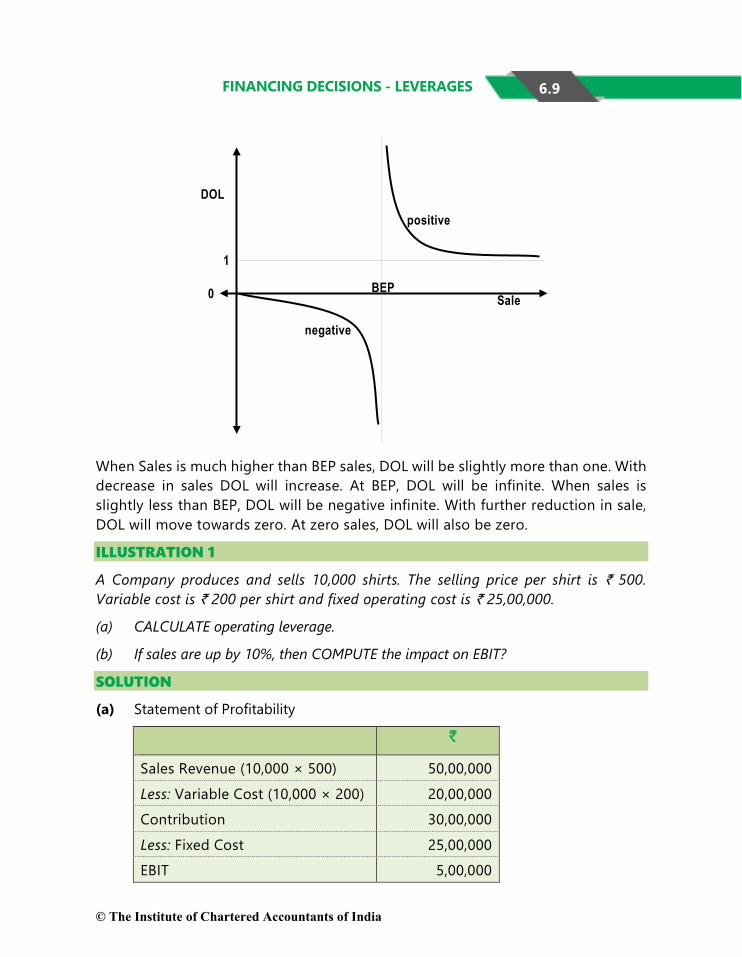
When Sales is much higher than BEP sales, DOL will be slightly more than one. With decrease in sales DOL will increase. At BEP, DOL will be infinite. When sales is slightly less than BEP, DOL will be negative infinite. With further reduction in sale, DOL will move towards zero. At zero sales, DOL will also be zero.
ILLUSTRATION 1
A Company produces and sells 10,000 shirts. The selling price per shirt is ` 500. Variable cost is ` 200 per shirt and fixed operating cost is ` 25,00,000.
(a) CALCULATE operating leverage.
(b) If sales are up by 10%, then COMPUTE the impact on EBIT?
CALCULATE the operating leverage for each of the four firms A, B, C and D from the following price and cost data:
Firms A (`) B(`) C(`) D(`)
Sale price per unit 20 32 50 70
Variable cost per unit 6 16 20 50
Fixed operating cost 60,000 40,000 1,00,000 Nil
What calculations can you draw with respect to levels of fixed cost and the degree of operating leverage result? Explain. Assume number of units sold is 5,000.
SOLUTION
Firms A B C D Sales (units) 5,000 5,000 5,000 5,000 Sales revenue (Units × price) (`) 1,00,000 1,60,000 2,50,000 3,50,000 Less: Variable cost (30,000) (80,000) (1,00,000) (2,50,000) (Units × variable cost per unit) (`) Less: Fixed operating costs (`) (60,000) (40,000) (1,00,000) Nil EBIT 10,000 40,000 50,000 1,00,000
Current sales (S) - Variable costs (VC)DOL = Current EBIT
1,00,000 30,00010,000
−= =
` `
` (A)DOL 7
1,60,000 80,00040,000−
= =` `
` (B)DOL 2
2,50,000 1,00,00050,000−
= =` `
` (C)DOL 3
3,50,000 2,50,0001,00,000
−= =
` `
` (D)DOL 1
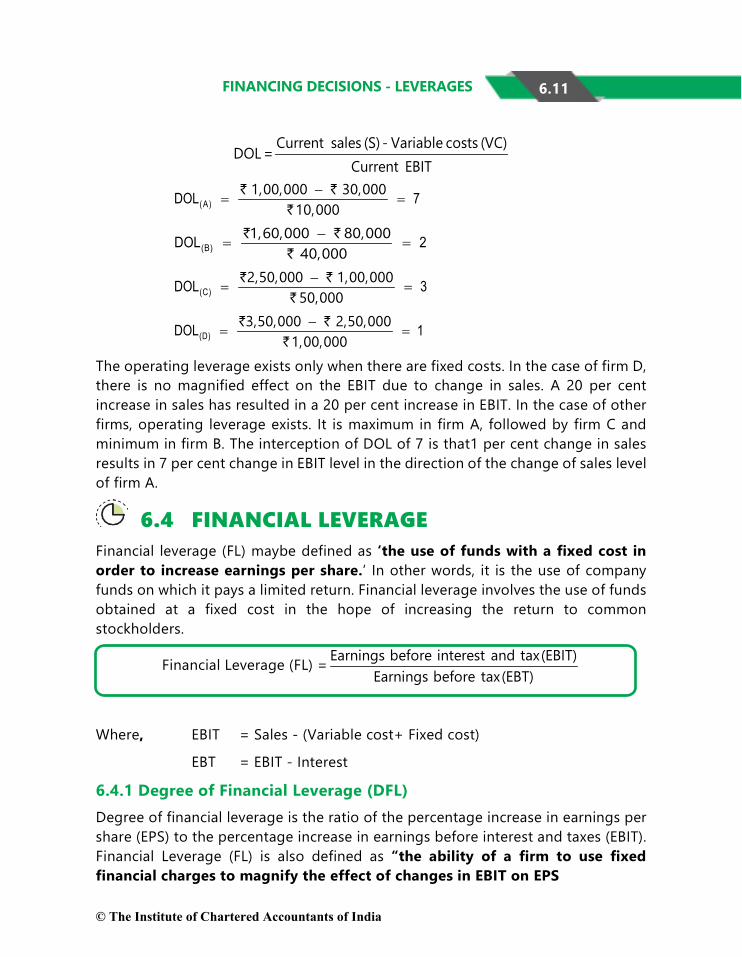
The operating leverage exists only when there are fixed costs. In the case of firm D, there is no magnified effect on the EBIT due to change in sales. A 20 per cent increase in sales has resulted in a 20 per cent increase in EBIT. In the case of other firms, operating leverage exists. It is maximum in firm A, followed by firm C and minimum in firm B. The interception of DOL of 7 is that1 per cent change in sales results in 7 per cent change in EBIT level in the direction of the change of sales level of firm A.
6.4 FINANCIAL LEVERAGE Financial leverage (FL) maybe defined as ‘the use of funds with a fixed cost in order to increase earnings per share.’ In other words, it is the use of company funds on which it pays a limited return. Financial leverage involves the use of funds obtained at a fixed cost in the hope of increasing the return to common stockholders.
Financial Leverage (FL) = Earnings before interest and tax(EBIT)Earnings before tax(EBT)
Where, EBIT = Sales - (Variable cost+ Fixed cost)
EBT = EBIT - Interest
6.4.1 Degree of Financial Leverage (DFL) Degree of financial leverage is the ratio of the percentage increase in earnings per share (EPS) to the percentage increase in earnings before interest and taxes (EBIT). Financial Leverage (FL) is also defined as “the ability of a firm to use fixed financial charges to magnify the effect of changes in EBIT on EPS
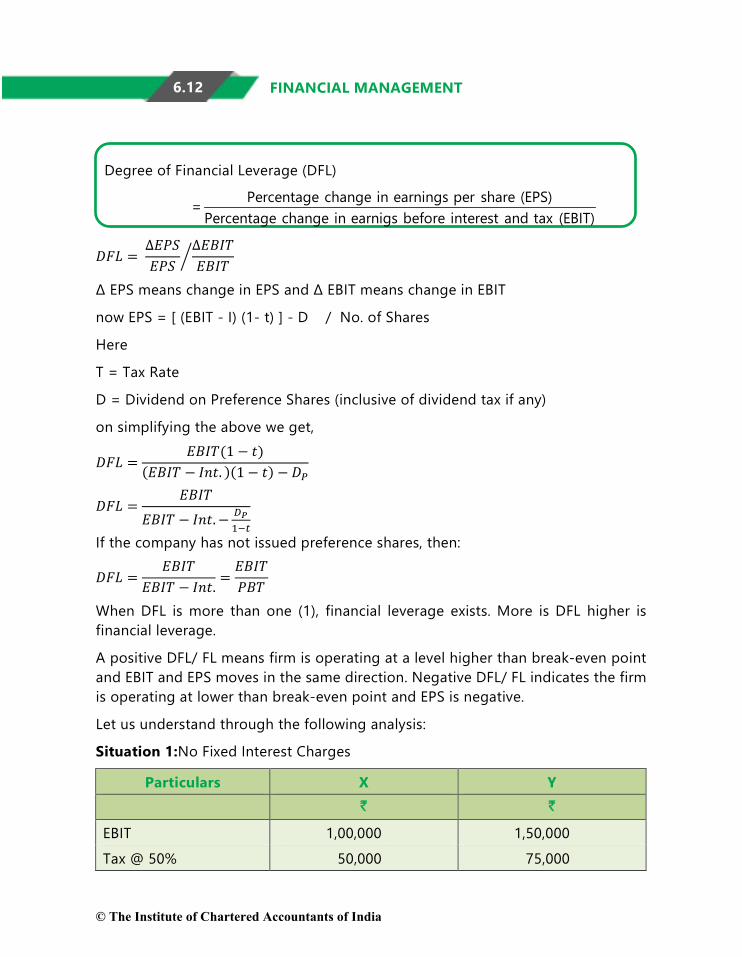
Percentage change in earnings per share (EPS)Percentage change in earnigs before interest and tax (EBIT)
𝐷𝐷𝐷𝐷𝐷𝐷 = ∆𝐸𝐸𝐸𝐸𝐸𝐸𝐸𝐸𝐸𝐸𝐸𝐸
∆𝐸𝐸𝐸𝐸𝐸𝐸𝐸𝐸𝐸𝐸𝐸𝐸𝐸𝐸𝐸𝐸
�
Δ EPS means change in EPS and Δ EBIT means change in EBIT
now EPS = [ (EBIT - I) (1- t) ] - D / No. of Shares
Here
T = Tax Rate
D = Dividend on Preference Shares (inclusive of dividend tax if any)
on simplifying the above we get,
𝐷𝐷𝐷𝐷𝐷𝐷 =𝐸𝐸𝐸𝐸𝐸𝐸𝐸𝐸(1 − 𝑡𝑡)
(𝐸𝐸𝐸𝐸𝐸𝐸𝐸𝐸 − 𝐸𝐸𝐼𝐼𝑡𝑡. )(1 − 𝑡𝑡) − 𝐷𝐷𝑃𝑃
𝐷𝐷𝐷𝐷𝐷𝐷 =𝐸𝐸𝐸𝐸𝐸𝐸𝐸𝐸
𝐸𝐸𝐸𝐸𝐸𝐸𝐸𝐸 − 𝐸𝐸𝐼𝐼𝑡𝑡.− 𝐷𝐷𝑃𝑃1−𝑡𝑡
If the company has not issued preference shares, then:
𝐷𝐷𝐷𝐷𝐷𝐷 =𝐸𝐸𝐸𝐸𝐸𝐸𝐸𝐸
𝐸𝐸𝐸𝐸𝐸𝐸𝐸𝐸 − 𝐸𝐸𝐼𝐼𝑡𝑡.=𝐸𝐸𝐸𝐸𝐸𝐸𝐸𝐸𝐸𝐸𝐸𝐸𝐸𝐸
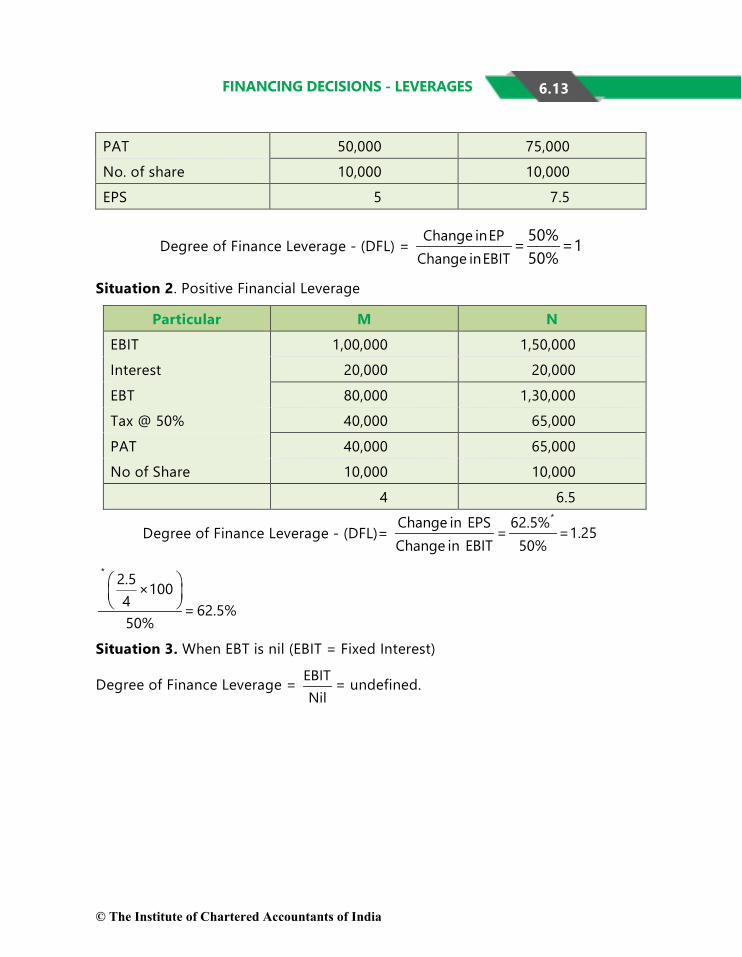
When DFL is more than one (1), financial leverage exists. More is DFL higher is financial leverage.
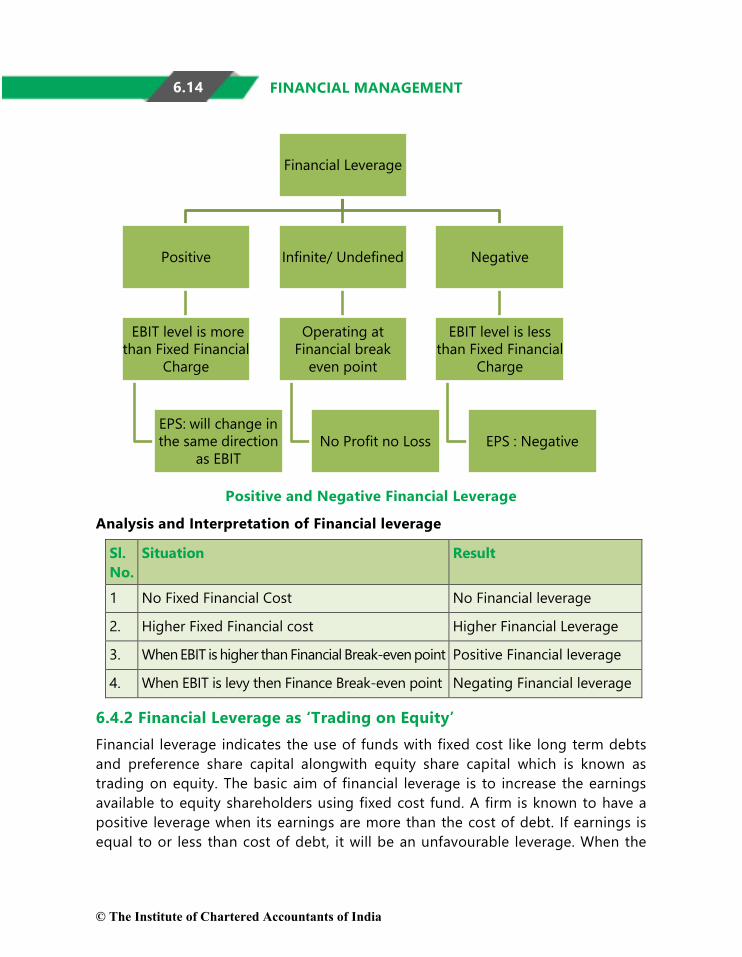
A positive DFL/ FL means firm is operating at a level higher than break-even point and EBIT and EPS moves in the same direction. Negative DFL/ FL indicates the firm is operating at lower than break-even point and EPS is negative.
3. When EBIT is higher than Financial Break-even point Positive Financial leverage
4. When EBIT is levy then Finance Break-even point Negating Financial leverage
6.4.2 Financial Leverage as ‘Trading on Equity’ Financial leverage indicates the use of funds with fixed cost like long term debts and preference share capital alongwith equity share capital which is known as trading on equity. The basic aim of financial leverage is to increase the earnings available to equity shareholders using fixed cost fund. A firm is known to have a positive leverage when its earnings are more than the cost of debt. If earnings is equal to or less than cost of debt, it will be an unfavourable leverage. When the
quantity of fixed cost fund is relatively high in comparison to equity capital it is said that the firm is ‘’trading on equity”.
6.4.3 Financial Leverage as a ‘Double edged Sword’ On one hand when cost of ‘fixed cost fund’ is less than the return on investment financial leverage will help to increase return on equity and EPS. The firm will also benefit from the saving of tax on interest on debts etc. However, when cost of debt will be more than the return it will affect return of equity and EPS unfavourably and as a result firm can be under financial distress. This is why financial leverage is known as “double edged sword”.
Effect on EPS and ROE:
When, ROI > Interest – Favourable – Advantage
When, ROI < Interest – Unfavourable – Disadvantage
When, ROI = Interest – Neutral – Neither advantage nor disadvantage.
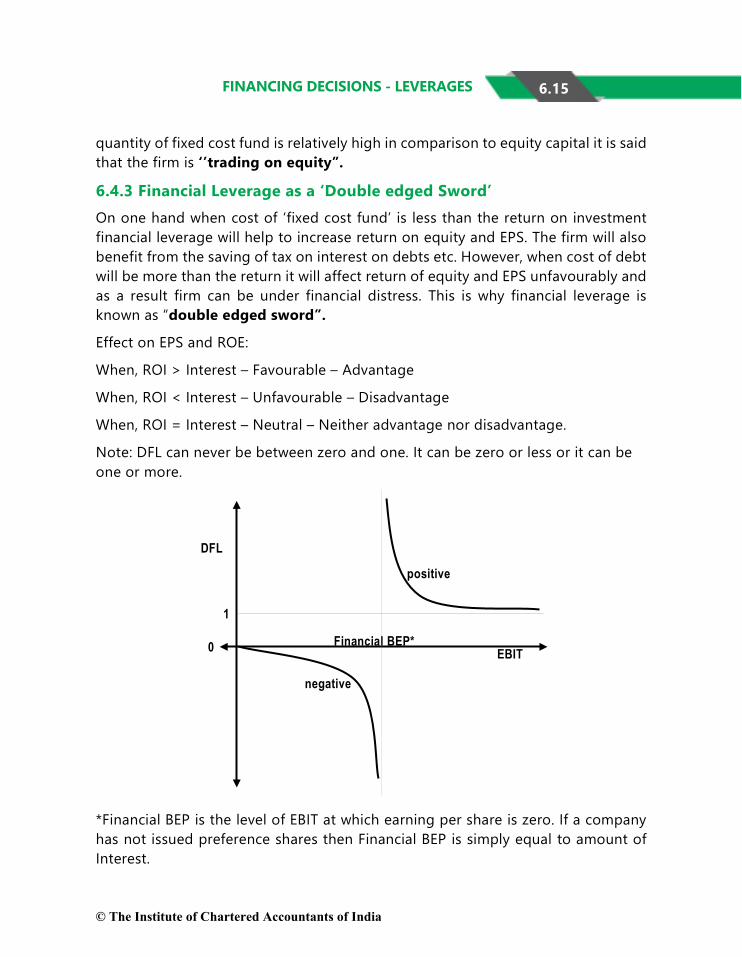
Note: DFL can never be between zero and one. It can be zero or less or it can be one or more.
*Financial BEP is the level of EBIT at which earning per share is zero. If a company has not issued preference shares then Financial BEP is simply equal to amount of Interest.
When EBIT is much higher than Financial BEP, DFL will be slightly more than one. With decrease in EBIT, DFL will increase. At Financial BEP, DFL will be infinite. When EBIT is slightly less than Financial BEP, DFL will be negative infinite. With further reduction in EBIT, DFL will move towards zero. At zero EBIT, DFL will also be zero.
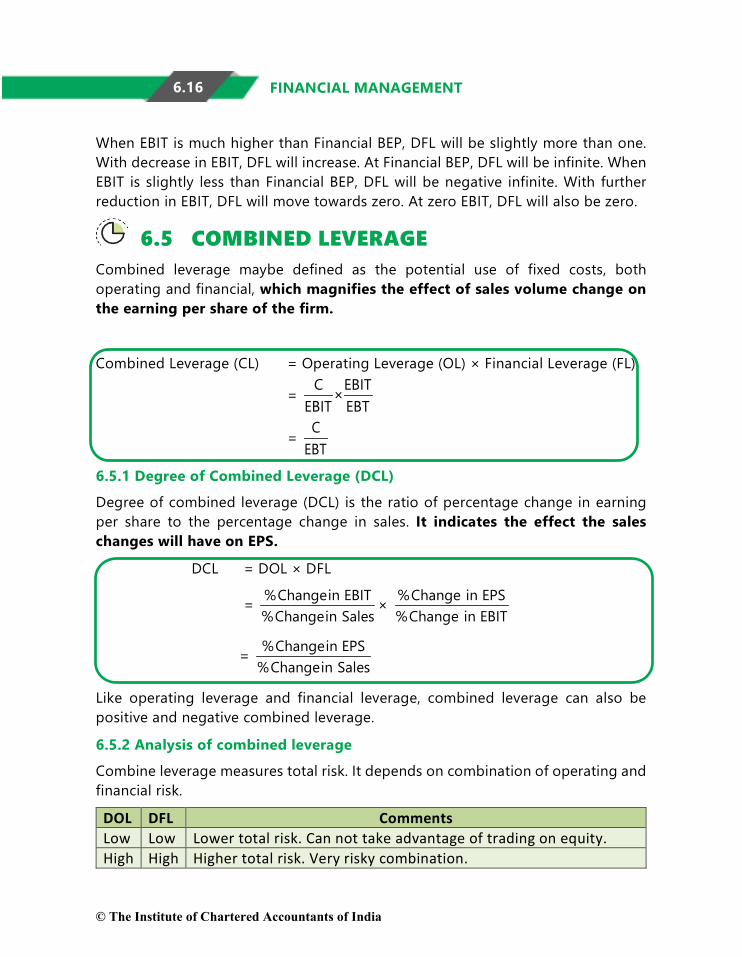
6.5 COMBINED LEVERAGE Combined leverage maybe defined as the potential use of fixed costs, both operating and financial, which magnifies the effect of sales volume change on the earning per share of the firm.
Degree of combined leverage (DCL) is the ratio of percentage change in earning per share to the percentage change in sales. It indicates the effect the sales changes will have on EPS.
DCL = DOL × DFL
= %Changein EBIT%Changein Sales
× %Change in EPS%Change in EBIT
= %Changein EPS%Changein Sales
Like operating leverage and financial leverage, combined leverage can also be positive and negative combined leverage.
6.5.2 Analysis of combined leverage
Combine leverage measures total risk. It depends on combination of operating and financial risk.
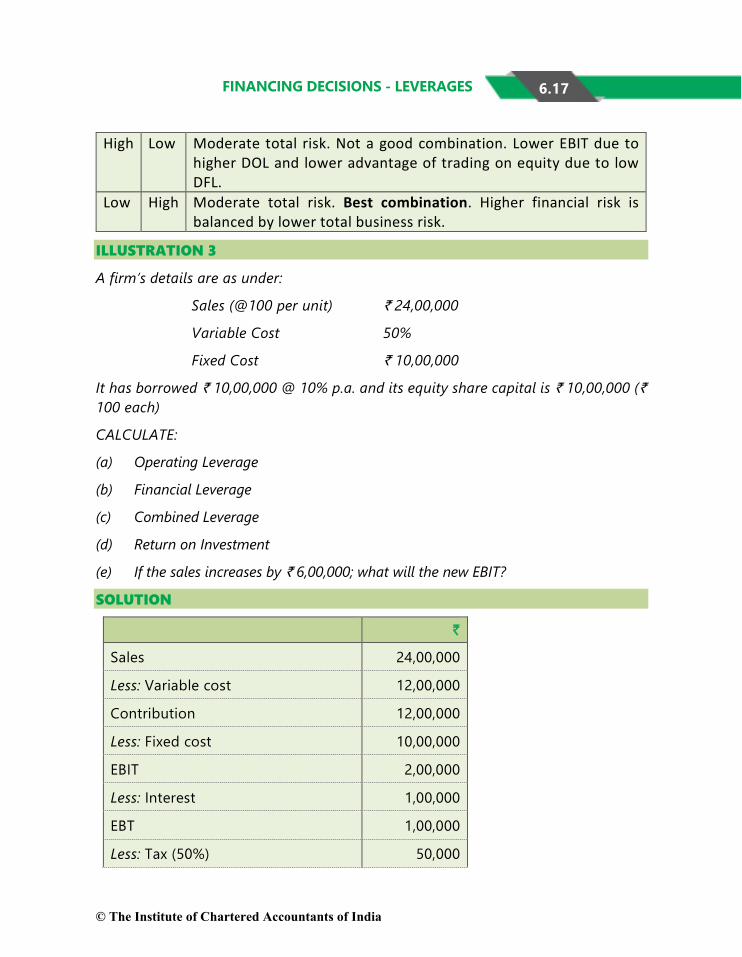
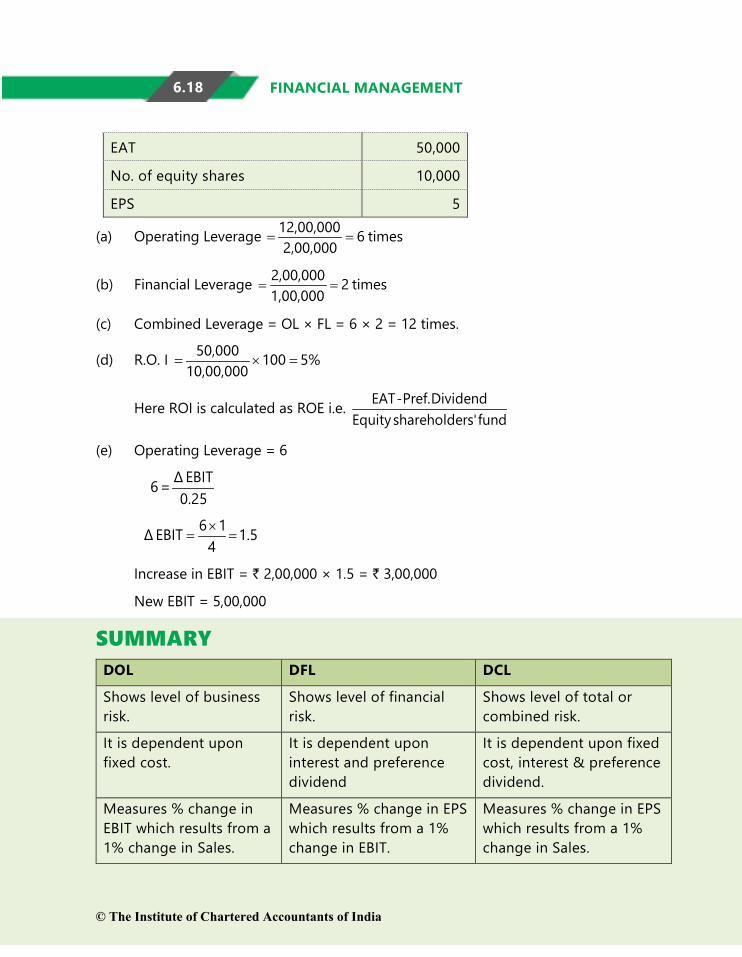
DOL DFL Comments Low Low Lower total risk. Can not take advantage of trading on equity. High High Higher total risk. Very risky combination.
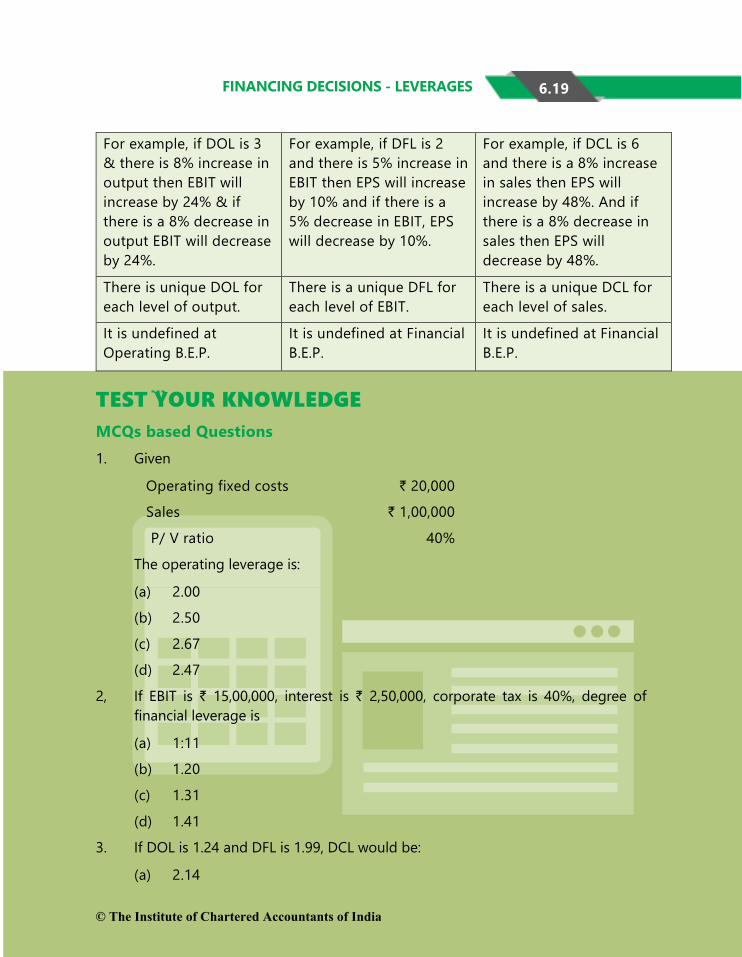
For example, if DOL is 3 & there is 8% increase in output then EBIT will increase by 24% & if there is a 8% decrease in output EBIT will decrease by 24%.
For example, if DFL is 2 and there is 5% increase in EBIT then EPS will increase by 10% and if there is a 5% decrease in EBIT, EPS will decrease by 10%.
For example, if DCL is 6 and there is a 8% increase in sales then EPS will increase by 48%. And if there is a 8% decrease in sales then EPS will decrease by 48%.
There is unique DOL for each level of output.
There is a unique DFL for each level of EBIT.
There is a unique DCL for each level of sales.
It is undefined at Operating B.E.P.
It is undefined at Financial B.E.P.
It is undefined at Financial B.E.P.
TEST YOUR KNOWLEDGE MCQs based Questions 1. Given
Operating fixed costs ` 20,000
Sales ` 1,00,000
P/ V ratio 40%
The operating leverage is:
(a) 2.00
(b) 2.50
(c) 2.67
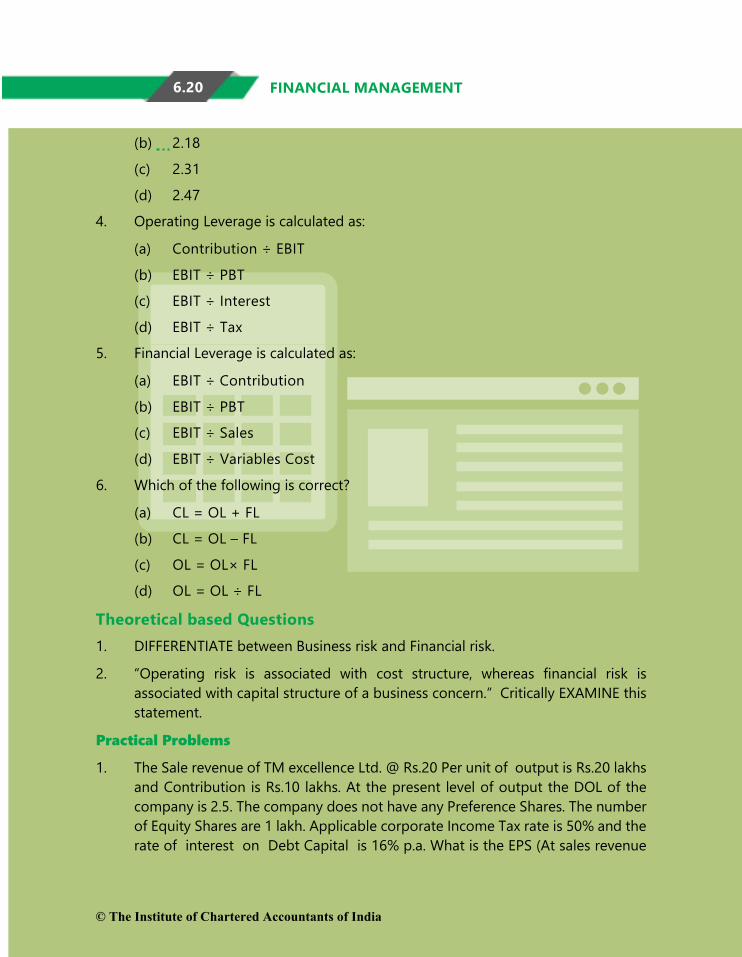
(d) 2.47
2, If EBIT is ` 15,00,000, interest is ` 2,50,000, corporate tax is 40%, degree of financial leverage is
Theoretical based Questions 1. DIFFERENTIATE between Business risk and Financial risk.
2. “Operating risk is associated with cost structure, whereas financial risk is associated with capital structure of a business concern.” Critically EXAMINE this statement.
Practical Problems
1. The Sale revenue of TM excellence Ltd. @ Rs.20 Per unit of output is Rs.20 lakhs and Contribution is Rs.10 lakhs. At the present level of output the DOL of the company is 2.5. The company does not have any Preference Shares. The number of Equity Shares are 1 lakh. Applicable corporate Income Tax rate is 50% and the rate of interest on Debt Capital is 16% p.a. What is the EPS (At sales revenue
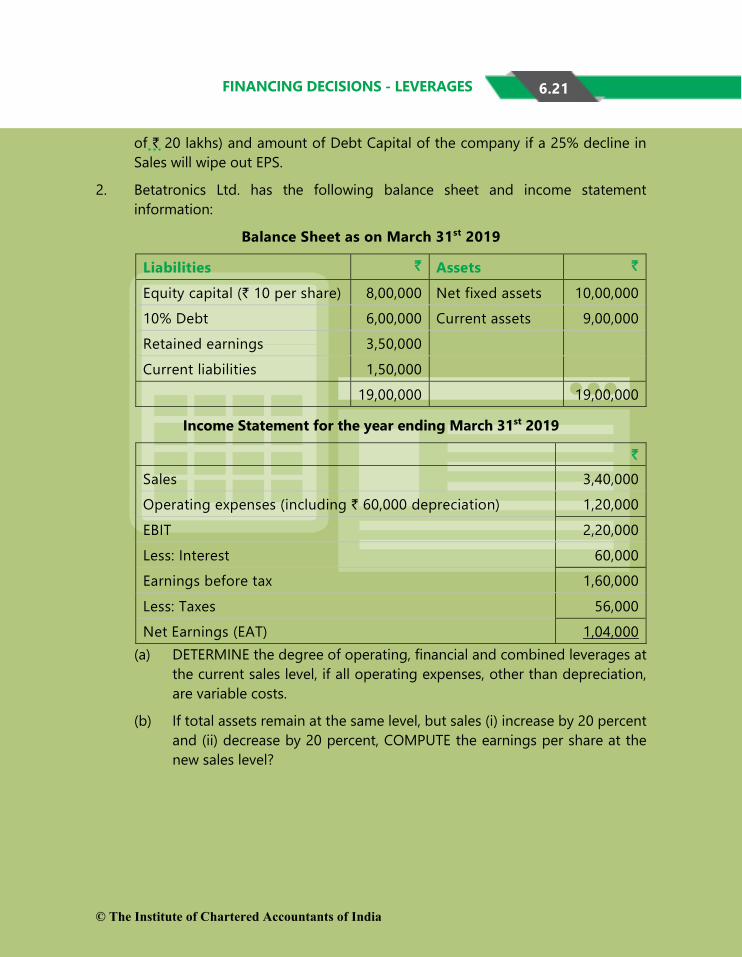
of ` 20 lakhs) and amount of Debt Capital of the company if a 25% decline in Sales will wipe out EPS.
2. Betatronics Ltd. has the following balance sheet and income statement information:
Balance Sheet as on March 31st 2019
Liabilities ` Assets `
Equity capital (` 10 per share) 8,00,000 Net fixed assets 10,00,000 10% Debt 6,00,000 Current assets 9,00,000 Retained earnings 3,50,000 Current liabilities 1,50,000 19,00,000 19,00,000
Income Statement for the year ending March 31st 2019
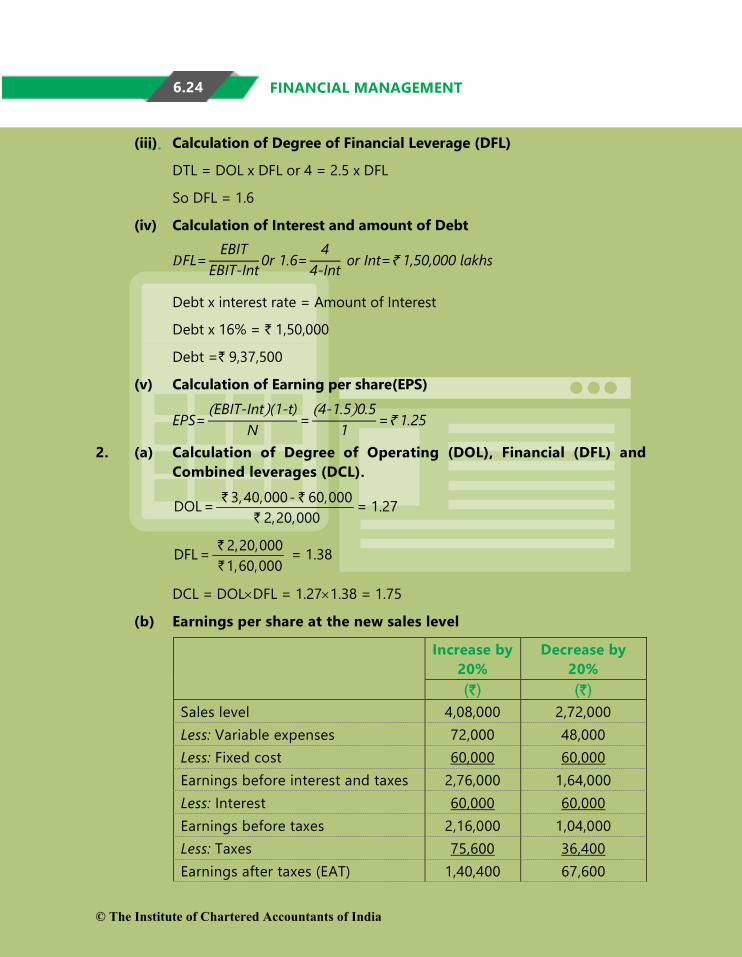
(a) DETERMINE the degree of operating, financial and combined leverages at the current sales level, if all operating expenses, other than depreciation, are variable costs.
(b) If total assets remain at the same level, but sales (i) increase by 20 percent and (ii) decrease by 20 percent, COMPUTE the earnings per share at the new sales level?
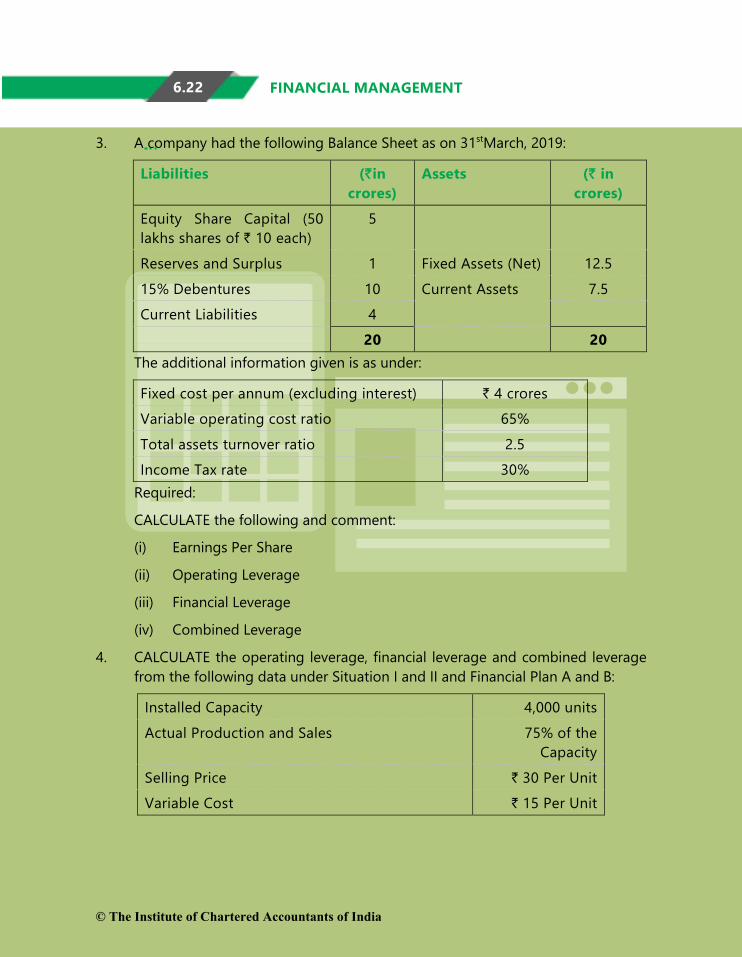
3. A company had the following Balance Sheet as on 31stMarch, 2019:
Liabilities (`in crores)
Assets (` in crores)
Equity Share Capital (50 lakhs shares of ` 10 each)
5
Reserves and Surplus 1 Fixed Assets (Net) 12.5 15% Debentures 10 Current Assets 7.5 Current Liabilities 4 20 20
The additional information given is as under:
Fixed cost per annum (excluding interest) ` 4 crores Variable operating cost ratio 65% Total assets turnover ratio 2.5 Income Tax rate 30%
Required:
CALCULATE the following and comment:
(i) Earnings Per Share
(ii) Operating Leverage
(iii) Financial Leverage
(iv) Combined Leverage
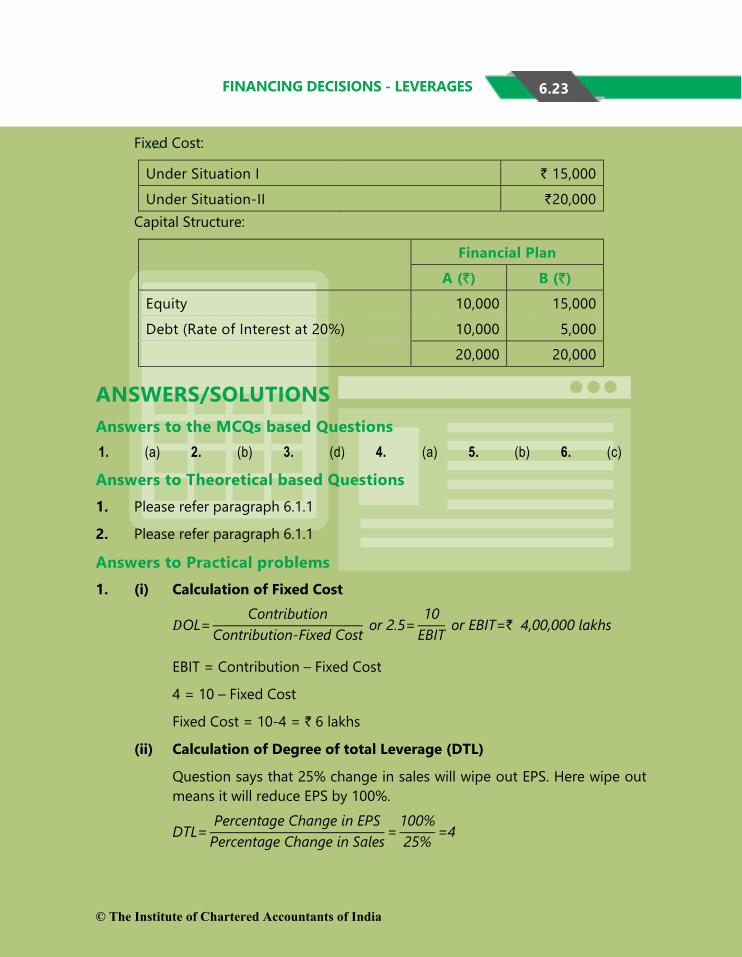
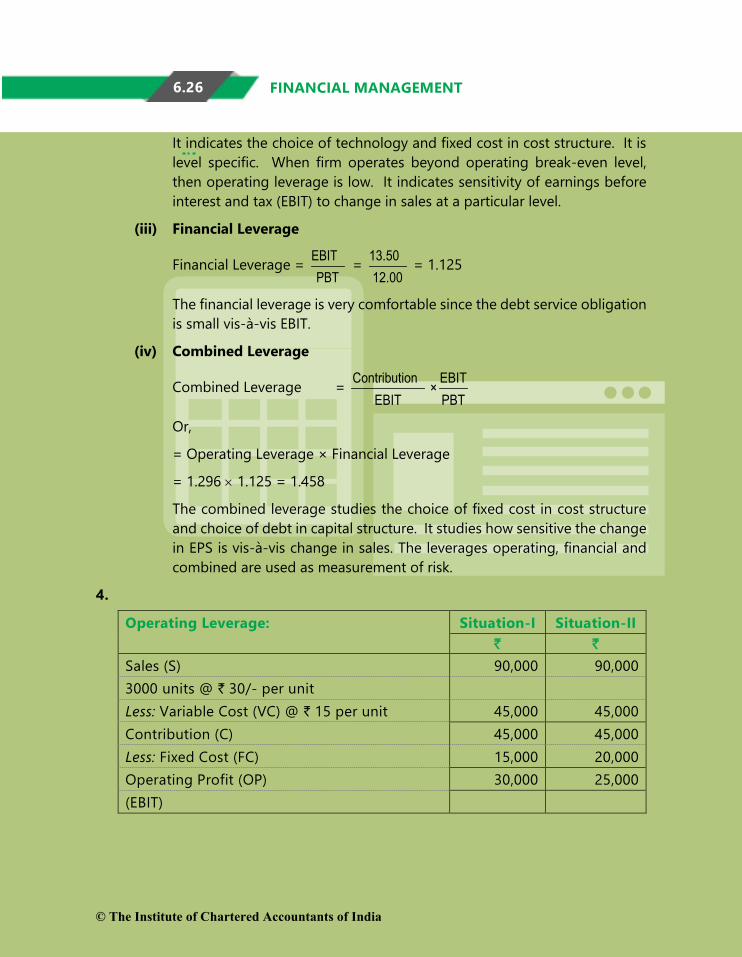
4. CALCULATE the operating leverage, financial leverage and combined leverage from the following data under Situation I and II and Financial Plan A and B:
Installed Capacity 4,000 units Actual Production and Sales 75% of the
Capacity Selling Price ` 30 Per Unit Variable Cost ` 15 Per Unit
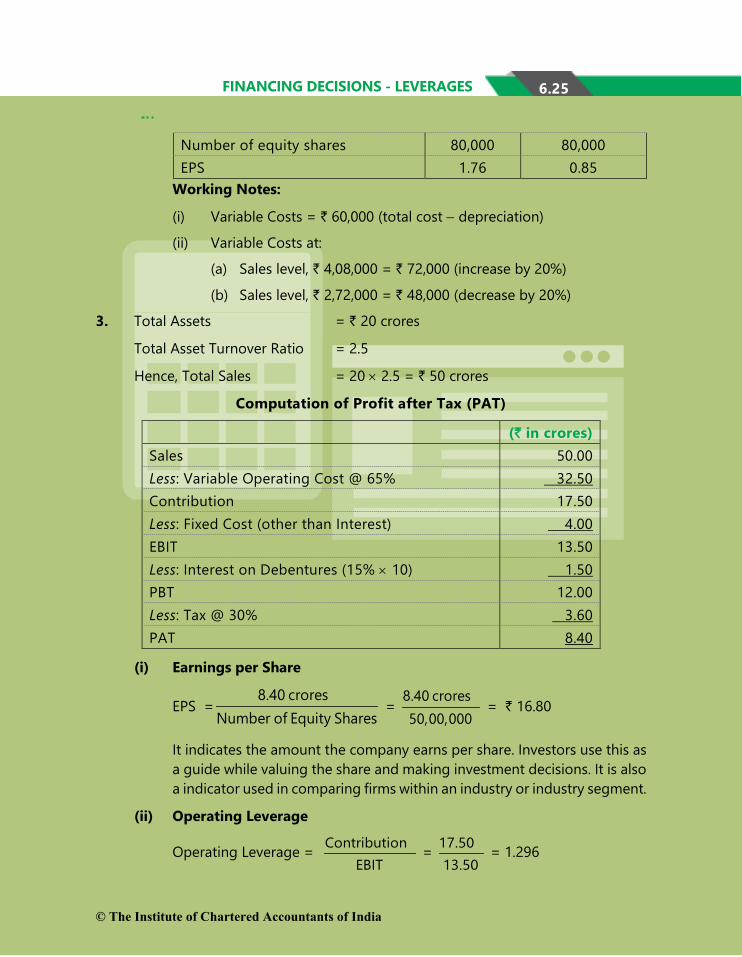
(` in crores) Sales 50.00 Less: Variable Operating Cost @ 65% 32.50 Contribution 17.50 Less: Fixed Cost (other than Interest) 4.00 EBIT 13.50 Less: Interest on Debentures (15% × 10) 1.50 PBT 12.00 Less: Tax @ 30% 3.60 PAT 8.40
(i) Earnings per Share
EPS =8.40 crores
Number of Equity Shares =
8.40 crores 50,00,000
= ` 16.80
It indicates the amount the company earns per share. Investors use this as a guide while valuing the share and making investment decisions. It is also a indicator used in comparing firms within an industry or industry segment.
It indicates the choice of technology and fixed cost in cost structure. It is level specific. When firm operates beyond operating break-even level, then operating leverage is low. It indicates sensitivity of earnings before interest and tax (EBIT) to change in sales at a particular level.
(iii) Financial Leverage
Financial Leverage = EBIT PBT
= 13.50 12.00
= 1.125
The financial leverage is very comfortable since the debt service obligation is small vis-à-vis EBIT.
(iv) Combined Leverage
Combined Leverage = Contribution EBIT
EBIT×
PBT
Or,
= Operating Leverage × Financial Leverage
= 1.296 × 1.125 = 1.458
The combined leverage studies the choice of fixed cost in cost structure and choice of debt in capital structure. It studies how sensitive the change in EPS is vis-à-vis change in sales. The leverages operating, financial and combined are used as measurement of risk.
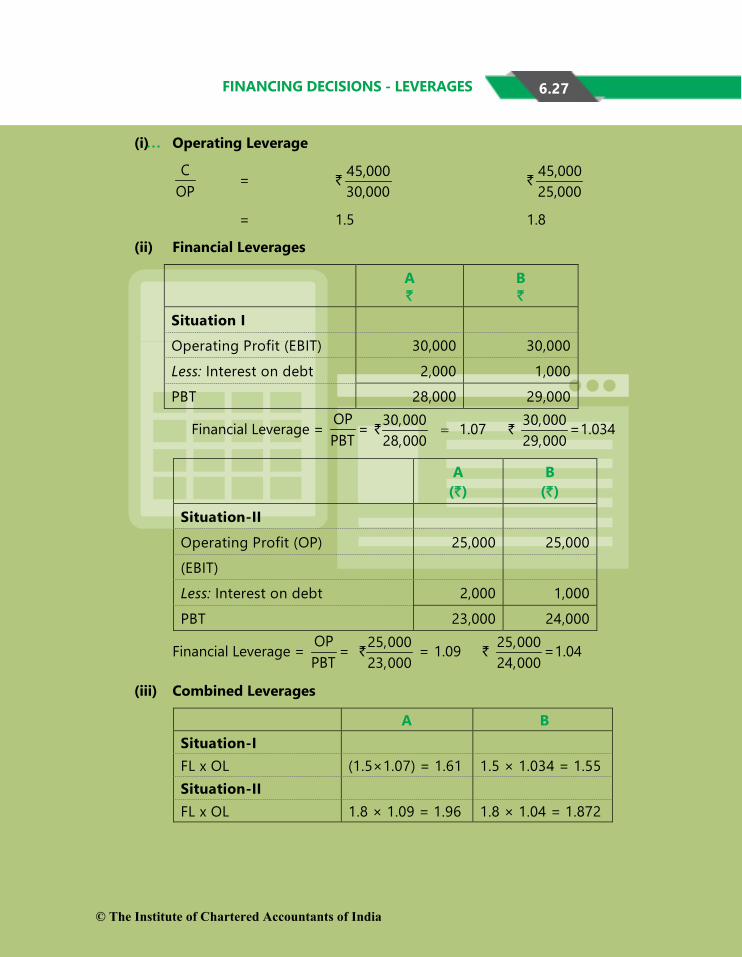
4.
Operating Leverage: Situation-I Situation-II ` `
Sales (S) 90,000 90,000 3000 units @ ` 30/- per unit Less: Variable Cost (VC) @ ` 15 per unit 45,000 45,000 Contribution (C) 45,000 45,000 Less: Fixed Cost (FC) 15,000 20,000 Operating Profit (OP) 30,000 25,000 (EBIT)