DISCUSSION PAPER SERIES Forschungsinstitut zur Zukunft der Arbeit Institute for the Study of Labor Incentives and Cooperation in Firms: Field Evidence IZA DP No. 5618 April 2011 Johannes Berger Claus Herbertz Dirk Sliwka
Transcript
DI
SC
US
SI
ON
P
AP
ER
S
ER
IE
S
Forschungsinstitut zur Zukunft der ArbeitInstitute for the Study of Labor
Incentives and Cooperation in Firms:Field Evidence
Any opinions expressed here are those of the author(s) and not those of IZA. Research published in this series may include views on policy, but the institute itself takes no institutional policy positions. The Institute for the Study of Labor (IZA) in Bonn is a local and virtual international research center and a place of communication between science, politics and business. IZA is an independent nonprofit organization supported by Deutsche Post Foundation. The center is associated with the University of Bonn and offers a stimulating research environment through its international network, workshops and conferences, data service, project support, research visits and doctoral program. IZA engages in (i) original and internationally competitive research in all fields of labor economics, (ii) development of policy concepts, and (iii) dissemination of research results and concepts to the interested public. IZA Discussion Papers often represent preliminary work and are circulated to encourage discussion. Citation of such a paper should account for its provisional character. A revised version may be available directly from the author.
IZA Discussion Paper No. 5618 April 2011
ABSTRACT
Incentives and Cooperation in Firms: Field Evidence We empirically investigate the impact of incentive scheme structure on the degree of cooperation in firms using a unique and representative data set. Combining employee survey data with detailed firm level information on the relative importance of individual, team, and company performance for compensation, we find a significant positive relation between the intensity of team incentives and several survey measures of cooperation. Moreover, higher powered team incentives are associated with lower degrees of absenteeism while this is not the case for individual incentives. JEL Classification: D23, J33, M52, M54 Keywords: incentives, cooperation, teams, helping effort Corresponding author: Dirk Sliwka University of Cologne Herbert-Lewin-Strasse 2 50931 Cologne Germany E-mail: [email protected]
1 Introduction
Economic theory has often stressed that compensation based on team per-
formance is accompanied by the danger of free-riding and consequently in-
e¢ cient employee e¤orts. This problem has been discussed comprehensively
in the theoretical and empirical literature.1 However, several arguments in
favor of team-based compensation were brought forward. A key argument is
that under team-based incentive schemes employees should be more inclined
to support teammates ful�lling their tasks which in turn is bene�cial for the
employer. Itoh (1991) and Itoh (1992), for instance, analyze formal models
showing that it can be worthwhile to base agents�rewards not only on in-
dividual but also on co-worker performance when there is scope for mutual
helping e¤orts.2 On the other hand, incentive schemes purely based on in-
dividual performance may reduce the willingness to help each other when
helping takes away time and resources from working on individual tasks (see
for instance Lazear (1989), Drago and Garvey (1998), Encinosa et al. (2007),
Burks et al. (2009)).
In this paper we investigate the connection between the structure of com-
pensation schemes and the inclination to help co-workers empirically. We
use a unique and representative employer-employee matched survey which
was conducted by the Great-Place-to-Work Institute, a company specialized
in conducting employee surveys, on behalf of the German Federal Ministry
of Labor and Social A¤airs in 2006. The data set is a sample of 305 Ger-
man �rms containing company-level information about workers�and man-
agers�performance-related payment schemes. In addition, in each �rm an
employee-survey has been conducted containing detailed information about
1See for instance Holmström (1982), Alchian and Demsetz (1972) and Newhouse (1973),or Prendergast (1999) for a survey.
2See also Holmström and Milgrom (1991), Drago and Garvey (1998) and Dur and Sol(2010). Within a dynamic framework Auriol et al. (2002) point out that team contractsalso reduce potential negative e¤ects of career concerns by weakening incentives to reducecolleagues�performance.
2
work satisfaction of approximately 36,000 workers.
We �nd that the intensity of team-based compensation schemes is sig-
ni�cantly positively related to several measures of cooperation. However,
neither incentives based on individual nor on �rm performance a¤ect coop-
eration among employees. The positive link between team-based incentives
and cooperation is substantial: For example, a 10 percentage point increase
in the share of team-based compensation (as a percentage of total compen-
sation) is associated with an 11% increase in the number of employees who
agree to the statement that in the �rm "you can count on people to cooper-
ate". This relationship depends on workforce size and is stronger in smaller
companies.
The data set also provides a direct survey question on the employees�
general preference for helping others which allows us to disentangle selection
from incentive e¤ects: The e¤ect remains basically unchanged when we con-
trol for helping preferences. Moreover, while there are strong inter-industry
di¤erences in the preference for helping we �nd no di¤erences between �rms
with and without team compensation schemes. Hence, we can rule out that
the results are driven by the self-selection of more cooperative employees into
organizations that use team-based incentives.
In addition we investigate the connection between the structure of incen-
tive schemes and absenteeism. In line with the previous observations we also
�nd evidence for less absenteeism in the presence of team incentive plans.
While there is now some consistent �eld evidence showing positive e¤ects
of team incentive plans on performance (e.g. Jones and Kato (1995), Knez
and Simester (2001), Hamilton et al. (2003), Bandiera et al. (2009) Jones
et al. (2010)), there are, to the best of our knowledge, only a very limited
number of studies focusing on the link between team incentives and helping
on the job. Drago and Garvey (1998) detect no relationship between helping
e¤orts and the existence of piece rates or pro�t sharing using data from a
survey of nonsupervisory employees at 23 Australian workplaces where help-
3
ing e¤ort is measured using responses to a survey question �To what extent
do your fellow employees refuse to let others use their equipment, tools, or
machinery?�. Heywood et al. (2005) analyze the relationship between pro�t
sharing and cooperation with the 1995 wave of the German Economic Panel
and �nd a positive association between pro�t sharing and the perception that
employees get along well with their colleagues. While these studies use only
binary information, our data set contains information about the presence
and the strength of individual, team- and �rm-based performance pay which
allows us to distinguish between the e¤ects of these three components which
typically make up incentive plans.
Our second result that team incentives are associated with lower absen-
teeism rates is in line with recent �ndings by Knez and Simester (2001),
Bhattacherjee (2005) and Roman (2009). A possible explanation is given by
Kandel and Lazear (1992) who identify team incentives as a determinant for
peer pressure. While evidence from �eld studies (Ichino and Maggi (2000),
Sacerdote (2001), Mas and Moretti (2009), Bandiera et al. (2010)) or ex-
periments (see for instance Falk and Ichino (2006), Mohnen et al. (2008))
highlight the importance of peer e¤ects in general, �eld evidence on the con-
nection between the structure of incentive schemes and peer e¤ects is still
rather scarce.
The remainder of the paper is organized as follows: In the next section
we present the two data sets, the matching procedure and our hypotheses.
Section 3 presents our main results. To meet endogeneity issues often raised
in cross-sectional research designs, this section also includes several sub sam-
ple analyses and control speci�cations. In section 3.3 we present our �ndings
concerning absenteeism and team incentives, before concluding in section 4.
4
2 Data and Hypotheses
Our data source is a 2006 employer-employee matched survey conducted by
the Great-Place-to-Work Institute and the German Federal Ministry of Labor
and Social A¤airs. The data set is a representative sample of 305 German
�rms employing a minimum of 20 workers. For each �rm the management
provided company-level information on organizational facts, corporate values
as well as on various HR practices such as trainings, bene�ts and compen-
sation. Most of this information is provided separately for managers and
workers in each �rm.3
In addition to this �rm-level information, a representative employee-
survey was conducted at each sampled �rm yielding over 36,000 observations
in total. Among others the employee survey includes 58 standardized items
to be answered on a 5-point Likert scale which are designed to measure the
level of trust, pride, and cooperation within �rms. More precisely the items
focus on the relationship between employees and management, the work en-
vironment, and the relationship between employees. In our analysis we focus
on the last aspect, i.e. the perceived level of cooperation among colleagues.
Due to the random sampling process the 305 �rms are almost evenly
spread across the di¤erent industries in Germany. The majority of the sam-
pled �rms are small or medium sized. While the average number of employees
amounts to 430, the median is at 157. However, roughly 10% of the �rms
employ more than 1,000 workers including the largest �rm in the sample with
14,000 workers.
Previous studies (e.g. Drago and Garvey (1998), Heywood et al. (2005))
mainly relied on binary information about whether workers participate in
�rm pro�ts. Our data set allows a more in depths analysis on how much
employees bene�t from economic outcomes and which pay components drive
the e¤ects. Each �rm stated whether wages for managers and workers in the
3More speci�cally, answers were provided for employees in supervisory function and forthe largest group of non-managerial employees, i.e. the core occupational group.
5
corresponding �rm include a performance-related pay component. For both,
managers and workers, we know the share of the average wage (in %) which
is determined by performance-related pay (henceforth PRP). Furthermore,
�rms reported how much (in %) of total PRP is determined by either indi-
vidual, team, or �rm performance. Multiplying these numbers, we derive the
fractions (in %) of the total wage that are based on the three di¤erent types
of PRP.
Figure 1 gives a descriptive overview of PRP usage across industries show-
ing the share of �rms using PRP. While the majority of sampled �rms use
variable pay components for managers, the use of worker PRP varies from
only 6% of all organizations in the Public Sector to 71% in Financial Ser-
vices. In total 109 out of 2944 �rms use PRP for their core occupational
group. Figure 2 shows the composition of workers�incentives across indus-
tries. Though �rm- and team-based variable compensation is quite common,
individual incentive schemes have the prominent role. Roughly 55% of vari-
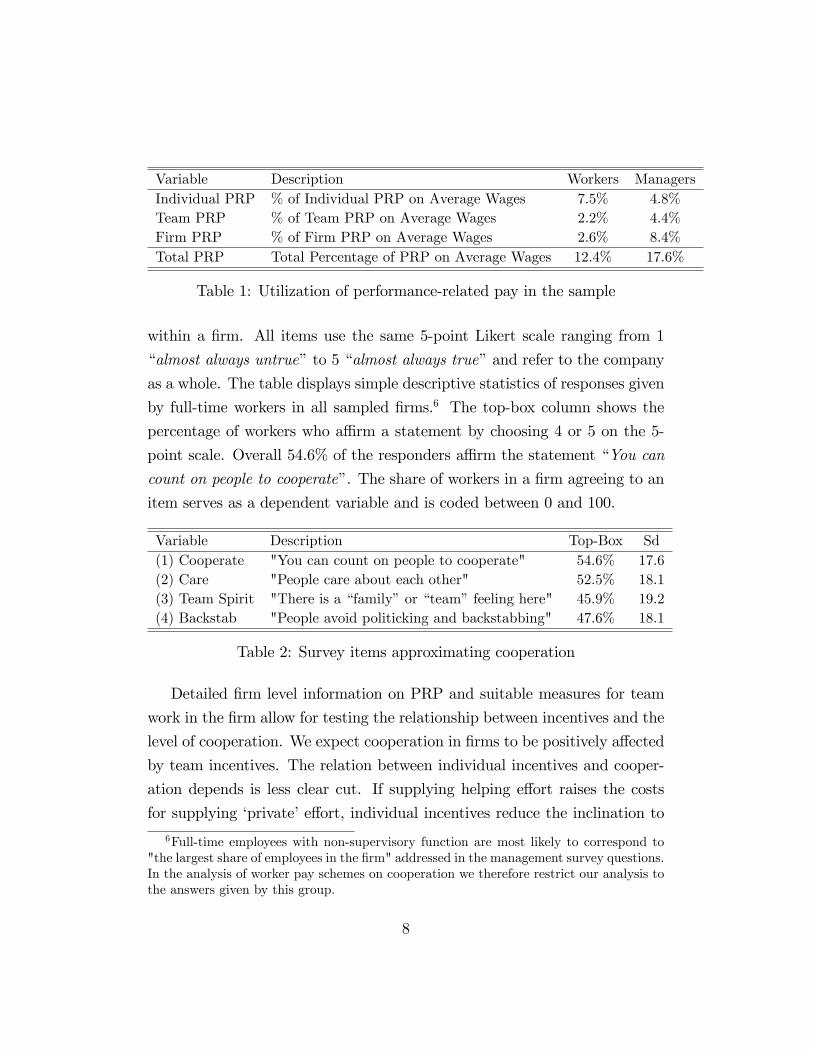
able wage components are based on individual performance. Table 1 reports
the average strength of incentives for the subset of �rms who use at least one
type of worker PRP. The mean magnitude of worker�s incentive pay amounts
to roughly 12% of the �xed wage. While workers� incentive pay is mainly
based on individual performance, the largest fraction of managers�incentives
is determined by the economic success of the company as a whole. For both
groups, team incentives are relatively low. In �rms using worker PRP, team
incentives only account for 18% of total incentives and thus for only 2.2% of
the total average wage.
Complementing the �rm level information provided by management, we
exploit the employee surveys conducted in each �rm to measure the degree
of cooperation among the workforce.5 Table 2 shows 4 items of the employee
survey which re�ect workers�perception of teamwork and team atmosphere
411 out of the 305 sampled �rms did not provide information on PRP.5In �rms with less than 500 employees all employees were asked to participate. In
larger �rms a representative 500-employee sample was drawn.
6
0.2
.4.6
.81
Food I
ndus
try
Chemica
l Indu
stry
Metal In
dustr
y
Mecha
nical
Engine
ering
Automoti
ve In
dustr
y
Constr
uctio
n
Trade,
Mainten
ance
and R
epair
Logis
tic an
d Tran
sport
Financ
ial Serv
ices
Busine
ssre
lated
Serv
ices
Public
Admini
strati
on
Health
and S
ocial
Work Tota
l
Share of Firms with PRP for WorkersShare of Firms with PRP for Managers
Figure 1: Utilization of performance-related pay across German industries
0 20 40 60 80 100percent
TotalHealth and Social Work
Public AdministrationBusinessrelated Services
Financial ServicesLogistic and Transport
Trade, Maintenance and RepairConstruction
Automotive IndustryMechanical Engineering
Metal IndustryChemical Industry
Food Industry
IndividualPRP TeamPRPFirmPRP
Figure 2: Structure of performance-related pay across German industries
7
Variable Description Workers ManagersIndividual PRP % of Individual PRP on Average Wages 7.5% 4.8%Team PRP % of Team PRP on Average Wages 2.2% 4.4%Firm PRP % of Firm PRP on Average Wages 2.6% 8.4%Total PRP Total Percentage of PRP on Average Wages 12.4% 17.6%
Table 1: Utilization of performance-related pay in the sample
within a �rm. All items use the same 5-point Likert scale ranging from 1
�almost always untrue�to 5 �almost always true�and refer to the company
as a whole. The table displays simple descriptive statistics of responses given
by full-time workers in all sampled �rms.6 The top-box column shows the
percentage of workers who a¢ rm a statement by choosing 4 or 5 on the 5-
point scale. Overall 54.6% of the responders a¢ rm the statement �You can
count on people to cooperate�. The share of workers in a �rm agreeing to an
item serves as a dependent variable and is coded between 0 and 100.
Variable Description Top-Box Sd(1) Cooperate "You can count on people to cooperate" 54.6% 17.6(2) Care "People care about each other" 52.5% 18.1(3) Team Spirit "There is a �family�or �team�feeling here" 45.9% 19.2(4) Backstab "People avoid politicking and backstabbing" 47.6% 18.1
Table 2: Survey items approximating cooperation
Detailed �rm level information on PRP and suitable measures for team
work in the �rm allow for testing the relationship between incentives and the
level of cooperation. We expect cooperation in �rms to be positively a¤ected
by team incentives. The relation between individual incentives and cooper-
ation depends is less clear cut. If supplying helping e¤ort raises the costs
for supplying �private�e¤ort, individual incentives reduce the inclination to
6Full-time employees with non-supervisory function are most likely to correspond to"the largest share of employees in the �rm" addressed in the management survey questions.In the analysis of worker pay schemes on cooperation we therefore restrict our analysis tothe answers given by this group.
8
help co-workers. If costs for helping e¤ort are, however, independent of the
costs of �private�e¤ort supply, individual incentives do not a¤ect helping on
the job (see Itoh (1991)). Incentives based on �rm performance only gradu-
ally di¤er from team incentives since a �rm can been seen as a large team.
However, the marginal e¤ect on �rm performance should be much smaller
than the e¤ect on team performance measures. Secondly, peer pressure is
less likely to be sustainable as mutual monitoring becomes impracticable in
larger teams. Hence, we expect to �nd a weaker relationship between �rm
level incentives and cooperation.
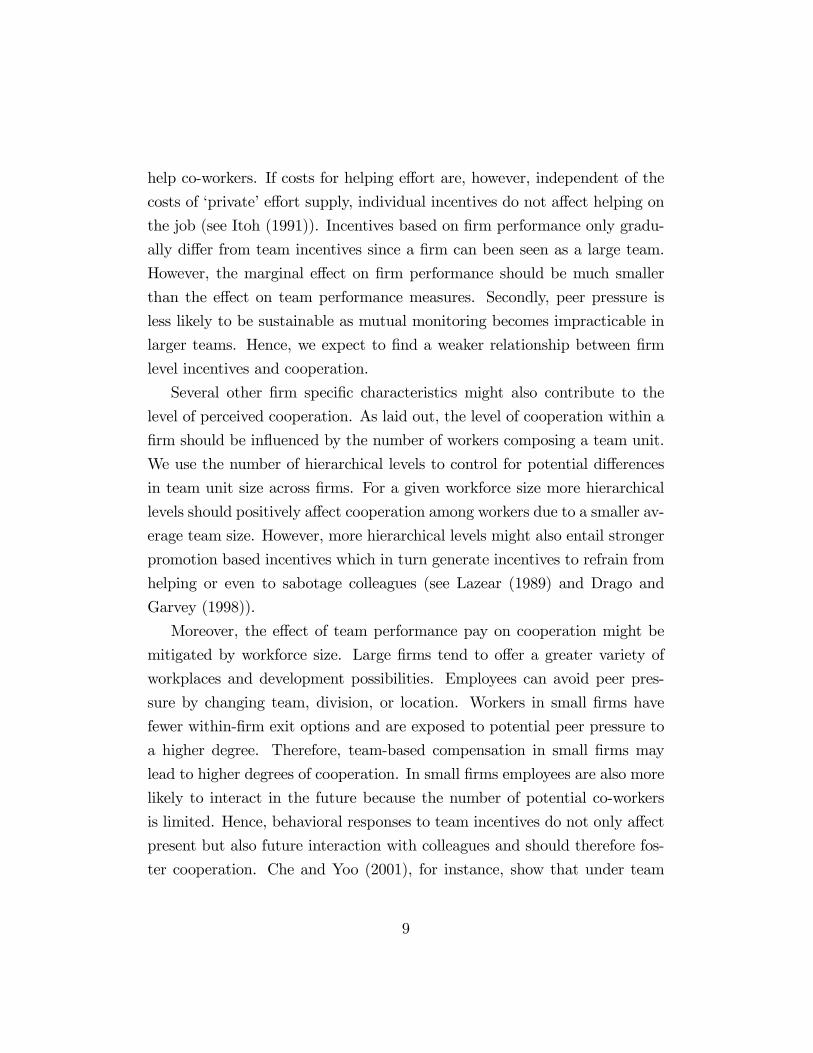
Several other �rm speci�c characteristics might also contribute to the
level of perceived cooperation. As laid out, the level of cooperation within a
�rm should be in�uenced by the number of workers composing a team unit.
We use the number of hierarchical levels to control for potential di¤erences
in team unit size across �rms. For a given workforce size more hierarchical
levels should positively a¤ect cooperation among workers due to a smaller av-
erage team size. However, more hierarchical levels might also entail stronger
promotion based incentives which in turn generate incentives to refrain from
helping or even to sabotage colleagues (see Lazear (1989) and Drago and
Garvey (1998)).
Moreover, the e¤ect of team performance pay on cooperation might be
mitigated by workforce size. Large �rms tend to o¤er a greater variety of
workplaces and development possibilities. Employees can avoid peer pres-
sure by changing team, division, or location. Workers in small �rms have
fewer within-�rm exit options and are exposed to potential peer pressure to
a higher degree. Therefore, team-based compensation in small �rms may
lead to higher degrees of cooperation. In small �rms employees are also more
likely to interact in the future because the number of potential co-workers
is limited. Hence, behavioral responses to team incentives do not only a¤ect
present but also future interaction with colleagues and should therefore fos-
ter cooperation. Che and Yoo (2001), for instance, show that under team
9
incentives a higher frequency of future interactions increases productivity in
a repeated game.
3 Results
3.1 Team Incentives and Cooperation
To study the relationship between incentives and the level of cooperation
we match the �rm-level information obtained in the management survey to
the percentage of workers�a¢ rmative answers to the survey items on coop-
eration. We then estimate the relation between incentive scheme structure
and the percentage of workers agreeing to these cooperation items with OLS
regressions.7 We control for �rm characteristics such as �rm size, industry
and the presence of a works council. As noted above, we include the num-
ber of hierarchical levels to approximate team unit size when the �rm size is
controlled for.
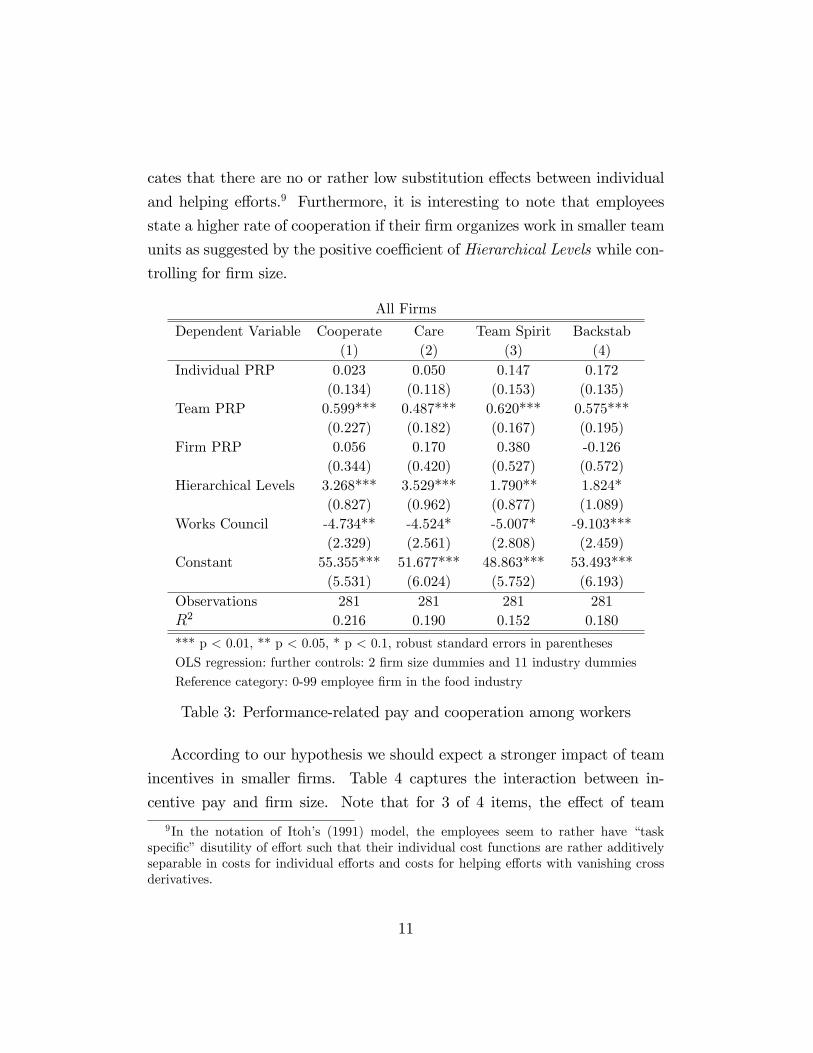
Table 3 presents our main results.8 Team PRP is indeed signi�cantly
and positively related to all cooperation items. In economic terms, a 10%
point higher team PRP is associated with 6 percentage point increase in
the fraction of a¢ rmative answers to the item "You can count on people to
cooperate". The predicted fraction of employees agreeing to that statement at
the mean of all other explanatory variables is equal to 54.3% when there is no
team PRP and this fraction increases by about 11% to 60.3% of all employees
when team PRP is 10% instead. The e¤ect is of similar magnitude for all
four items.
However, we do not �nd any relationship between our measures of coop-
eration and the strength of �rm incentives. Also, higher individual incentives
do not seem to be harmful for the perceived degree of cooperation. This indi-
7Note that that there are nearly no observations of the dependent variables at theboundary of the [0; 100] interval. Hence, tobit regressions lead to nearly identical results.
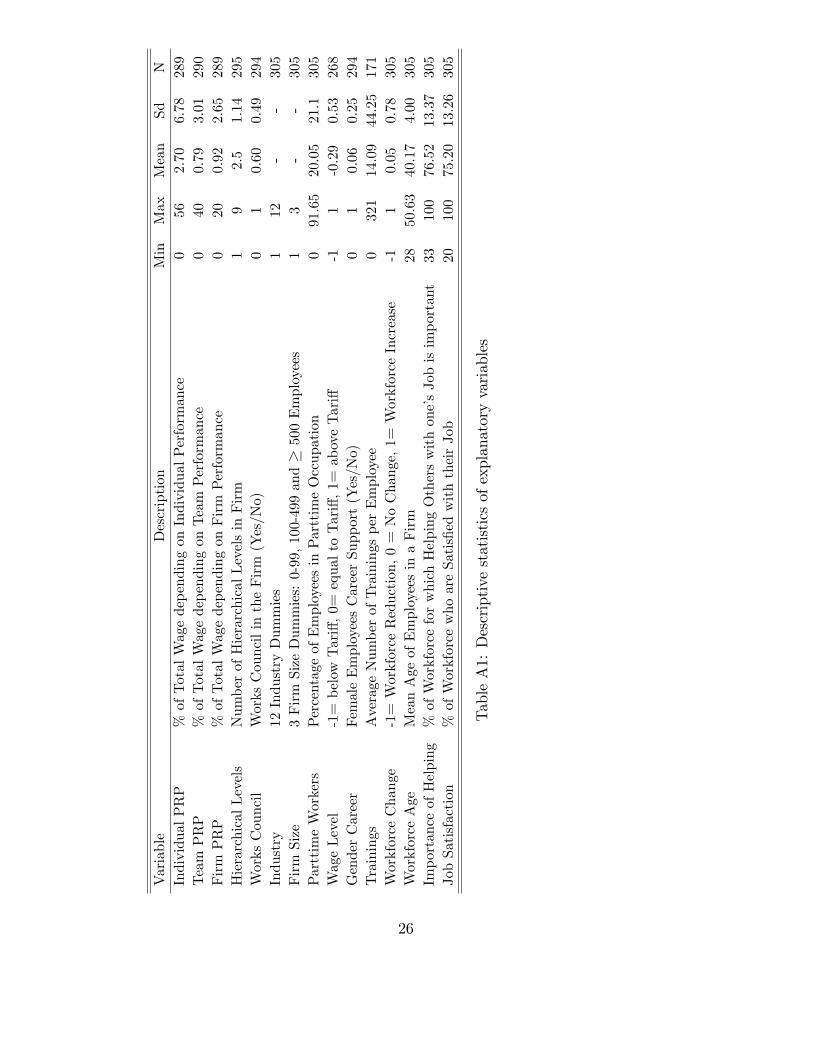
8Table A1 gives descriptive statistics of all explanatory variables.
10
cates that there are no or rather low substitution e¤ects between individual
and helping e¤orts.9 Furthermore, it is interesting to note that employees
state a higher rate of cooperation if their �rm organizes work in smaller team
units as suggested by the positive coe¢ cient of Hierarchical Levels while con-
trolling for �rm size.
All Firms
Dependent Variable Cooperate Care Team Spirit Backstab(1) (2) (3) (4)
*** p < 0.01, ** p < 0.05, * p < 0.1, robust standard errors in parentheses
OLS regression: further controls: 2 �rm size dummies and 11 industry dummies
Reference category: 0-99 employee �rm in the food industry
Table 3: Performance-related pay and cooperation among workers
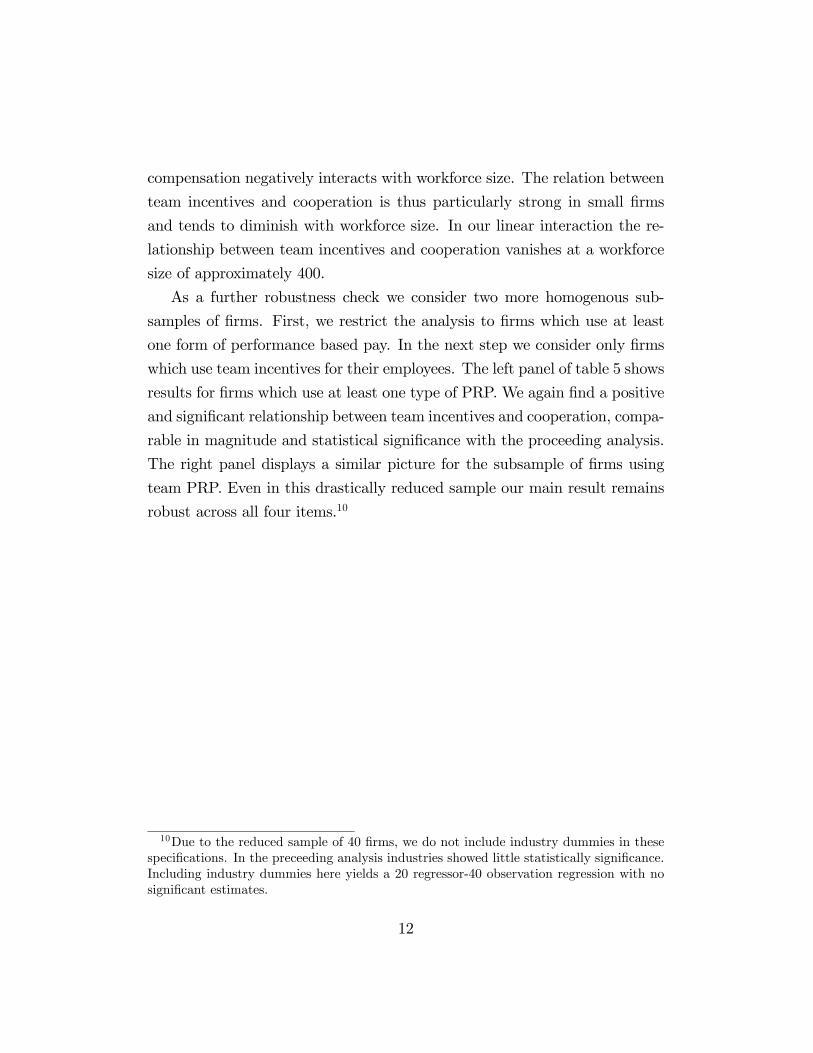
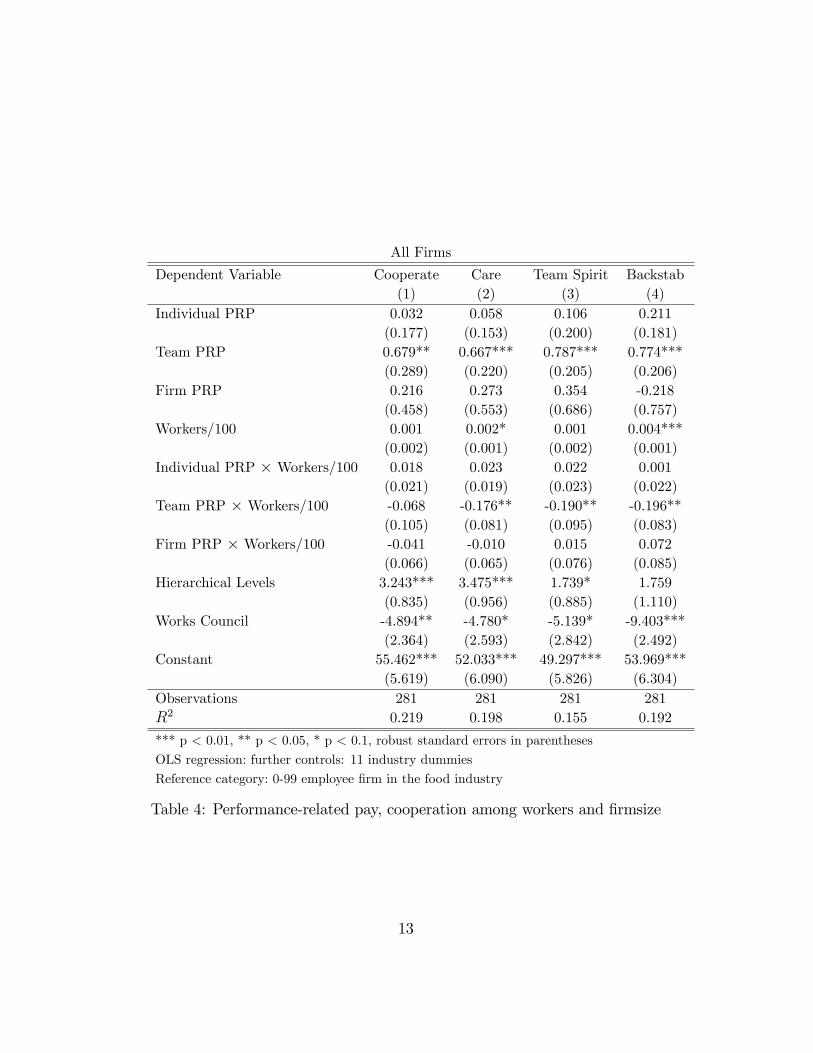
According to our hypothesis we should expect a stronger impact of team
incentives in smaller �rms. Table 4 captures the interaction between in-
centive pay and �rm size. Note that for 3 of 4 items, the e¤ect of team
9In the notation of Itoh�s (1991) model, the employees seem to rather have �taskspeci�c�disutility of e¤ort such that their individual cost functions are rather additivelyseparable in costs for individual e¤orts and costs for helping e¤orts with vanishing crossderivatives.
11
compensation negatively interacts with workforce size. The relation between
team incentives and cooperation is thus particularly strong in small �rms
and tends to diminish with workforce size. In our linear interaction the re-
lationship between team incentives and cooperation vanishes at a workforce
size of approximately 400.
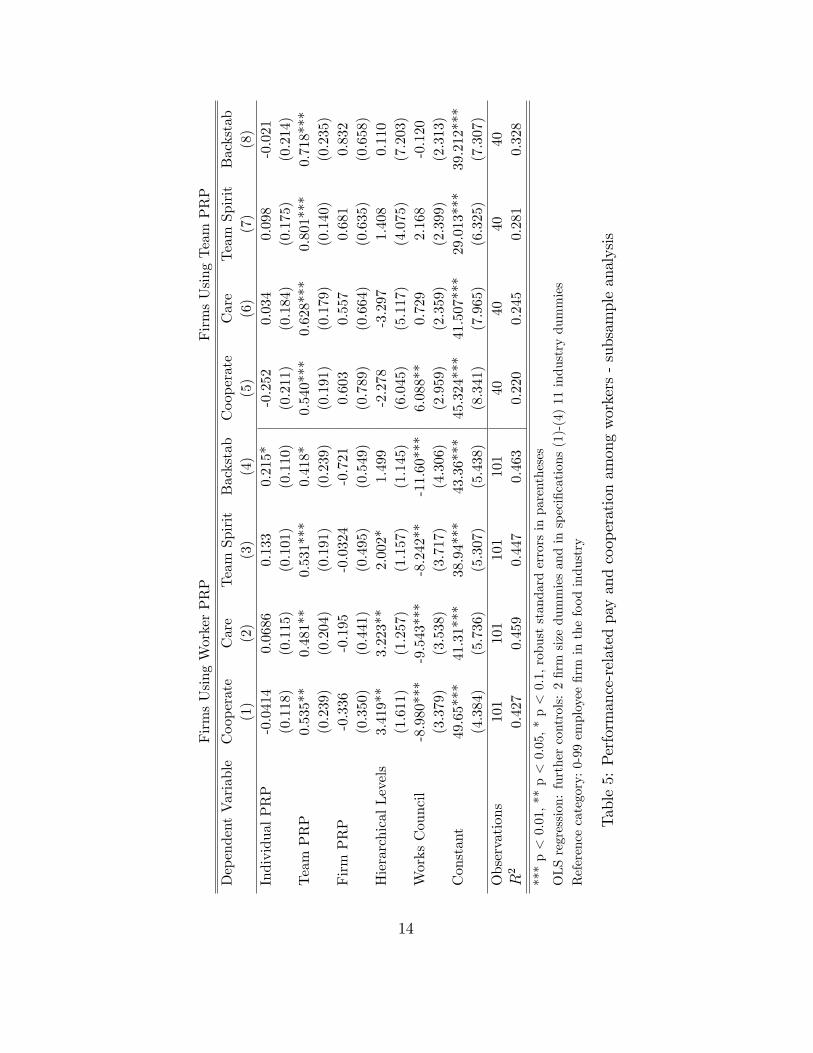
As a further robustness check we consider two more homogenous sub-
samples of �rms. First, we restrict the analysis to �rms which use at least
one form of performance based pay. In the next step we consider only �rms
which use team incentives for their employees. The left panel of table 5 shows
results for �rms which use at least one type of PRP. We again �nd a positive
and signi�cant relationship between team incentives and cooperation, compa-
rable in magnitude and statistical signi�cance with the proceeding analysis.
The right panel displays a similar picture for the subsample of �rms using
team PRP. Even in this drastically reduced sample our main result remains
robust across all four items.10
10Due to the reduced sample of 40 �rms, we do not include industry dummies in thesespeci�cations. In the preceeding analysis industries showed little statistically signi�cance.Including industry dummies here yields a 20 regressor-40 observation regression with nosigni�cant estimates.
12
All Firms
Dependent Variable Cooperate Care Team Spirit Backstab(1) (2) (3) (4)
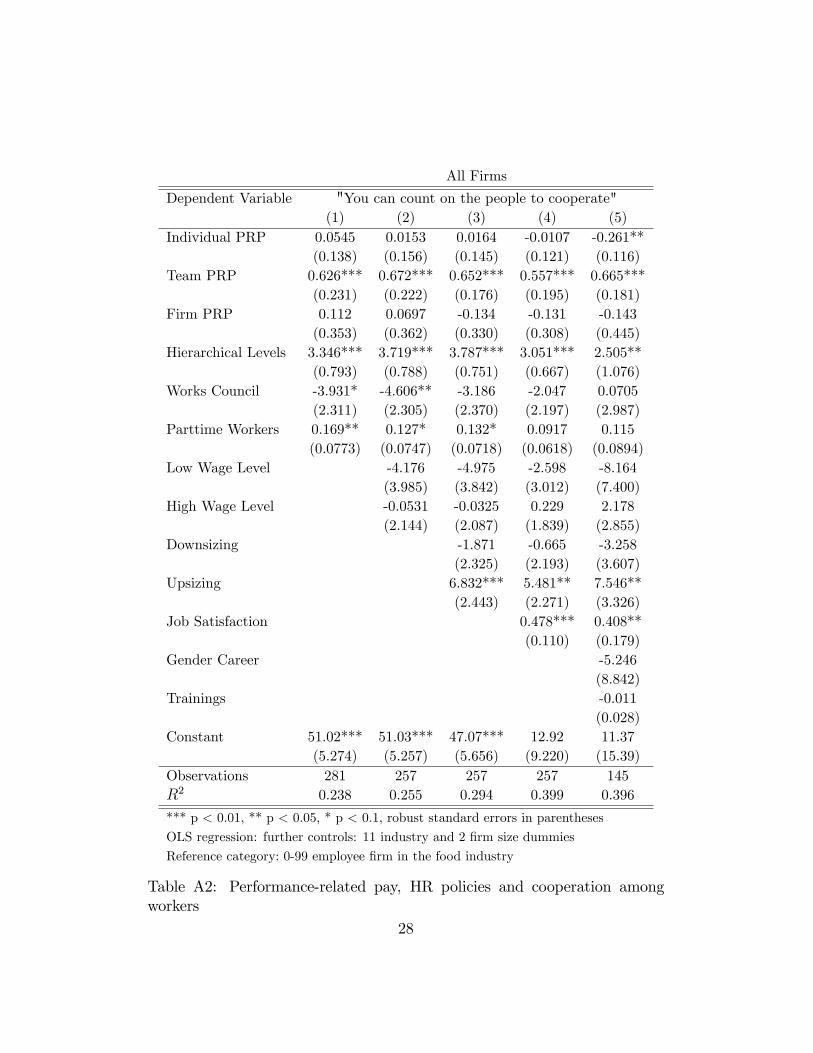
As the management survey contains detailed information on other man-
agement practices we are able to control for further �rm characteristics that
are potentially confounding factors: The fraction of part-time employees,
for instance, may a¤ect the intensity of daily interaction of the workforce.
Information about the wage level captures the company�s wage policy and
the attractiveness of a workplace. Whether a �rm is currently downsizing or
upsizing may have e¤ects on the level of cooperation and may also a¤ect the
structure of compensation. Trainings could foster social interaction among
the workforce and thereby a¤ect cooperation. The presence of systematic
female career support re�ects the company�s antidiscriminatory e¤orts and
attempts to create a fair working environment. Furthermore, the general
working climate, captured by the share of workers who are satis�ed with
their current job, may not only in�uence cooperative behavior but may also
be in�uenced by the company�s wage scheme. Table A2 shows estimates for
column 1 of our basic speci�cation from table 3 and the additional controls
discussed above.11 The e¤ect of team PRP remains statistically and econom-
ically stable over all speci�cations, indicating a robust relationship between
team PRP and cooperation among the workforce.12
3.2 Incentives or Self-Selection?
It is important to understand the key mechanism by which team incentives
a¤ect cooperation in more detail. Indeed, a given set of employees should
have stronger incentives to cooperate if team performance is rewarded. But
in addition, self-selection could also play a role as workers with preferences for
cooperation may self-select into �rms with team incentives. Then cooperation
should increase simply due to the di¤erent composition of the workforce.
Lazear (2000), for instance, showed in his seminal study on the e¤ect of
11Regressions for all other items show almost identical patterns.12The substantially reduced number of observations in the last column results from
missing values in �rms�training-, or gender career programs.
15
piece rates on productivity that about half of the productivity e¤ect was
due to self-selection. Moreover, recent laboratory studies (e.g. Cadsby et al.
(2007), Dohmen and Falk (2009), Eriksson and Villeval (2008)) suggest that
payment scheme design causes sorting e¤ects not only with respect to agents�
abilities but also to their social preferences.
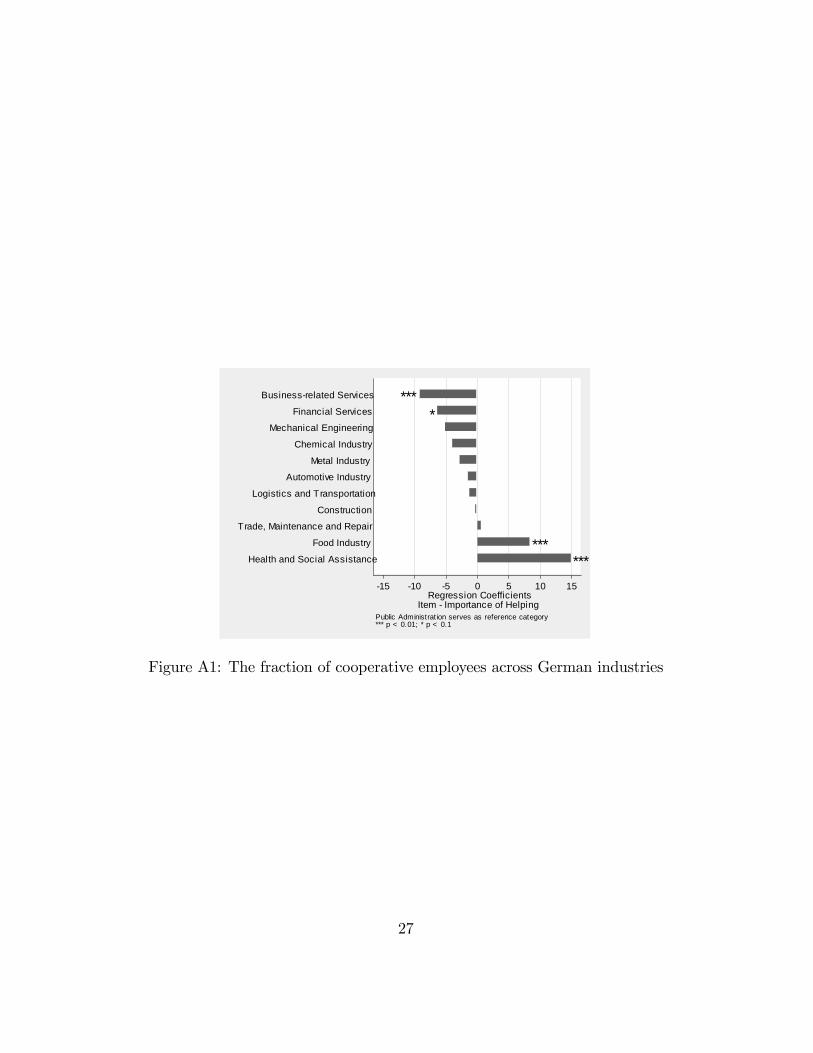
To investigate the self-selection argument in our data we explore another
subsection of the employee survey in which employees were asked which as-
pects of a job are important to them in general. Besides job security, high
income or promotion opportunities, workers were also asked: �How impor-
tant is it for you to have a profession in which you can help others?�which
should capture an individual�s general willingness to help others. If self-
selection with respect to the speci�c structure of performance pay plays a
role, we should expect the fraction of workers with a preference for helping
to be higher in �rms that tie rewards to team or �rm performance. Including
the fraction of workers with a preference for helping as an additional control
in our baseline speci�cation should then also reduce the coe¢ cient of team
PRP.
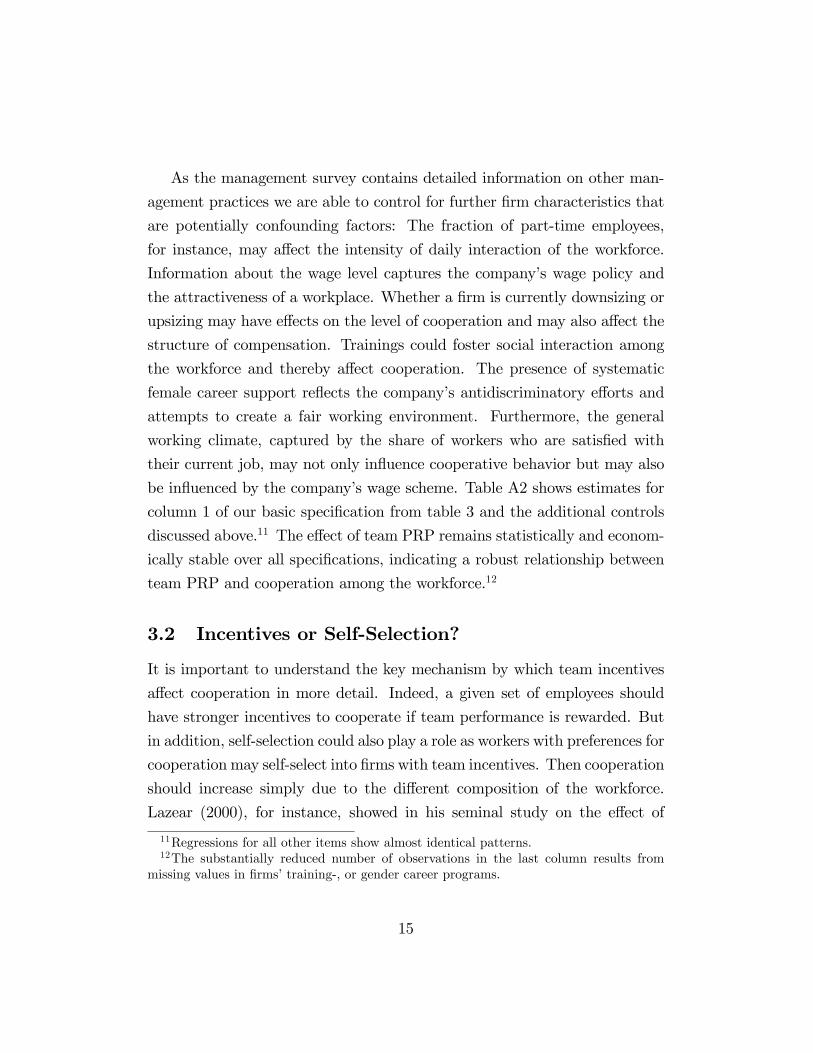
In the models reported in table 6 we �rst regress the share of workers
in a �rm stating that a job in which one can help others is important or
very important to them on the structure of incentive pay and our set of
standard �rm controls. Again we run the regressions for the entire sample
but also for the Using-PRP and Using-Team-PRP subsamples. In none of
the speci�cations neither individual, team nor �rm PRP signi�cantly explain
the share of employees to whom helping is important.13
We also included this measure of the employees�general preference for
helping in our basic OLS estimation to control for the share of cooperative
workers in the �rm. The results are displayed in table 7 and show that the
coe¢ cients of our variables of interest remain almost unchanged. Hence, we
13Note that we do �nd, for instance, that the share of workers stating that a high incomeis important to them increases in the strength of individual incentives.