Incentives or standards: What determines accounting quality changes around IFRS adoption? Hans B. Christensen, Edward Lee, Martin Walker * Abstract: We examine the impact of incentives on accounting quality changes around IFRS adoption. In particular, we examine earnings management and timely loss recognition, constructs often used to assess accounting standards quality. While existing literature documents accounting quality improvements following IFRS adoption, we find that improvements are confined to firms with incentives to adopt. Further, we find that firms that resist IFRS have closer connections with banks and inside shareholders, which could explain these firms’ lack of incentives to adopt IFRS. The overall results indicate that incentives dominate accounting standards in determining accounting quality. Keywords: IFRS, IAS, accounting quality, incentives, international accounting, regulation, standard setting First draft: 10/08/2007 This version: 06/03/2008 * The authors are from the Manchester Accounting and Finance Group, Manchester Business School, UK. We thank Fabrizio Ferri, Luzi Hail, Bjorn Jorgensen, Laura Kerrigan, Jaywon Lee, Gil Sadka, and Franco Wong as well as participants at the Columbia International Accounting Symposium 2008, FARS 2008 Midyear Meeting (Phoenix, AZ), and a research workshop at University of Aarhus (Denmark) for useful comments on earlier versions of this paper. Part of the research was carried out while Hans was visiting Chicago GSB. Correspondence: [email protected].
Transcript
Incentives or standards: What determines accounting quality changes around
IFRS adoption?
Hans B. Christensen, Edward Lee, Martin Walker∗
Abstract: We examine the impact of incentives on accounting quality changes around IFRS adoption. In particular, we examine earnings management and timely loss recognition, constructs often used to assess accounting standards quality. While existing literature documents accounting quality improvements following IFRS adoption, we find that improvements are confined to firms with incentives to adopt. Further, we find that firms that resist IFRS have closer connections with banks and inside shareholders, which could explain these firms’ lack of incentives to adopt IFRS. The overall results indicate that incentives dominate accounting standards in determining accounting quality. Keywords: IFRS, IAS, accounting quality, incentives, international accounting, regulation, standard setting First draft: 10/08/2007 This version: 06/03/2008 ∗ The authors are from the Manchester Accounting and Finance Group, Manchester Business School, UK. We thank Fabrizio Ferri, Luzi Hail, Bjorn Jorgensen, Laura Kerrigan, Jaywon Lee, Gil Sadka, and Franco Wong as well as participants at the Columbia International Accounting Symposium 2008, FARS 2008 Midyear Meeting (Phoenix, AZ), and a research workshop at University of Aarhus (Denmark) for useful comments on earlier versions of this paper. Part of the research was carried out while Hans was visiting Chicago GSB. Correspondence: [email protected].
1
1. Introduction
We examine whether the adoption of International Financial Reporting Standards1
(IFRS) leads to accounting quality improvements. Following the recent adoption of
IFRS in many regions of the world, much attention is being given to the association
between accounting standards and accounting quality. Existing studies document
improvements in accounting quality following voluntary IFRS adoption (e.g., Barth et
al., 2006; Gassen and Sellhorn, 2006; Hung and Subramanyam, 2007; Barth et al.,
2008). Yet the extent to which we could expect the same improvement for firms
forced to adopt remains an interesting and open question. By examining this question
we provide evidence on whether accounting standard regulations per se improve
information in capital markets.
To isolate the effect of IFRS we need a setting where we can identify corporate
incentives. Germany offers such a setting. Between 1998 and 2005 firms in Germany
could voluntarily adopt IFRS; in 2005 compliance became mandatory. The German
setting is unique because it enables comparison of firms that voluntarily adopted IFRS
before 2005 (firms that perceive net benefits of doing so) and firms that were forced
to comply as of 2005 (firms that perceive no net benefits of doing so). This is
different from simply comparing the consequences of mandatory adoption when the
latter group includes firms from countries not allowing voluntary adoption or where
voluntary adoption is uncommon, as mandatory IFRS adoption in countries without
voluntary adoption does not distinguish the underlying incentives. To highlight this
important distinction in our German setting, we define firms that delayed adoption of
IFRS until 2005 as “resisters” rather than mandatory adopters.
German accounting regulation (Handelsgesetzbuch - HGB) is generally perceived as
lower quality than IFRS (e.g., Leuz and Verrecchia, 2000) given its code-law origin
and insider orientation (Leuz and Wüstemann, 2004). One way to define the quality of
accounting standards is in terms of the quality of the financial statements prepared
according to them, holding incentives constant. We argue that incentives among IFRS
resisters are likely to stay constant around the time of adoption whereas this is 1 International Financial Reporting Standards (IFRS) covers both IFRS issued by the International Accounting Standard Board (IASB) and International Accounting Standards (IAS) issued by the IASB’s predecessor the International Accounting Standards Committee (IASC).
2
unlikely to be the case for voluntary adopters. Thus, in Germany we have an
interesting setting where we are able to investigate the complex interaction between
incentives and accounting standards in determining accounting quality. In essence, the
German setting allows us to test whether accounting quality improves when firms are
forced to comply with what is generally perceived as higher quality accounting
standards. Although the sample size is relatively small in our single-country setting,
this is compensated by the fact that we are able to explicitly observe the voluntary
adoption versus resistance choices of all firms. We are therefore able to more
accurately partition firms according to their underlying incentives than prior research
that relies on proxies (Christensen et al., 2007; Daske et al., 2007a; Daske et al.,
2007b).
We examine two dimensions of accounting quality, namely, earnings management
and timely loss recognition, which are often used in studies on the effects of
accounting standards on accounting quality (e.g., Van tendeloo and Vanstraelen,
2005; Barth et al., 2006; Gassen and Sellhorn, 2006; Hung and Subramanyam, 2007;
Barth et al., 2008). These two constructs are especially relevant to our research
question because they rely on managerial discretion and are therefore likely to be
influenced by the incentives of those preparing the financial statements.
Consistent with prior literature, we find that voluntary adoption of IFRS is associated
with decreased earnings management and more timely loss recognition. In stark
contrast, we find no evidence of such accounting quality improvements for firms that
are forced to adopt IFRS. The results suggest that adoption of IFRS (which is
generally perceived to be of higher quality than HGB) does not necessarily lead to
higher quality accounting, at least not when the preparers have no incentives to adopt.
There are two potential explanations for this finding. First, the flexibility embedded in
IFRS might render it ineffective in restricting earnings management of firms with low
incentives to comply. Second, IFRS might not be sufficient to decrease earnings
management and increase timely loss recognition. In this case, the observed
accounting quality improvements for voluntary adopters could be driven by changes
in incentives of these firms around the time of their adoption. Although we are unable
to distinguish between these explanations, they are both consistent with IFRS per se
not increasing accounting quality even when firms’ prior accounting standards are
3
generally viewed as lower quality. Additional tests confirm the existence of temporal
effects in accounting quality improvements over our sample period among both
voluntary adopters and resisters. However, this result does not explain the entire
difference in quality changes we observe between the two groups. The fact that the
temporal effect exerts an influence on firms irrespective of accounting standards
further supports our inference that the accounting quality improvements among
voluntary IFRS adopters cannot be attributed to standards per se.
In further analysis we attempt to gauge why some firms resist IFRS adoption. We
show that these firms have closer relationships with banks, less demand for
information from capital markets, and more concentrated ownership. These findings
are consistent with prior literature and suggest that resisters have closer relationships
with insiders. For such firms financial reporting may consequently serve the purpose
of contracting with known insiders rather than relatively anonymous outsiders. We
argue that this could explain why these firms resist IFRS and perhaps why they have
no incentives to engage in less earnings management and more timely loss recognition
subsequent to IFRS adoption.
In related work, Ball et al. (2003) provide empirical evidence at the country level
consistent with accounting quality being driven by incentives rather than accounting
standards. They argue that incentives are driven by the firms’ institutional setting.
Further, Ball and Shivakumar (2005) and Burghstahler et al. (2006) show that
earnings quality is lower for private than public firms despite applying the same
accounting standards. Our contribution to this literature is to document that even
among publicly listed firms within the same institutional setting, incentives dominate
accounting standards in determining accounting quality. In most countries accounting
standards are identical for all listed firms yet incentives are likely to vary. Our results
suggest that the objective of improving accounting quality cannot be achieved for all
firms by mandating higher quality accounting standards, because such attempts will
have limited effect for firms without incentives to comply.
The remainder of the paper is organized as follows. Section 2 reviews the prior
literature, describes the unique features of the institutional setting in Germany and
develops the hypothesis. Section 3 explains the research design and the data sources.
4
Section 4 presents the empirical findings and Section 5 provides additional analyses
on the insider characteristics of resisters relative to voluntary adopters. Section 6
concludes.
2. Prior literature, institutional setting and hypothesis development
2.1. Prior literature
Two streams of literature are relevant to our study: studies on the association between
IFRS and accounting quality, and studies investigating the interaction between
incentives and accounting standards in determining accounting quality. We examine
how incentives affect quality changes around IFRS adoption and consequently
contribute to both streams of literature.
2.1.1. IFRS and accounting quality
Van tendeloo and Vanstraelen (2005) and Goncharov (2005) find no differences in
earnings management between German firms that voluntarily adopted IFRS prior to
2001 and German firms that applied HGB. In contrast, Gassen and Sellhorn (2006)
find that German firms that voluntarily adopted IFRS from 1998 to 2004 have more
persistent, less predictable and more conditionally conservative earnings than a
matched group of German firms applying HGB. Hung and Subramanyam (2007)
reach a similar conclusion for a sample of German firms adopting IFRS voluntarily
between 1998 and 2002. Rather than focus on cross-sectional differences between
firms, however, Hung and Subramanyam exploit the fact that firms adopting IFRS
restate their comparative figures and compare net income and net equity under HGB
and IFRS for the same firm-years. Consistent with IFRS being associated with higher
quality accounting, Barth et al. (2006; 2008) find that an international sample of firms
that voluntarily adopted IFRS up to 2003 exhibits lower levels of earnings
management and more timely loss recognition than a matched sample of firms using
local GAAP. As an extension of these findings, Daske et al. (2007a) focus on the
heterogeneity in the consequences of voluntary IFRS adoption and find that on
average capital markets respond modestly to voluntary IFRS reporting. However,
consistent with their predictions, they find that "serious" adopters experience
5
significantly stronger effects on their cost of capital and market liquidity than “label”
adopters, suggesting that for some firms the quality of financial reporting improves in
association with voluntary IFRS adoption.
Overall the evidence on the association between voluntary IFRS adoption and
accounting quality is mixed, although papers applying more recent data generally find
relatively better accounting quality among the firms that adopt IFRS. A common
feature of these studies is that they are based on voluntary IFRS adopters. This raises
the question as to whether we can attribute the improved quality to the application of
IFRS per se. That is, does the application of IFRS have an incremental effect on
accounting quality, or is the observed quality improvement the result of other changes
implemented simultaneously by the adopting firms?2 Our study distinguishes between
these two effects by comparing changes in accounting quality around IFRS adoption
for a group of firms with incentives to adopt to those for a group of firms with no
incentives to adopt. In a concurrent study, Daske et al. (2007b) examine the capital
market effects of mandatory IFRS. They find evidence that is consistent with reduced
information asymmetry in association with mandatory IFRS adoption. They argue that
the effect could be driven by network effects rather than accounting quality
improvements. However, consistent with our results Daske et al. find that the effect is
concentrated among firms with incentives to adopt IFRS. In a similar spirit, Lee et al.
(2008) argue that if IFRS matters, then firms in countries that had lower disclosure
quality and dependence on equity financing prior to mandatory IFRS should
experience a greater impact after mandatory adoption. However, using implied cost of
equity capital as an indicator, they find no effect among such countries even after two
years under the new accounting standards.
2.1.2. Incentives and accounting standards
A stream of research examines the interaction between incentives and accounting
standards in determining accounting quality. Ball et al. (2003) exploit a unique setting
that exists in East Asia, where a number of countries have adopted accounting
standards that derive from common-law sources yet have institutional features similar
2 This argument is developed further in Section 2.3.
6
to code-law countries. They document that accounting quality in these countries is
similar to code-law countries despite the application of common-law accounting
standards. Ball and Shivakumar (2005) and Burghstahler et al. (2006) examine public
and private firms within the same country. Both studies find that earnings quality is
lower among private than public firms despite these firms facing equivalent
regulations on auditing, accounting standards and taxation. These results are
consistent with incentives and market forces dominating accounting standards as the
main determinants of accounting quality. The papers in this stream of research argue
that incentives are shaped by differences in institutions and market forces either
among countries or due to listing status. We contribute to this stream of research by
examining whether incentives also dominate accounting standards among listed firms
operating in the same institutional setting.
Related to this stream of literature is the discussion of accounting harmonization and
subsequent convergence (Joos and Lang, 1994; Land and Lang, 2002; Joos and
Wysocki, 2006; Bradshaw and Miller, 2007). Ball (2001) argues that international
accounting convergence is unlikely to be achieved by harmonizing accounting
standards alone. The argument is that the uniform accounting standards that have
promoted (e.g., IFRS) were developed to satisfy the needs of common-law countries
(like the US and UK), where public information channels reduce information
asymmetry between corporate managers and financial statement users; in those parts
of the world where private information channels are the prevailing way to reduce
information asymmetry, this model is unlikely to be successful. Our results support
the argument in Ball (2001) and suggest that although accounting harmonization may
occur as a consequence of market forces, it is unlikely to happen as a consequence of
the mandatory adoption of the same accounting standards.
2.2. The institutional setting in Germany
Germany is generally classified as a code-law country (e.g., La Porta et al., 1998; Ball
et al., 2000; Leuz et al., 2003) with limited investor protection and an insider
orientation (Leuz and Wüstemann, 2004). HGB is generally perceived as lower
quality than IFRS (e.g., Leuz and Verrecchia, 2000; Gassen and Sellhorn, 2006). The
lower quality is often attributed to HGB’s code-law origin, tradition for prudence and
7
tax alignment. However, HGB prescribes that the sole purpose of consolidated
statements is to facilitate decision making (Leuz, 2003; Gassen and Sellhorn, 2006),
so the perceived quality differences cannot be attributed entirely to legal issues.
In Germany voluntary IFRS and US GAAP adoption began in the early 1990s under
dual reporting, where some firms voluntarily decided to prepare two sets of
consolidated statements, one complying with HGB and another complying with either
IFRS or US GAAP. Starting in 1998 firms were no longer required to disclose HGB
consolidated statements if they produced either IFRS or US GAAP consolidated
statements (see regulation KapEAG). The lack of required dual reporting and the
introduction of stock exchange segments that require the application of either IFRS or
US GAAP (Neuer Markt and later Prime Standards on the Frankfurt Stock Exchange)
greatly increased the number of voluntary adopters. In 2002 the European Union (EU)
formally implemented a regulation that made IFRS mandatory from 2005 onward for
all EU listed firms including those domiciled in Germany. Against this evolution in
the set of choices available to German firms, 59% voluntarily adopted IFRS and 41%
waited until 2005 when it became mandatory.3
Because we can observe all German firms’ actual accounting standard choices we are
able to accurately classify firms according to their perception of IFRS. This allows for
comparison of a group of firms that perceive net benefits of IFRS to a group of firms
that resists IFRS. Thus, the German setting provides a unique opportunity to examine
the interaction between accounting standards and incentives.
2.3. Hypothesis development
We hypothesize that IFRS is only associated with accounting quality improvements
when firms have incentives to adopt. There are two distinct, but not mutually
exclusive, explanations that support this outcome. First, prior literature on the
determinants of voluntary IFRS adoption document that firms raise more external
capital subsequent to compliance (e.g., Ashbaugh, 2001; Tarca, 2004; Cuijpers and
3 This is based on our sample that includes all firms available in Datastream after excluding firms complying with US GAAP, firms with missing data and firms that are not required to adopt IFRS because they do not produce consolidated statements. (See Table 1; 177/433 = 41 %).
8
Buijink, 2005). These results suggest that voluntary adopters experience changes to
their incentives around the time they adopt IFRS. Consequently, it is likely that at
least part of the observed quality improvements around voluntary adoption is driven
by the changing incentives rather than the standards per se. Second, IFRS is (for good
reasons) principles-based and offers corporate managers significant discretion. It is
possible that firms that have no incentives to adopt IFRS respond to mandatory
compliance with a “tick-box” mentality, rather than sincere efforts to adopt the new
standards, perhaps to reduce compliance costs. Although these two explanations are
fundamentally different they are both consistent with IFRS per se not leading to
quality improvements. In the remainder of this section we develop each explanation in
turn.
2.3.1. Voluntary adoption and accounting quality changes
The purpose of financial reporting is essentially to reduce information asymmetry
between corporate managers and parties contracting with their firm (Watts, 1977;
Ball, 2001). The contracting parties may be shareholders, lenders, suppliers,
customers, employees and many other firm stakeholders. As financial reporting
develops to facilitate efficient contracting, i.e., maximize firm value4 (Watts and
Zimmerman, 1990), the relative importance of different user groups and their
differential information needs influence how a particular manager applies the
discretion available to her in financial reporting.
Now assume that a firm experiences a positive shock to its growth options. To exploit
these new growth opportunities the firm needs external financing. Contracting with
outside investors is better facilitated when earnings are not managed and losses are
recognized in a timely way (Ball et al., 2000; Watts, 2003). Thus, in order to attract
cheaper external financing the firm improves financial reporting along these two
dimensions. In this scenario there are essentially two broad categories of explanations
for why a firm may voluntarily adopt IFRS in the process. The first implies that IFRS
4 This does not imply that firms always maximize the value of outsider owned equity listed on the stock exchange. The total value of the firm equals the market value of insider equity, outsider equity, and debt.
9
has an incremental effect on accounting quality while the second suggests that it is a
manifestation of other underlying factors.
To elaborate, the first category of explanations suggests that voluntary IFRS adoption
could be desirable because the rules themselves reduce earnings management and
increase timely loss recognition. This may happen because IFRS limits the options
available to managers. Consistent with this explanation IASC and later IASB have
eliminated alternatives available to management under IFRS since the beginning of
the Comparability and Improvement Project in 1989 (iasplus.com). The alternative
category of explanations suggests that voluntary IFRS adoption may simply correlate
with other managerial motives. First, IFRS may offer firms a clean break in order to
move to a higher quality. It is possible that the firm could have achieved the same
quality improvements under HGB but this would have involved changing accounting
choices and implicitly accepting that previous practices were less informative; a
change to a new set of standards allows firms to adopt new practices without having
to acknowledge the sins of the past. Second, the act of adoption itself may signal a
change in incentives. For instance, assuming there is a need to acquire foreign capital,
IFRS adoption may raise the profile of the firm among foreign investors. Finally,
IFRS adoption prior to 2005 could be a long-term cost decreasing response for firms
that are undergoing change in their financial reporting anyway since they know IFRS
would be mandatory as of 2005. All suggestions are consistent with voluntary IFRS
adoption being associated with accounting quality improvements, yet in the three
alternative explanations it is a correlated outcome rather than the cause.
Studies that exploit voluntary adoption are unable to distinguish between the first and
the alternative explanations. It is possible that the quality improvements associated
with IFRS adoption, generally observed in prior literature, are at least partly driven by
changes to incentives rather than IFRS per se.
2.3.2. Mandatory IFRS and “tick-box” mentality
For firms that resist IFRS and postpone adoption until 2005 when it becomes
mandatory, the circumstances around IFRS adoption are different from those for
voluntary adopters. These firms could have adopted IFRS as early as 1998 but
10
decided to wait until they were forced to do so in 2005. Prior literature has suggested
a “tick-box” attitude around voluntary IFRS adoption (Daske et al., 2007a). Yet such
behavior intuitively might be expected to be more likely in a mandatory setting where
some firms are forced to do something against their will.
Survey evidence suggests that the costs of implementing IFRS for firms in the EU are
significant (ICAEW, 2007).5 The costs of compliance are likely to vary with the way
IFRS is implemented. PricewaterhouseCoopers suggests that the extent to which IFRS
is embedded in the organization is a key determinant of the resulting accounting
quality (PwC, 2004) -- IFRS is considered embedded if it is used for internal reporting
and if systems are adapted to automatically generate required information. Similarly,
the degree to which IFRS is embedded in the organization is likely to affect
compliance costs. Changing internal reporting (and renegotiating contracts that rely
on internal reporting, e.g. compensation contracts) and adapting IT systems are
potentially costly. It is plausible that voluntary adopters that perceive net benefits of
IFRS are more likely to embed IFRS in the organization than resisters that are forced
to comply with IFRS.6,7 The idea that “tick-box” mentality is common among
mandatory IFRS adopters is empirically supported by a survey of 200 first-time IFRS
annual reports drawn from all the member states in the EU (ICAEW, 2007, p. 96).
The survey finds that the accounting policies sections are characterized by standard
wording, suggesting that it is copied from the model accounts produced by large audit
firms rather than tailored to suit individual firms’ circumstances.
In this study we examine whether standards or incentives dominate in determining
accounting quality by contrasting the changes for voluntary adopters and resisters
around IFRS adoption. Based on the two explanations discussed in this section and
5 The survey is based on answers to an online questionnaire. Compliance costs for the first set of consolidated statements are estimated at 0.31% of turnover for firms with turnover less than €500m and 0.05% of turnover for firms with turnover greater than €500m. For subsequent years the costs are estimated to be between 0.06% and 0.008% of turnover. For details on methodology and the analysis, see ICAEW (2007, chapter 7). 6 Prior literature suggests that bookkeeping costs influence managers’ choice of accounting standards (e.g., Watts and Zimmerman, 1978). We suggest that costs associated with a mandatory accounting standard change may also influence how managers adopt those standards. 7 Ball (1998) provides evidence that Daimler-Benz AG voluntarily adopted US GAAP instead of HGB to decrease earnings management in subsidiaries. This is an example of embedding a new accounting system in the organization, which PricewaterhouseCoopers suggests is a key determinant of the resulting accounting quality.
11
the findings in the prior literature (reviewed in Section 2.1.2), we expect incentives to
dominate. Observing a significant reduction in earnings management and more timely
loss recognition after IFRS adoption among the voluntary adopters and not among the
resisters would support this conjecture.
3. Methodology
We examine two dimensions of accounting quality that are widely used in
contemporary research, namely, earnings management and timely loss recognition. In
the analyses we compare the same firms’ accounting quality both pre- and post- IFRS
adoption, effectively using each firm as its own control. We do not attempt to test
whether firms that voluntarily adopt IFRS are associated with higher accounting
quality than firms that resist IFRS. Such a test would require a matched sample.
Matching would either greatly reduce the sample size or be ineffective due to the
small number of potential matching candidates in our single-country setting.8
3.1. Earnings management
We follow Barth et al. (2008) by focusing on two kinds of earnings management,
earnings smoothing and managing towards small positive earnings. Earnings
smoothing is measured by three constructs: the variability of changes in earnings, the
variability of changes in earnings relative to the variability of changes in cash flows
and the negative correlation between accruals and cash flows. A high variability of
earnings is consistent with less smoothing of earnings (Lang et al., 2003; Leuz et al.,
2003; Ball and Shivakumar, 2005; Ball and Shivakumar, 2006; Lang et al., 2006;
Barth et al., 2008). Although it is intuitive that managers who prefer smooth earnings
will discretionally apply accruals to reduce the variance, a high variance is also
consistent with managers applying their discretion to take “big baths” or of errors in
accruals, both of which are associated with low quality accounting (Leuz et al., 2003;
Barth et al., 2008). Thus, the interpretation of the results is not unambiguous.
8 In the sensitivity analyses of Section 4.4, we compare the changes in accounting quality between the two groups to evaluate the extent to which they are driven by time trends.
12
We apply the methodology in Barth et al. (2008) as closely as possible to ensure that
our results are comparable to prior literature. For the metrics used to examine earnings
smoothing we use the residuals from the regressions of Equations (1) to (4) below.
Note that we use the residuals rather than the raw changes to mitigate confounding
effects. In particular, Barth et al. (2008) argue that this methodology reduces the
influence of changing incentives around IFRS adoption. Thus, by applying this
methodology we effectively load the dice against finding support for the hypothesis.
The equations are as follows:
(1)
(2)
(3)
(4)
where ∆NI is change in net income; ∆CF is change in annual cash flow from
operations; CF is annual net cash flow from operating activities; ACC is earnings less
cash flow from operations; SIZE is the natural logarithm of the market value of equity
at the end of the year; GROWTH is percentage change in sales; EISSUE is an
indicator that equals one if the firm issued equity; LEV is end-of-year total liabilities
divided by end-of-year book value of equity; DISSUE is percentage change in total
liabilities; TURN is sales divided by end-of-year total assets; AUD is an indicator
variable that equals one if the firm’s auditor is PwC, KPMG, Arthur Andersen, E&Y
,6
111110
98765
43210
itik
ikitit
ititititit
ititititit
IDUMCLOSEXLIST
NUMEXAUDCFTURNDISSUE
LEVEISSUEGROWTHSIZENI
εααα
αααααααααα
++++
+++++++++=∆
∑=
+
,6
111110
98765
43210
itik
ikitit
ititititit
ititititit
IDUMCLOSEXLIST
NUMEXAUDCFTURNDISSUE
LEVEISSUEGROWTHSIZECF
εααα
αααααααααα
++++
+++++++++=∆
∑=
+
,6
111110
9865
43210
itik
ikitit
itititit
ititititit
IDUMCLOSEXLIST
NUMEXAUDTURNDISSUE
LEVEISSUEGROWTHSIZECF
εααα
ααααααααα
++++
++++++++=
∑=
+
,6
111110
9865
43210
itik
ikitit
itititit
ititititit
IDUMCLOSEXLIST
NUMEXAUDTURNDISSUE
LEVEISSUEGROWTHSIZEACC
εααα
ααααααααα
++++
++++++++=
∑=
+
13
or D&T and zero otherwise; NUMEX is the number of exchanges on which a firm’s
stock is listed; XLIST is an indicator variable that equals one if the firm is listed on
any US stock exchange; CLOSE is the percentage of closely held shares of the firm
reported by WorldScope9; and IDUM are industry indicators.
We estimate Equations (1) to (4) as pooled regressions including all observations. We
calculate all of the metrics in the pre-adoption and post-adoption period separately for
voluntary adopters and resisters. To test for statistical significance we follow Barth et
al. (2008) by applying a t-test based on the empirical distribution of the differences.
To obtain the distribution we randomly select firm observations with replacement and
calculate the difference between the pre-adoption and post-adoption period. We
obtain the distribution of the difference by repeating the procedure 1,000 times.
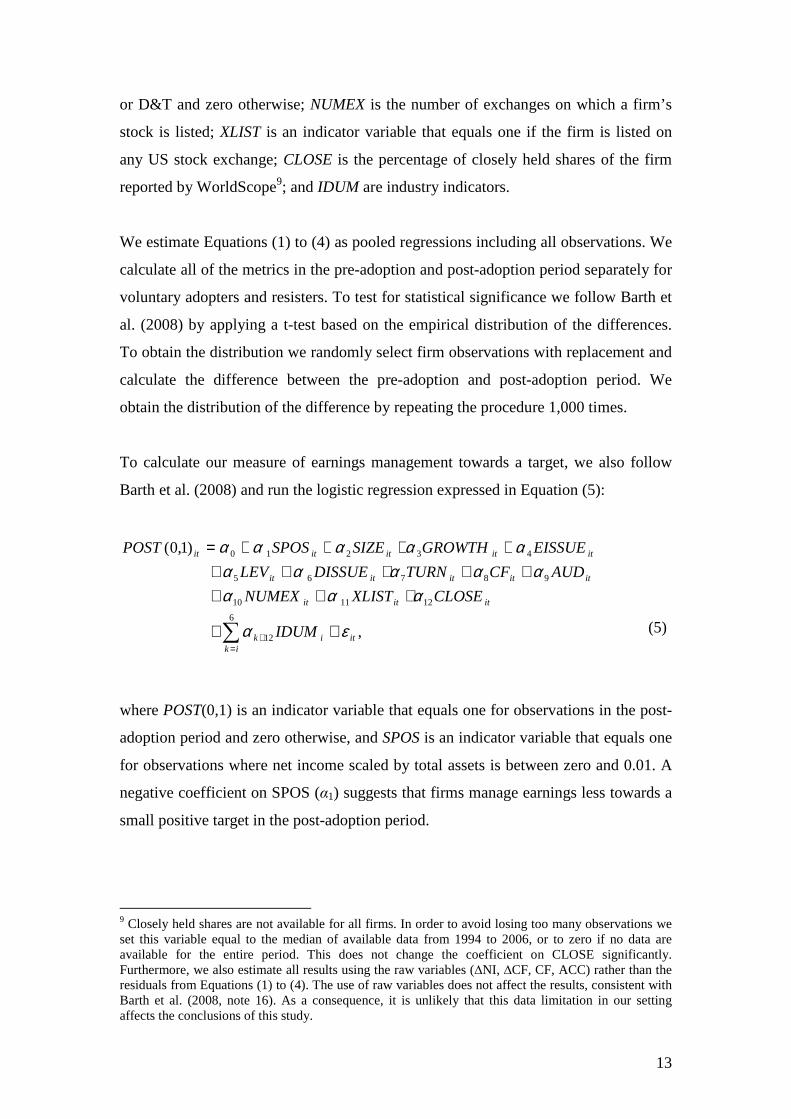
To calculate our measure of earnings management towards a target, we also follow
Barth et al. (2008) and run the logistic regression expressed in Equation (5):
(5)
where POST(0,1) is an indicator variable that equals one for observations in the post-
adoption period and zero otherwise, and SPOS is an indicator variable that equals one
for observations where net income scaled by total assets is between zero and 0.01. A
negative coefficient on SPOS (α1) suggests that firms manage earnings less towards a
small positive target in the post-adoption period.
9 Closely held shares are not available for all firms. In order to avoid losing too many observations we set this variable equal to the median of available data from 1994 to 2006, or to zero if no data are available for the entire period. This does not change the coefficient on CLOSE significantly. Furthermore, we also estimate all results using the raw variables (∆NI, ∆CF, CF, ACC) rather than the residuals from Equations (1) to (4). The use of raw variables does not affect the results, consistent with Barth et al. (2008, note 16). As a consequence, it is unlikely that this data limitation in our setting affects the conclusions of this study.
,
)1,0(
6
12
121110
98765
43210
itik
ik
ititit
ititititit
ititititit
IDUM
CLOSEXLISTNUMEX
AUDCFTURNDISSUELEV
EISSUEGROWTHSIZESPOSPOST
εα
αααααααα
ααααα
++
++++++++
++++=
∑=
+
14
3.2. Timely loss recognition
For our first measure of timely loss recognition we follow Barth et al. (2008) by
running the logistic regression in Equation (6):
(6)
where LNEG is an indicator variable that equals one for observations in which annual
net income scaled by total assets is less than –0.20, and zero otherwise. A positive
coefficient on LNEG suggests that IFRS firms recognize large losses more frequently
in the post-adoption period than they do in the pre-adoption period.
Our two remaining measures of timely loss recognition follow Ball et al. (2003). The
first measure relies on the methodology in Basu (1997) as expressed in Equation (7):
,*32101
itititititt
it RDRRRDP
NI εββββ ++++=−
(7)
where NI is net income per share, P is the share price, R is the fiscal year return
including dividend and RD is an indicator variable that takes the value one if R < 0
and zero otherwise. We run the regression in Equation (7) separately in the pre-
adoption and post-adoption periods. A higher incremental coefficient on bad news
(β3) in the post-adoption period is consistent with more timely loss recognition after
IFRS adoption.
The second measure we apply, from Ball et al. (2003), captures the persistence of
earnings changes as expressed in Equation (8):
,*2
1,1,3
2
1,21,10
1it
t
titi
t
titi
t
it
TA
NINID
TA
NINID
TA
NI ελλλλ +∆
+∆
++=∆
−
−−
−
−−
−
(8)
,
)1,0(
6
12
121110
98765
43210
itik
ik
ititit
ititititit
ititititit
IDUM
CLOSEXLISTNUMEX
AUDCFTURNDISSUELEV
EISSUEGROWTHSIZELNEGPOST
εα
αααααααα
ααααα
++
++++++++
++++=
∑=
+
15
where ∆NI is the change in net income, TA is total assets, and NID is an indicator
taking the value one if ∆NI< 0 and zero otherwise. A larger negative coefficient on
negative income (λ3) in the post-adoption period is consistent with more timely loss
recognition after IFRS adoption, i.e., losses are less persistent.
3.3. Sample and data
We include all inactive and existing firms domiciled in Germany that have data on
accounting standards applied available in Datastream. For each of these firms we
check the applied accounting standards to the annual reports. Table 1 presents two
general samples. The Switch sample is used in all analyses of accounting quality while
the Cross-sectional sample is used in the additional tests of insider characteristics. A
firm is only included in the Switch sample if it clearly states that it complies with
HGB the year before adoption and IFRS the year after. We include firms for which
we cannot find an annual report for the year before and after adoption in the Cross-
Sectional sample as long as we have an annual report according to IFRS for 2004.
Firms that comply with US GAAP or that complied with US GAAP in a prior year are
excluded. We also exclude firms that adopted IFRS prior to 1998 from the Switch
sample. 1998 was the year when the International Accounting Standard Committee
(IASC) completed its core standards. Thus, firms adopting prior to 1998 adopted a
less comprehensive set of accounting standards, which could be important in the
assessment of accounting quality. We obtain the annual reports from Thomson One
Banker. If the annual reports are not available in Thomson One Banker we search the
firm’s website. All other variables are obtained from Datastream, WorldScope and
Thomson Ownership. Table 1, Panel A describes the sample selection process in
detail. The final Switch sample consists of 177 resister firms that did not adopt IFRS
until 2005, when it became mandatory, and 133 firms that voluntarily adopted IFRS
prior to 2005. The Cross-Sectional sample includes an additional 123 firms that
adopted IFRS prior to 2004 but for which we cannot identify the year the firm
switched to IFRS. For the accounting quality metrics we include data for fiscal years
16
1993 to 2006.10 Table 1, Panel B presents the distribution of adoption years for each
sample.
Insert table 1
3.4. Treatment of outliers
Following Barth et al. (2008) we winsorize the accounting variables used to construct
the test metrics of Equations (1) to (4) (∆NI, ∆CF, ACC, CF and all non-dummy
control variables) at the 5% level. The high level of winsorization reflects the fact that
metrics based on variability are sensitive to outliers.11
We follow Ball et al. (2003; 2005) and Basu (1997) and truncate rather than winsorize
the data used in estimating the timely loss recognition tests in Equation (7) (R and NI)
and the persistence of earnings changes (∆NI) in Equation (8). We report results
where the variables are truncated at the 1% level for Equation (7) (consistent with
prior literature) and the 2% level for Equation (8). If we only truncate the variables in
Equation (8) at the 1% level (as prior literature does) the results are influenced by a
few outliers.
4. Empirical findings
4.1. Descriptive statistics
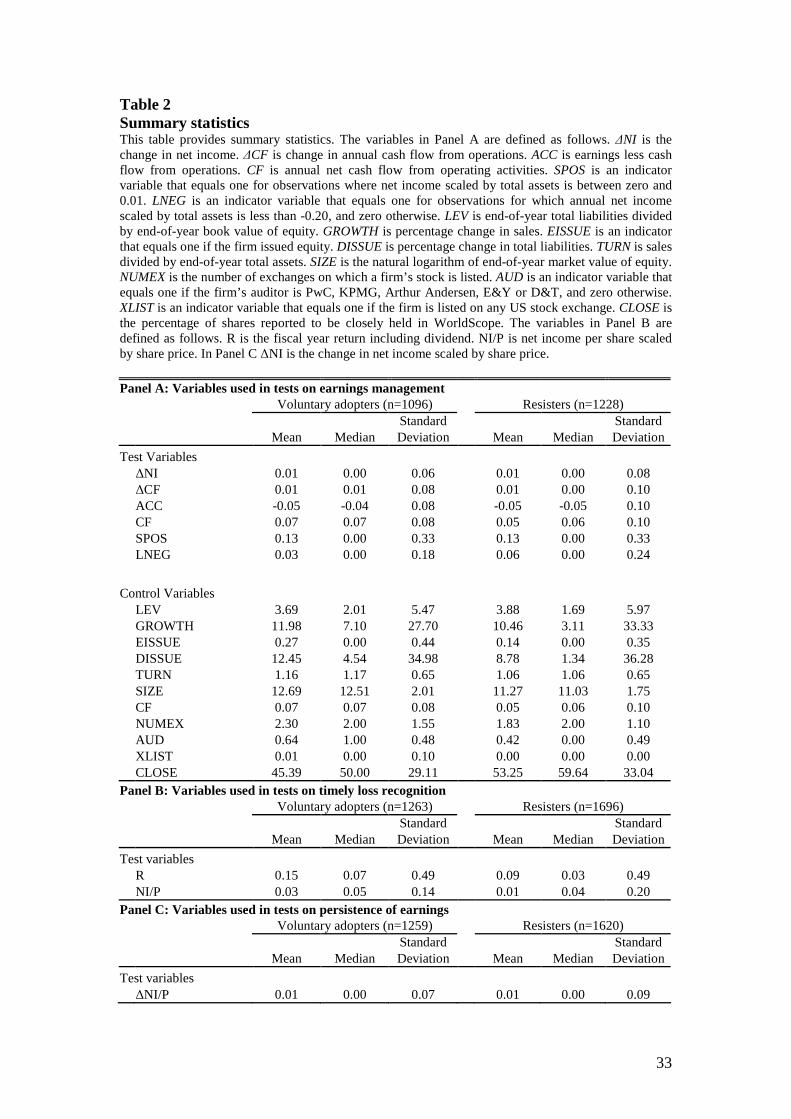
Table 2 presents descriptive statistics on all variables used in the analysis of
accounting quality. Panel A includes the variables used in the tests that follow the
methodology of Barth et al. (2008). Among the test variables the only large difference
between voluntary adopters and resisters is the proportion of large losses. The
statistics are generally close to those reported by Barth et al. (2008). The descriptive
statistics on the control variables show that on average the voluntary adopters have
10 As we need to calculate the change in the accounting variables, we lose the observations for the first year for all metrics. For the loss persistency measure in Equation (8) we lose the first two years of observations. 11 We replicate all tests where we winsorize at the 2% level. In these tests the variance of the metrics is higher but the inference we draw from the results remains unchanged.
17
lower leverage, issue more equity and debt, are larger and listed on more exchanges,
are more likely to be audited by a large auditor and cross-listed in the US, and have
less closely held shares. This is consistent with the findings of prior research.
Compared to Barth et al. (2008), our sample contains fewer firms cross-listed in the
US, as the majority of German firms cross-listed in the US comply, or have complied,
with US GAAP and consequently are excluded from our sample.
Insert table 2
Table 2, Panels B and C include the variables used in the tests that follow the
methodology of Ball et al. (2003). Returns and net income are on average higher for
voluntary adopters than resisters, which could reflect industry differences (in all tests
we use the firm as its own control; we do not attempt to draw comparisons between
the two groups). The scaled change in net income is only marginally above zero as we
would expect. Returns and net income numbers are similar to those in Ball et al.
(2003, Table 1). Net income is left-skewed (median > mean), both in the voluntary
adopter and resister samples, consistent with asymmetric loss recognition.
4.2. Voluntary adopters
Table 3 presents the comparison of accounting quality between the pre- and post-
adoption periods for voluntary adopters. The variability of earnings (∆NI) increases in
the post-adoption period, which is consistent with decreased earnings management.
The change in variability of earnings could be driven by underlying cash flows.
However, the variability of earnings relative to the variability of cash flows (∆NI/
∆CF) indicates that this is not the case. The negative correlation between accruals and
cash flows is also reduced in the post-adoption period, which implies reduced
earnings management. These changes are all significant at the 5% level (p-values <
0.01). The coefficient on small positive profits in the regression of Equation (5) is
negative, which would be consistent with less earnings management towards a target
in the post-adoption period had it been statistically significant. These results are
18
consistent in direction with those reported in Barth et al. (2008, Table 5). The
magnitude of the change and the statistical significance is stronger in our sample.12
Insert table 3
The positive coefficient on LNEG in the Equation (6) regression suggests that firms
are more likely to recognize large losses in the post-adoption period, although this
result is not statistically significant. The incremental timeliness of bad news in
Equation (7) (β3) also increases in the post-adoption period, which suggests more
timely loss recognition after firms voluntarily adopt IFRS. The change in the bad
news coefficient from pre- to post-adoption is marginally significant. Finally, the
results for the regression of Equation (8) show a reduced persistence of losses in the
post-adoption period. The difference in loss persistence is significant at the 5% level.
These results document a reduction in earnings management and an increase in the
timeliness of loss recognition after voluntary IFRS adoption.
4.3. Resisters
Table 4 presents the comparison of accounting quality between the pre- and post
adoption periods for resisters. The variability of earnings (∆NI) significantly
decreases in the post-adoption period, which suggests an increase in earnings
management. The variability of earnings relative to the variability of cash flows
(∆NI/∆CF) indicates that the majority of the change in earnings variability is
attributable to underlying cash flows, although part of the reduction remains
unexplained. The negative correlation between accruals and cash flows also increases
in the post-adoption period when no controls are included, which would suggest
increased earnings management had it been statistically significant. When we include
controls we observe a decrease in correlation, which would be consistent with less
earnings management if the result were statistically significant. The coefficient on
small positive profits in regression (5) is positive and significant (p-value 0.0335),
which indicates more earnings management towards a target after IFRS adoption.
12 This is most likely due to our hand collected data on the accounting standards applied. In collecting data for this paper we observed that the information on accounting standards available in commercial databases includes many errors prior to 2003. These errors may have weakened the results in Barth et al. (2008).
19
Insert table 4
The significantly negative coefficient on LNEG in the regression of Equation (6)
suggests that firms are less likely to recognize large losses in the post-adoption period
(p-value 0.017). The incremental timeliness of bad news in Equation (7) (β3) is also
reduced in the post-adoption period and the change is significant at the 5% level.
Finally, the results for the regression of Equation (8) show a reduced persistence of
losses in the post-adoption period. However, the difference in loss persistence is small
and not statistically significant.
The results for resisters generally indicate marginally more earnings management and
less timely loss recognition in the post-adoption period although most changes are
statistically insignificant. These findings are in sharp contrast to those reported for
voluntary adopters that showed a reduction in earnings management and an increase
in timely loss recognition.
4.4. Sensitivity tests
There are three main concerns regarding the results reported in Tables 3 and 4. First,
the metrics used tend to vary over time and consequently a time trend could be
driving the results. Second, perhaps accounting quality improvements take time to
materialize and the lack of improvements among resisters could be caused by the
availability of only two years of post-IFRS data. Third, the lack of observed quality
improvements for resisters might be driven by a lack of statistical power. We address
these three concerns in this subsection.
4.4.1. Time trend
Barth et al. (2008, Table 6) provide evidence that could be interpreted as consistent
with a time trend explaining at least some of the changes in accounting quality from
pre- to post-IFRS adoption. Similarly, Land and Lang (2002) document that
accounting quality has improved worldwide since the beginning of the 1990s, which
is long before widespread voluntary IFRS adoption began, and suggest that this could
20
be due to factors such as globalization and anticipation of international accounting
harmonization. Economic change is likely to affect accounting quality through its
impact on corporate incentives. The fact that this effect transcends periods under both
domestic GAAP and IFRS further indicates that incentives are important in
understanding the accounting quality changes. An additional reason to expect that
quality might have improved systematically in the period examined is changes to
enforcement in Germany. For instance, Brown et al. (2007) find that a German
internal control regulation implemented in 1998 is associated with systematic
improvements in financial reporting quality. If globalization and enforcement are the
main drivers of quality changes, this evidence would support the conjecture that the
formal adoption of accounting standards has little influence on accounting quality. We
test whether our results are driven by changes that are time specific rather than related
to accounting standards in Table 5.
In Table 5, Panel A we counter-factually assume that resisters adopted IFRS in 2002
(the average adoption year in the voluntary adopter sample is 2001.6 ≈ 2002). If the
results are consistent with those reported in Table 3 for voluntary adopters, this would
indicate that our findings are period specific rather than related to the accounting
standards applied. We find that the variability of earnings (∆NI) and the variability of
earnings relative to the variability of cash flows (∆NI/∆CF) increases after 2002. The
change in ∆NI is highly significant (p-value < 0.01), yet contrary to voluntary
adopters a large proportion of the change is explained by the underlying cash flows.
However, the change in ∆NI/∆CF remains significant at the 5% level (p-value
0.0314) when no controls are included. When controls are included the change
becomes insignificant (p-value 0.2819). Contrary to the results in the voluntary
adopter group (Table 3) the observed increase in the variability in earnings (∆NI) is
almost entirely explained by changes in a combination of underlying cash flows and
the control variables. The negative correlation between accruals and cash flows is
reduced after 2002, supporting reduced earnings management. This is similar in
direction to what we observed for voluntary adopters although the change is smaller
and only marginally significant when no controls are included (with controls the
change becomes insignificant). The coefficient on small losses in the Equation (5)
regression is positive, which would suggest more management towards a target if it
21
were statistically significant. In the voluntary adopter sample in Table 3 the
coefficient is negative.
Contrary to the voluntary adopter sample we only observe small changes to timely
loss recognition for the resister sample around 2002. First, timely loss recognition is
reduced after 2002, as measured by the coefficient on LNEG in the Equation (6)
regression. Second, Equation (7) (based on Basu, 1997) indicates no change from the
pre-2002 to the post-2002 period. Third, the Equation (8) regression indicates a large
and significant decrease in the persistence of losses after 2002.
The results in Table 5, Panel A indicate that there is a general increase in accounting
quality over the period, most likely caused by a time trend similar to the one identified
in prior literature (Land and Lang, 2002; Barth et al., 2008). However, the trend is
stronger among firms that voluntarily adopted IFRS in the period (for earnings
management the change is approximately twice as strong; the evidence is more mixed
for timely loss recognition). There are obvious problems in comparing resisters and
voluntary adopters in our sample (see footnote 14), so care should be taken in
interpreting the evidence. Notwithstanding, our results are generally consistent with
the finding in the prior literature that voluntary IFRS is associated with accounting
quality improvements that are not entirely explained by time trends.
Insert table 5
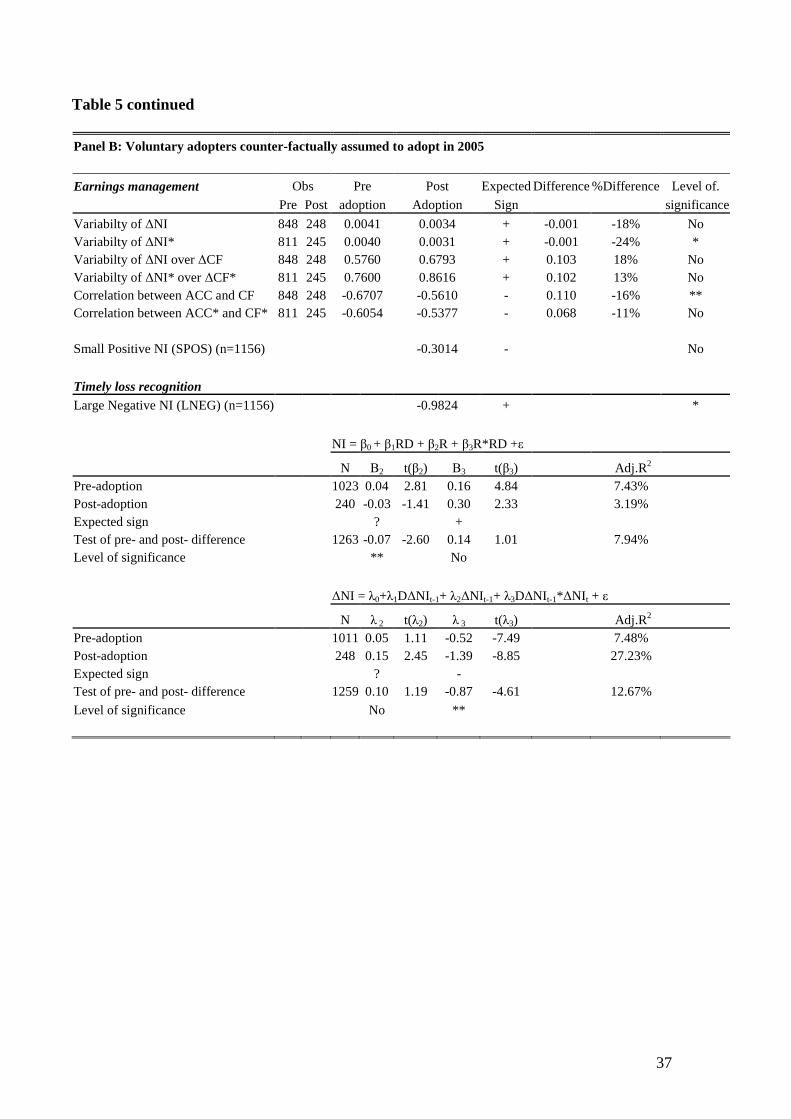
In Table 5, Panel B we address the concern that the accounting quality of resisters
might have increased post-IFRS relative to voluntary adopters, and that the observed
decrease in quality in Table 4 is driven by a time trend. We counter-factually assume
that voluntary adopters adopted IFRS in 2005 when compliance became mandatory. If
the results are consistent with those reported in Table 4 for resisters, then the evidence
would indicate that our findings are period specific. We find that the variability of
earnings changes (∆NI) decreases after 2005, but in contrast to the resisters the
reduction is entirely attributable to changes in the underlying cash flows (∆NI/∆CF).
Also different from the results for resisters in Table 4, we find that the negative
correlation between accruals and cash flows were reduced after 2005 regardless of
whether we include controls or not. Only the changes in variability of net income with
22
controls and changes in correlation between accruals and cash flows without controls
are statistically significant. The coefficient on small profits in the regression of
Equation (5) is negative but insignificant (p-value 0.1325). In the resister sample in
Table 4 the same coefficient is positive. The results for timely loss recognition are
mixed. First, timely loss recognition is reduced after 2005 as measured by the
coefficient on LNEG in Equation (6) (p-value 0.0650). Second, the test from Equation
(7) (based on Basu, 1997) indicates an increase from the period before 2005 to the
period after, although the results are not statistically significant. Third, the regression
in Equation (8) indicates a large decrease in loss persistence after 2005.
Overall, the evidence from Table 5 suggests the existence of a time trend in our
sample period. However, it is not enough to explain the difference in accounting
quality improvements between voluntary adopters and resisters. Although this effect
works against finding a difference between the two groups, its very existence
independent of the standards applied suggests that factors other than standards have a
strong impact on accounting quality. The majority of our evidence implies that
voluntary IFRS adoption is associated with accounting quality improvements that
exceed the time trend. For firms resisting IFRS the results are mixed. Although some
of their observed quality change in Table 4 appears to be explained by time trends, we
argue that this does not contradict the conclusion of the main analysis in this paper –
that is, we do not conclude that forcing firms to adopt IFRS will either improve or
reduce accounting quality; rather, we conclude that it has little or no impact, which is
consistent with the results in this section. However, because accounting quality
changes around resister firms’ IFRS adoption are important to this study, we perform
further tests on accounting quality changes around 2005 in the next subsection
(specifically, we compare the quality changes of resisters relative to voluntary
adopters around 2005).
4.4.2. Balanced panels around IFRS adoption
One of the concerns with the results in this study, and in prior literature, is that panels
are unbalanced, i.e., they do not include the same number of observations for each
firm before and after IFRS adoption. Among other things this raises the concern that
accounting quality improvements take time to materializes, and that the observed
23
differences between voluntary and resister adoption are driven by the longer time
series available after voluntary adoption.
We address this question in Table 6, Panels A and B. In Panel A we restrict our tests
to firms with data available both the year before and the year after IFRS adoption. In
Panel B we restrict the tests to firms with data available two years before and two
years after IFRS adoption. We focus on the variability of net income (∆NI) and the
variability of net income relative to the variability of cash flows (∆NI/∆CF) because
these two measures provide the strongest evidence of quality improvements around
voluntary IFRS adoption in Barth et al. (2008) and this study.13 We only report results
for changes without controls to reduce the data requirements and increase the number
of observations available.
The variability of changes in net income relative to the variability of cash flows
(∆NI/∆CF) increases sharply after voluntary IFRS adoption, regardless of whether the
change is measured one or two years after adoption. For resisters there is a small
increase in the first year but a larger decrease in the second. This suggests that quality
improves right around IFRS adoption for voluntary adopters but not for resisters.
However, these results are only significant when we apply the standard errors from
the larger sample in Table 3. Based on the standard error within the smaller sample of
Table 6, none of these results is statistically significant. We therefore view the
analysis in this section as suggestive only.
Insert table 6
In Table 6, Panel C we compare the quality changes of resisters relative to voluntary
adopters around 2005 (the year resisters adopted IFRS) based on the balanced panels.
The advantage of this approach is that it is the most intuitive way to address the time
trends documented in Section 4.4.1. The disadvantage is that the two groups of firms,
resisters and voluntary adopters, are fundamentally different as argued in Section 5
and it is not obvious that a time trend should affect these firms in the same way.14
13 Furthermore, it is difficult to measure timely loss recognition with a small number of observations. 14 A firm’s exposure to the time trend is likely to depend on the firm’s stage in the life cycle, e.g., through the growth rate. To the extent that the trend is driven by internationalization (Land and Lang,
24
Nevertheless, we find that regardless of whether we measure the quality changes from
2004 to 2005 or from 2003 and 2004 to 2005 and 2006, the inference is unchanged.
Very little happens to accounting quality and the changes point towards lower quality
after IFRS adoption.15
4.4.3. Statistical power
The setting limits the post-IFRS observations that are available for firms resisting
IFRS. It is therefore possible that the lower number of observations explains the lack
of quality improvements subsequent to IFRS adoption. Table 6 indirectly addresses
this issue with every panel having fewer observations for voluntary adopters than
resisters. We would generally observe quality decreases subsequent to IFRS adoption
for resisters and quality improvements for voluntary adopters had the test results been
statistically significant. Furthermore, the signs on the equivalent quality metrics tests
in Table 4 are also generally negative, which suggest that the lack of improvements
observed in Table 6 are not attributable to a lack of power.
5. Why do some firms resist IFRS?
The results of the analysis thus far are consistent with accounting quality not
improving when firms that resist IFRS are forced to adopt. But why do some firms
resist IFRS? That is, why do some firms lack incentives to adopt what is generally
perceived to be higher quality accounting standards? Based on the discussion in
connection with the development of the hypothesis in Section 2.3, we address this
question by looking at which firms are less sensitive to shocks to growth options and
more likely to respond to regulation by exhibiting “tick-box” behavior. More
specifically, we are looking for firms that are less likely to respond to shocks to
growth opportunities by improving financial reporting quality and adopting IFRS in
2002), it is also likely to depend on firms’ international trade. Both age and international exposure vary systematically between voluntary adopters and resisters; see Table 8. 15 In untabulated results we obtain similar findings for the other quality measures applied in this paper. However, because these measures generally rely on a large number of observations the results are less stable, i.e., the conclusions for some metrics are sensitive to the inclusion of specific observations.
25
the process.16 Such firms are likely to perceive fewer benefits from a capital market-
oriented set of accounting standards like IFRS and consequently apply a cost
minimizing strategy when subjected to it.
Several authors have suggested that a country’s orientation towards insider or outsider
financing is important in understanding its financial reporting system (e.g., Ball et al.,
2000; Ball, 2001; Leuz et al., 2003; Leuz and Wüstemann, 2004). If accounting
regulations develop to satisfy the needs of the main contracting parties in the
economy then we would expect the role of accounting to be very different in an
insider economy relative to an outsider economy. In countries with an insider
orientation, information asymmetries between managers and capital providers are
resolved through private information channels. Thus, public information channels
such as the annual report may serve other purposes, for example, determination of
dividends or taxes. It is plausible that this argument extends to the firm level. Some
firms may exhibit a higher degree of outsider orientation than other firms. The
orientation of firms could be driven by a trade-off between the costs to insiders of
losing their information advantage and the benefits from being able to exploit growth
opportunities because external financing is more easily available with an outsider
orientation.
This argument suggests that a firm’s insider orientation may be important in
understanding the decision to resist IFRS. Assume that growth opportunities are
equally distributed across all firms prior to any financial reporting decision. Since
firms with insider characteristics likely have greater insider benefits, a larger positive
shock to growth options would be needed to motivate them to change their
orientation. Thus, fewer firms with insider characteristics will switch to outsider
orientation. Furthermore, the analysis of accounting quality changes around IFRS
adoption in the previous sections indicate that voluntary adoption is associated with
changes that could be interpreted as a move towards an outsider orientation. We
therefore expect insider characteristics to be negatively correlated with the tendency
16 The fact that firms adopt IFRS in connection with accounting quality improvements does not imply that IFRS cause the quality improvements, although this is one possibility. This issue is discussed in detail in Section 2.3.
26
to adopt IFRS voluntarily and positively correlated with the tendency to resist IFRS
adoption.
To assess whether relative insider characteristics are associated with the grouping of
firms between voluntary adopters and resisters we perform a cross-sectional analysis
on the choice in 2004. Table 7 provides descriptive statistics on key characteristics
that capture firms’ orientation in the cross-sectional sample. The variables are closely
related to those used in Equations (5) and (6) but not identical, as the purpose of these
equations is to ensure that results are comparable to prior literature (in particular,
Barth et al., 2008), increasing external validity. The purpose here is to capture
differences in insider characteristics.
The descriptive statistics in Table 7 show that resisters have more bank ownership and
a higher level of long-term leverage, and they issue equity less often. This suggests
that resisters have closer relationships with banks. In Germany banks are often
insiders with representatives on the board and access to significant non-public
information (Leuz and Wüstemann, 2004). Similarly, financial analysts act as
information intermediaries and respond to demand from capital markets (Lang and
Lundholm, 1996). Thus, the observation that analyst following is lower among
resisters suggests that there is lower demand for information from the capital markets
for these firms, consistent with these firms having an insider orientation. Finally, for
resisters a larger proportion of shares is closely held, which, again, is consistent with
an insider orientation.
Insert table 7
Table 8 provides the result of a logistic regression where the dependent variable takes
the value one when a firm adopts IFRS in 2005, i.e., resists IFRS. The independent
variables are the insider characteristics and a set of control variables based on prior
literature on voluntary adoption of IFRS and US GAAP (e.g., Ashbaugh, 2001; Tarca,
2004; Cuijpers and Buijink, 2005; Gassen and Sellhorn, 2006). The advantage of the
multivariate analysis is that we are able to assess the incremental association of each
variable on the decision to resist IFRS. The disadvantage is the greatly reduced
sample due to missing variables that reduce the power of our tests. Table 8 supports
27
the findings of the univariate analysis. All insider characteristics have the predicted
signs and are significant, although not at the same level.17 Notice that bank ownership
is only positively associated with resisting IFRS when the firm is not a bank itself.
Insert table 8
The analysis of resisters’ characteristics suggests that the insider orientation of firms
may be a contributing factor to why resisters lack incentives to adopt IFRS. The lack
of incentives to adopt IFRS could explain why this group does not experience
accounting quality improvements in association with mandatory IFRS adoption.
6. Conclusion
We compare how accounting quality is affected by the adoption of IFRS for two
groups of firms: a) those that perceive net benefits of IFRS and b) those that have no
incentives to adopt and are forced to comply. The purpose is to examine whether
IFRS per se leads to accounting quality improvements. Toward this end we exploit the
unique setting that exists in Germany, where firms were able to voluntarily adopt
IFRS instead of local GAAP starting in 1998, until it became mandatory to adopt
IFRS in 2005. Economic intuition suggests that firms that voluntarily adopted prior to
2005 did so because they perceived net benefits of IFRS compliance. Consistent with
prior research we find that earnings management decreases and timely loss
recognition increases after voluntary IFRS adoption. In contrast, firms that postponed
adoption until it became mandatory in 2005 did so because they had no incentive to
adopt IFRS. We find no accounting quality improvements for firms that resist IFRS
until 2005. Although further analyses indicate that quality improvements among both
voluntary adopters and resisters are affected by temporal trends, this effect does not
explain a major part of the difference in quality changes upon adoption between the
two groups. The finding that accounting quality improvements are confined to
17 Some variables are defined slightly differently in this study compared to earlier literature. Although levels of significance and the specific combination of variables included vary across studies, the results presented here are largely consistent with prior literature on voluntary IFRS/US GAAP adoption. Thus, the presentation of the results here is simply to illustrate that the insider characteristics are correlated with incentives, not to suggest that these findings are unique to this study.
28
voluntary adopters and the existence of a time trend independent of the accounting
standards applied suggests that IFRS per se does not change accounting quality.
In additional analyses we find that firms that resist IFRS (i.e., adopt in 2005) on
average have more insider characteristics, which is consistent with an insider
orientation. This may be important in understanding the lack of incentives to adopt
IFRS and the subsequent lack of quality improvements after forced adoption.
One implication of our results is that accounting quality does not always improve with
IFRS adoption. Our results suggest that mandating IFRS will not improve accounting
quality for firms that have no incentives to adopt. A second implication is that even
when publicly listed firms are operating in the same institutional framework,
incentives dominate accounting standards in determining accounting quality.
The results suggest that the current focus on accounting standards quality might not
always yield higher accounting quality. Accounting quality improvements in
connection with the application of new standards are dependent on the incentives of
those preparing the accounts, rather than on whether the new standards are perceived
to be of higher quality.
29
References
Ashbaugh, H. (2001). "Non-US firms' accounting standard choices." Journal of Accounting and Public Policy 20(2): 129-153.
Ball, R. (2001). "Infrastructure requirements for an economically efficient system of public financial reporting and disclosure " Brookings-Wharton Papers on Financial Services: 127-169.
Ball, R., S. P. Kothari and A. Robin (2000). "The effect of international institutional factors on properties of accounting earnings." Journal of Accounting and Economics 29(1): 1-51.
Ball, R., A. Robin and J. S. Wu (2003). "Incentives versus standards: Properties of accounting income in four East Asian countries." Journal of Accounting and Economics 36(1-3): 235-270.
Ball, R. and L. Shivakumar (2005). "Earnings quality in UK private firms: Comparative loss recognition timeliness." Journal of Accounting and Economics 39(1): 83-128.
Ball, R. and L. Shivakumar (2006). "The role of accruals in asymmetrically timely gain and loss recognition." Journal of Accounting Research 44(2): 207-242.
Barth, M. E., W. R. Landsman and M. H. Lang (2008). "International accounting standards and accounting quality." forthcoming, Journal of Accounting Research.
Barth, M. E., W. R. Landsman, M. H. Lang and C. D. Williams (2006). Accounting quality: International accounting standards and US GAAP, SSRN.
Basu, S. (1997). "The conservatism principle and the asymmetric timeliness of earnings." Journal of Accounting and Economics 24(1): 3-37.
Bradshaw, M. T. and G. S. Miller (2007). "Will harmonizing accounting standards really harmonize accounting? Evidence from non-U.S. Firms adopting US GAAP." Journal of Accounting, Auditing and Finance (forthcoming).
Brown, N. C., C. Strohm and A. Wömpener (2007). The effect of internal control regulation on earnings quality: Evidence from Germany*, SSRN.
Burghstahler, D. C., L. Hail and C. Leuz (2006). "The importance of reporting incentives: Earnings management in European private and public firms." Accounting Review 81(5): 983-1016.
Christensen, H. B., E. Lee and M. Walker (2007). "Cross-sectional variation in the economic consequences of international accounting harmonisation: The case of mandatory IFRS adoption in the UK." International Journal of Accounting 42, 341–379.
Cuijpers, R. and W. Buijink (2005). "Voluntary adoption of non-local GAAP in the European union: A study of determinants and consequences." European Accounting Review 14(3): 487-524.
Daske, H., L. Hail, C. Leuz and R. S. Verdi (2007a). Adopting a label: Heterogeneity in the economic consequences of IFRS adoptions, SSRN.
Daske, H., L. Hail, C. Leuz and R. S. Verdi (2007b). Mandatory IFRS reporting around the world: Early evidence on the economic consequences, SSRN.
Doidge, C., G. A. Karolyi and R. M. Stulz (2004). "Why are foreign firms listed in the U.S. worth more?" Journal of Financial Economics 71(2): 205-238.
Gassen, J. and T. Sellhorn (2006). "Applying IFRS in Germany - determinants and consequences." Betriebswirtschaftliche Forschung und Praxis 58(4).
Goncharov, I. (2005). Earnings management and its determinants: Closing gaps in empirical accounting research, Frankfurt am Main.
Hung, M. and K. Subramanyam (2007). "Financial statement effects of adopting international accounting standards: The case of Germany." Review of Accounting Studies 12(4): 623-657.
ICAEW (2007). EU implementation of IFRS and the fair value directive - a report for the European Commission.
Joos, P. and M. Lang (1994). "The effects of accounting diversity: Evidence from the European union." Journal of Accounting Research 32(3): 141-168.
Joos, P. and P. D. Wysocki (2006). Non-convergence in international accrual accounting: The role of institutional and real operating effects, MIT Sloan School of Management Working Paper.
La Porta, R., F. Lopez-de-Silanes, A. Shleifer and R. Vishny (1998). "Law and finance." Journal of Political Economy 106(6): 1113-1155.
Land, J. and M. H. Lang (2002). "Empirical evidence on the evolution of international earnings." Accounting Review 77(4): 115.
Lang, M., J. S. Raedy and M. H. Yetman (2003). "How representative are firms that are cross-listed in the United States? An analysis of accounting quality." Journal of Accounting Research 41(2): 363-386.
Lang, M., J. Smith Raedy and W. Wilson (2006). "Earnings management and cross listing: Are reconciled earnings comparable to US earnings?" Journal of Accounting and Economics 42(1-2): 255-283.
30
Lang, M. H. and R. J. Lundholm (1996). "Corporate disclosure policy and analyst behavior." The Accounting Review 71(4): 467-492.
Lee, E., M. Walker and H. B. Christensen (2008). "The impact of mandatory IFRS adoption by the EU on the cost of equity capital." Working Paper, University of Manchester.
Leuz, C. (2003). "IAS versus U.S. GAAP: Information asymmetry based evidence from Germany's New Market." Journal of Accounting Research 41(3): 445-472.
Leuz, C., D. Nanda and P. D. Wysocki (2003). "Earnings management and investor protection: An international comparison." Journal of Financial Economics 69(3): 505-527.
Leuz, C. and R. E. Verrecchia (2000). "The economic consequences of increased disclosure." Journal of Accounting Research 38(3): 91-124.
Leuz, C. and J. Wüstemann (2004). The role of accounting in the German financial system. The German financial system. J. Krahnen and R. H. Schmidt, Oxford University Press.
PwC (2004). International Financial Reporting Standards - ready for take-off?, PricewaterhouseCoopers.
Tarca, A. (2004). "International convergence of accounting practices: Choosing between IAS and US GAAP." Journal of International Financial Management & Accounting 15(1): 60-91.
Van tendeloo, B. and A. Vanstraelen (2005). "Earnings management under German GAAP versus IFRS." European Accounting Review 14(1): 155-180.
Watts, R. L. (1977). "Corporate financial statements, a product of the market and political process." Australian Journal of Management 2(1): 53.
Watts, R. L. (2003). "Conservatism in accounting Part I: Explanations and implications." Accounting Horizons 17(3): 207-221.
Watts, R. L. and J. L. Zimmerman (1978). "Towards a positive theory of the determination of accounting standards." The Accounting Review 53(1): 112-134.
Watts, R. L. and J. L. Zimmerman (1990). "Positive accounting theory: A ten year perspective." The Accounting Review 65(1): 131-156.
31
Table 1 Sample selection Panel A reports the sample selection process. For each of the subsequent tests we also require that all data needed for that particular test be available. The “switch” sample is used in all tests of accounting quality (Tables 2 – 6). The “cross-sectional” sample is used in the analysis of insider characteristics (Tables 7 – 8). Panel B reports the distribution of observations in our sample.
Panel A: The sample selection process Observations Existing German firms in Datastream May 2007 1288 - No accounting standard information -464 824 Dead German firms in Datastream May 2007 9281 - No accounting standard information -9233 48 Firms with accounting standard information 872 Not adopting in 2005 (i.e., no consolidated statements) 212 US GAAP 101 Voluntary adopters 348 Resisters 211 Firms with accounting standard information 872 Voluntary adopters 348
Classified incorrectly (i.e., resister) -3 Applied US GAAP in the past -32 Preferred stock -28 Other missing data -29
Voluntary adopters that qualify for sample 256 Resisters 211
From the early adopter sample (misclassified) 3 Preferred stock -19 Missing data -18
Resisters that qualify for sample 177 Switch sample 310 Not possible to identify switch year but prior to 2004 +123 Cross-sectional sample 433
32
Table 1 continued
Panel B: The distribution of IFRS adoption years
Tables 3, 4, and 5 Table 6: Balanced panels Tables 7 and 8
Year of adoption Switch sample One year Two years Cross-sectional sample
Total number of firms 310 57% 257 100% 196 100% 433 100%
33
Table 2 Summary statistics This table provides summary statistics. The variables in Panel A are defined as follows. ∆NI is the change in net income. ∆CF is change in annual cash flow from operations. ACC is earnings less cash flow from operations. CF is annual net cash flow from operating activities. SPOS is an indicator variable that equals one for observations where net income scaled by total assets is between zero and 0.01. LNEG is an indicator variable that equals one for observations for which annual net income scaled by total assets is less than -0.20, and zero otherwise. LEV is end-of-year total liabilities divided by end-of-year book value of equity. GROWTH is percentage change in sales. EISSUE is an indicator that equals one if the firm issued equity. DISSUE is percentage change in total liabilities. TURN is sales divided by end-of-year total assets. SIZE is the natural logarithm of end-of-year market value of equity. NUMEX is the number of exchanges on which a firm’s stock is listed. AUD is an indicator variable that equals one if the firm’s auditor is PwC, KPMG, Arthur Andersen, E&Y or D&T, and zero otherwise. XLIST is an indicator variable that equals one if the firm is listed on any US stock exchange. CLOSE is the percentage of shares reported to be closely held in WorldScope. The variables in Panel B are defined as follows. R is the fiscal year return including dividend. NI/P is net income per share scaled by share price. In Panel C ∆NI is the change in net income scaled by share price. Panel A: Variables used in tests on earnings management Voluntary adopters (n=1096) Resisters (n=1228) Standard Standard Mean Median Deviation Mean Median Deviation
Control Variables LEV 3.69 2.01 5.47 3.88 1.69 5.97 GROWTH 11.98 7.10 27.70 10.46 3.11 33.33 EISSUE 0.27 0.00 0.44 0.14 0.00 0.35 DISSUE 12.45 4.54 34.98 8.78 1.34 36.28 TURN 1.16 1.17 0.65 1.06 1.06 0.65 SIZE 12.69 12.51 2.01 11.27 11.03 1.75 CF 0.07 0.07 0.08 0.05 0.06 0.10 NUMEX 2.30 2.00 1.55 1.83 2.00 1.10 AUD 0.64 1.00 0.48 0.42 0.00 0.49 XLIST 0.01 0.00 0.10 0.00 0.00 0.00 CLOSE 45.39 50.00 29.11 53.25 59.64 33.04 Panel B: Variables used in tests on timely loss recognition Voluntary adopters (n=1263) Resisters (n=1696) Standard Standard Mean Median Deviation Mean Median Deviation
Test variables R 0.15 0.07 0.49 0.09 0.03 0.49 NI/P 0.03 0.05 0.14 0.01 0.04 0.20 Panel C: Variables used in tests on persistence of earnings Voluntary adopters (n=1259) Resisters (n=1620) Standard Standard Mean Median Deviation Mean Median Deviation
Test variables ∆NI/P 0.01 0.00 0.07 0.01 0.00 0.09
34
Table 3 Earnings management and timely loss recognition for voluntary dopters This table presents the results for voluntary adopters defined as firms that adopted IFRS from 1998 to 2004 with data available in Datastream. ∆NI*, ∆CF*, CF* and ACC* are defined as the residuals from regressions of ∆NI, ∆CF, CF and ACC, respectively, on the control variables from Table 2. The variables are defined in Table 2. The regressions are formally expressed in Equations (1) to (4).
Small Positive NI (SPOS) and Large Negative NI (LNEG) are the coefficients on SPOS and LNEG in logistic regressions where the dependent variable is an indicator taking the value one for post-adoption observations and zero for pre-adoption observations. The logistic regressions include the control variables from Table 2. The regressions are formally expressed in Equations (5) and (6). Only the coefficients on SPOS and LNEG are reported.
For the timely loss recognition regressions (Equation (7)) only the good news (β2) and incremental bad news (β3) coefficients are reported. For the earnings persistence regressions only the positive income changes (λ2) and incremental negative income changes (λ3) coefficients are reported. The equations are formally expressed in Equations (7) and (8).
Pre-adoption includes all observations before firms adopt IFRS. Post-adoption includes all observations after a firm adopts IFRS. ** indicates significance at the 5% level (one-sided tests) and * indicates significance at the 10% level (one-side tests).
Earnings management Obs Pre Post Expected Difference %Difference Level of.
Pre Post adoption adoption Sign significance
Variabilty of ∆NI 382 714 0.0028 0.0046 + 0.002 66% ** Variabilty of ∆NI* 357 699 0.0027 0.0044 + 0.002 63% ** Variabilty of ∆NI over ∆CF 382 714 0.3605 0.7581 + 0.398 110% ** Variabilty of ∆NI* over ∆CF* 357 699 0.4797 0.9820 + 0.502 105% ** Correlation between ACC and CF 382 714 -0.7530 -0.5892 + 0.164 22% ** Correlation between ACC* and CF* 357 699 -0.6670 -0.5511 + 0.116 17% ** Small Positive NI (SPOS) (n=1156) -0.0766 - No
Timely loss recognition
Large Negative NI (LNEG) (n=1156) 0.3643 + No
NI = β0 + β1RD + β2R + β3R*RD +ε
N β2 t(β2) β3 t(β3) Adj.R2 Pre-adoption 587 0.05 3.31 0.11 2.98 8.62% Post-adoption 676 0.01 0.50 0.21 4.27 7.06% Expected sign ? + Test of pre- and post- difference 1263 -0.04 -1.71 0.09 1.45 7.49% Level of significance ** *
N λ2 t(λ2) λ 3 t(λ3) Adj.R2 Pre-adoption 551 -0.06 -0.81 -0.24 -2.32 2.96% Post-adoption 708 0.12 2.43 -0.78 -9.32 12.40% Expected sign ? - Test of pre- and post- difference 1259 0.18 1.72 -0.54 -3.68 10.36%
Level of significance ** **
35
Table 4 Earnings management and timely loss recognition for resisters This table presents the results for resisters defined as firms that adopted IFRS in 2005 with data available in Datastream. ∆NI*, ∆CF*, CF* and ACC* are defined as the residuals from regressions of ∆NI, ∆CF, CF and ACC, respectively, on the control variables from Table 2. The variables are defined in Table 2. The regressions are formally expressed in Equations (1) to (4).
Small Positive NI (SPOS) and Large Negative NI (LNEG) are the coefficients on SPOS and LNEG in logistic regressions where the dependent variable is an indicator taking the value one for post-adoption observations and zero for pre-adoption observations. The logistic regressions include the control variables from Table 2. The regressions are formally expressed in Equations (5) and (6). Only the coefficients on SPOS and LNEG are reported.
For the timely loss recognition regressions (Equation (7)) only the good news (β2) and incremental bad news (β3) coefficients are reported. For the earnings persistence regressions only the positive income changes (λ2) and incremental negative income changes (λ3) coefficients are reported. The equations are formally expressed in Equations (7) and (8).
Pre-adoption includes all observations before firms adopt IFRS. Post-adoption includes all observations after a firm adopts IFRS. ** indicates significance at the 5% level (one-sided tests) and * indicates significance at the 10% level (one-side tests).
Earnings management Obs Pre Post Expected Difference %Difference Level of.
Pre Post adoption Adoption Sign Significance
Variabilty of ∆NI 940 288 0.0076 0.0049 + -0.003 -36% ** Variabilty of ∆NI* 904 283 0.0072 0.0041 + -0.003 -42% ** Variabilty of ∆NI over ∆CF 940 288 0.7667 0.7137 + -0.053 -7% No Variabilty of ∆NI* over ∆CF* 904 283 0.9691 0.8992 + -0.070 -7% No Correlation between ACC and CF 940 288 -0.5424 -0.5564 + -0.014 -3% No Correlation between ACC* and CF* 904 283 -0.5496 -0.4865 + 0.063 11% No Small Positive NI (SPOS) (n=1334) 0.3956 - **
Timely loss recognition
Large Negative NI (LNEG) (n=1334) -0.8680 + **
NI = β0 + β1RD + β2R + β3R*RD +ε
N β2 t(β2) Β3 t(β3) Adj.R2 Pre-adoption 1407 0.05 3.28 0.35 9.62 17.50% Post-adoption 289 0.10 4.59 0.12 1.13 15.21% Expected sign ? + Test of pre- and post- difference 1696 0.04 1.53 -0.22 -1.68 17.82% Level of significance * **
N λ2 t(λ2) λ 3 t(λ3) Adj.R2 Pre-adoption 1331 -0.03 -0.72 -0.42 -6.47 5.41% Post-adoption 289 -0.01 -0.20 -0.44 -2.72 2.79% Expected sign ? - Test of pre- and post- difference 1620 0.01 0.18 -0.02 -0.11 5.13%
Level of significance No No
36
Table 5 Time trends and earnings management and timely loss recognition In this table it is counter-factually assumed in Panel A that Resisters adopted IFRS in 2002 and in Panel B that Volunteer Adopters adopted IFRS in 2005. ∆NI*, ∆CF*, CF* and ACC* are defined as the residuals from regressions of ∆NI, ∆CF, CF and ACC, respectively, on the control variables from Table 2. The variables are defined in Table 2. The regressions are formally expressed in Equations (1) to (4). Small Positive NI (SPOS) and Large Negative NI (LNEG) are the coefficients on SPOS and LNEG in logistic regressions where the dependent variable is an indicator taking the value one for post-adoption observations and zero for pre-adoption observations. The logistic regressions include the control variables from Table 2. The regressions are formally expressed in Equations (5) and (6), respectively. Only the coefficients on SPOS and LNEG are reported. For the timely loss recognition regressions (Equation (7)) only the good news (β2) and incremental bad news (β3) coefficients are reported. For the earnings persistence regressions only the positive income changes (λ2) and incremental negative income changes (λ3) coefficients are reported. The equations are formally expressed in Equations (7) and (8). Pre-adoption includes all observations before firms adopt IFRS. Post-adoptions include all observations after a firm adopt IFRS. ** indicates significance at the 5% level (one-sided tests) and * indicates significance at the 10% level (one-side tests).
Panel A: Resisters counter-factually assumed to adopt in 2002
Earnings management Obs Pre Post Expected Difference %Difference Level of.
Pre Post adoption adoption Sign significance
Variabilty of ∆NI 472 756 0.0058 0.0076 + 0.002 32% ** Variabilty of ∆NI* 442 745 0.0051 0.0071 + 0.002 41% ** Variabilty of ∆NI over ∆CF 472 756 0.6268 0.8163 + 0.189 30% ** Variabilty of ∆NI* over ∆CF* 442 745 0.8789 0.9717 + 0.093 11% No Correlation between ACC and CF 472 756 -0.5979 -0.5096 + 0.088 15% * Correlation between ACC* and CF* 442 745 -0.5707 -0.5174 + 0.053 9% No Small Positive NI (SPOS) (n=1334) 0.0760 - No
Timely loss recognition
Large Negative NI (LNEG) (n=1334) -0.0644 + No
NI = β0 + β1RD + β2R + β3R*RD +ε
N Β2 t(β2) β3 t(β3) Adj.R2 Pre-adoption 943 0.02 1.45 0.33 9.22 18.81% Post-adoption 753 0.10 4.85 0.32 5.42 19.81% Expected sign ? + Test of pre- and post- difference 1696 0.08 2.97 0.00 -0.04 19.63% Level of significance ** No
N λ 2 t(λ2) λ 3 t(λ3) Adj.R2 Pre-adoption 870 -0.21 -4.50 -0.08 -0.93 4.41% Post-adoption 750 0.09 1.89 -0.65 -7.59 7.95% Expected sign ? - Test of pre- and post- difference 1620 0.30 4.50 -0.57 -4.86 7.43%
Level of significance ** **
37
Table 5 continued
Panel B: Voluntary adopters counter-factually assumed to adopt in 2005
Earnings management Obs Pre Post Expected Difference %Difference Level of.
Pre Post adoption Adoption Sign significance
Variabilty of ∆NI 848 248 0.0041 0.0034 + -0.001 -18% No Variabilty of ∆NI* 811 245 0.0040 0.0031 + -0.001 -24% * Variabilty of ∆NI over ∆CF 848 248 0.5760 0.6793 + 0.103 18% No Variabilty of ∆NI* over ∆CF* 811 245 0.7600 0.8616 + 0.102 13% No Correlation between ACC and CF 848 248 -0.6707 -0.5610 - 0.110 -16% ** Correlation between ACC* and CF* 811 245 -0.6054 -0.5377 - 0.068 -11% No Small Positive NI (SPOS) (n=1156) -0.3014 - No
Timely loss recognition
Large Negative NI (LNEG) (n=1156) -0.9824 + *
NI = β0 + β1RD + β2R + β3R*RD +ε
N Β2 t(β2) Β3 t(β3) Adj.R2 Pre-adoption 1023 0.04 2.81 0.16 4.84 7.43% Post-adoption 240 -0.03 -1.41 0.30 2.33 3.19% Expected sign ? + Test of pre- and post- difference 1263 -0.07 -2.60 0.14 1.01 7.94% Level of significance ** No
N λ 2 t(λ2) λ 3 t(λ3) Adj.R2 Pre-adoption 1011 0.05 1.11 -0.52 -7.49 7.48% Post-adoption 248 0.15 2.45 -1.39 -8.85 27.23% Expected sign ? - Test of pre- and post- difference 1259 0.10 1.19 -0.87 -4.61 12.67%
Level of significance No **
38
Table 6 Balanced panels – Comparison of voluntary adopters and resisters’ accounting quality around IFRS adoption In this table we limit the observations to firms that have an equal number of pre- and post- observations. In Panel A we include firms that have data the year before IFRS adoption and the year after. In Panel B we include firms that have data in the two years before IFRS adoption and the two years after. In Panel C we test the difference in the post-IFRS accounting quality changes of resisters against those of voluntary adopters as a control group. For the one-year tests in Panel C we exclude firms that adopted IFRS in 2003 and 2004. For the two-year tests in Panel C we exclude firms that adopted IFRS in 2002, 2003 and 2004.
Earnings management Obs Pre- Post- Expected Difference %Difference Level of Pre Post adoption adoption sign significance
Panel A: One year before and after adoption
Voluntary adopter, one year before and after adoption: Variabilty of ∆NI 95 95 0.0038 0.0043 + 0.001 14.8% No Variabilty of ∆NI over ∆CF 95 95 0.5321 0.8298 + 0.298 56.0% No Resisters, one year before and after adoption: Variabilty of ∆NI 162 162 0.0076 0.0056 + -0.002 -25.6% No Variabilty of ∆NI over ∆CF 162 162 0.6601 0.7368 + 0.077 11.6% No
Panel B: Two years before and after adoption
Voluntary adopter, two years before and after adoption: Variabilty of ∆NI 160 160 0.0030 0.0028 + -0.000 -7.7% No Variabilty of ∆NI over ∆CF 160 160 0.4792 0.6831 + 0.204 42.6% No Resister, two years before and after adoption: Variabilty of ∆NI 232 232 0.0081 0.0042 + -0.004 -48.3% No Variabilty of ∆NI over ∆CF 232 232 0.7865 0.6778 + -0.109 -13.8% No
Panel C: Change for resisters relative to voluntary adopters around 2005: Obs Post-Pre Post-Pre Expected Resister -- Voluntary Level of Rest. Vol. Resister Voluntary sign significance One year before and after adoption: Variabilty of ∆NI 324 186 -0.0019 0.0004 + -0.0023 No Variabilty of ∆NI over ∆CF 324 186 0.0767 0.1807 + -0.1039 No
Two years before and after adoption: Variabilty of ∆NI 464 248 -0.0039 -0.0025 + -0.0014 No Variabilty of ∆NI over ∆CF 464 248 -0.1087 -0.0853 + -0.0234 No
39
Table 7 Descriptive statistics on insider characteristics This table presents descriptive statistics on insider characteristics for voluntary adopters and resisters. Closely held shares represent shares held by insiders as defined by Worldscope. Bank ownership is the percentage of shares owned by banks and trusts as reported by Thompson Ownership for December 2004. Leverage is long-term debt divided by the sum of long-term debt and market value of equity. Analyst following is the natural logarithm of the number of analysts providing I/B/E/S with a forecast. Equity issue is an indicator variable that takes the value one if the firm issued equity in 2002, 2003 and 2004, and zero otherwise. Except for bank ownership and equity issue all variables are measured as the median of 2002, 2003 and 2004. The significance of differences in means (medians) is calculated using two-sample t-tests with equal variances (Wilcoxon rank-sum tests). ** indicates significance at the 5% level (one-sided tests) and * indicates significance at the 10% level (one-side tests).
Expected Voluntary adopters Resisters Test of difference direction Obs Mean Median Obs Mean Median Mean Median
Closely held shares Voluntary <
Resisters 175 51.84 51.62 110 69.20 74.03
(5.56)** (5.20)**
Bank ownership Voluntary <
Resisters 214 0.87 0.00 141 1.74 0.00
(1.45)* (-1.80)**
Bank ownership (when > 0)
Voluntary <
Resisters 94 1.99 0.37 44 5.58 0.75
(2.34)** (1.95)**
Leverage
Voluntary <
Resisters 234 0.20 0.12 172 0.25 0.15
(2.10)** (0.90)
Analyst following
Voluntary >
Resisters 256 1.37 1.10 177 0.46 0.00
(10.79)** (10.41)**
Equity issue
Voluntary >
Resisters 256 0.45 0.00 177 0.20 0.00
(5.44)** (5.27)**
40
Table 8 Multivariate analysis of insider characteristics This table provide the results of a logistic regression where the dependent variable takes the value one if the firm adopted IFRS in 2005 (resister) and zero if it adopted in 2004 or before (voluntary adopter). The insider characteristics are defined as in Table 7. The control variables are defined as follows. Growth is sales growth. Big 4 is an indicator that takes the value one if the firm was audited by PricewaterhouseCoopers, Ernst & Young, Deloitte or KPMG in 2002, 2003 or 2004, and zero otherwise. Size is the natural logarithm of market value of equity. Number of foreign segments is the number of foreign segments reported by the firm in 2005. Foreign sales to total sales are foreign sales divided by total sales as reported by Worldscope. Age is the natural logarithm of the number of years between founding and 2007. Return on assets is return on assets reported by Worldscope. Bank is an indicator that takes the value one if Worldscope classifies the firm as a bank, insurance or other financial company in 2004 and zero otherwise. Industrial is an indicator that takes the value one if Worldscope classifies the firm as an industrial company in 2004. Coefficients are followed by t-values in parentheses, using White (1980) heteroskedasticity-robust errors. ** indicates significance at the 5% level (one-sided tests) and * indicates significance at the 10% level (one-side tests).
Expected Coefficient Z sign Insider characteristics: Closely held shares + 0.0184** (2.14) Bank ownership + 0.1092** (2.47) (Bank ownership)*(Bank) - -0.1076** (-1.88) Leverage + 1.5270** (1.86) Analyst following - -1.2424** (-4.87) Equity issue - -0.8578** (-2.27) Control variables: Growth - -0.0017 (-0.17) Big 4 - -0.3824 (-0.75) Size - -0.3199** (-1.93) Number of foreign segments - -0.2312** (-2.26) Foreign sales to total sales - 0.0115 (0.36) Foreign listings (dummy) - 0.9192 (0.90) Age + 0.5661** (2.55) Return on assets ? 0.0541** (1.83) Bank (dummy) ? -0.3121 (-0.11) Industrials (dummy) ? -1.0944 (-0.41) Intercept ? 2.8855 (0.95) Observations 220