31
Incentivising innovation in the biopharmaceutical sector Presentation to the RPI Conference Professor Adrian Towse Director of the Office of Health Economics 13 th September 2011
Incentivising innovation in the biopharmaceutical sector
Presentation to the RPI Conference Professor Adrian Towse
Director of the Office of Health Economics
13th September 2011

• Objective of today’s presentation
• Types of regulation and the cost of R&D
• More efficient price/utilisation regulation
• Use of “push” and “pull” incentives
• Can we get there?
Agenda
• Look at moves away from traditional drug price regulation in HICs and at incentives for R&D for vaccines (and drugs) in LICs
• More efficient price/utilisation through indirect price control
• Need to restrict reference pricing and parallel trade
• Use of “push” and “pull” incentives to incentivise R&D:
• neglected diseases in LICs
• Orphan Drugs in HICs
• Drugs to tackle AMR resistance in HICs
• Can we get there?
Objective of today’s presentation
• Objective of today’s presentation
• Types of regulation and the cost of R&D
• More efficient price/utilisation regulation
• Use of “push” and “pull” incentives
• Can we get there?
Agenda
• Intellectual property protection
• Animal testing
• Regulation of clinical trials
• Marketing Authorisation (approval to launch the product – quality, efficacy and safety)
• Payer price/utilisation regulation
• Competition and merger law
R&D and regulation
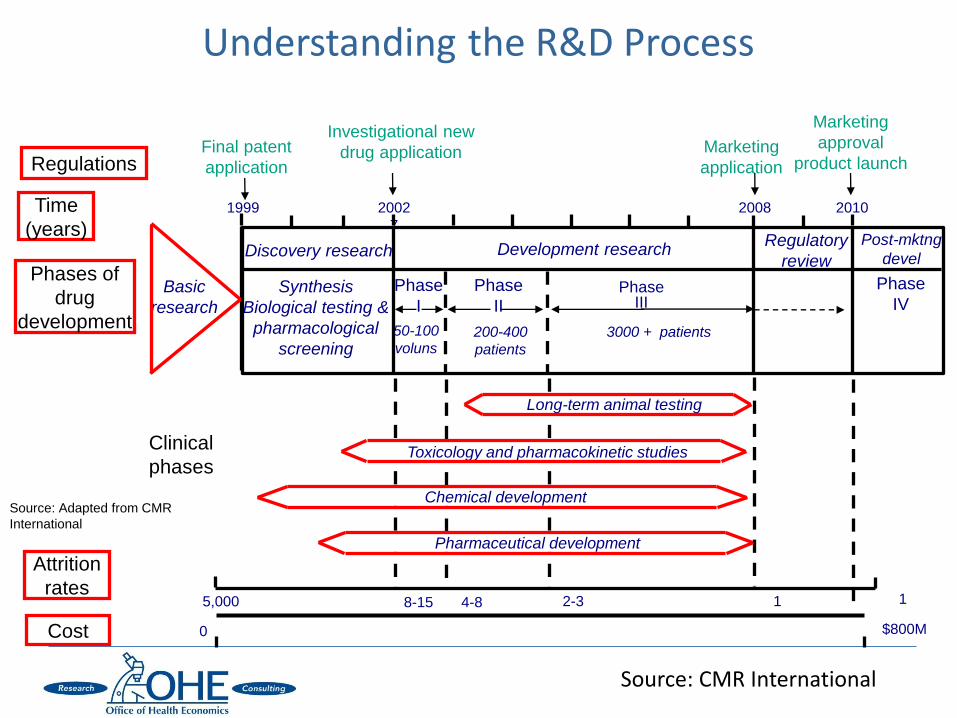
Phase III
Development research
Understanding the R&D Process
Final patent
application
Marketing
application
Attrition
rates
Cost
Post-mktng
devel
3000 + patients
Phase
IV
5,000 8-15 4-8 2-3 1 1
$800M 0
Chemical development
Pharmaceutical development
Long-term animal testing
Toxicology and pharmacokinetic studies
Source: Adapted from CMR
International
2002
7
Discovery research
Investigational new
drug application
1999
Phase
I
Phase
II Synthesis
Biological testing &
pharmacological
screening 50-100
voluns 200-400
patients
2008
Marketing
approval
product launch
2010
Regulatory
review
Regulations
Time
(years)
Phases of
drug
development
Basic
research
Clinical
phases
Source: CMR International

2009
Hansen, 1979 179
Wiggins, 1987 204
DiMasi et al., 1991 406
OTA, 1993 562
Myers and Howe, 1997 598
DiMasi et al., 2003 928
Gilbert et al., 2003
1,967 (2000-02)
1,273 (1995-2000)
Adams and Branter, 2006 1,004
Adams and Branter, 2010 1,404
Paul et al., 2010 1,735
Mestre-Ferrandiz et al., 2011 1,369
The Cost of an NME is Rising Estimates of the full cost of bringing a new molecular entity to market
(US$ million, 2009 prices)
Each bar represents one study, plotted at the year of study publication.
Source: Mestre-Ferrandiz J, Sussex J and Towse A. (2011) Updating the cost of a new medicine. Office of Health Economics – forthcoming
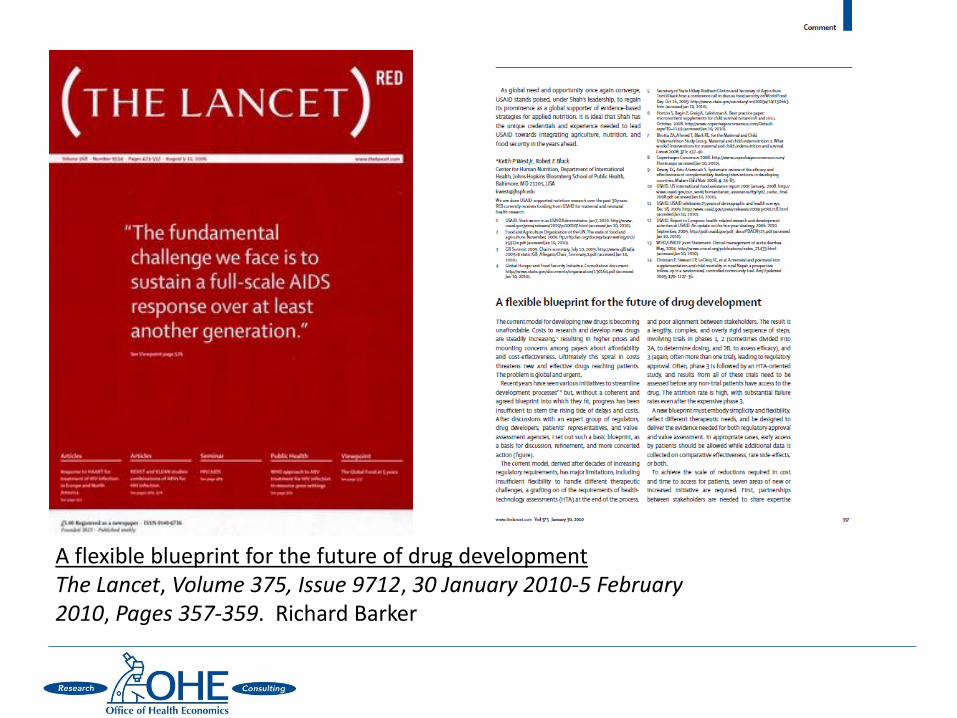
A flexible blueprint for the future of drug development The Lancet, Volume 375, Issue 9712, 30 January 2010-5 February 2010, Pages 357-359. Richard Barker
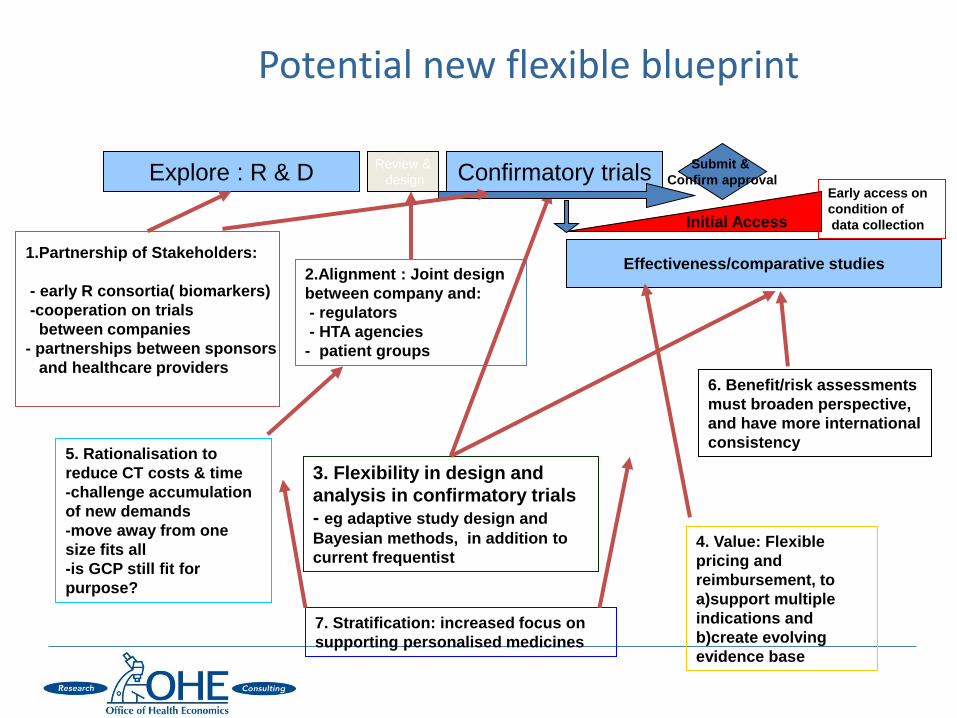
Potential new flexible blueprint
Explore : R & D
1.Partnership of Stakeholders:
- early R consortia( biomarkers)
-cooperation on trials
between companies
- partnerships between sponsors
and healthcare providers
Review &
design Confirmatory trials
Effectiveness/comparative studies
6. Benefit/risk assessments
must broaden perspective,
and have more international
consistency
2.Alignment : Joint design
between company and:
- regulators
- HTA agencies
- patient groups
3. Flexibility in design and
analysis in confirmatory trials
- eg adaptive study design and
Bayesian methods, in addition to
current frequentist
Submit &
Confirm approval
Initial Access
5. Rationalisation to
reduce CT costs & time
-challenge accumulation
of new demands
-move away from one
size fits all
-is GCP still fit for
purpose?
4. Value: Flexible
pricing and
reimbursement, to
a)support multiple
indications and
b)create evolving
evidence base
Early access on
condition of
data collection
7. Stratification: increased focus on
supporting personalised medicines

• Evidence of externalities from R&D “failures” due to disclosure associated with patenting
• Has been an interest in patent pools where others can “take out.” But mixed effects
• More important is the opportunity to “internalise” learning in Phases I and II to avoid the number of “dry holes” by sharing learning from trials as well as patenting
• Issue is how to structure to retain strong IP incentives
Use of pre-competitive collaboration
• Objective of today’s presentation
• Types of regulation and the cost of R&D
• More efficient price/utilisation regulation
• Use of “push” and “pull” incentives
• Can we get there?
Agenda
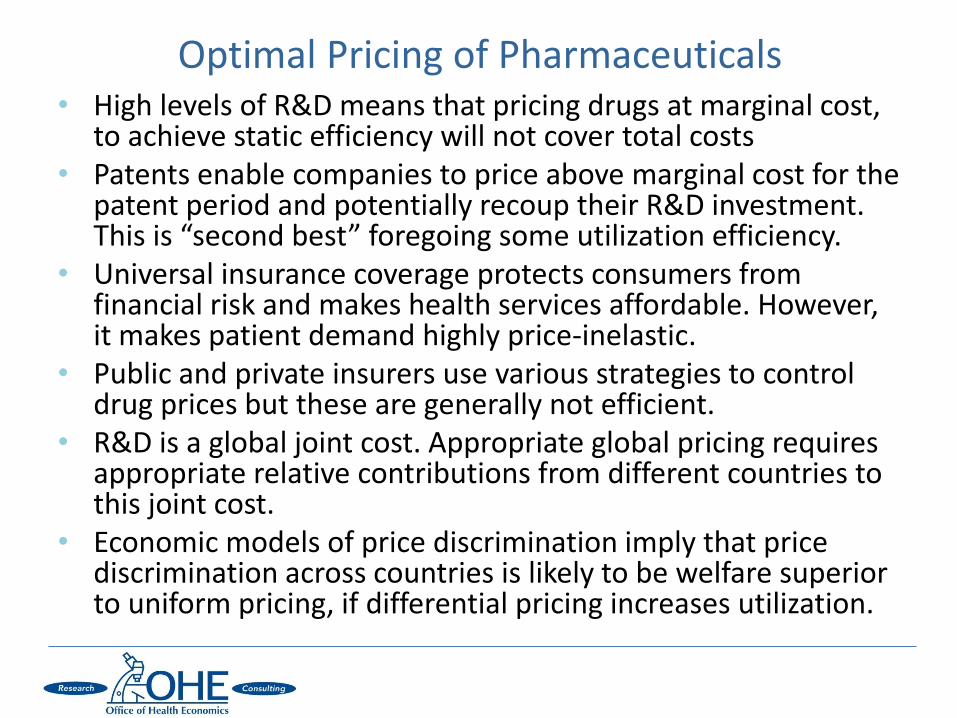
• High levels of R&D means that pricing drugs at marginal cost, to achieve static efficiency will not cover total costs
• Patents enable companies to price above marginal cost for the patent period and potentially recoup their R&D investment. This is “second best” foregoing some utilization efficiency.
• Universal insurance coverage protects consumers from financial risk and makes health services affordable. However, it makes patient demand highly price-inelastic.
• Public and private insurers use various strategies to control drug prices but these are generally not efficient.
• R&D is a global joint cost. Appropriate global pricing requires appropriate relative contributions from different countries to this joint cost.
• Economic models of price discrimination imply that price discrimination across countries is likely to be welfare superior to uniform pricing, if differential pricing increases utilization.
Optimal Pricing of Pharmaceuticals

• Garber and Phelps (1997) show that an individual will spend on a health technology at the margin when opportunity cost equals incremental health benefit. We can measure health benefit in QALYs. This is the willingness to pay for health gain or the cost-per-QALY threshold.
• They state that this “is equivalent to determining optimal coverage for an actuarially fair insurance policy, under perfect information.”
• Most countries operates a universal insurance system that covers drugs and other treatments for all citizens
• We might expect the system willingness to pay or the cost-per-QALY threshold to reflect that of a representative citizen
• *Danzon, Towse and Mulcahy, (2011).
Optimal pricing of pharmaceuticals*
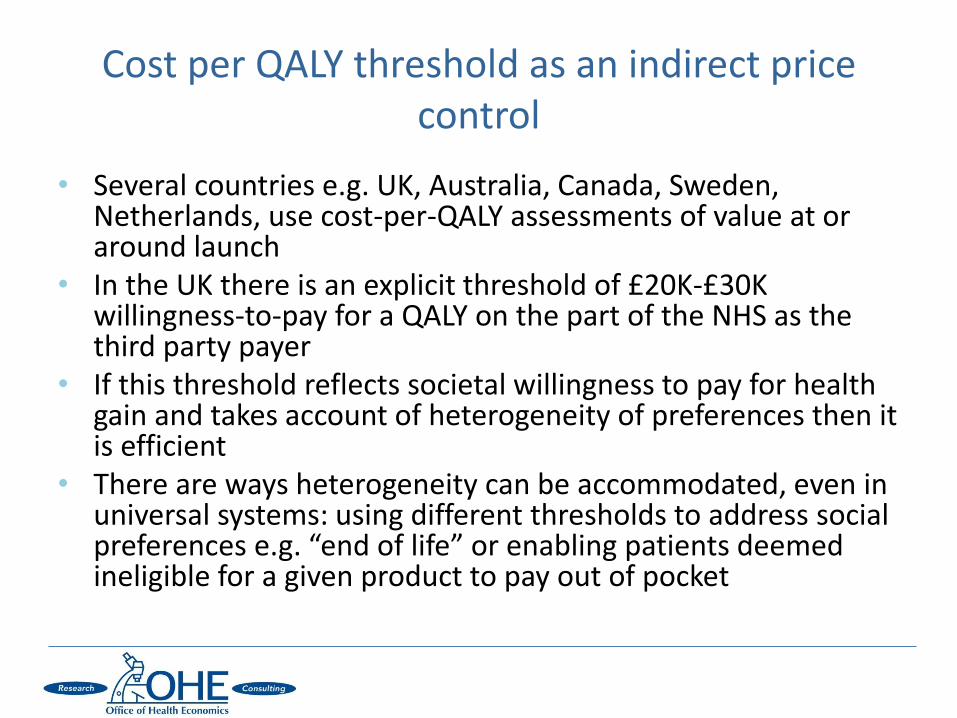
• Several countries e.g. UK, Australia, Canada, Sweden, Netherlands, use cost-per-QALY assessments of value at or around launch
• In the UK there is an explicit threshold of £20K-£30K willingness-to-pay for a QALY on the part of the NHS as the third party payer
• If this threshold reflects societal willingness to pay for health gain and takes account of heterogeneity of preferences then it is efficient
• There are ways heterogeneity can be accommodated, even in universal systems: using different thresholds to address social preferences e.g. “end of life” or enabling patients deemed ineligible for a given product to pay out of pocket
Cost per QALY threshold as an indirect price control
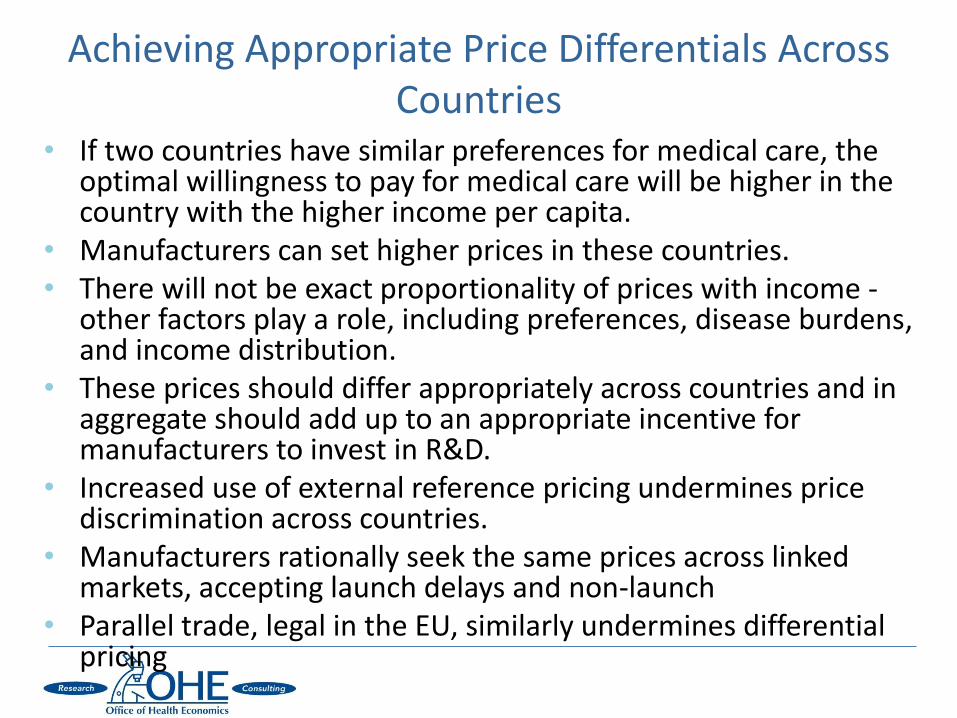
• If two countries have similar preferences for medical care, the optimal willingness to pay for medical care will be higher in the country with the higher income per capita.
• Manufacturers can set higher prices in these countries. • There will not be exact proportionality of prices with income -
other factors play a role, including preferences, disease burdens, and income distribution.
• These prices should differ appropriately across countries and in aggregate should add up to an appropriate incentive for manufacturers to invest in R&D.
• Increased use of external reference pricing undermines price discrimination across countries.
• Manufacturers rationally seek the same prices across linked markets, accepting launch delays and non-launch
• Parallel trade, legal in the EU, similarly undermines differential pricing
Achieving Appropriate Price Differentials Across Countries
• Objective of today’s presentation
• Types of regulation and the cost of R&D
• More efficient price/utilisation regulation
• Use of “push” and “pull” incentives
• Can we get there?
Agenda

• Incentives for neglected diseases
• Orphan Drug legislation
• Drugs to tackle Anti-microbial resistance
Use of “push” and “pull” incentives
Towse, Keuffel, Kettler, and Ridley (2011).
9/21/2011 CONFIDENTIAL - Pneumo forecast -
AVI ver 0.1 18
Courtesy of PATH
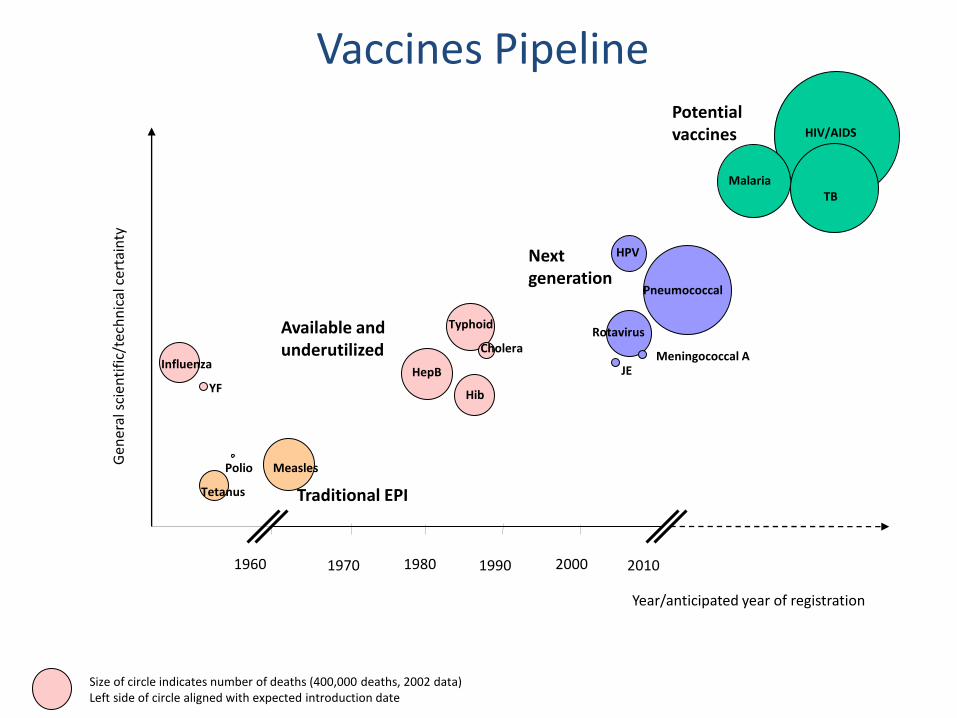
1960 1980 2000
HPV
HIV/AIDS G
ener
al s
cien
tifi
c/te
chn
ical
cer
tain
ty
YF
Polio
Tetanus
Measles
HepB
Hib
Pneumococcal
TB
Rotavirus
Malaria
Year/anticipated year of registration
Size of circle indicates number of deaths (400,000 deaths, 2002 data) Left side of circle aligned with expected introduction date
Vaccines Pipeline
1970 1990 2010
Meningococcal A
Potential vaccines
JE
Typhoid
Cholera Influenza
Next generation
Available and underutilized
Traditional EPI
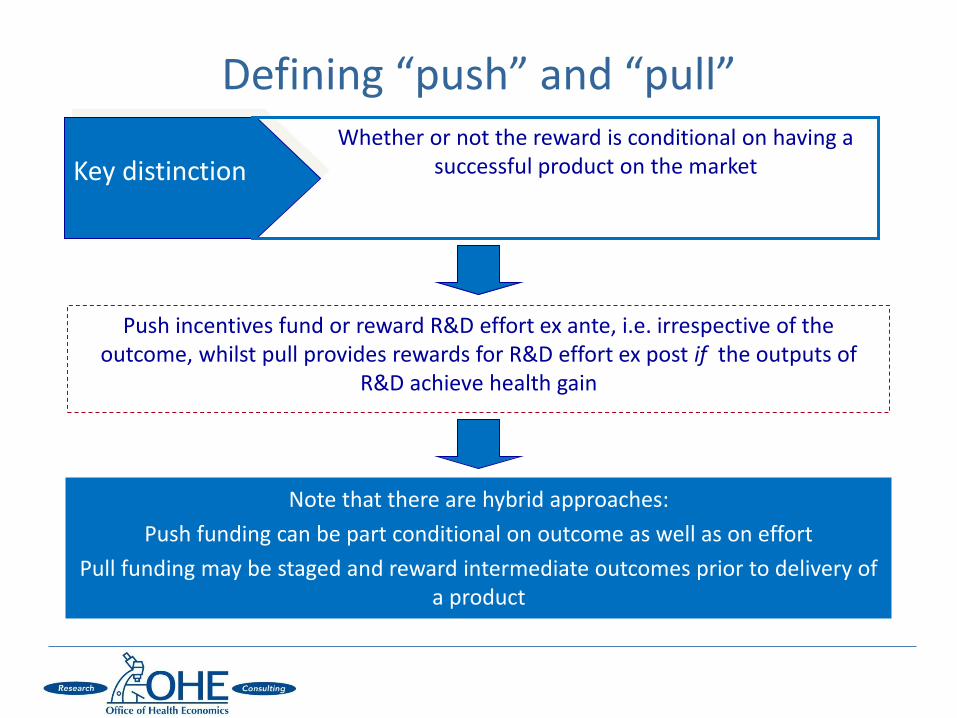
Defining “push” and “pull”
Key distinction Whether or not the reward is conditional on having a
successful product on the market
Push incentives fund or reward R&D effort ex ante, i.e. irrespective of the outcome, whilst pull provides rewards for R&D effort ex post if the outputs of
R&D achieve health gain
Note that there are hybrid approaches:
Push funding can be part conditional on outcome as well as on effort
Pull funding may be staged and reward intermediate outcomes prior to delivery of a product
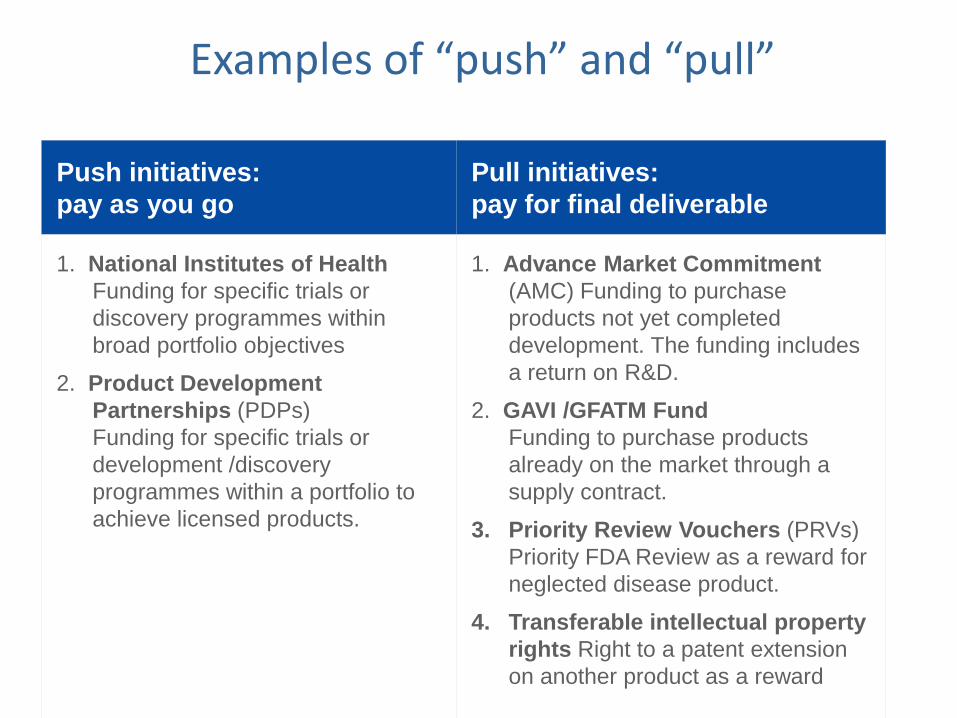
Examples of “push” and “pull”
Push initiatives:
pay as you go
Pull initiatives:
pay for final deliverable
1. National Institutes of Health
Funding for specific trials or
discovery programmes within
broad portfolio objectives
2. Product Development
Partnerships (PDPs)
Funding for specific trials or
development /discovery
programmes within a portfolio to
achieve licensed products.
1. Advance Market Commitment
(AMC) Funding to purchase
products not yet completed
development. The funding includes
a return on R&D.
2. GAVI /GFATM Fund
Funding to purchase products
already on the market through a
supply contract.
3. Priority Review Vouchers (PRVs)
Priority FDA Review as a reward for
neglected disease product.
4. Transferable intellectual property
rights Right to a patent extension
on another product as a reward
• Incentives for neglected diseases
• Orphan Drug legislation
• Drugs to tackle Anti-microbial resistance
Use of “push” and “pull” incentives

• Offer a guaranteed price for up to a certain volume (or can be a guaranteed sum or prize)
• Offer has to be credible: pre-specified target, independent review group; secure financing • Needs to meet opportunity cost (over $3bn?)
• Has to deal with follow-on products
• Is a guaranteed “tail price” at manufacturing cost
• In 2010 AMC for Pneumococcal vaccine launched for $1.5bn, covering supply
• GSK and Pfizer have qualifying products and contracts
Advanced Market Commitment
9/21/2011 CONFIDENTIAL - Pneumo forecast -
AVI ver 0.1 24
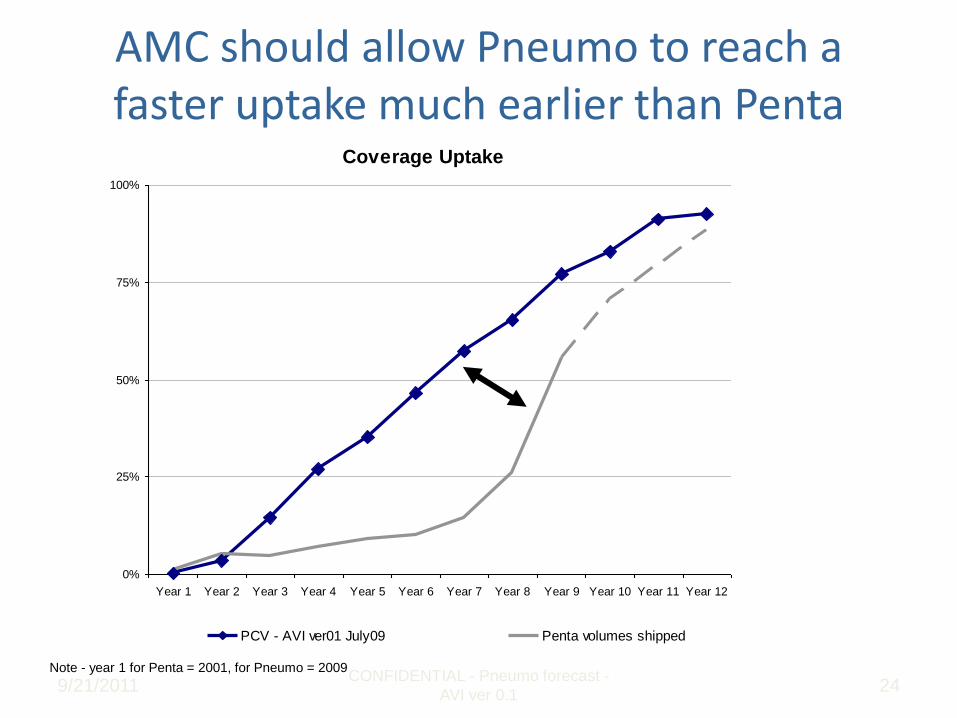
AMC should allow Pneumo to reach a faster uptake much earlier than Penta
Note - year 1 for Penta = 2001, for Pneumo = 2009
Coverage Uptake
0%
25%
50%
75%
100%
Year 1 Year 2 Year 3 Year 4 Year 5 Year 6 Year 7 Year 8 Year 9 Year 10 Year 11 Year 12
PCV - AVI ver01 July09 Penta volumes shipped

• US ODA (1983), Japanese (1993) and EU (2003)
• Push/pull combination
• Seven years of market exclusivity when launched
• Higher prices to offset low volumes
• Regulatory advice and fast track approval
• Tax breaks in the US
• But resistance by payers in Europe to high cost-per-QALY prices
Orphan Drug legislation
• Anti-microbial resistance means that drugs become ineffective
• Estimates of 20,000 deaths per annum in the EU (cost of Euro 20bn)
• Pharmaceutical companies are exiting R&D for antibacterials
• Low returns in the market (Towse and Sharma, 2011)
• Restrictions on antibacterial use
• Low prices because of use of “old” generics
• Scientific challenges
• Regulatory challenges
• EU Commission has been tasked to come up with a package of R&D incentives by the end of 2011
Drugs to tackle Anti-microbial resistance
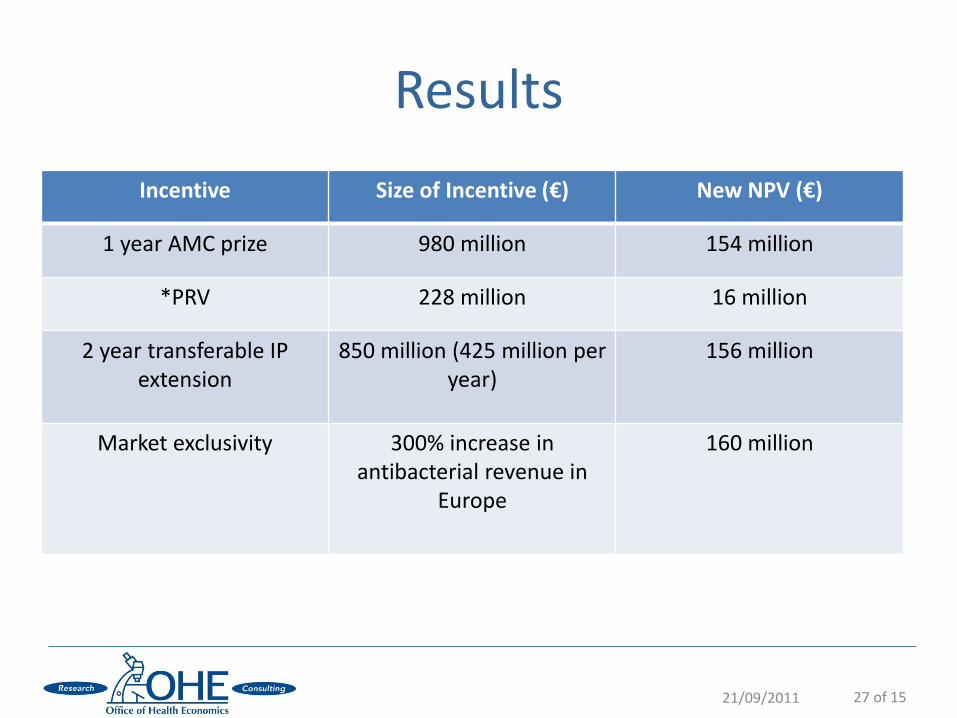
Incentive Size of Incentive (€) New NPV (€)
1 year AMC prize 980 million 154 million
*PRV 228 million 16 million
2 year transferable IP extension
850 million (425 million per year)
156 million
Market exclusivity 300% increase in antibacterial revenue in
Europe
160 million
21/09/2011 27 of 15
Results
• Based on our results we recommend the following short list of incentives
1. A hybrid policy (not dissimilar to Orphan Drug legislation) including both push and pull incentives with higher prices (but not volumes) to reflect social value. Volumes could be restricted using point-of-care tests
2. An upfront payment for registration (rather than for volume) in the form of an AMC “prize” (advance market commitment) or a Transferable IP Extension
• These alternatives could both be on offer and the preferred one chosen by the company depending on expected use
OHE Policy Recommendations for Europe

• Objective of today’s presentation
• Types of regulation and the cost of R&D
• More efficient price/utilisation regulation
• Use of “push” and “pull” incentives
• Can we get there?
Agenda

• Use of cost-per-QALY indirect price control requires explicit willingness to pay; ability to assess costs and benefits; stopping use of reference pricing and parallel trade
• Push and pull incentives require money and long term credible commitment. • Orphan drug legislation shows success but also tensions with payers
• There is resistance to “prizes”
• EU Commission will not recommend AMR R&D incentives by end 2011
• The portfolio approach to development through PDPs is working
• Recent GAVI fund raising for rotavirus vaccine shows it can still be done, but a close run thing
• The money is not there, however, to bring the neglected disease pipeline through the drug/vaccine licensing process and into use
Can we get there?

• Danzon, P.M., Towse, A. and Mulcahy, A.W. (2011). Setting cost-effectiveness thresholds as a means to achieve appropriate drug prices in rich and poor countries. Health Affairs. 30(8), 1529-1538.
• Towse, A., Keuffel, E., Kettler, H.E. and Ridley, D.B. (2011). Drugs and vaccines for developing countries. Occasional Paper. London: Office of Health Economics.
• Towse, A. and Sharma, P. (2011). Incentives for R&D for New Antimicrobial Drugs. International Journal of the Economics of Business. 18(2), 331-350.
References


