Page 1
INCIDENCE OF AFLATOXINS IN “Garri” AND
“Egusi” MELON SEEDS CONSUMED IN
TURKISH REPUBLIC OF NORTHERN CYPRUS
A THESIS SUBMITTED TO THE GRADUATE
SCHOOL OF APPLIED SCIENCES
OF
NEAR EAST UNIVERSITY
By
SULEIMAN ABDULRAHMAN HARUNA
In Partial Fulfillment of the Requirements for
the Degree of Master of Science
in
Food Engineering
NICOSIA, 2017
SU
LE
IMA
N A
BD
UL
RA
HM
AN
INC
IDE
NC
E O
F A
FL
AT
OX
INS
IN “
Garri”
AN
D “
Egu
si” M
EL
ON
SE
ED
S N
EU
HA
RU
NA
CO
NS
UM
ED
IN T
UR
KIS
H R
EP
UB
LIC
OF
NO
RT
HE
RN
CY
PR
US
201
7
Page 2
INCIDENCE OF AFLATOXINS IN “Garri” AND “Egusi”
MELON SEEDS CONSUMED IN TURKISH REPUBLIC
OF NORTHERN CYPRUS
A THESIS SUBMITTED TO THE GRADUATE
SCHOOL OF APPLIED SCIENCES
OF
NEAR EAST UNIVERSITY
By
SULEIMAN ABDULRAHMAN HARUNA
In Partial Fulfillment of the Requirements for the Degree
of Master of Science
in
Food Engineering
NICOSIA, 2017
Page 3
I hereby declare that, all information in this document has been obtained and presented in
accordance with academic rules and ethical conduct. I also declare that, as required by these
rules and conduct, I have fully cited and referenced all material and results that are not original
to this work.
Name, Last name:
Signature:
Date:
Page 4
i
ACKNOWLEDGEMENTS
I am indebted to a number of people who have been instrumental to the successful completion
of this work. I most sincerely express my profound gratitude to my supervisor Dr. Perihan
Adun, for the support, encouragement and guidance in spite of her numerous engagements.
I would like to also thank my committee members; Dr. Perihan Adun, Assist. Prof. Dr. Melis
Sūmengen Özdenefe and Assoc. Prof. Dr. Kaya Süer who make necessary appraisal towards
the completion of this work.
My appreciation also goes to my coordinator Mr. Buğra Demircioğlu and all lecturers and
staff of the Department of Food Engineering, Near East University.
I wish to also acknowledge the efforts of Kano State Government for sponsoring my master’s
program.
My endless thanks also goes to my proudly and profound family members and my friends too
numerous to mention.
Page 5
ii
To my uncle Alhaji Ubale Haruna…
Page 6
iii
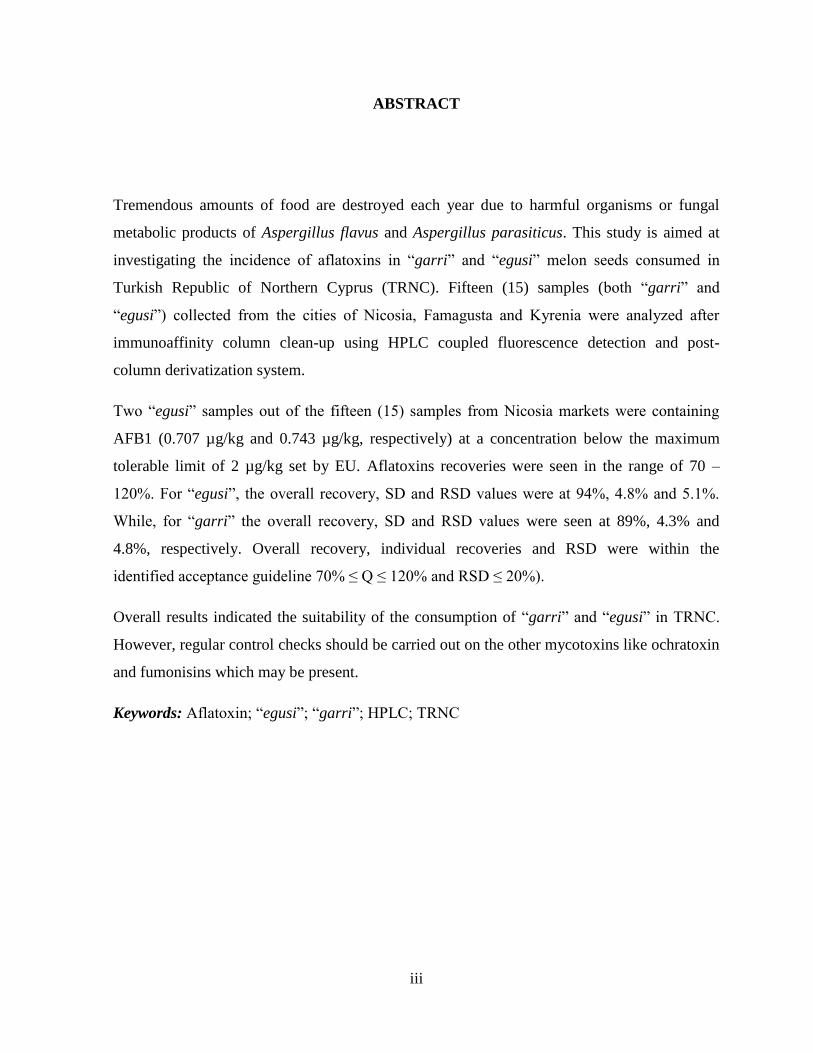
ABSTRACT
Tremendous amounts of food are destroyed each year due to harmful organisms or fungal
metabolic products of Aspergillus flavus and Aspergillus parasiticus. This study is aimed at
investigating the incidence of aflatoxins in “garri” and “egusi” melon seeds consumed in
Turkish Republic of Northern Cyprus (TRNC). Fifteen (15) samples (both “garri” and
“egusi”) collected from the cities of Nicosia, Famagusta and Kyrenia were analyzed after
immunoaffinity column clean-up using HPLC coupled fluorescence detection and post-
column derivatization system.
Two “egusi” samples out of the fifteen (15) samples from Nicosia markets were containing
AFB1 (0.707 µg/kg and 0.743 µg/kg, respectively) at a concentration below the maximum
tolerable limit of 2 µg/kg set by EU. Aflatoxins recoveries were seen in the range of 70 –
120%. For “egusi”, the overall recovery, SD and RSD values were at 94%, 4.8% and 5.1%.
While, for “garri” the overall recovery, SD and RSD values were seen at 89%, 4.3% and
4.8%, respectively. Overall recovery, individual recoveries and RSD were within the
identified acceptance guideline 70% ≤ Q ≤ 120% and RSD ≤ 20%).
Overall results indicated the suitability of the consumption of “garri” and “egusi” in TRNC.
However, regular control checks should be carried out on the other mycotoxins like ochratoxin
and fumonisins which may be present.
Keywords: Aflatoxin; “egusi”; “garri”; HPLC; TRNC
Page 7
iv
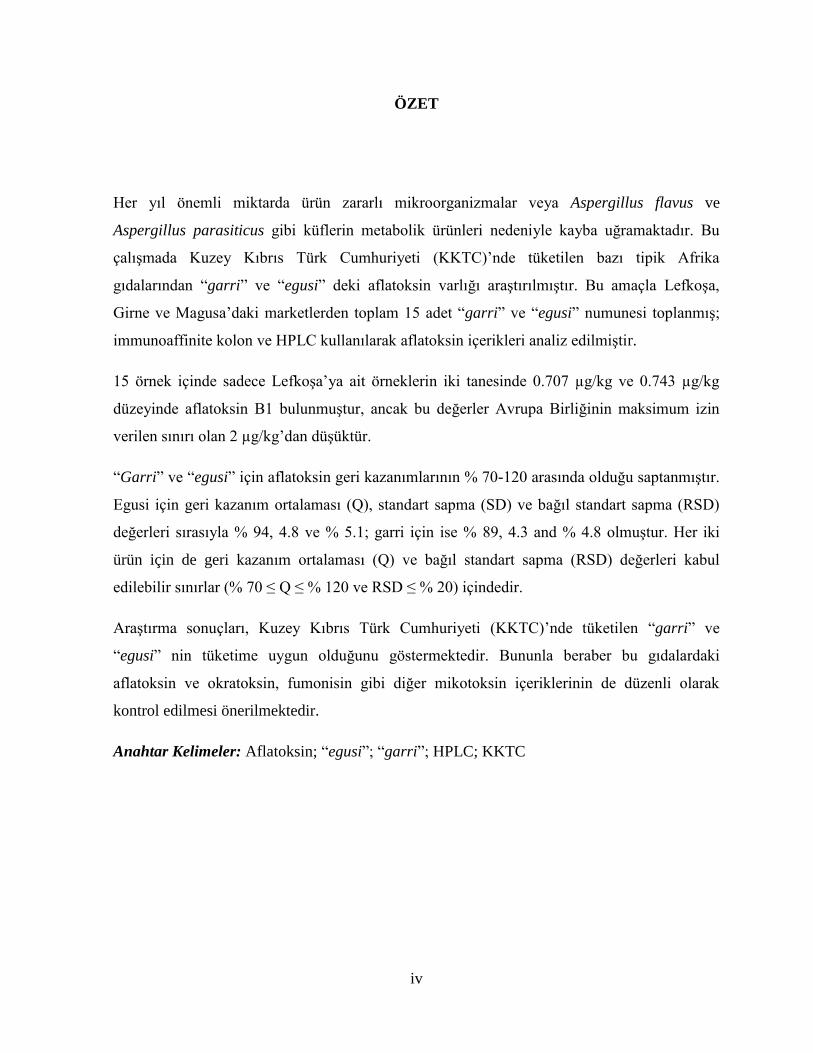
ÖZET
Her yıl önemli miktarda ürün zararlı mikroorganizmalar veya Aspergillus flavus ve
Aspergillus parasiticus gibi küflerin metabolik ürünleri nedeniyle kayba uğramaktadır. Bu
çalışmada Kuzey Kıbrıs Türk Cumhuriyeti (KKTC)’nde tüketilen bazı tipik Afrika
gıdalarından “garri” ve “egusi” deki aflatoksin varlığı araştırılmıştır. Bu amaçla Lefkoşa,
Girne ve Magusa’daki marketlerden toplam 15 adet “garri” ve “egusi” numunesi toplanmış;
immunoaffinite kolon ve HPLC kullanılarak aflatoksin içerikleri analiz edilmiştir.
15 örnek içinde sadece Lefkoşa’ya ait örneklerin iki tanesinde 0.707 µg/kg ve 0.743 µg/kg
düzeyinde aflatoksin B1 bulunmuştur, ancak bu değerler Avrupa Birliğinin maksimum izin
verilen sınırı olan 2 µg/kg’dan düşüktür.
“Garri” ve “egusi” için aflatoksin geri kazanımlarının % 70-120 arasında olduğu saptanmıştır.
Egusi için geri kazanım ortalaması (Q), standart sapma (SD) ve bağıl standart sapma (RSD)
değerleri sırasıyla % 94, 4.8 ve % 5.1; garri için ise % 89, 4.3 and % 4.8 olmuştur. Her iki
ürün için de geri kazanım ortalaması (Q) ve bağıl standart sapma (RSD) değerleri kabul
edilebilir sınırlar (% 70 ≤ Q ≤ % 120 ve RSD ≤ % 20) içindedir.
Araştırma sonuçları, Kuzey Kıbrıs Türk Cumhuriyeti (KKTC)’nde tüketilen “garri” ve
“egusi” nin tüketime uygun olduğunu göstermektedir. Bununla beraber bu gıdalardaki
aflatoksin ve okratoksin, fumonisin gibi diğer mikotoksin içeriklerinin de düzenli olarak
kontrol edilmesi önerilmektedir.
Anahtar Kelimeler: Aflatoksin; “egusi”; “garri”; HPLC; KKTC
Page 8
v
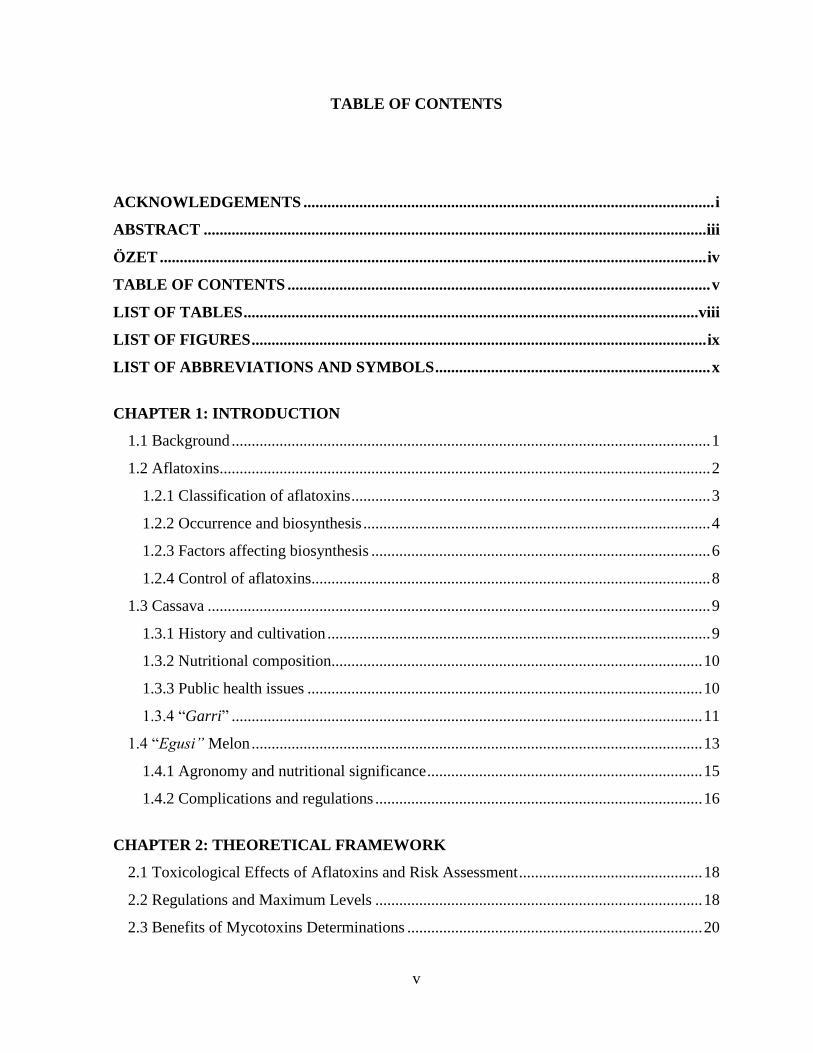
TABLE OF CONTENTS
ACKNOWLEDGEMENTS ....................................................................................................... i
ABSTRACT .............................................................................................................................. iii
ÖZET ......................................................................................................................................... iv
TABLE OF CONTENTS .......................................................................................................... v
LIST OF TABLES .................................................................................................................. viii
LIST OF FIGURES .................................................................................................................. ix
LIST OF ABBREVIATIONS AND SYMBOLS ..................................................................... x
CHAPTER 1: INTRODUCTION
1.1 Background ........................................................................................................................ 1
1.2 Aflatoxins ........................................................................................................................... 2
1.2.1 Classification of aflatoxins .......................................................................................... 3
1.2.2 Occurrence and biosynthesis ....................................................................................... 4
1.2.3 Factors affecting biosynthesis ..................................................................................... 6
1.2.4 Control of aflatoxins.................................................................................................... 8
1.3 Cassava .............................................................................................................................. 9
1.3.1 History and cultivation ................................................................................................ 9
1.3.2 Nutritional composition............................................................................................. 10
1.3.3 Public health issues ................................................................................................... 10
1.3.4 “Garri” ...................................................................................................................... 11
1.4 “Egusi” Melon ................................................................................................................. 13
1.4.1 Agronomy and nutritional significance ..................................................................... 15
1.4.2 Complications and regulations .................................................................................. 16
CHAPTER 2: THEORETICAL FRAMEWORK
2.1 Toxicological Effects of Aflatoxins and Risk Assessment .............................................. 18
2.2 Regulations and Maximum Levels .................................................................................. 18
2.3 Benefits of Mycotoxins Determinations .......................................................................... 20
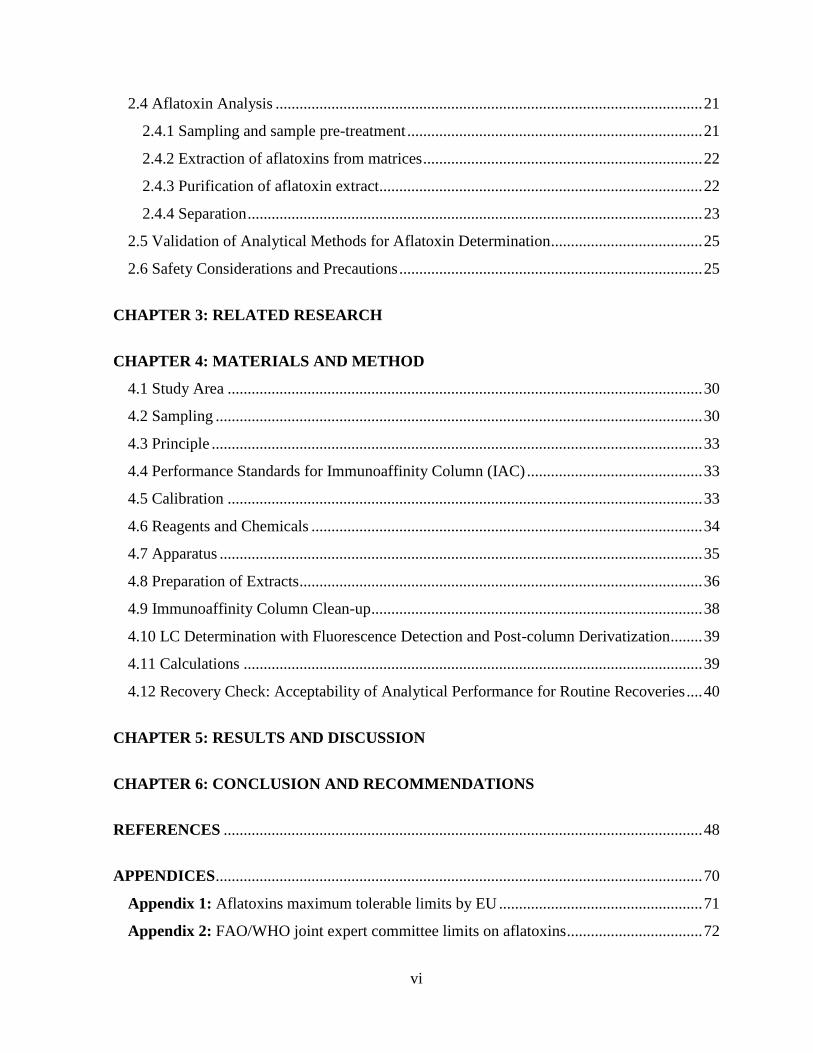
Page 9
vi
2.4 Aflatoxin Analysis ........................................................................................................... 21
2.4.1 Sampling and sample pre-treatment .......................................................................... 21
2.4.2 Extraction of aflatoxins from matrices ...................................................................... 22
2.4.3 Purification of aflatoxin extract................................................................................. 22
2.4.4 Separation .................................................................................................................. 23
2.5 Validation of Analytical Methods for Aflatoxin Determination...................................... 25
2.6 Safety Considerations and Precautions ............................................................................ 25
CHAPTER 3: RELATED RESEARCH
CHAPTER 4: MATERIALS AND METHOD
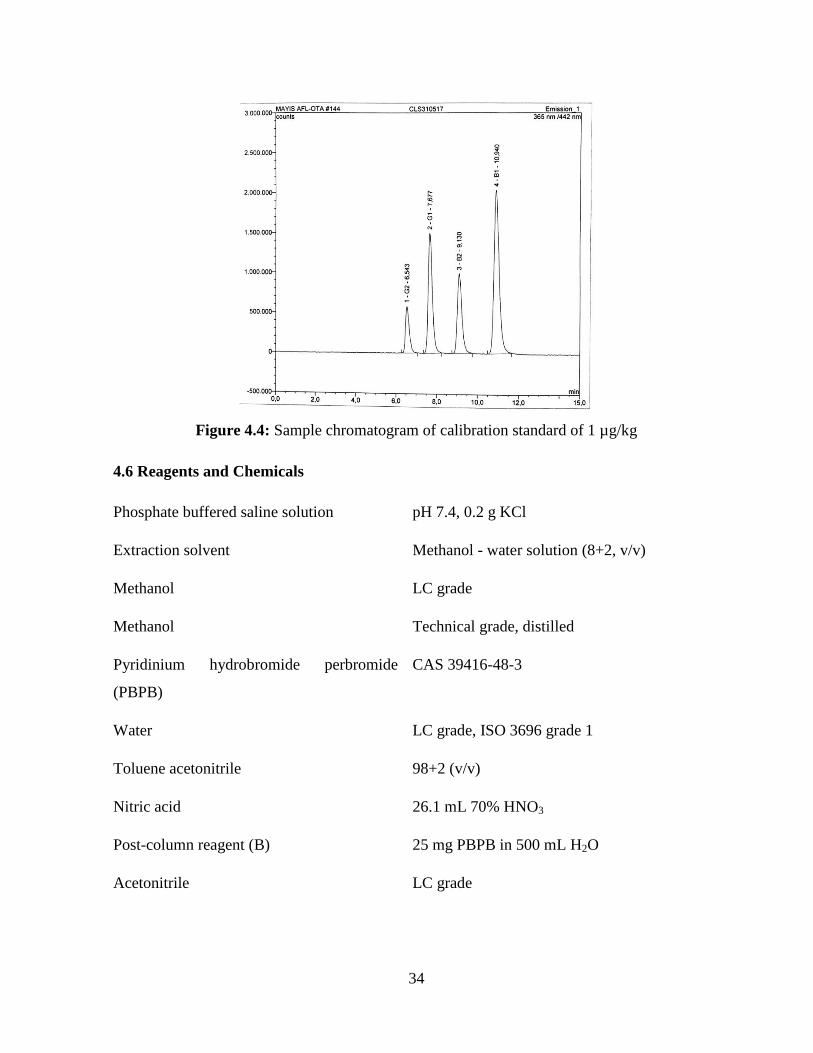
4.1 Study Area ....................................................................................................................... 30
4.2 Sampling .......................................................................................................................... 30
4.3 Principle ........................................................................................................................... 33
4.4 Performance Standards for Immunoaffinity Column (IAC) ............................................ 33
4.5 Calibration ....................................................................................................................... 33
4.6 Reagents and Chemicals .................................................................................................. 34
4.7 Apparatus ......................................................................................................................... 35
4.8 Preparation of Extracts ..................................................................................................... 36
4.9 Immunoaffinity Column Clean-up ................................................................................... 38
4.10 LC Determination with Fluorescence Detection and Post-column Derivatization ........ 39
4.11 Calculations ................................................................................................................... 39
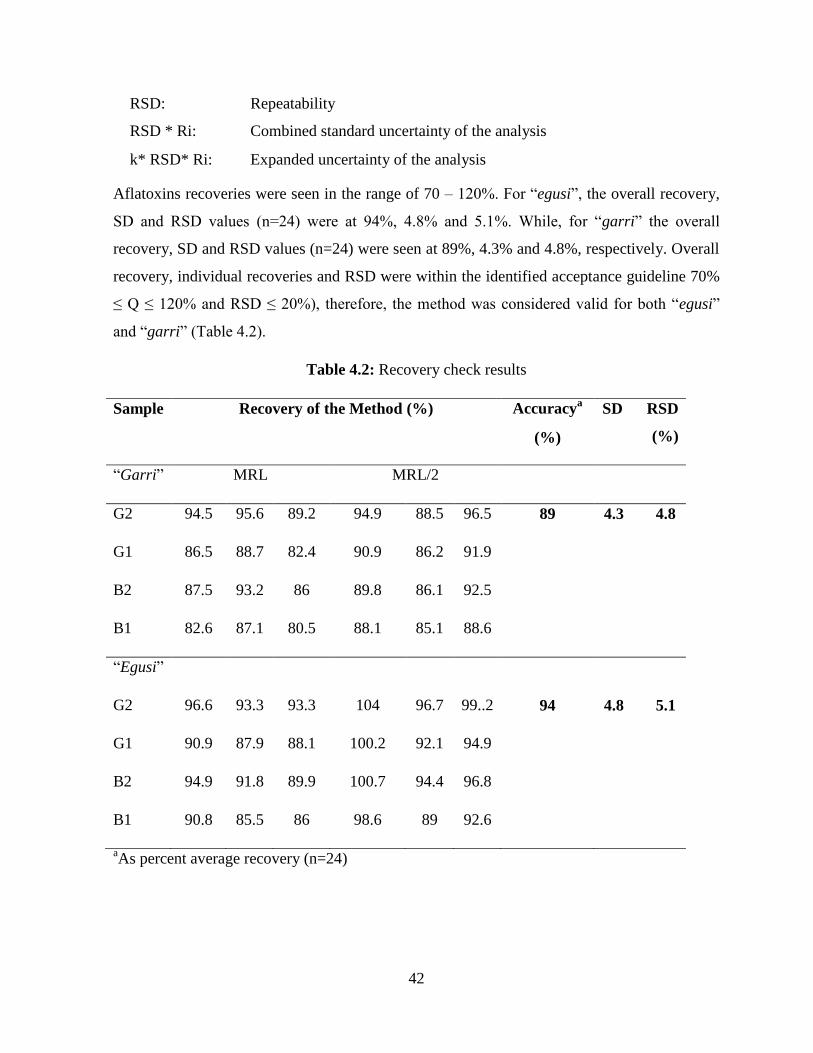
4.12 Recovery Check: Acceptability of Analytical Performance for Routine Recoveries .... 40
CHAPTER 5: RESULTS AND DISCUSSION
CHAPTER 6: CONCLUSION AND RECOMMENDATIONS
REFERENCES ........................................................................................................................ 48
APPENDICES .......................................................................................................................... 70
Appendix 1: Aflatoxins maximum tolerable limits by EU ................................................... 71
Appendix 2: FAO/WHO joint expert committee limits on aflatoxins .................................. 72
Page 10
vii
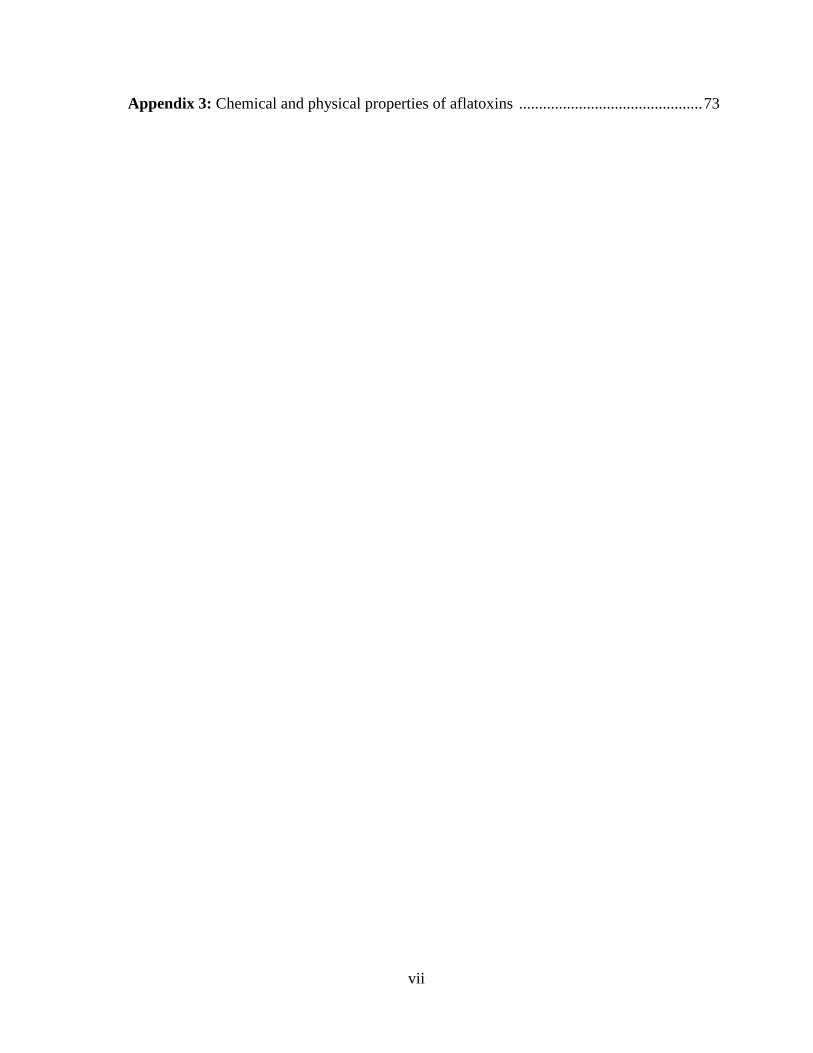
Appendix 3: Chemical and physical properties of aflatoxins .............................................. 73
Page 11
viii
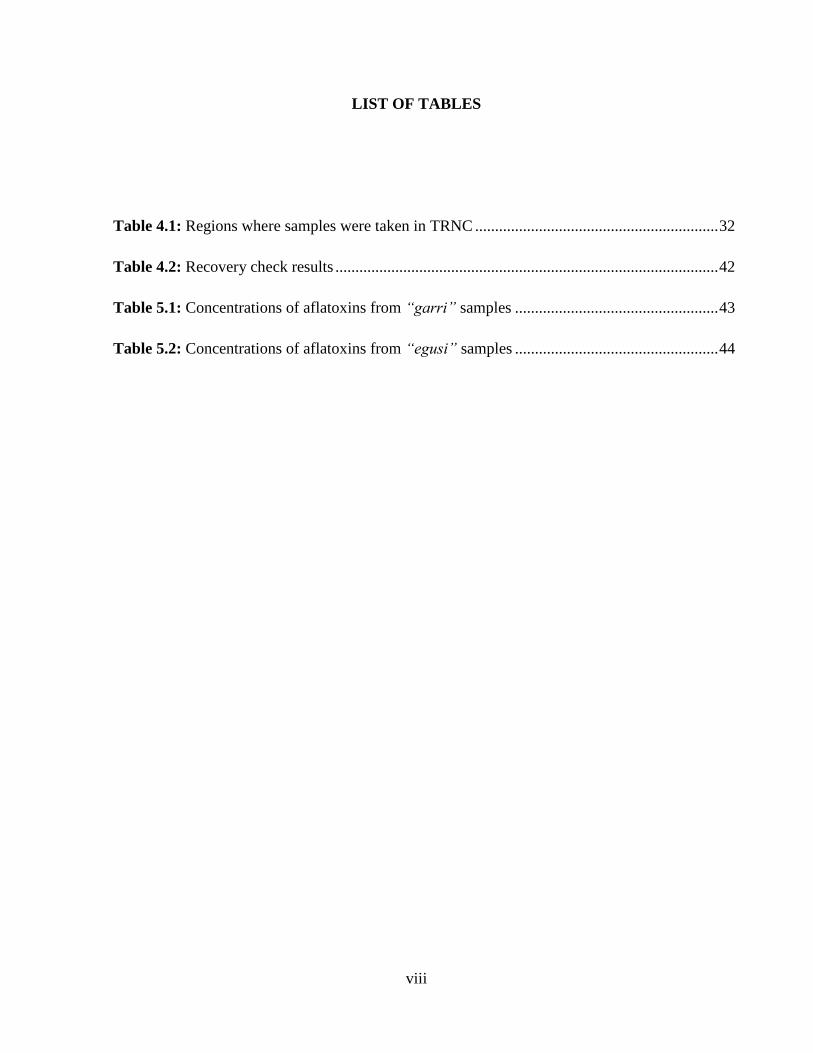
LIST OF TABLES
Table 4.1: Regions where samples were taken in TRNC ............................................................. 32
Table 4.2: Recovery check results ................................................................................................ 42
Table 5.1: Concentrations of aflatoxins from “garri” samples ................................................... 43
Table 5.2: Concentrations of aflatoxins from “egusi” samples ................................................... 44
Page 12
ix
LIST OF FIGURES
Figure 1.1: Flow chart for “garri” production ............................................................................. 12
Figure 1.2: White “garri” ............................................................................................................. 13
Figure 1.3: Yellow “garri” .......................................................................................................... 13
Figure 1.4: ‘Curcurbitaceae’ melon .............................................................................................. 14
Figure 1.5: Shelled “egusi” melon................................................................................................ 14
Figure 1.6: Unit operations in melon seed processing ................................................................ 15
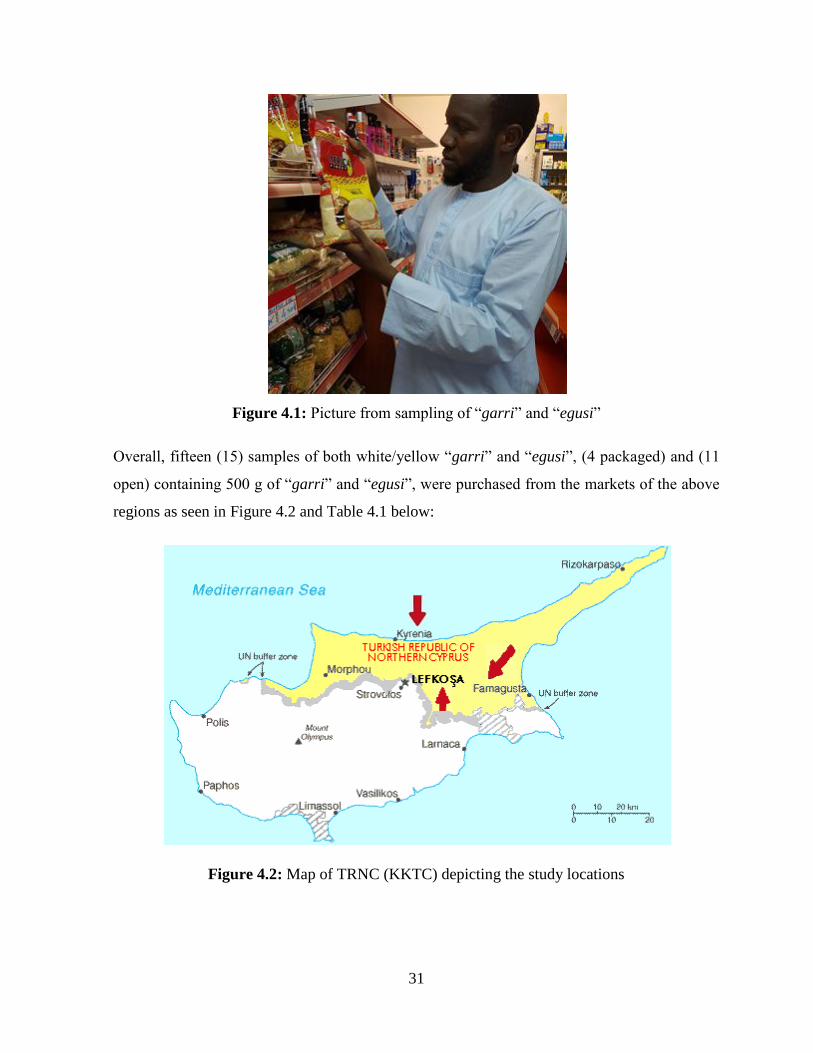
Figure 4.1: Picture from sampling of “garri” and “egusi” ........................................................... 31
Figure 4.2: Map of TRNC (KKTC) depicting the study locations ............................................... 31
Figure 4.3: HPLC machine .......................................................................................................... 33
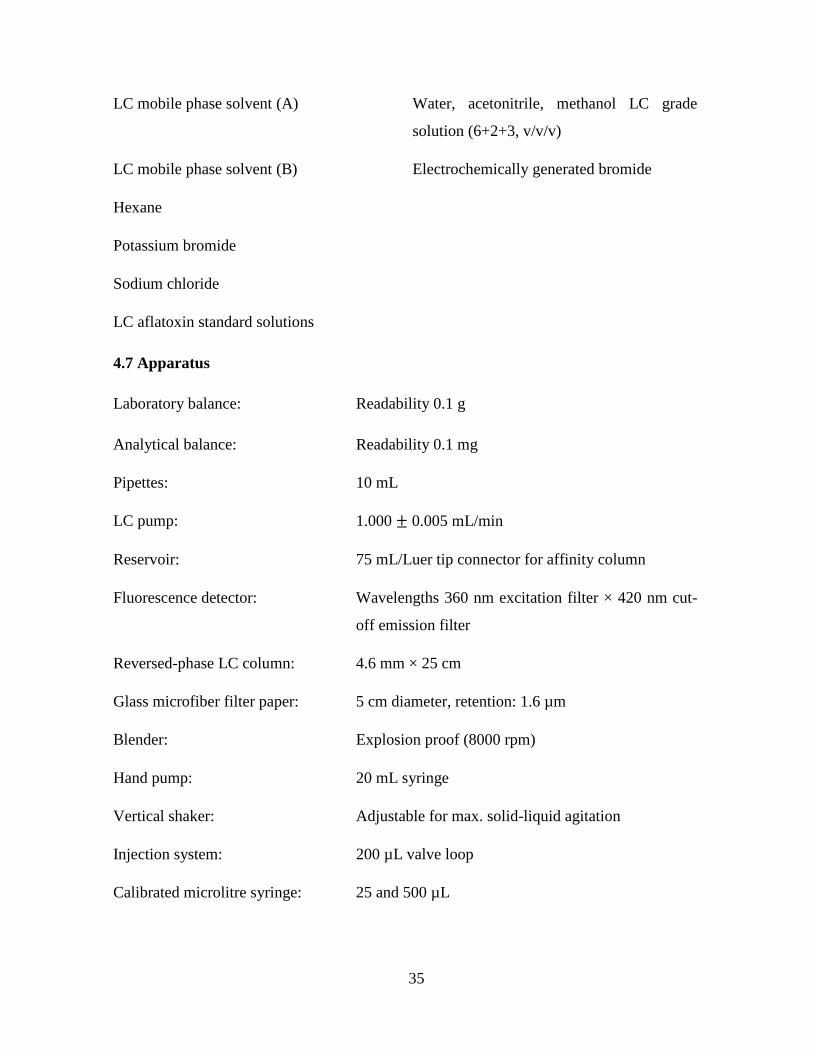
Figure 4.4: Sample chromatogram of calibration standard of 1 µg/kg ........................................ 34
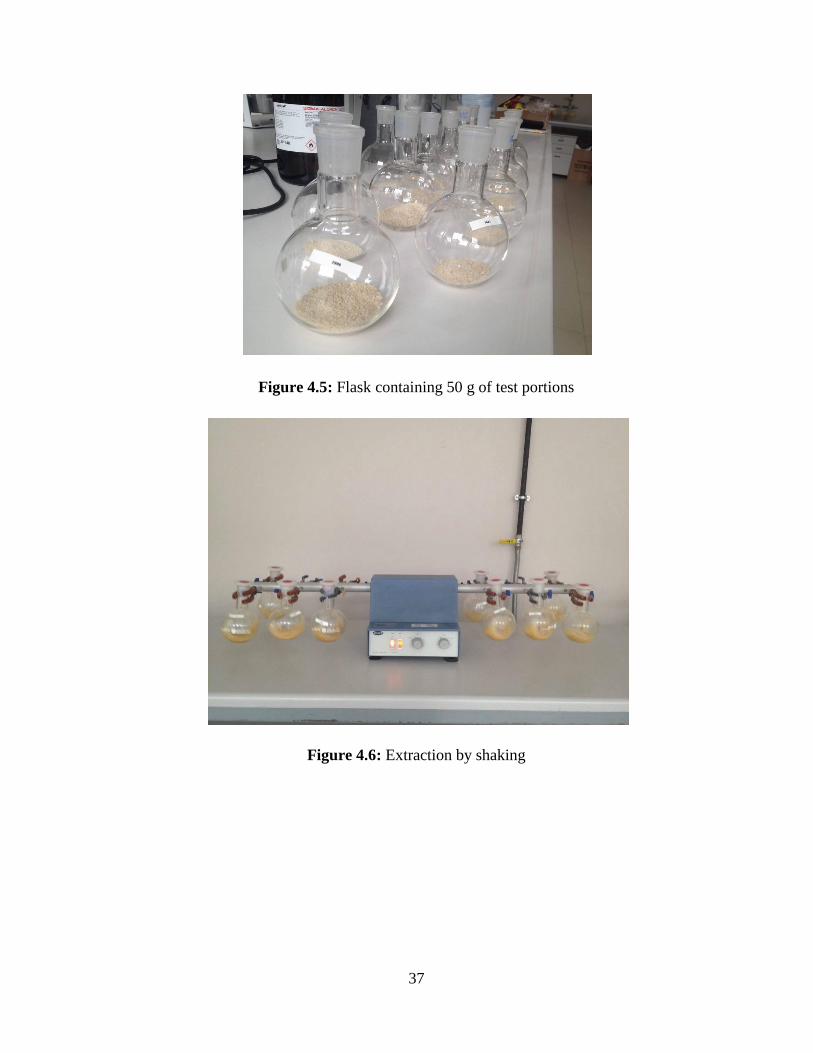
Figure 4.5: Flask containing 50 g of test portions ........................................................................ 37
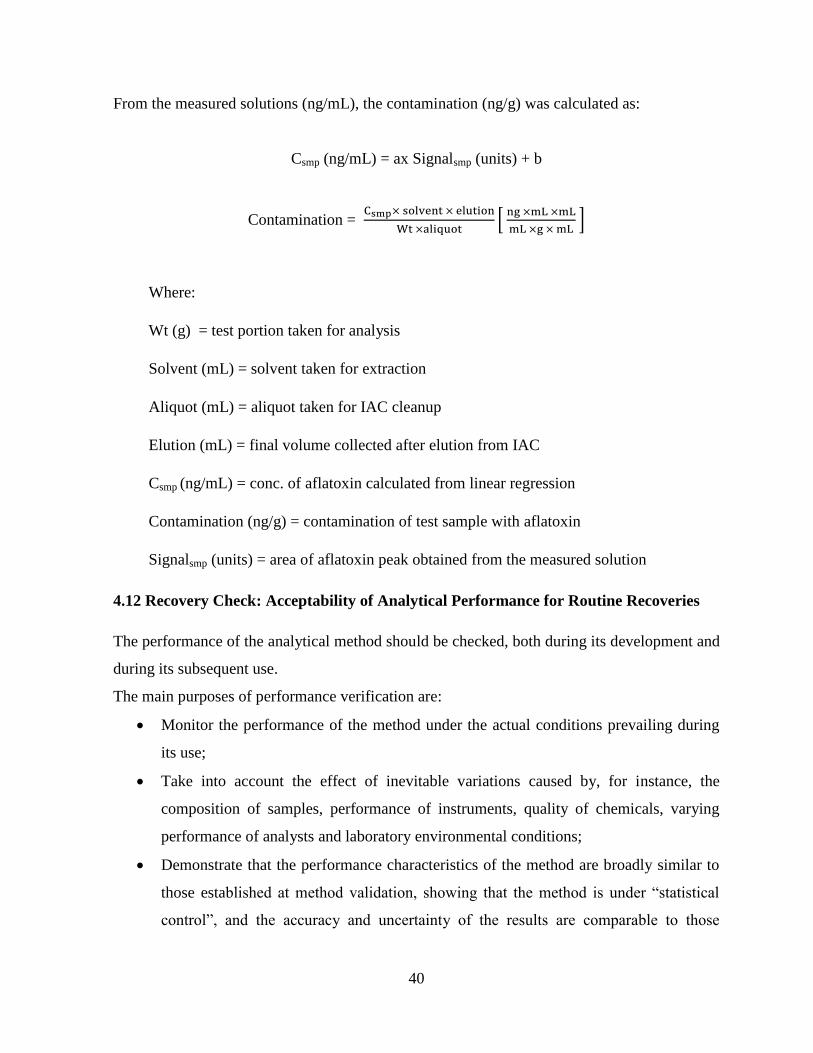
Figure 4.6: Extraction by shaking ................................................................................................ 37
Figure 4.7: Filtration of extracts ................................................................................................... 38
Figure 4.8: Immunoaffinity column clean-up .............................................................................. 38
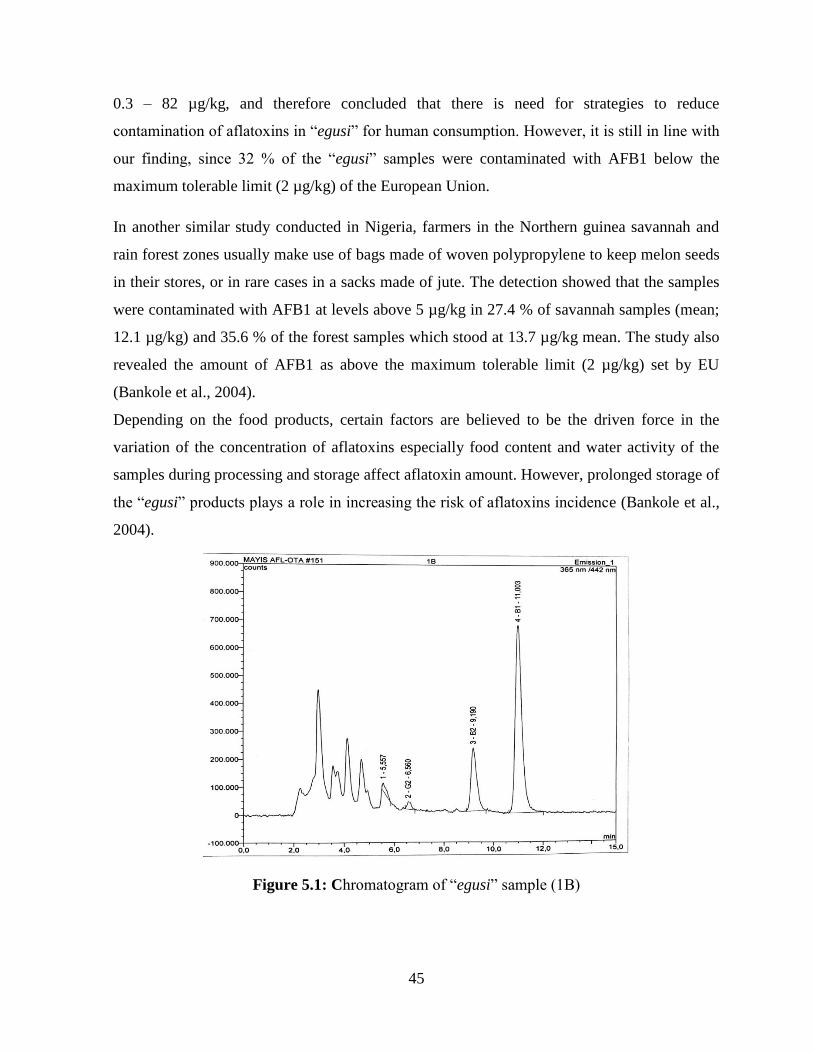
Figure 5.1: Chromatogram of “egusi” sample (1B) .................................................................... 45
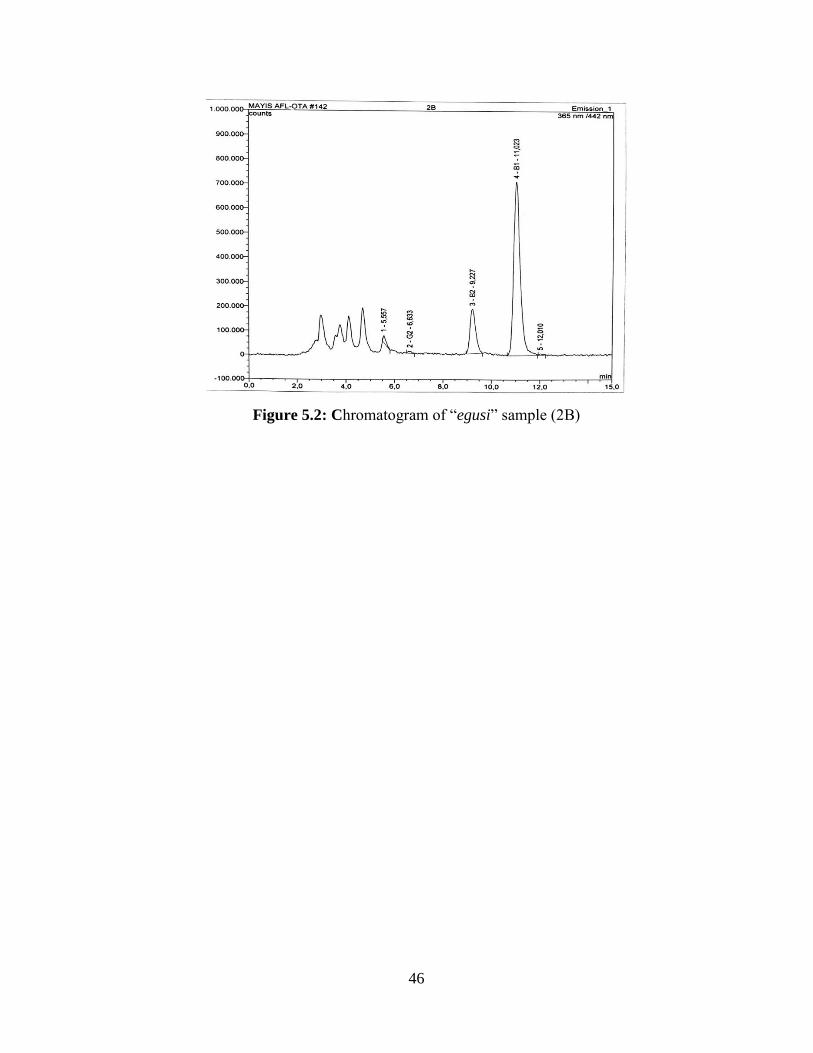
Figure 5.2: Chromatogram of “egusi” sample (2B) .................................................................... 46
Page 13
x
LIST OF ABBREVIATIONS AND SYMBOLS
AFs: Aflatoxins
ALARA: As-Low-As-Reasonably-Achievable
AOAC: Association of Official Analytical Chemists’
ASE: Accelerated solvent extraction
CAST: Council for Agricultural Science and Technology
CE: Capillary electrophoresis
CIT: Citrinin
CNP: Cyanogenic potential
EC: European Commission
EFSA: European Food Safety Authority
ELISA: Enzyme-linked immunosorbent assay
EU: European Union
FAO: Food and Agriculture Organization
FAOSTAT: Food and Agriculture Organization Corporate Statistical
Database
FDA: Food and Drug Administration
HCN: Hydrogen cyanide
HNO3: Nitric acid
HPLC: High-performance liquid chromatography
IAC: Immunoaffinity column
IARC: International agency for research on cancer
ISO: International standard organization
KCl: Potassium bromide
Page 14
xi
LC: Liquid chromatography
LFIA: Lateral-flow immunoassay
LLE: Liquid-liquid extraction
LOD: Limit of Detection
LOQ: Limit of Quantitation
LSE: Liquid-solid extraction
MFC: Multifunctional column
MSPD: Matrix solid-phase dispersion
OTA: Ochratoxin A
PBPB: Pyridinium Hydrobromide Perbromide
PBS: Phosphate-buffered solution
PCD: Post-Column Derivatization
PPB: Parts per billion
QuEChERS: Quick, easy, cheap, effective, rugged and safe
RASFF: Rapid Alert System for Food and Feed
RPM: Revolutions per minute
RSD: Relative Standard Deviation
SD: Standard Deviation
SFE: Supercritical fluid extraction
SPE: Solid-phase extraction
SPME: Solid-phase micro extraction
TLC: Thin-layer chromatography
TRNC: Turkish Republic of Northern Cyprus
Page 15
xii
USA: United State of America
USDA: United State Department of Agriculture
UV: Ultraviolet
WHO: World Health Organization
Page 16
1
CHAPTER 1
INTRODUCTION
1.1 Background
Tremendous amounts of food are wasted each year since they are attacked by harmful
organisms or defiled by fungal metabolic products. Such waste happens most conspicuously in
more sweltering nations where nourishment deficiencies may as of now be an issue (Leslie et
al., 2008).
Mycotoxins have afflicted humanity for a large number of years bringing on death, pipedream
and hopelessness. Since the 1960s with the distinguishing proof of aflatoxin the toll extracted
by these mixes from human populaces in developed nations has consistently diminished with
progressively powerful government directions and routine checking of the food supply
decreasing perceived issues by requests of magnitude. The truth in less created nations
couldn’t be in starker difference. Food uncertainty, few if any implemented controls, and harsh
situations that support fungal development and toxin evolution join to make perpetual
mycotoxin defilement and its related medical issues another cruel fact certainty in an
effectively troublesome life. The absence of valuation for these issues among strategy makers
and the general people restrains the general population interest for a logical answer, and for
the most part as a non-tariff exchange hindrance (Leslie et al., 2008).
Council for Agricultural Science and Technology (2003) defined mycotoxins “as toxic
secondary metabolites that for the most part have a place with one of three genera –
Aspergillus, Penicillium or Fusarium. Mycotoxins might be adverse to the strength of people
and/or and may be produced on an extensive variety of agricultural products under a different
scope of conditions. A portion of mycotoxins, for example, aflatoxins are among the stronger
mutagenic and cancer-causing substances known.” Mycotoxins are connected with numerous
interminable well-being dangers, including the induction of cancer, immune suppression, and
stomach related, blood and nerve absconds (CAST, 2003; Shephard, 2006).
Page 17
2
Due to high demand and consumption of “egusi” and “garri” by the people especially
Africans, the incessant epidemics of toxins-causing cancer and liver related diseases to
mention but a few. The increasing number of people (Africans to be precised) trooping into
Turkish Republic of Northern Cyprus either for studies or as tourists coupled with TRNC as
one of the tourists nation. There is need to examine the occurrence of aflatoxins level in
“egusi” and “garri” consumed in TRNC.
The likely dangers of aflatoxins to the wellbeing of human has received monitoring programs
for toxin existing in different commodities and thereby leading to the imposition of regulatory
measures by almost all countries. Frequent report have been made on aflatoxins infestation in
foods above the described amount as contained in the regulatory safety levels; the foods in
question are commodities believed to be from tropical regions. Most of the producers of
“egusi” and “garri” are countries of the tropics and fungal development specifically
Aspergillus species is extremely rampant in areas of the tropics (Bankole et al., 2006; Junior
and Campos, 2004).
The aim of this research is to examine the occurrence (if any) and quantify the level of
aflatoxins in “egusi” and “garri” consumed in TRNC, with the following specific objectives:
i. To detect the presence of aflatoxins in the samples of “egusi” and “garri” consumed
in TRNC.
ii. To determine the quantity of aflatoxins in “egusi” and “garri”
iii. To ascertain the possible hazards of aflatoxins (based on levels approved by safety
agencies) in “egusi” and “garri”.
The study is restricted to Turkish Republic of Northern Cyprus (TRNC). Areas of sample
collection are: Nicosia (Lefkoşa), Kyrenia (Girne) and Famagusta (Mağusa).
1.2 Aflatoxins
Aflatoxins are cancer-causing mycotoxins generated by some species of Aspergillus in a
variety of agricultural products, basically by Aspergillus flavus and Aspergillus parasiticus in
peanuts and maize. The emergence of aflatoxin B1 was first observed in 1960 in peanut
consignment from Brazil to United Kingdom. Thereafter, there is epidemics of dreadful
hepatitis in humans and animals, causing cancer of liver in both animals and humans
Page 18
3
specifically in conjunction with virus responsible for hepatitis B in Southeast Asia and sub-
Saharan Africa are all associated to aflatoxin B1 (Turner et al., 2002). Aflatoxin B1 has been
described as carcinogen Group 1 in humans by International Agency for Research on Cancer
(IARC, 1993). In almost most countries worldwide, there is regulation of aflatoxins levels
tolerated maximally and is within the range of 4-20 ng/g (Food and Agricultural Organization,
2004).
Aflatoxins are a class of closely member of heterocyclic compounds generated specifically by
two types of filamentous fungi, A. flavus and A. parasiticus. Studies conducted recently,
revealed that strains of A. tamarii and A. nominus are capable of causing aflatoxins, because
the phenotype arrangement of A. nominus is almost the same to that of A. flavus (Kurtzman et
al., 1987; Goto et al., 1996). Another strain, A. pseudotamarii was isolated and ascertained to
produce aflatoxin (Ito et al., 2001). They belong to the family Aspergillaceae, class
Hyphomycetes and subdivision Deuteromycotina (Beuchat, 1987). They infest agricultural
products and a number of foods. Under normal and different environmental conditions, species
of Aspergillus have the capability to grow on diversified substrates. The process of production,
processing, transporting and storing is where food become susceptible to fungi-causing
aflatoxins (Palmgren and Hayes, 1987).
1.2.1 Classification of aflatoxins
Aflatoxins are naturally prevailing mycotoxin developed by species of fungi: Aspergillus
flavus, Aspergillus parasiticus and Aspergillus nominus, with A. flavus regarded as most
common among them and with soil and rotting vegetable as their principal place of
occurrence. Four major groups of aflatoxins are in existence (B1, B2, G1 and G2), with minor
groups as an addition (M1 and M2 normally related with milk). Considering the extreme
carcinogenic potency, aflatoxin B1 is the most recurrent class of the family of mycotoxins.
Aflatoxin limits for B1 and the summation of B1, B2, G1, and G2 in foods and feeds have
been regulated in 2003 by all nations with mycotoxin regulations (FAO, 2004). Therefore, it’s
very rare that products will be contaminated with aflatoxins B2, G1 and G2 and not aflatoxin
B1 (Yabe and Nakajima, 2004), aflatoxins B2, G1 and G2 summation is drastically less than
aflatoxin B1. Pitt (2000) reported that ‘B’ and ‘G’ indicates blue and green fluorescent colours
Page 19
4
exhibited under ultraviolet (UV) light by these toxins during plate visualisation of thin layer
chromatography. Numbers 1 and 2 are subscript numbers which show major and minor
compounds.
1.2.2 Occurrence and biosynthesis
Aflatoxins are regarded as the most vital mycotoxins due to their existence, toxicological
impacts and effect on human prosperity and trade exchange (Gnonlonfin et al., 2013). A
variety of soil occupying Aspergillus strains are aflatoxin producers. These incorporate A.
flavus, A. parasiticus, A. nomius (Wilson et al., 2002), A. pseudotamarii (Ito et al., 2001), and
A. bombycis (Peterson et al., 2001).
Aflatoxins found in food are categorised as B1, B2, G1, and G2. “B” and “G” allude to the
blue and green fluorescent colours delivered by these toxins under UV light during the thin
layer chromatography plate perception; the subscript numbers 1 and 2 show major and minor
mixes, individually. At the point when aflatoxins B1 and B2 are ingested by lactating dairy
animals, an extent (around 1.5%) is hydroxylated and discharged in the milk as aflatoxins M1
and M2. In view of their high harmful effects, low levels of aflatoxins have been set and
controlled in foods and feeds by numerous nations. Aflatoxin M1 has been recognized in
human breast milk from Victoria, Australia and Thailand and also in crude milk from dairy
animals and water wild oxen in Iran at large amounts (Rahimi et al., 2010; Lanyasunya et al.,
2005; Pitt, 2000).
Two Aspergillus species, A. flavus and A. pseudotamarii, result in B aflatoxins. They can't
synthesize G aflatoxins because of cancellation (0.8-to 1.5-kb) in the aflatoxin biosynthesis
28-gene group (Ehrlich et al., 2004). The other aflatoxigenic species including A. nomius, A.
parasiticus and A. bombycis deliver each of the four aflatoxins (El-Nezami et al., 1995).
Since the disclosure of aflatoxins, A. flavus has turned into the most generally announced
food-borne microorganism. This mirrors its significance in human health services and
economy (Pitt, 2000). A. flavus is a ubiquitous and morphologically complex species including
two classes in light of its sclerotia measure: L strains (Group I) with sclerotia >400 mm in
width and S strains (Group II) with sclerotia <400 mm in breadth (Cotty, 1989). Both A. flavus
strains produce aflatoxins B1 and B2, however A. flavus S strains can also produce aflatoxins
G1 and G2. S strains are geologically distributed worldwide however uncommon in the United
Page 20
5
States (Tran-Dinh, et al., 1999). The sexual phase of A. flavus has been distinguished as
Petromyces where ascospores are found to evolve inside sclerotia (Horn, et al., 2009a). A.
parasiticus is an essential plant pathogen and yields B and G aflatoxins. Despite the fact that
its sexual stage also being a member of Petromyces sp., its host specificity is for the most part
restricted to ground crops though A. flavus taints an extensive variety of plant hosts (Horn, et
al., 2009b). Few varieties having a place with segment Ochraceorosei including A.
ochraceoroseus and A. rambellii have been described to develop aflatoxin (Cary et al., 2005
and 2009). Also, a few other Aspergilli deliver aflatoxin precursors, for example,
sterigmatocystin and o-methyl sterigmatocystin, which have comparative natural properties to
aflatoxin (Brown et al., 1996).
Aflatoxins are thermo-stable. So they may pollute the dairy items and fermented food in spite
of purification and sanitization. It has been ascertained not long ago that aflatoxin M1
(hydroxylated metabolites of aflatoxin B1) infestation in milk is a potential hazard for animal
and human wellbeing (Prandini et al., 2009). The prevalence of aflatoxin M1 in crude milk
relies on upon the climatic conditions. Milk tainting by this mycotoxin was remarkably
influenced in dry periods. However, Picinin et al. (2013) in their study find that fresh milk
tests contained aflatoxin M1 since the food fed to cattle was most likely debased with the
toxin. This pollution happened especially in the dry time frame with <8.0 mm precipitation
and low temperatures. Under these climatic conditions, as the cows are normally kept in
internment, there is a requirement for supplementary feedstuff. It gives the idea that the extra
encourage was contaminated. Be that as it may, in the windy period, when the animals are
typically allowed to graze on vegetation, the danger of this contamination is reduced.
A survey conducted recently recommends that specific food and food constituents in African
nations are exceedingly tractable to pollution by a few mycotoxins. Among these, maize is the
primary wellspring of fumonisin, deoxynivalenol and zearalenone while groundnuts are the
fundamental root of contamination by aflatoxin and ochratoxin A. Aflatoxin (principally
aflatoxin B1) applies harmful impacts on people, represent the significant danger as a potential
hazard element for some human sicknesses in Cameroon. This danger is probably going to be
more significant if aflatoxins exist together with different mycotoxins (Abia et al., 2013).
Aflatoxin biosynthetic pathway begins with the location of the toxins formations. On the other
hand, at a sub-atomic level, the fundamental biochemical strides and the resulting hereditary
Page 21
6
constituents of aflatoxin biosynthesis have been lit up only in the most recent decade
(Bhatnagar et al., 2002; Yu, 2003). In a nutshell, the aflatoxin biosynthesis genes of A.
parasiticus and A. flavus are remarkably homologous and the formation of the genes inside the
bunch being the same (Yu et al., 1995). Minto and Townsend (1997) established that
aflatoxins are integrated in two stages from malonyl CoA, previous with the arrangement of
hexanoyl CoA, and formerly with the development of a decaketide anthraquinone. For
exchange of acetyl coenzyme A (acetyl CoA) to its definitive items, that is, AFB1, AFB2,
AFG1, and AFG2, no less than 18 enzymes processes are needed (Yabe & Nakajima, 2004;
Roze et al., 2007). Various genes encoding the catalysts and the interpretation variables have
been cloned and described.
1.2.3 Factors affecting biosynthesis
The contamination of food with Aspergillus, and its resultant aflatoxins are connected with
warm and dry atmospheres (Hell et al., 2003). A few numerical models on climatic danger of
Aspergillus species developing plus there in situ generation of aflatoxins have been distributed
(Chauhan et al., 2008; Pitt, 1993). In any case, it has additionally been accounted for that
aflatoxin pollution may significantly vary year by year at a similar area because of variable
ecological conditions in various growing seasons and also irregular management exercises
(Hell et al., 2003). For examples, growing yields sequentially in a similar field builds the
danger of contamination by toxin year by year (Hennigen et al., 2000).
The impact of temperature on the development of A. flavus and A. parasiticus, and their
aflatoxin generation has been examined in various commodities utilizing artificial media. In
one review, the ideal temperature for aflatoxin production by A. flavus was characterized at
25ºC on ground nuts, while the ideal temperature for A. parasiticus generation of aflatoxin
was 25-30 ºC. Likewise, this review demonstrated an adjustment in the extents of aflatoxin B1
and G1 produced by A. parasiticus, with a reduction in aflatoxin G1 as temperatures expanded
(Diener and Davis, 1967). Molina and Giannuzzi (2002) with utilizing research facility media
and numerical modelling found that ideal temperatures for aflatoxin generation by A.
parasiticus were 27.8ºC and 27.3ºC at pH 5.9 and 5.5, individually. The ideal temperature for
aflatoxin production by A. bombycis and A. nomius was 25ºC (Peterson et al., 2001).
Page 22
7
The ideal water activity (aw) for development of A. flavus is demonstrated as 0.996, with a low
supporting growth at 0.80-0.82. At higher water exercises (0.98-0.99), aflatoxins are produced
in more quantity but toxin generation stops at or close aW 0.85 (Gqaleni et al., 1997; Northolt
et al., 1977). It is additionally announced that over 70% of high moisture grains (>18%) are
contaminated with A. flavus with a positive relationship between the rate of contamination and
aflatoxin improvement. toxin infestation is specifically corresponded with the moisture
constituent of yields (Mora and Lacey, 1997). In line with the research conducted on
restorative plants, no aflatoxin was distinguished with water movement underneath 0.81 and
temperatures of 25 ± 2ºC, 30 ± 2ºC and 40 ± 2ºC. Comparative perception was made when the
water action was more than 0.81 and temperature lower than 10 ± 2ºC (Kulshrestha et al.,
2008).
Ideal states of temperature and water activity are critical for mycotoxigenic fungi. Moreover,
the nations with cool or mild atmospheres may turn out to be more at risk to aflatoxins when
the temperature increases. An illustration is Italy in the recent years (FAO, 2000). Moreover,
tropical nations may turn out to be excessively unfriendly for fungal growth and mycotoxin
generation. Countries which stand to control the storage environment might have the capacity
to maintain a strategic distance from postharvest pollution however at high extra cost. The
absence of concern about the connection between food safety and environmental change could
be more at risk of aflatoxin infestation in Africa (Gnonlonfin et al., 2013).
The production of aflatoxin is widely regarded as an aerobic process. Production of aflatoxin
by A. flavus cultures emerged on a groundnuts medium in oxygen-drained atmosphere is lower
than under typical conditions (Diener and Davis, 1967; Dobson and Sweeney, 1998). An
estimate yield of 212 mg of aflatoxin for every litre of liquid culture was delivered at an air
circulation (aeration) rate of 9 L/min while a significant decrease in aflatoxin seen at lower air
circulation rates (Heathcote and Hibber, 1978). Diener and Davis (1967) researched the
impacts of various levels of the ordinary atmospheric gasses, carbon dioxide, oxygen and
nitrogen on aflatoxin production under states of shifting temperature and humidity. It was
noted that aflatoxin generation in sound develop peanut pith diminished with higher amounts
of carbon dioxide from 0.03% to 100%. Decreasing the oxygen amount also reduced aflatoxin
production. Other examination announced declared that a considerable reduction in mycotoxin
Page 23
8
development came about when the oxygen was decreased from 5% to 1% irrespective of the
carbon dioxide number, so that storage under low oxygen or in an improved atmosphere could
be seen as one of the reason for the reduction of aflatoxin biosynthesis (Magan and Aldred,
2007).
Nutrients availability plays an important role in mould growth and determines the amount of
mycotoxins to be produced. Selection of adversity of toxin infestation strains of certain species
is determined by substrate. For example, cottonseed and peanuts isolates are found to contain
high content of toxin-inducing strains of A. flavus other than from sorghum or rice (Rachaputi
et al., 2002).
1.2.4 Control of aflatoxins
The crops contamination to aflatoxin is still a serious problem among countries of the world
posing considerable health issues in high number of A. flavus-induced Aspergillosis.
Therefore, the danger of aflatoxin infestation can be limited by embracing different preventive
measures in early hour at farm level. Suitable agronomic exercises and early harvesting have
significant impact on aflatoxins pollution in product at farm level (Avantaggio et al., 2002;
Rachaputi et al., 2002). Quick drying protects the grains for longer timeframe from insects and
moulds by limiting the water movement which is essential for their improvement (Hamilton,
2000). Other drying methods like microwave and sonic drying are much efficient and fast, but
could not be applicable in some developing countries. Likewise, by the use of enhanced
storage structures and improved yields (Lozovaya, 1998; Lanyasunya et al., 2005; Turner et
al., 2005; Zain, 2010) lead toward security measure against aflatoxins defilement in farm
crops.
The formation of mycotoxin and growth of mycotoxigenic mould are known to be retarded by
certain chemical and physical agents. Extremely toxic gas like phosphine, which is applied to
halt the invasion of mould and insects in cereals, has been found to be productive (range of
1000 to 2000 ppm) in obstructing the metabolism of mycotoxin and in suffocating the growth
of Aspergillus flavus and Aspergillus parasiticus (Fernanda et al., 1996; Antonacci et al.,
1999).
Page 24
9
1.3 Cassava
Cassava (Manihot esculenta Crantz): Belongs to the class of root and tuber crops in tropical
regions and considered second in utilization to cereals (Lebot, 2009; Owusu-Darko et al.,
2014; Villardon et al., 2014). Cassava is a good source of food and nutrition to the most
malnourished and poorest population of Africa and Asia (Scott, 2000). However, taking into
consideration of production volume annually, it is among the top 10 food crops in developing
countries of the world over other root and tuber crops in the tropics (Srinivas, 2009; Tavva and
Nedunchezhiyan, 2012).
1.3.1 History and cultivation
Cassava was initially tamed in neo tropical marsh South America 8,000– 10,000 years back
and turned into the staple yield of the Amerindians. From South America, cassava was
transferred to Africa in the sixteenth century and has since turned into essential food as well.
Despite the fact that Africa owes the instigation of cassava to the Portuguese, Asia owes it to
the Spanish, who built up the main plantations in the Philippines and from where it was
introduced all through tropical Asia toward the start of the nineteenth century. The cultivation
of cassava was expanded by colonial administrators who similarly saw cassava as a starvation
hold and trade commodity (Piperno, 2011).
The products mostly consumed from cassava by the people from Asia, South America and
Africa is normally products of fermentation. Africa has a deep rooted history of producing
conventional fermented foods and is maybe the regions with the richest variety of lactic acid-
fermented foods. These foods have significantly influenced the level of nutrition, health and
socio-economy to the lives of the continent, who are often hit by drought, famine, disease and
war (Franz et al., 2014).
The germination of cassava involves a distinct range of cultivation situations (Edison et al.,
2006). Some countries notably Thailand, Southern Brazil and some parts of India cultivate
cassava as monocrop and also as high commercial crop in a number of countries (Edison et al.,
2000; Howeler, 2000). Whereas, in some parts of the world like Asia which include India,
Vietnam, Thailand and Indonesia (Edison, 2000; Amanullah et al., 2006; Howeler et al.,
Page 25
10
2013), and most African nations (Adekunle et al., 2014), as a semi-commercial and backyard
crop, intercropping and mixed cropping is mainly the cultivation systems (Moreno, 1992;
Osundare, 2007).
1.3.2 Nutritional composition
The protein content of cassava is as 0.7% to 1.3% low as fresh weight (Ngiki et al., 2014).
There is an approximately low protein content in cassava peels 5.5%, leaves 21% and flour
3.6% (Iyayi and Losel, 2001). Nassar and Sousa (2007) reported that the total lysine and
amino acid contents of cassava are approximately 0.010 g per 100 g and 0.254 g per 100 g
respectively. Cassava protein content is rich in arginine and low in threonine, cysteine,
phenylalanine, isoleucine, proline and methionine (Onwueme, 1978).
The lipid content of cassava is relatively low and has been found to be only 0.1% as compared
with maize which has an approximate content of 6% (Gomes et al., 2005). Cassava roots flour
has an average 2.5% lipid and only half of it can be extracted using traditional solvent systems
and also contains primarily saturated fatty acids (Hundson and Ogunsua, 1974). Cassava is
high in vitamin C and low levels of vitamins A, B1, B2 and niacin have been reported
(Onwueme, 1978). Cassava starch is compared with maize starch and found cassava 17%
amylose and 83% amylopectin, while that of maize 28% amylose and 72% amylopectin
(Gomes et al., 2005; Promthong et al., 2005).
1.3.3 Public health issues
The hazardous problem linked with cassava are two members of cyanogenic glycoside
compound, linamarin and lotaustralin (methyl-linamarin) mostly present in tubers and the
leaves and are regarded as edible parts. Cyanogenic potential (CNP) is present in the estimated
5000 varieties of cassava with fresh pulp content in the range of 10 to above 500 mg HCN/kg
(Wilson and Dufour, 2002). On the basis of CNP in the fresh pulp, cultivars of cassava are
categorised into three; Non-toxic cultivars with a concentration below 50 mg HCN/kg,
moderately toxic cultivars 50–100 mg HCN/kg and above 100 mg HCN/kg as high toxic
cultivars (AttahDaniel et al., 2013). One extremely toxic variety is available in Nigeria and is
termed as “eat and die” (AttahDaniel et al., 2013). Cassava varieties on the basis of
organoleptic attributes exhibited by cyanogenic compounds are grouped as “sweet” or “bitter”
Page 26
11
with high non-toxic level by the sweet cultivars. This classification is ascertained by
individuals with rare ability to quantify the constituents of cyanogenic compounds, but can as
well feel the taste of the cassava (Wilson and Dufour, 2002).
“Sweet” cassava is certainly described and appraised fit for the consumption of human and
only need essential processing (e.g., peeling and cooking). While, the cyanogens in “bitter”
cassava need to be remove or decrease to physiological amount (10 mg HCN equivalent/kg
dry weight) that can be tolerated (as set by FAO/WHO) and therefore requires further
processing in order to achieve above and also to make it wholesome prior to consumption
(Codex Alimentarius Commission, 2013).
1.3.4 “Garri”
“Garri” is a coarse product derived from peeled, washed and shredded cassava roots (Figure
1.1). The pulverised roots are kept in a container usually bag and allow a fermentation of 3-4
days or more while slowly pressed to remove the substance as juice. Fermentation plays a vital
role in the detoxification and also gives taste of acidity to the final product. Sieving is done on
fermented pulp in order to obtain fine squash, followed by roasting and frying in palm oil.
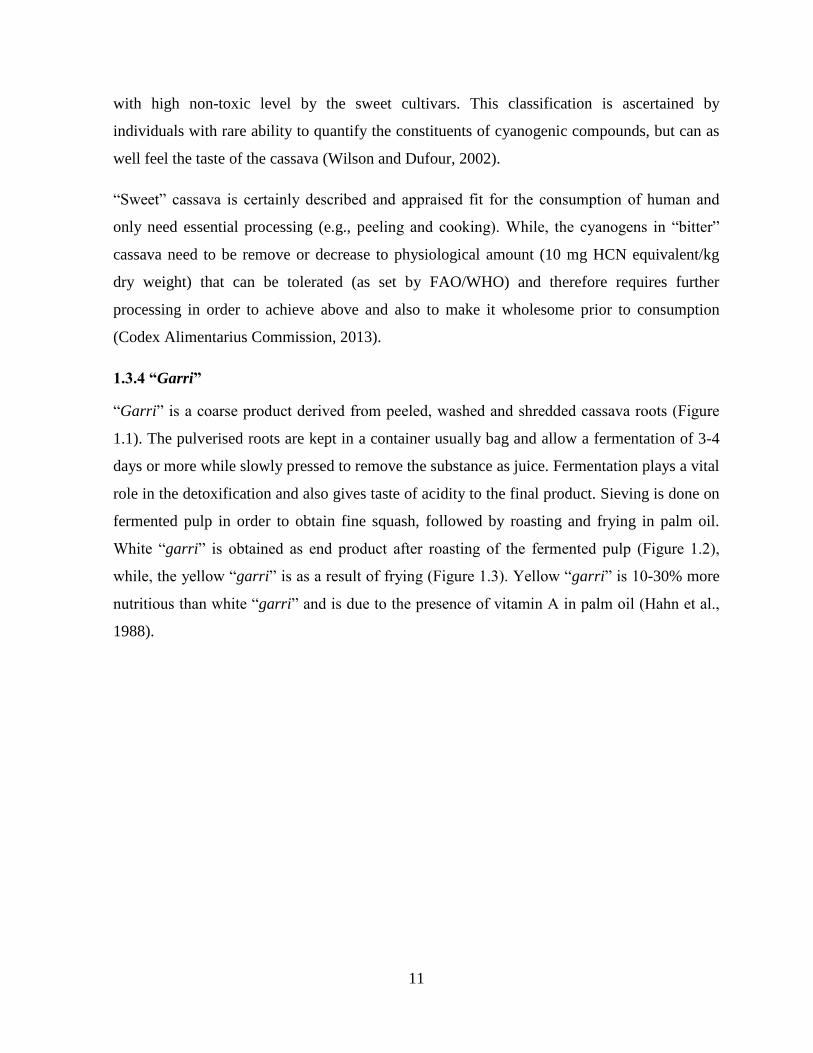
White “garri” is obtained as end product after roasting of the fermented pulp (Figure 1.2),
while, the yellow “garri” is as a result of frying (Figure 1.3). Yellow “garri” is 10-30% more
nutritious than white “garri” and is due to the presence of vitamin A in palm oil (Hahn et al.,
1988).
Page 27
12
Raw cassava
Washed to remove sand and dirt
Peeled and washed
Grated
Pulp place in cloth bag
Pressing to dewater pulp and remove HCN
Fermentation at room temperature (28-30oC) for 4-5 days
Fermented pulp sieved and fried with/without palm oil
“Garri” (final product)
Figure 1.1: Flow chart for “garri” production (Uzogara et al., 1990)
The processing of “garri” is a traditional one usually by women though can be processed
industrially, medium and small scale (Ene, 1992; Lahai, 1991). The average moisture content
(mc) is 12-14% and 8-10% for traditional and industrial processing respectively (Vlavonou,
1988). Because of its organoleptic attributes, the traditional techniques of processing is widely
the consumers preference coupled with the limitations in low yield, unstable utilisation
conditions, inadequate efforts toward decreasing losses as well as poor hygiene (Chinsman
and Fiagan, 1987). The rate at which crude cassava roots are transformed into gari
(garification) is 15–20% (Hahn et al., 1988). Ejiofor and Okafor (1981) reported that the sour
flavour of “garri” is induced by lactic acid bacteria in the bagging process.
Page 28
13
Figure 1.2: White “garri”
Source: http://microbiotics.com.ng/protein-fortified-garri-improving-nutritional-quality-of-a-
staple-food/
Figure 1.3: Yellow “garri”
Source: http://www.foodstantly.com/item/1006/Red_Garri_Bag#.WVVjZnIzrIU
1.4 “Egusi” Melon
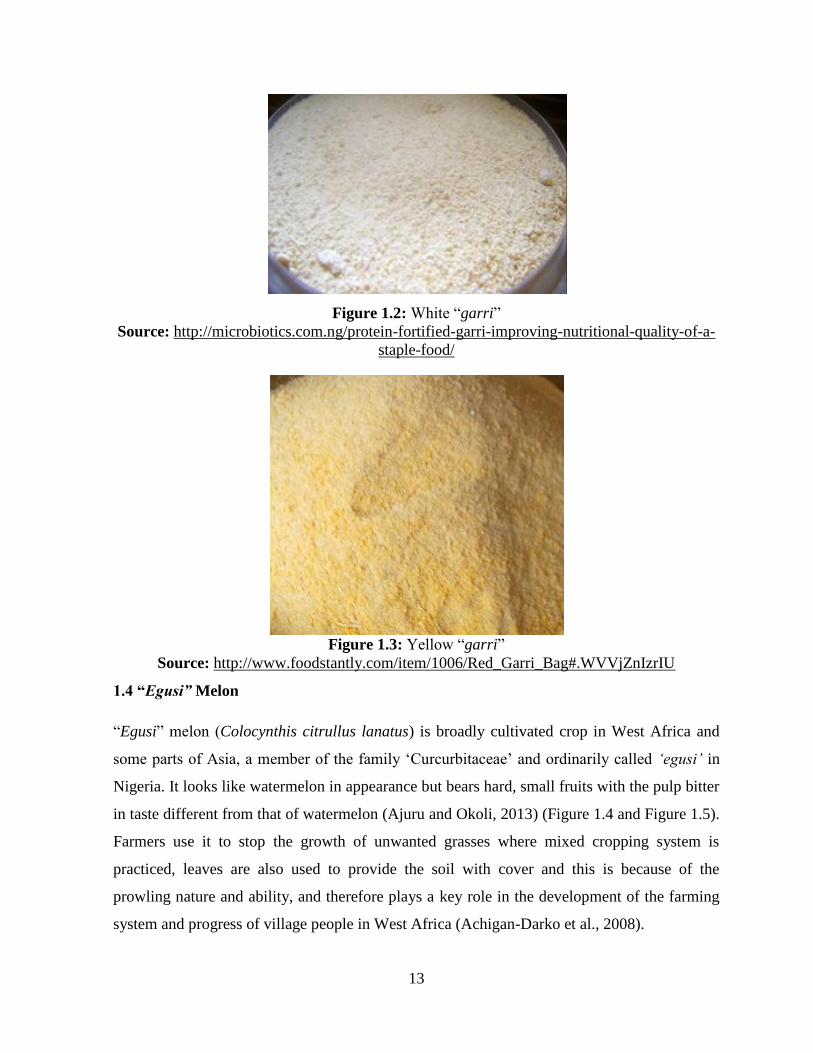
“Egusi” melon (Colocynthis citrullus lanatus) is broadly cultivated crop in West Africa and
some parts of Asia, a member of the family ‘Curcurbitaceae’ and ordinarily called ‘egusi’ in
Nigeria. It looks like watermelon in appearance but bears hard, small fruits with the pulp bitter
in taste different from that of watermelon (Ajuru and Okoli, 2013) (Figure 1.4 and Figure 1.5).
Farmers use it to stop the growth of unwanted grasses where mixed cropping system is
practiced, leaves are also used to provide the soil with cover and this is because of the
prowling nature and ability, and therefore plays a key role in the development of the farming
system and progress of village people in West Africa (Achigan-Darko et al., 2008).
Page 29
14
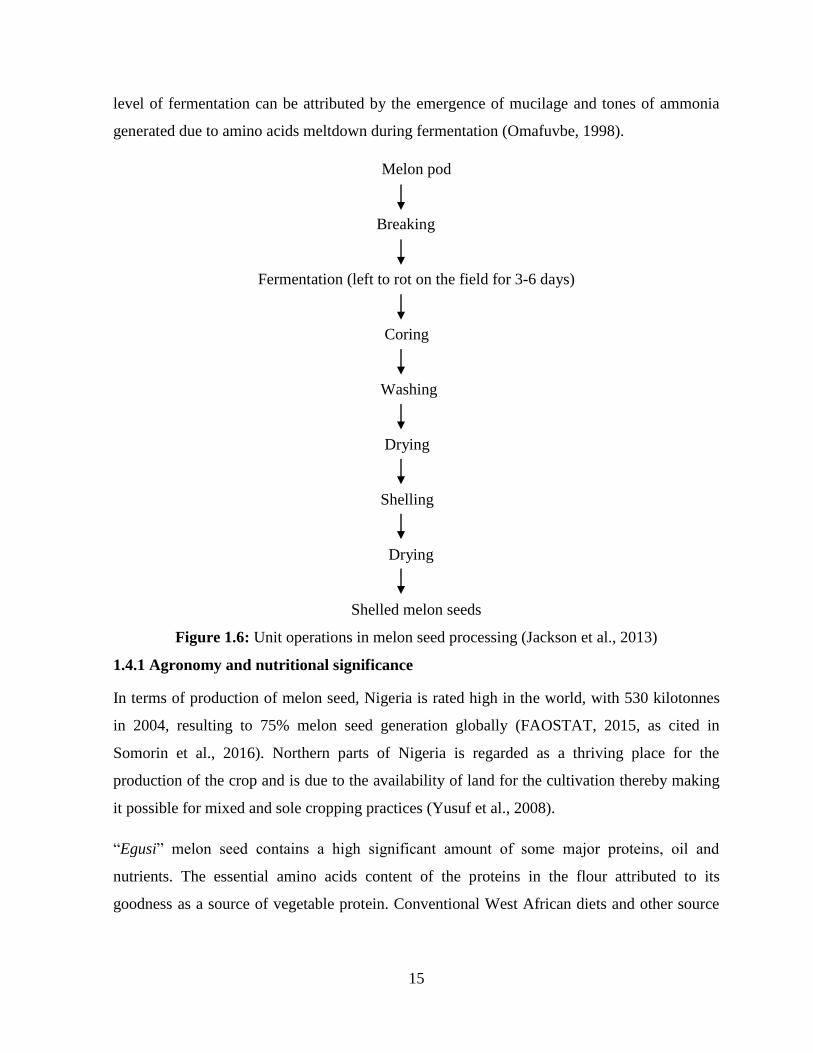
Kushwaha et al (2005) reported that the removal of pod, fermentation, washing, drying,
cleaning and shelling as the major steps involves in melon processing. Pods are normally
allowed to remain on the field for 3-4 days thereby making it to rot, prior to washing stage,
there are rotten and soft pods, and therefore, the process of fermentation and depodding is a
simultaneous one. The reason for the fermentation is that it allows easy removal of seeds from
the pod (Figure 1.6).
Figure 1.4: ‘Curcurbitaceae’ melon
Figure 1.5: Shelled “egusi” melon
However, there is possibility of snake bites and scorpion stings which cached in the rotten
pods during washing and fermentation process and renders it irritating, hard and vicious. The
Page 30
15
level of fermentation can be attributed by the emergence of mucilage and tones of ammonia
generated due to amino acids meltdown during fermentation (Omafuvbe, 1998).
Melon pod
Breaking
Fermentation (left to rot on the field for 3-6 days)
Coring
Washing
Drying
Shelling
Drying
Shelled melon seeds
Figure 1.6: Unit operations in melon seed processing (Jackson et al., 2013)
1.4.1 Agronomy and nutritional significance
In terms of production of melon seed, Nigeria is rated high in the world, with 530 kilotonnes
in 2004, resulting to 75% melon seed generation globally (FAOSTAT, 2015, as cited in
Somorin et al., 2016). Northern parts of Nigeria is regarded as a thriving place for the
production of the crop and is due to the availability of land for the cultivation thereby making
it possible for mixed and sole cropping practices (Yusuf et al., 2008).
“Egusi” melon seed contains a high significant amount of some major proteins, oil and
nutrients. The essential amino acids content of the proteins in the flour attributed to its
goodness as a source of vegetable protein. Conventional West African diets and other source
Page 31
16
of protein from plant are supplemented with egusi flour there by leading to bumper
development in growth (Sanchez et al., 1972).
The protein quality of “egusi” in relation to the indices biologically was found to be below that
of soybean (Oyenuga and Fetuga, 1975). Umoh and Oke (1974) found that the ratio of protein
efficiency, net utilization of the protein and value existing biologically in “egusi” seed to be
higher in comparison with majority of oilseeds. There is potential of the melon seed oil to be
utilised feedstock for the production of biodiesel (Giwa et al., 2010).
1.4.2 Complications and regulations
The demand for “egusi” is increasingly becoming high at both local (Nigeria) and
international level (Bankole, 1993). The output of the production of egusi is low, in spite of its
acclaimed value and socio-economic advantage. Fragmentation of land resulting to inadequate
land, exorbitant prices of inputs, application of conventional techniques and in appropriation
in resources are the factors contributing to this throw out (Debertin, 1986).
In storage conditions of West Africa, fungi evolvement specifically Aspergillus species poses
stern challenge peeved by promoting the growth of fungi in humid tropical climate (Bankole et
al., 2006). These Aspergillus species have a tendency to multiply in different type of food and
in appropriate storage conditions can emit their secondary toxic metabolites referred to as
“mycotoxins” with which aflatoxins widely known as an example and most fatal. Aflatoxin B1
is regarded as most common and highly destructive amongst all the four paramount classes of
aflatoxins (Aflatoxins B1, B2, G2 and G2) (International Agency for Research on Cancer,
1993).
Products of melon seed from Nigeria have been checked to be contaminated by aflatoxins and
therefore, based on the fact above, border rejection principle is imposed to melon seed
shipments from Nigeria to United Kingdom, Ireland and other EU countries as accentuated in
the Rapid Alert System for Food and Feed (RASFF, 2012) notifications 2013.BQC;
2012.BNB; 2012.BLV; 2012.CPF; 2012.AQM; 2011.AGG among the rest, containing
aflatoxin B1 level of more than 147 µg/kg.
Research conducted by Adebajo et al. (1994) revealed a significantly high amount of
aflatoxins contamination in samples of melon seed believed to be from markets and farmers
Page 32
17
stows in Nigerian. Oilseeds and products derived from it have been outlined as the major
promoters of aflatoxins exposure in human and also ascertained that the sources of aflatoxin
exposure should be measurable and rationally low (European Food Safety Authority, 2007). In
line of the claim above, the European Commission in the year 2010, enacted a law for the
limitation of aflatoxins in oilseeds which before human utilisation requires other physical
treatment and sorting as 8 µg/kg for AFB1 (15 µg/kg for total aflatoxins) and for oilseeds
designed for straight human consumption as 2 µg/kg for AFB1 (4 µg/kg for total aflatoxins).
The enactment of codification further mandated that 50% of the total consignment of “egusi”
and its products should be thoroughly examined before being permitted into the EU from
Nigeria (European Commission, 2014).
Page 33
18
CHAPTER 2
THEORETICAL FRAMEWORK
2.1 Toxicological Effects of Aflatoxins and Risk Assessment
Acute and chronic toxicity of aflatoxins were evidently recorded. Apart from their ability to
cause cancer and acute liver problem, recent investigations revealed other strong effects, such
as impaired growth in children, intestinal abnormalities, neurotoxicity, compromised
immunity, nephrotoxicity, chronic fatigue syndrome, protein synthesis interference and
various micronutrient that are dangerous to health. As shown by analysis in rats, the nature of
small intestine to quickly absorb aflatoxin has been described as toxic potential (Ramos and
Hernandez, 1996). Speijers and Speijers (2004) reported the synergistic toxicological effects
of aflatoxins.
An estimate of 4.5 billion people, for the most part in developing nations, are at danger of
chronically exposed to aflatoxins from infested food produces, and this brings about the need
of an additional knowledge of aflatoxins health consequences (Aguilar et al., 1993). Most of
the researches conducted on aflatoxins concentrated on the levels of contamination in different
foods. However, in order to precisely ascertain the exposure and its contrast among number of
groups (diet habits, age, geographical distribution etc), dietary analysis are therefore very
essential because of the risk of aflatoxin exposure to consumers through normal diet.
In setting up maximum tolerable level of aflatoxins in foodstuffs, the As-Low-As-Reasonably-
Achievable (ALARA) approach is implemented. The ALARA, simply expresses an amount of
a substance which may not necessarily be obliterated from a food without attempting to
repudiate that food altogether (FAO, 2004).
2.2 Regulations and Maximum Levels
General principles and requirements of food law were drawn up by European Commission in
2002, setting guidelines in areas of food safety leading to European Food Safety Authority
Page 34
19
(EFSA). It could be seen as a steppingstone with which other significant food safety measures
can be established (European Commission, 2002).
Several institutions gradually developed regulations for food and feed in relation to aflatoxins.
Aflatoxin B1 maximum limits and entire aflatoxin amounts (AFB1, AFB2, AFG1 and AFG2)
has been described as the criterion commonly implemented to restrict aflatoxin presence in
certain number of foods (Hernandez-Hierro et al., 2008). Bennett and Klich (2003) reported
that food content of aflatoxins are 5 and 10 μg/kg for AFB1 and total aflatoxins, respectively,
in over 75 countries. In its establishment for aflatoxins levels in food, the European Union
(EU), described 2 μg/kg and 4 μg/kg for AFB1 and total aflatoxins in cereal and their
subsidiaries, and in cereal-based processed food and in food for young children and infants,
the AFB1 is 0.1 μg/kg (European Commission, 2006a; Quinto et al., 2009). Espinosa-
Calderon et al (2011) revealed that the U.S. Food and Drug Administration (FDA) and the
United State Department of Agriculture (USDA) have entrenched aflatoxin total amounts in
animal feed products to be 15-20 μg/kg. For assurance of milk safety, the aflatoxins residue
limits for milk (AFM1) have been established by the EU and the FDA. The EU established
0.05 μg/kg as level in milk (EC, 2001; EC, 1998), and in food for the baby as 0.025 μg/kg
(EC, 2004). According to the U.S. FDA (1996) the level admissible in milk (AFM1) is 500
ng/L. The legislations established by national and international organizations have encouraged
high number of countries to set their own regulation. For example, in Brazil, 20 μg/kg is set
aside as aflatoxin maximum level safe in peanuts and corn (Abbas, 2005). In Korea, for all
food, the AFB1 maximum level is 10 μg/kg (Abbas, 2005).
The levels of AFB1 in dried fruits and nuts are 20 μg/kg, 5 μg/kg and 1 μg/kg for USA,
Netherlands and Switzerland, respectively (Bacaloni et al., 2008; Creppy, 2002). Moreover, in
Switzerland and Austria, the AFM1 maximum limits acceptable are 0.02 μg/kg, 0.25 μg/kg
and 0.05 μg/kg for butter, cheese and milk, respectively (Manetta et al., 2005). In China,
according to GB 2761-2011 (2011), the safe limit for AFB1 in fermented food, beans and
other grains is 5 μg/kg, while for peanut kernel, peanut oil and corn is 20 μg/kg. The European
Union (EU) legislations tend to have impact in some countries like Turkey, and Bosnia and
Herzegovina.
Page 35
20
2.3 Benefits of Mycotoxins Determinations
Fungi pathogenic plants are ubiquitous in nature and are described as the major agents
responsible for the spoilage of certain foods and feedstuffs. Various fungi are responsible for
plants infection amounting to decrease in crop quality with high significant economic waste;
they also contaminate agricultural products with toxic fungi known as mycotoxins (Bhat and
Vasanthi, 2003). The result of the attack by fungi has led to immense amounts of loss of foods
each year. Such wastes happen most conspicuously in nations where shortages of food may
have been a problem (Leslie et al., 2008). According to CAST (2003) about 25 % of the food
crops in the world are affected by mycotoxins which include staple foodstuffs, animal feed,
crops like coffee with huge economic gain. Research conducted through several decades
indicated the potential pernicious impacts to the wellbeing of man and animals a few
mycotoxins may bring about if devoured in amounts adequate to inspire harm. The risks might
be huge in economically downward areas of the globe where the way to identify and isolate
the infected products, and contrasting options utilising food that could be degraded, might be
low (Njapau, 2006).
Analytical identification and evaluation of contaminants at the limits approved has to be
conducted using dependable techniques, and this is because of the potential toxic effects. In
order for an effective control of the possible infestation of food and feedstuffs, the results must
be accurate and precise. In line of the above and for the official control of mycotoxins
particularly aflatoxins, performance criteria for the techniques to be employed in the analysis
has been set by EC (European Commission, 2006b).
The synergy existing in food security and food safety is critical while tending to the issue of
aflatoxins (Leslie et al., 2008). Therefore, keeping up food quality and food safety must be
adjusted by the food security and adequacy of supply which can only be attained through the
analysis and application of reliable techniques and also compliance of the limit set by
regulatory agencies (Abbas, 2005).
Page 36
21
2.4 Aflatoxin Analysis
The multiplicity of agricultural products infested with aflatoxins, make the procedure for
identification complex and broad. In view of the inherent nature of agricultural product,
certain assay approaches distinct for commodities like corn, green coffee, mixed feeds,
cottonseed and peanuts have been developed (Ellis et al., 1991).
2.4.1 Sampling and sample pre-treatment
For analysis to be done, representative sample are selected from population or sample lot.
Therefore, in aflatoxin assay, sampling has crucial importance. Aflatoxins are not distributed
uniformly in a commodity. Invasion sites of toxigenic mould are where aflatoxin normally
found in high proportions and small percentage of the commodity may be formed by the sites
(Smith and Moss, 1985). For instance, report has it that, separate peanut kernels tainted with
aflatoxin B1 at 1.1 mg/g, and just single out of such kernel would be enough to infect about
10,000 viable kernels at high aflatoxin amounts (Cucullu et al., 1966). Thus, for sub-sample
and homogeneity, the sample is efficiently mixed (Association of Official Analytical
Chemists, 1984).
Stoloff (1972) proposed that, for a representative sample to be taken for analysis, large amount
of sub-samples which are finely grounded should be well mixed and randomly taken.
Complete mixing is needed for liquids, pastes and free-flowing powders (Association of
Official Analytical Chemists, 1984). Smith and Moss (1985) reported that the heterogeneous
characteristic of toxin division in infected raw products is the major stumbling block in
sampling for aflatoxins, and so, the larger the separate particle of food, the greater the problem
for sampling adequacy.
In order to decrease matrix effects before analysis for certain analytical techniques, the
aflatoxins should be appropriately extracted from the sample tested and purified subsequently.
For improvement in selectivity and in other performance characteristics and also to simplify
protocols, the immunoaffinity column (IAC) (for both extraction and purification), liquid-solid
extraction (LSE) with various alternative solvent mixtures, liquid-liquid extraction (LLE),
modern sample clean-up methods like solid-phase extraction (SPE), solid-phase micro
extraction (SPME) and ultrasound extraction are the techniques commonly used (Bacaloni at
Page 37
22
al., 2008; Bakirdere et al., 2012). Other techniques in used for extraction are accelerated
solvent extraction (ASE), and quick, easy, cheap, effective, rugged and safe (QuEChERS),
supercritical fluid extraction (SFE), and other clean-up techniques like multifunctional column
(MFC) (Akiyama et al., 2001; Khayoon et al., 2010; Krska et al., 2008), and matrix solid-
phase dispersion (MSPD) (Dors et al., 2011; Krska et al., 2008; Shephard, 2009).
2.4.2 Extraction of aflatoxins from matrices
Turner et al. (2009) suggested that use of organic solvents such as chloroform, acetonitrile and
methanol is the major factor considered in the extraction of aflatoxins from many food
matrices. In spite of the low water solubility of numerous toxins, blends of a few solvents with
water are extremely viable because the penetration of hydrophilic tissues is better with
aqueous solvents than organic solvents alone (Sheibani and Ghaziaskar, 2009). Acetonitrile
/water and methanol/water are regularly applied for aflatoxins extraction (Bankole et al., 2010;
Dors et al., 2011). For standard procedures, methanol/water process is used for aflatoxins
recovery from original samples (Stroka and Anklam, 2000). Though, in the application of
Thin-layer chromatography technique, certain researchers, still find chloroform useful in the
extraction of aflatoxins (Shouman et al., 2012; Tripathi and Mishra, 2011; Var et al., 2007).
However, because it’s ecologically hazard, the use of chloroform solvent in the extraction has
been drastically diminished (Shephard, 2009; Turner et al., 2009).
2.4.3 Purification of aflatoxin extract
If the identification selectivity is less, the analysis sensitivity relies firmly on the clean-up of
sample. In order to efficiently remove the food or feed matrix and to concentrate the specific
analytes, certain variety of protocols for sample clean-up have been set aside (Zöllner and
Mayer-Helm, 2006). Many clean-up procedures have been employed to certain matrices of
food before aflatoxins analysis using High-Performance Liquid Chromatography (HPLC). For
cereals and their derivatives and prior to IAC and SPE clean-up pace, methanol/water is
normally used in the extraction and purification (Huang et al., 2010; Reiter et al., 2010).
Clarifying agents like lead acetate are used in order to achieve precipitation of substances
(such as fatty acids, lipids and pigments) interfering. For quantitation process, solution of
Page 38
23
extracted aflatoxin is also collected and concentrated (Groopman and Donahue, 1987).
According to Bullerman (1987), for effective concentration, any of the following methods can
be used:
1. Steam bath evaporation
2. Use of an enclosed hot plate to evaporate solvent
3. Rotary evaporation under reduced pressure
**To avoid aflatoxin loss through evaporation, Applications 1 and 2 are performed under
nitrogen stream.
2.4.4 Separation
The adherence of regulatory levels of aflatoxins in food relies heavily on exact and solid
analytical approaches for their analysis. Various methods are applied, including non-
destructive optical techniques like imaging technology and spectroscopy, immunological
techniques such as lateral-flow immunoassay (LFIA), immunosensors and Enzyme-linked
immunosorbent assay (ELISA), capillary electrophoresis (CE) and chromatographic
techniques such as TLC and HPLC together with various detectors (Xie et al., 2015).
However, the most frequently used techniques are TLC and HPLC.
2.4.4.1 Thin-layer chromatography (TLC)
For the analysis of aflatoxins in pistachio samples, the TLC technique has been approved and
officially recommended by the AOAC (AOAC, 1988; Sheibani and Ghaziaskar, 2009). It is
the earliest and developed technique for the measurement of aflatoxins (Marutoiu et al., 2004).
Because of the technical advancement in HPLC and later in fluorometric methods and ELISA,
the use of TLC technique was substituted in the early 1980s by developed countries. However,
due to its practicability and simplicity, it is still useful in developing nations (Stroka and
Anklam, 2002).
In TLC, silica is used in glass plate coating and by a baseline application of aflatoxin
concentrated sample. The occurrence of separation can be seen by the migration of solvent and
follows, is the resultant spots drying and characterization. Silica gels are utilised for plates
cladding and to achieve effective resolution, high-cleaned silica gels are needed (Bullerman,
Page 39
24
1987). Drying is activated after glass plate was spread by the adsorbent of thin layer.
Temperature and time controls the property of activation. The coated and activated home-
made plates or ready-to-use TLC plates are spotted with microlitre amounts of the
concentrated extract and put in an upright position with the near spot submerged in solvent.
Capillary action helps in the migration of solvent through sorbent layer effecting division into
separate spots straight to the baseline. Solvent evaporation is achieved by drying after desired
level of migration prior to removal of the plate. For developing spots, detection techniques are
then employed (Pomeranz and Meloan, 1987).
Recent invention for analysis of aflatoxin by TLC is the application of two-dimensional
process. TLC method is highly suitable for specimen with extreme portion of co-extracted
substances. As a clean-up phase, development is normally in the first direction, while the
actual quantitation is in the second direction (Smith and Moss, 1985).
2.4.4.2 High-Performance Liquid Chromatography (HPLC)
The use of HPLC for the analysis of aflatoxins and other toxins is progressively high and it’s
due to reliability and enhanced sensitivity when compared with the TLC technique. It is a
method of separating sample constituents, their identification and subsequent quantitation.
Between a mobile liquid phase and a static liquid or solid phase reinforced in column (around
25 cm by 4 mm internal diameter), there is sample competitive distribution which is attained
through separation. Effectiveness of the column parameters, specifically the size of the particle
is the dependent factor upon which the strength of the separation could be actualized. The
movement of the mobile phase is controlled by pressure with the help of pump and moves
through column of the concentrate and afterward streams to UV absorption fluorescence
detector. Under stable conditions, aflatoxin has a steady retention time. A correlation of
retention times and that of the standards empowers the outcomes to be looked on the basis of
quantitation as the territory under each peak the chromatograph comparable to the aggregation
of the individual class of aflatoxin. HPLC is normally attached to responsive and modern
equipment for data recovery thereby allowing the detection of the tremendously low amounts
of aflatoxin (Smith and Moss, 1985). HPLC is highly effective for the analysis of aflatoxin in
various foods, for example, corn, figs and peanut products (Pons and Franz, 1977). And for
Page 40
25
cottonseeds, milk and its derivatives for aflatoxin M1, and in mammals blood (AOAC, 1984;
Smith and Moss, 1985; Thiel, 1986).
2.5 Validation of Analytical Methods for Aflatoxin Determination
The entire analytical techniques ranging from sampling, preparation of sample, purification
and final verification employed by laboratories for the control of regulatory amounts must be
reliable to a confirmation strategy to demonstrate that the technique produces comparable
results and is in line to the set guidelines (Josephs et al., 2004; Krska et al., 2008). Accuracy,
precision (reproducibility and repeatability), linearity, limit of detection (LOD), limit of
quantitation (LOQ), working range, selectivity (based on the components of matrix and other
compounds interference) and ruggedness, are the typical quantitative criteria for evaluating the
method performance characteristics. With regard to method validation, various guidelines and
procedures have been developed (Ataş et al., 2010; Ataş et al., 2011; Ataş et al., 2012).
Massive number of analytical techniques accessible are recognized and authorised by official
authorities, such as AOAC international, international standard organization (ISO) and the
European Committee for Standardization (Gilbert and Anklam, 2002). Every laboratory
should execute quality control checks, for example, regular check of the accuracy and linearity
of their techniques (Josephs et al., 2004).
2.6 Safety Considerations and Precautions
Aflatoxins are toxic compounds, mutagenic, teratogenic and carcinogenic causing wide variety
of health problems (Bakirdere et al., 2012). For this reason, preparation and management of
concentrates, standards and working solutions must be carried out with mask, gloves, research
centre coat and precisely in a fume hood. It is always ideal to soak the glassware used for
preparing samples or standards in aqueous sodium hypochlorite (5%) to enable the destruction
of the remaining aflatoxins prior to scrubbing and subsequent use (Desmarchelier et al., 2010).
Because of the nature of aflatoxins in undergoing light degradation, amber bottles should
therefore be used to keep the standard solutions (Bacaloni et al., 2008; Nakai et al., 2008).
Page 41
26
CHAPTER 3
RELATED RESEARCH
This chapter summarizes the previously conducted studies on cassava and its derivatives,
some cereal crops and various forms of melons in relation to the prevalence of aflatoxins in
certain areas of the world.
Aflatoxins are members of toxic fungal secondary metabolites called mycotoxins. Fungi are
ubiquitous in nature and are the major agents to the spoilage of foods and feedstuffs (Bhat and
Vasanthi, 2003). Aflatoxins was first discovered in England in 1960 (widely known as Turkey
“X” disease), and since then several research have been carried out to investigate its exposure
and detrimental health problems (Groopman et al., 1988 and Blount, 1961). Aflatoxin
exposure differs greatly and it’s due to the difference in diets consumed between countries
(Farombi, 2006; Binder et al., 2007).
Analysis from various countries demonstrated that AFB1 is a contaminant of pellet wheat,
corn silage, cotton seed, soybean, peanut shells and barley (Decastelli et al., 2007; Sassahara
et al., 2005).
In Sweden, AFB1 level was found to be above 2 µg/kg in 9.5% of pistachio nut sample
(Thuvander et al., 2001). In 17 of 29 samples of pistachio nut, in the Netherland, AFB1 was
found to be in the range of 0.8 to 165 µg/kg (Scholten and Spanjer, 1996). In Spain, according
to Arino et al (2009), AFB1 contaminated about 50% of bulk pistachio nuts analysed. In
similar percentage (50.5%) in Turkey, the contamination levels of AFB1 in 95 unpacked
pistachio nuts samples was found to be in the range of 0.007 to 7.72 µg/kg (Set and Erkmen,
2010).
Samples of melon seed and tigernut (Cyperus esculentus) were detected with aflatoxins. Thirty
– two per cent (32%) of melon seed samples from markets in Nigeria representing forest and
savannah zones were detected with aflatoxin B1 with a means of 14 and 11 µg/kg,
Page 42
27
respectively (Bankole et al., 2004). A reported 35% of tigernut samples acquired from various
areas in Nigeria were contaminated at amount in the range of 10 – 120 µg/kg (Bankole and
Eseigbe, 1996). In western parts of Nigeria, Aflatoxin B1 have been reported to contaminate
54% of the dried yam chips for sale at levels of 4 – 190 µg/kg with a mean of 23 µg/kg,
aflatoxin B2 contaminated 32% at a mean of 2 – 55 µg/kg, aflatoxin G1 was detected in 5% of
the samples at 4 – 18 µg/kg and aflatoxin G2 in two of the samples (Bankole and Adebanjo,
2003).
Aflatoxins were detected in foodstuffs obtained from various markets in Benin City of Nigeria
and they are; “ogili – ugba” (made from castor bean, Riccinus communis), “garri” (cassava
farinha), “ogbono” (Irvingia gabunesis), and “egusi” meal (Cucumeropsis edulis) (Alozie et
al., 1980).
Obtained from households and retailers in Ireland and the United Kingdom (UK), the natural
co-occurrence of aflatoxins (AFs), ochratoxins A (OTA) and citrinin (CIT) in melon seed
samples was evaluated. AFB1 was found in 100% of the samples with mean of 9.7 µg/kg and
a range of 0.2 – 66.5 µg/kg. Total aflatoxins mean was 12.0 µg/kg with a range of 0.3 – 82
µg/kg. Samples from retailers were significantly higher (p < 0.05) than the samples from
household. Both AFs and OTA were analysed by HPLC coupled with fluorescence detection,
while HPLC-MS/MS was used in CIT. The study demonstrated that, 68% of the melon seed
samples were contaminated with AFB1 in oilseeds and was found to be above the limit of 2
µg/kg set by European Union (EU). The need for the strategies to reduce contamination of
aflatoxins in “egusi” for the consumption of human was highlighted (Somorin et al., 2016).
In a study to determine and quantify the level of contamination of aflatoxin in cassava flour
from three (3) major markets in Zaria, Nigeria. An overall of 36 samples were collected from
Sabon Gari, Samaru and Zaria City markets and the analysis was carried out using enzyme
linked immunosorbent assay (ELISA). The total aflatoxins were detected in 22 of the 36
samples at a range of 2.0 – 7.5 µg/kg. The result indicated that, the contamination of aflatoxin
in cassava flour is low and therefore safe for human consumption (Saleh et al., 2016).
Study conducted in Nigeria, farmers in the Northern guinea savannah and rain forest zones
usually make use of bags made of woven polypropylene to keep melon seeds in their stores, or
Page 43
28
in rare cases in a sacks made of jute. For re-drying and sorting, they often brought the seeds
out after the emergence of moulds as the major obstacle in storage. The detection showed that
the samples were contaminated with AFB1 at levels above 5 µg/kg in 27.4 % of savannah
samples (mean; 12.1 µg/kg) and 35.6 % of the forest samples which stood at 13.7 µg/kg mean.
Samples stored for more than two months are at risk of increased aflatoxins incidence
(Bankole et al., 2004).
In Southern part of Nigeria, analysis for proximate composition, fungi detection and amount
of aflatoxins B1, B2, G1 and G2 contamination were conducted on eight samples of both fresh
and stored “garri ijebu” mainly consumed in Ijebu land and in some people from Yoruba. The
result showed that stored samples (18 month’s period of storage) were detected with aflatoxin
B2 at concentration level of 0.0085 µg/kg and the detection of total aflatoxin representation at
about 8.8% (Jonathan et al., 2013).
In a study to investigate the role of palm oil in relation to the fermentation period on cyanide
and aflatoxin levels of processed cassava tubers (Garri) from three different places;
Durungwu, Mkporo – Oji and Akunna in Njaba Local Government Area, Imo State of Nigeria.
Tubers of mature cassava (Manihot esculenta crantz) were harvested and processed into
“garri”. For aflatoxin determination, samples of “gari” were stored for a period of 30
consecutive days prior to spectrophotometric analysis. The result indicated no significant
difference (p > 0.05) in amounts of aflatoxin which was ranged between 0.26 ± 0.07 and 0.55
± 0.04 µg/kg in various samples of “garri” (Chikezie and Ojiako, 2013).
Intended for human consumption in Nigeria in the year 2005 and 2006, derivable from “egusi”
melon seeds, three of the products; “robo” (melon ball snacks), “egusi” soup and “ogiri”
(fermented melon seed condiment) were analysed for aflatoxin B1 content using thin layer
chromatography (TLC) with fluorescent detection. The percentage AFB1 detected in samples
was 19.5%, 31.8%, and 25% for “egusi” soup, “ogiri” and “robo”, respectively. In all samples,
the range of aflatoxin B1 was from 2.3 – 15.4 ppb. To mean levels of AFB1 were 7.2 ppb, 9.7
ppb and 8.9 ppb for “egusi” soup, “robo” and “ogiri”, respectively. Aflatoxin B1 was found to
contaminate all the melon seeds derived products at levels lower than the permissible amount
Page 44
29
of 20 ppb recommended in Nigeria. Overall outcome indicated less risk by human
consumption (Bankole et al., 2010).
In a coordinated survey earlier conducted on feedstuffs, feeds ingredients and commodities
revealed that in samples from the Northern Europe, the maximal AFB1 levels to be 60 µg/kg,
in samples from the Mediterranean region and the Southern Europe to be 656 µg/kg, and in
samples from the Central Europe to be 311 µg/kg (Binder et al., 2007). Kos et al (2013)
postulated that in southeast part of Europe, research undertaken in 2002 in Serbia, revealed
AFB1 contamination in maize and attributed that changes in weather might be the possible
causes.
A report has that, 70% or more of the grains with extreme high moisture (> 18 %) are
contaminated with Aspergillus flavus and the correlation between the level of contamination
and aflatoxin development could be seen as positive. There is a direct correlation between the
moisture level of crop and the toxin occurrence (Mora and Lacey, 1997).
Page 45
30
CHAPTER 4
MATERIALS AND METHOD
4.1 Study Area
Cyprus, an island in the Mediterranean sea of the Eastern basin and considered the third
largest island in the Mediterranean (after Sardinia and Sicily of the Italian islands) and by area,
it’s the world’s 81st largest island. It is 100 km (60 miles) to the west of Lebanon and Syria
and 60 km (40 miles) to the south of Turkey.
The city of Nicosia is the capital and largest. It’s close to Northern Africa and Southern part of
Europe, and has had long times of predominantly Greek and intermittent Anatolia, Turkish,
Byzantine, Levantine, and influence of Eastern European (Grove and Rackham, 2003;
Kademi, 2016).
In the Turkish Republic of Northern Cyprus (TRNC), the consumption of “garri” and “egusi”
is increasing mainly by Africans and is prone to contamination by aflatoxins due to high
humidity and warm temperatures during winter and summer period respectively. Therefore, it
is highly beneficial to ascertain the degree of safety by determining level of aflatoxins in these
food products.
4.2 Sampling
“Garri” and “egusi” samples were taken from the major markets of Nicosia (Lefkoşa),
Kyrenia (Girne) and Famagusta (Mağusa) in August and February of 2016 and 2017
respectively according to TS EN ISO 13690 standard (1999) (Figure 4.1).
Page 46
31
Figure 4.1: Picture from sampling of “garri” and “egusi”
Overall, fifteen (15) samples of both white/yellow “garri” and “egusi”, (4 packaged) and (11
open) containing 500 g of “garri” and “egusi”, were purchased from the markets of the above
regions as seen in Figure 4.2 and Table 4.1 below:
Figure 4.2: Map of TRNC (KKTC) depicting the study locations
Page 47
32
Table 4.1: Regions where samples were taken in TRNC
Region Sample Type of sample Number of samples
Nicosia (Lefkoşa), Yellow “garri” Packaged 1
Yellow “garri” Packaged 1
“Egusi” Packaged 1
“Egusi” Packaged 1
Yellow “garri” Open 1
White “garri” Open 1
“Egusi” Open 1
Famagusta (Mağusa) “Egusi” Open 1
Yellow “garri” Open 1
“Egusi” Open 1
Yellow “garri” Open 1
Kyrenia (Girne) “Egusi” Open 1
White “garri” Open 1
“Egusi” Open 1
White “garri” Open 1
Total 15
The samples (both from open and packaged market sources) were packed and sealed in
polythene bags and labelled accordingly, and were then transferred to Ankara Food Control
Laboratory in Turkey to be analyzed.
Page 48
33
4.3 Principle
Test portion was extracted with MeOH and hexane. The extract was filtered and diluted with
H2O to a concentration of specified solvent, and was applied to an affinity column with
antibodies of aflatoxins B1, B2, G1, and G2 specifics. Aflatoxins were extracted from the
affinity column with methanol and quantified by reversed-phased liquid chromatography (LC)
with post-column derivatization (PCD) involving the process of bromination. The PCD was
achieved by electrochemically generated bromine (Kobra cell) and was determine by
fluorescence detection.
4.4 Performance Standards for Immunoaffinity Column (IAC)
The capacity of the column was maintained at less than 100 ng and for aflatoxins B1, B2, and
G1, the recovery was not less than 80% and 60% for aflatoxin G2 after the application of
standard solution in aqueous form of 10% methanol which contained each toxin (5 ng).
4.5 Calibration
Prior to chromatographic analysis of the samples, 9 points calibration standards were used for
the calibration of HPLC instruments. As recorded, 0.1µg/kg was the lowest level of calibration
for B1; others were 0.15 µg/kg, 0.2 µg/kg, 0.25 µg/kg, 0.5 µg/kg, 1 µg/kg, 2 µg/kg, 2.5 µg/kg
and 5 µg/kg.
Figure 4.3: HPLC machine
Page 49
34
Figure 4.4: Sample chromatogram of calibration standard of 1 µg/kg
4.6 Reagents and Chemicals
Phosphate buffered saline solution pH 7.4, 0.2 g KCl
Extraction solvent Methanol - water solution (8+2, v/v)
Methanol LC grade
Methanol Technical grade, distilled
Pyridinium hydrobromide perbromide
(PBPB)
CAS 39416-48-3
Water LC grade, ISO 3696 grade 1
Toluene acetonitrile 98+2 (v/v)
Nitric acid 26.1 mL 70% HNO3
Post-column reagent (B) 25 mg PBPB in 500 mL H2O
Acetonitrile LC grade
Page 50
35
LC mobile phase solvent (A) Water, acetonitrile, methanol LC grade
solution (6+2+3, v/v/v)
LC mobile phase solvent (B) Electrochemically generated bromide
Hexane
Potassium bromide
Sodium chloride
LC aflatoxin standard solutions
4.7 Apparatus
Laboratory balance: Readability 0.1 g
Analytical balance: Readability 0.1 mg
Pipettes: 10 mL
LC pump: 1.000 0.005 mL/min
Reservoir: 75 mL/Luer tip connector for affinity column
Fluorescence detector: Wavelengths 360 nm excitation filter × 420 nm cut-
off emission filter
Reversed-phase LC column: 4.6 mm × 25 cm
Glass microfiber filter paper: 5 cm diameter, retention: 1.6 µm
Blender: Explosion proof (8000 rpm)
Hand pump: 20 mL syringe
Vertical shaker: Adjustable for max. solid-liquid agitation
Injection system: 200 µL valve loop
Calibrated microlitre syringe: 25 and 500 µL
Page 51
36
Disposable filter unit: Cellulose, 0.45 µm
Volumetric glassware: 2, 3, 10, and 20 mL (0.5% accuracy)
Filter paper: 24 cm diameter, pre-folded, and 30 µm retention
Affinity columns: Vicam (313 Pleasant St, Watertown, MA 02472,
USA.
Post-column derivatization system: Electrochemically generated bromine – Kobra cell;
Rhone Diagnostic Technologies Ltd., Lyon, France.
Erlenmeyer flask: 500 mL, screw top
4.8 Preparation of Extracts
i. “Egusi” melon: 50 ± 0.1 g of “egusi” test portion were mixed (8:20 v/v), followed by
addition of 100 mL hexane, 5 g NaCl, and 300 mL methanol-water extraction solvent.
They were shaken for 3 min using high speed shaker. After filtration, 10.0 mL clear filtrate
was pipetted and placed on conditioned immunoaffinity column in a reservoir of 60 mL
PBS solution. Plastic spatula was used in mixing and later the residues were rinsed in 1
mL PBS and then transferred to column.
ii. “Garri”: 50 ± 0.1 g of “garri” test portion were mixed into 500 mL screw top Erlenmeyer
flask (11:9 v/v). Sodium chloride (5 g) and methanol-water solvent (300 mL) were added.
They were intensively shaken for 30 m by a shaker. Pre-folded filter paper was used in
extract filtration. A 10.0 mL clear filtrate was pipetted poured into PBS (60 mL) solution
of the reservoir and was placed on conditioned immunoaffinity column. They were mixed
with spatula of plastic material and residues were rinsed using 1 mL PBS and later the
solution was applied to the column.
Page 52
37
Figure 4.5: Flask containing 50 g of test portions
Figure 4.6: Extraction by shaking
Page 53
38
Figure 4.7: Filtration of extracts
4.9 Immunoaffinity Column Clean-up
Under gravity, filtrate was passed through the column at a flow rate of ca 3 mL/min. The
column was washed with water (15 mL), and was dried by an application of small vacuum at
5-10 s.
Figure 4.8: Immunoaffinity column clean-up
Aflatoxins were eluted by addition of methanol on column at 0.5 mL/min and were passed
through gravity. Calibrated volumetric flask (3.0 mL) was used in the collection of the eluate.
Page 54
39
Prior to application of the second portion of methanol (0.75 mL), one minute gap was
observed. Applied elution solvent was collected after an air was pressed through, and was
marked and mixed after dilution. The solution was clear and was immediately used for LC
analysis.
4.10 LC Determination with Fluorescence Detection and Post-column Derivatization
In order to achieve post-column derivatization, the electrochemically generated bromide was
used and operated with the flow rate for the mobile phase set as 1 mL/min and the current
fixed at 100 µA.
200 µL working standard solution was injected into the injector with concentration of
aflatoxin B1 within the range 1-4 ng/g. The injector loop was completely filled per the
manufacturer’s instruction. Aflatoxins G2 eluted first with the retention time of 6 minutes,
followed by G1, B2 and B1 with 8, 9 and 11 minutes retention times respectively with the
baseline taken into consideration.
Again, 200 µL extract was injected into the injector; the peak of each aflatoxin in the
chromatogram was identified by comparing their retention times with those of a reference
standards. The quantity of aflatoxin contained in the injected eluate was determined from the
standard curve.
4.11 Calculations
The level of concentration of aflatoxin in the test sample was calculated as follows:
A graph of aflatoxins B1, B2, G1 and G2 (ng/mL; y-axis) concentration was plotted against
peak area (units; x-axis). In order to calculate the amount of aflatoxins in the measured
solution, the resulting function (y = ax + b) was used.
Page 55
40
From the measured solutions (ng/mL), the contamination (ng/g) was calculated as:
Csmp (ng/mL) = ax Signalsmp (units) + b
Contamination =
Where:
Wt (g) = test portion taken for analysis
Solvent (mL) = solvent taken for extraction
Aliquot (mL) = aliquot taken for IAC cleanup
Elution (mL) = final volume collected after elution from IAC
Csmp (ng/mL) = conc. of aflatoxin calculated from linear regression
Contamination (ng/g) = contamination of test sample with aflatoxin
Signalsmp (units) = area of aflatoxin peak obtained from the measured solution
4.12 Recovery Check: Acceptability of Analytical Performance for Routine Recoveries
The performance of the analytical method should be checked, both during its development and
during its subsequent use.
The main purposes of performance verification are:
Monitor the performance of the method under the actual conditions prevailing during
its use;
Take into account the effect of inevitable variations caused by, for instance, the
composition of samples, performance of instruments, quality of chemicals, varying
performance of analysts and laboratory environmental conditions;
Demonstrate that the performance characteristics of the method are broadly similar to
those established at method validation, showing that the method is under “statistical
control”, and the accuracy and uncertainty of the results are comparable to those
Page 56
41
expected of the method. For this purpose, data obtained during method validation may
be updated with data collected from performance verification during the regular use of
the method.
The calculation of mean recovery is normally from one group of commodity. To achieve the
set acceptable limits within a single recovery, the range of the result is expected to normally
be within the mean recovery +/- 2 x RSD, and which by the use of routine ongoing recovery
data (laboratory reproducibility) can be adjusted. However, in routine analysis involving multi
aflatoxins, a generalised 60-140% range may be used, and therefore, re-analysis of the batch is
required in recoveries outside the range mentioned above. In the event, where the individual
recovery is high and unacceptable, and no aflatoxins detected, then re-analysis of the samples
is not necessary for aflatoxins absence that needs to be proven. This necessitates the
investigation of consistent high recovery. However, the causes must be checked, where certain
change occurs in recovery or that the results attained are not accepted potentially (RSD
beyond ± 20%) (SANCO, 2009).
For the recovery check, control “egusi” and “garri” samples were fortified with the mixture of
aflatoxins as three replicates at MRL and half MRL levels. MS Excel was used in calculating
the Relative Standard Deviation (RSD), Standard Deviation (SD) of recoveries and Average
recovery by the following formula:
(4.1)
To give a good estimate on the content of aflatoxins in the sample and also to certify
commodity compliance, RSD value is used below:
(4.2)
Rmax-min: Maximum and minimum aflatoxin amount (µg/kg)
Ri: Aflatoxin amount measured in the sample (µg/kg)
k: Expansion factor which is 2 by International Union of Pure and
Applied Chemistry (IUPAC) at the level of 95% confidence
Page 57
42
RSD: Repeatability
RSD * Ri: Combined standard uncertainty of the analysis
k* RSD* Ri: Expanded uncertainty of the analysis
Aflatoxins recoveries were seen in the range of 70 – 120%. For “egusi”, the overall recovery,
SD and RSD values (n=24) were at 94%, 4.8% and 5.1%. While, for “garri” the overall
recovery, SD and RSD values (n=24) were seen at 89%, 4.3% and 4.8%, respectively. Overall
recovery, individual recoveries and RSD were within the identified acceptance guideline 70%
≤ Q ≤ 120% and RSD ≤ 20%), therefore, the method was considered valid for both “egusi”
and “garri” (Table 4.2).
Table 4.2: Recovery check results
Sample Recovery of the Method (%) Accuracya
(%)
SD RSD
(%)
“Garri” MRL MRL/2
G2 94.5 95.6 89.2 94.9 88.5 96.5 89 4.3 4.8
G1 86.5 88.7 82.4 90.9 86.2 91.9
B2 87.5 93.2 86 89.8 86.1 92.5
B1 82.6 87.1 80.5 88.1 85.1 88.6
“Egusi”
G2 96.6 93.3 93.3 104 96.7 99..2 94 4.8 5.1
G1 90.9 87.9 88.1 100.2 92.1 94.9
B2 94.9 91.8 89.9 100.7 94.4 96.8
B1 90.8 85.5 86 98.6 89 92.6
aAs percent average recovery (n=24)
Page 58
43
CHAPTER 5
RESULTS AND DISCUSSION
The Tables (Table 5.1 and Table 5.2) below represent the results and concentration of
aflatoxins after the analysis was carried out.
Table 5.1: Concentrations of aflatoxins from “garri” samples
Region Sample Name Concentration of Aflatoxins (µg/kg)
B1 B2 G1 G2 Total
Nicosia (Lefkoşa) Yellow “garri” n.d n.d 0.006 0.015 0.021
Yellow “garri” 0.021 n.d 0.015 0.029 0.065
Yellow “garri” n.d n.d n.d 0.021 0.021
Yellow “garri” n.d n.d n.d n.d n.d
Famagusta (Maǧusa) Yellow “garri” n.d n.d n.d n.d n.d
Yellow “garri” n.d n.d n.d 0.007 0.007
Kyrenia (Girne) White “garri” 0.034 n.d n.d n.d 0.034
White “garri” 0.041 0.006 n.d n.d 0.047
*n.d = not detected
Page 59
44
Table 5.2: Concentrations of aflatoxins from “egusi” samples
Region Sample Name Concentration of Aflatoxins (µg/kg)
B1 B2 G1 G2 Total
Nicosia (Lefkoşa) “Egusi” 0.707 0.150 n.d 0.027 0.884
“Egusi” 0.743 0.121 n.d 0.007 0.871
“Egusi” 0.114 0.011 n.d n.d 0.125
Famagusta (Maǧusa) “Egusi” 0.099 0.011 0.006 n.d 0.116
“Egusi” 0.130 n.d n.d n.d 0.130
Kyrenia (Girne) “Egusi” 0.116 0.020 n.d n.d 0.136
“Egusi” 0.095 0.014 n.d n.d 0.109
*n.d = not detected
Out of the fifteen (15) samples collected, only two “egusi” samples were found to contain
aflatoxin B1 at a concentration of 0.707 µg/kg and 0.743 µg/kg (Figure 5.1 and Figure 5.2).
Others were below the detectable limit (as seen in the tables above) and therefore considered
compliant. Several institutions gradually developed regulations for food and feed in relation to
aflatoxins. Aflatoxins B1 maximum limits and the entire aflatoxin amounts (AFB1, AFB2,
AFG1 and AFG2) has been described as the criterion commonly implemented to restrict the
presence of aflatoxins in certain number of foods (Hernandez-Hierro et al., 20008).
The concentration of aflatoxin B1 found is below the maximum tolerable limit of 2 µg/kg set
by European Union for oilseeds.
The result is contrary to the findings of Somorin et al. (2016) which reported the amount of
aflatoxin B1 as 9.7 µg/kg and a range of 0.2 – 66.5 µg/kg in “egusi” melons obtained from
households and retailers in Ireland and the United Kingdom (UK). The study demonstrated
that, 68 % of the melon seed samples were contaminated with AFB1 in oilseeds and was
found to be above the limit of 2 µg/kg set by European Union (EU). HPLC coupled with
fluorescence was used in the analysis. Total aflatoxins mean was 12.0 µg/kg with a range of
Page 60
45
0.3 – 82 µg/kg, and therefore concluded that there is need for strategies to reduce
contamination of aflatoxins in “egusi” for human consumption. However, it is still in line with
our finding, since 32 % of the “egusi” samples were contaminated with AFB1 below the
maximum tolerable limit (2 µg/kg) of the European Union.
In another similar study conducted in Nigeria, farmers in the Northern guinea savannah and
rain forest zones usually make use of bags made of woven polypropylene to keep melon seeds
in their stores, or in rare cases in a sacks made of jute. The detection showed that the samples
were contaminated with AFB1 at levels above 5 µg/kg in 27.4 % of savannah samples (mean;
12.1 µg/kg) and 35.6 % of the forest samples which stood at 13.7 µg/kg mean. The study also
revealed the amount of AFB1 as above the maximum tolerable limit (2 µg/kg) set by EU
(Bankole et al., 2004).
Depending on the food products, certain factors are believed to be the driven force in the
variation of the concentration of aflatoxins especially food content and water activity of the
samples during processing and storage affect aflatoxin amount. However, prolonged storage of
the “egusi” products plays a role in increasing the risk of aflatoxins incidence (Bankole et al.,
2004).
Figure 5.1: Chromatogram of “egusi” sample (1B)
Page 61
46
Figure 5.2: Chromatogram of “egusi” sample (2B)
Page 62
47
CHAPTER 6
CONCLUSION AND RECOMMENDATIONS
On the basis and outcome of this study, two “egusi” samples out of the fifteen (15) from
Nicosia (Lefkoşa) markets were containing AFB1 at the level 0.707 µg/kg and 0.743 µg/kg
below maximum tolerable limit (2 µg/kg) set by EU. Therefore, “egusi” and “garri” consumed
in TRNC are safe with regard to aflatoxins.
Considering the high number of mycotoxins present in foods, it is of paramount importance to
control the incidence of aflatoxins and also ochratoxins regularly.
Page 63
48
REFERENCES
Abbas, H.K. (Ed.). (2005). Aflatoxin and food safety. CRC Press. Taylor and Francis Group.
600 Broken Sound Parkaway NW, Suite 300, USA.
Abia, W. A., Warth, B., Sulyok, M., Krska, R., Tchana, A. N., Njobeh, P. B., Dutton, M. F., &
Moundipa, P. F. (2013). Determination of multi-mycotoxin occurrence in cereals, nuts
and their products in Cameroon by liquid chromatography tandem mass spectrometry
(LC-MS/MS). Food Control, 31, 438-453.
Achigan-Dako, G. E., Vodouhe, S. R., & Sangare, A. (2008). Caracterisation morphologique
des cultivars locaux de Lagenaria siceraria (Cucurbitaceae) collectes au Benin et au
Togo. Belgian Journal of Botany, 141, 21-38.
Adebajo, L. O., Bamgbelu, O. A., & Olowu, R. A. (1994). Mould contamination and the
influence of water activity and temperature on mycotoxin production by two Aspergilli
in melon seed. Nahrung, 38, 209–217.
Adekunle, Y. A., Olowe, V. I., Olasantan, F. O., Okeleye, K. A., Adetiloye, P. O., & Odedina,
J. N. (2014). Mixture productivity of cassava‐ based cropping system and food
security under humid tropical conditions. Food and Energy Security, 3(1), 46-60.
Aguilar, F., Hussain, S. P., & Cerutti, P. (1993). Aflatoxin B1 induces the transversion of
G→T in codon 249 of the p53 tumor suppressor gene in human hepatocytes.
Proceedings of the National Academy of Science, USA. 90(18), 8586–90.
Ajuru, M. G., & Okoli, B. E. (2013). The morphological characterization of the melon species
in the family cucurbitaceae juss., and their utilization in Nigeria. International Journal
of Modern Botany, 3(2), 15-19.
Akiyama, H., Goda, Y., Tanaka, T., & Toyoda, M. (2001). Determination of aflatoxins B1,
B2, G1 and G2 in spices using a multifunctional column clean-up. Journal of
Chromatography A., 932, 153-157.
Page 64
49
Alozie, T. C., Rotimi, C. N., & Oyibo, B. B. (1980). Production of aflatoxin by Aspergillus
flavus (UBMI) in some Nigerian indigenous beverages and foodstuffs.
Mycopathologia, 70, 125-128.
Amanullah, M. M., Alagesan, A., Vaiyapuri, K., Pazhanivelan, S., & Sathyamoorthi, K.
(2006). Intercropping and organic manures on the growth and yield of cassava
(Manihot esculenta Crantz.). Research Journal of Agriculture and Biological Sciences,
2(5), 183-189.
Antonacci, L., Salvat, A. E., Faifer, C., & Godoy, H. M. (1999). Suppression of spore
germination and aflatoxin biosynthesis in Aspergillus parasiticus during and after
exposure to high levels of phosphine. Mycopathologia, 147, 83–87.
Ariño, A., Herrera, M., Estopañán, G., Rota, M. C., Carramiñana, J. J., Juan, T., & Herrera, A.
(2009). Aflatoxins in bulk and pre-packed pistachios sold in Spain and effect of
roasting. Food Control, 20, 811-814.
Asi, M. R., Iqbal, S. Z., Ariño, A., & Hussain, A. (2012). Effect of seasonal variations and
lactation times on aflatoxin M 1 contamination in milk of different species from
Punjab, Pakistan. Food Control, 25(1), 34-38.
Association of Official Analytical Chemists International (1984). Official Methods of
Analysis, 14th ed., AOAC, Washington, D.C., 1984.
Association of Official Analytical Chemists International. (1988). Official Method No.
969.22. Official methods of Analysis of the AOAC International.
Ataş, M., Temizel, A., & Yardimci, Y. (2010). Classification of aflatoxin contaminated chili
pepper using hyperspectral imaging and artificial neural networks. In: Signal
Processing and Communications Applications Conference (SIU), 2010 IEEE 18th,
IEEE. 9-12.
Ataş, M., Yardimci, Y., & Temizel, A. (2011). Aflatoxin contaminated chili pepper detection
by hyperspectral imaging and machine learning. Proc. of SPIE 8027:8027F.
Page 65
50
Ataş, M., Yardimci, Y., & Temizel, A. (2012). A new approach to aflatoxin detection in chili
pepper by machine vision. Computers and Electronics in Agriculture, 87, 129-141.
Attah Daniel, B. E., Ebisike, K., Adeeyinwo, C. E., Ojumu, T. V., Olusunle, S. O. O., &
Adewoye, O. O. (2013). Towards arresting the harmful effect of cyanogenic potential
of cassava to man in the environment. The International Journal of Engineering and
Science, 2(9), 100-104.
Avantaggio, G., Quaranta, F., Desidero, E., & Visconti, A. (2002). Fumonisin contamination
of maize hybrids visibly damaged by Sesamia. Journal of the Science of Food and
Agriculture, 83, 13–18.
Bacaloni, A., Cavaliere, C., Cucci, F., Foglia, P., Samperi, R., & Laganà, A. (2008).
Determination of aflatoxins in hazelnuts by various sample preparation methods and
liquid chromatography–tandem mass spectrometry. Journal of Chromatograph A.,
1179, 182-189.
Bakirdere, S., Bora, S., Bakirdere, E. G., Aydin, F., Arslan, Y., Komesli, O. T., Aydin, I., &
Yildirim, E. (2012). Aflatoxin species: their health effects and determination methods
in different foodstuffs. Central European Journal of Chemistry, 10, 675-685.
Bankole, S. A. (1993). Moisture content, mould invasion and seed germinability of stored
melon. Mycopathologia, 122(2), 123-126.
Bankole, S. A., & Adebanjo, A. (2003). Aflatoxin contamination of dried yam chips marketed
in Nigeria. Tropical Science, 43, 201-203.
Bankole, S. A., & Eseigbe, D. A. (1996). Occurrence of mycoflora and aflatoxins in marketed
tigernut. Crop Research, 11, 219-223.
Bankole, S. A., Adenusi, A. A., Lawal, O. S., & Adesanya, O. O. (2010). Occurrence of
aflatoxin B1 in food products derivable from “egusi” melon seeds consumed in
Southwestern Nigeria. Food control, 21(7), 974-976.
Page 66
51
Bankole, S. A., Lawal, O. A., & Adebanjo, A. (2004). Storage practices and aflatoxin B1
contamination of “egusi” melon seeds in Nigeria. Tropical Science, 44(3), 150-153.
Bankole, S. A., Ogunsanwo, B. M., & Mabekoje, O. O. (2004). Natural occurrence of moulds
and aflatoxins in melon seeds from markets in Nigeria. Food and Chemical
Toxicology, 44, 1209-1214.
Bankole, S. A., Ogunsanwo, B. M., Osho, A., & Adewuyi, G. O. (2006). Fungal
contamination and aflatoxin B1 of ‘egusi’ melon seeds in Nigeria. Food
Control, 17(10), 814-818.
Bennett, J. W., & Klich, M. (2003). Mycotoxins. Clin. Microbiol. Rev, 16, 497-516.
Beuchat, L. R. (1987). Food and Beverage Mycology, 2nd ed., Van Nostand Reinhold, New
York, USA.
Bhat, R. V., & S. Vasanthi, (2003). Food Safety in Food Security and Food Trade. Mycotoxin
Food Safety Risk in Developing Countries. International Food Policy Research
Institute.
Bhatnagar, D., Yu, J., & Ehrlich, K. C. (2002). Toxins of filamentous fungi. In: Fungal
Allergy and Pathogenicity. Chemical Immunology and Allergy, Vol. 81, 167–206,
Breitenbach, M., Crameri, R., and Lehrer, S. Eds., Basel, Karger.
Binder, E. M., Tan, L. M., Chin, L. J., Handl, J., & Richard, J. (2007). Worldwide occurrence
of mycotoxins in commodities, feeds and feed ingredients. Animal feed science and
technology, 137(3), 265-282.
Blount, W. P. (1961). Turkey “X” disease. Turkeys 9(2), 55-58.
Brown, D. W., Adams, T. H., & Keller, N. P. (1996). Aspergillus has distinct fatty acid
synthases for primary and secondary metabolism. Proceedings of the National
Academy of Science, USA, 93, 14873–77.
Bullerman, L. B. (1987). Methods of detecting mycotoxins in foods and beverages, in Food
and Beverage Mycology, 2nd ed., Beuchat, L. R., Ed., AVI, New York, 571.
Page 67
52
Cary, J. W., Ehrlich, K. C., Beltz, S. B., Harris-Coward, P., & Klich, M. A. (2009).
Characterization of the Aspergillus ochraceoroseus aflatoxin /sterigmatocystin
biosynthetic gene cluster. Mycologia., 101, 352–62.
Cary, J. W., Klich, M. A., & Beltz, S. B. (2005). Characterization of aflatoxin- producing
fungi outside of Aspergillus section Flavi. Mycologia., 97, 425– 32.
Chauhan, Y. S., Wright, G. C., & Rachaputi, N. C. (2008). Modelling climatic risks of
aflatoxin contamination in maize. Australian Journal of Experimental Agriculture, 48,
358– 366.
Chikezie, P. C., & Ojiako, O. A. (2013). Cyanide and aflatoxin loads of processed cassava
(Manihot esculenta) tubers (Garri) in Njaba, Imo state, Nigeria. Toxicology
international, 20(3), 261.
Chinsman, B., & Fiagan, Y. S. (1987). Postharvest technologies of root and tuber crops in
Africa: evaluation and recommended improvements. In Tropical root crops: root crops
and the African food crisis: proceedings of the Third Triennial Symposium of the
International Society for Tropical Root Crops--Africa Branch held in Owerri, Nigeria,
17-23 August 1986. Ottawa, Ont., Canada: International Development Research
Centre.
Codex Alimentarius Commission, (2013). Proposed draft maximum levels for hydrocyanic
acid in cassava and cassava products, Joint FAO/WHO Food Standard Programme,
Codex Committee on Contaminants in Food. Accessed on 2nd
February, 2017 From
ftp://ftp.fao.org/codex/meetings/cccf/cccf7/cf07_10e.pdf.
Cotty, P. J. (1989). Virulence and cultural characteristic of two Aspergillus flavus strains
pathogenic on cotton. Phytopathology, 79, 808–14.
Council for Agricultural Science and Technology. (2003). Mycotoxins: Risks in Plant and
Animal Systems. Task Force Rep No 38. Council for Agricultural Science and
Technology (CAST), Ames, Iowa, USA.
Page 68
53
Creppy, E. E. (2002). Update of survey, regulation and toxic effects of mycotoxins in Europe.
Toxicology letters, 127, 19-28.
Cucullu, A. F., Lee, L. S., Mayne, R. Y., & Goldblatt, L. A. (1966). Determination of aflatoxin
in individual peanuts and peanut sections. Journal of the American Oil Chemists’
Society, 43, 89.
Debertin, D. L. (1986). Agricultural Production Economics. New York: Macmillan Publishing
Company.
Decastelli, L., Lai, J., Gramaglia, M., Monaco, A., Nachtmann, C., Oldano, F., Ruffer, M.,
Sezian, A., & Bandirola, C. (2007). Aflatoxins occurrence in milk and feed in Northern
Italy during 2004–2005. Food Control, 18, 1263– 1266.
Desmarchelier, A., Oberson, J. M., Tella, P., Gremaud, E., Seefelder, W., & Mottier, P.
(2010). Development and comparison of two multiresidue methods for the analysis of
17 mycotoxins in cereals by liquid chromatography electrospray ionization tandem
mass spectrometry. Journal of Agricultural and Food Chemistry, 58, 7510-7519.
Dobson, D. W., & Sweeney, M. J. (1998). Mycotoxin production by Aspergillus, Fusarium
and Penicillium species. International Journal of Food Microbiology, 43, 141–158.
Dors, G. C., Caldas, S. S., Feddern, V., Bemvenuti, R. H., dos Santos Hackbart, H. C., de
Souza, M. M., dos Santos Oliveira, M., Garda-Buffon, J., Primel, E. G., & Badiale-
Furlong, E. (2011). Aflatoxins: Contamination, Analysis and Control. In: Aflatoxins-
Biochemistry and Molecular Biology, 415-438. Guevara-Gonzalez, R. G., Eds., In
Tech, Rijeka.
Edison, S. (2000). Present situation and future potential of cassava in India. In Cassava’s
Potential in Asia in the 21st Century: Present Situation and Future Research and
Development Needs. Proc. 6th Regional Workshop, held in Ho Chi Minh city,
Vietnam 61-70.
Page 69
54
Edison, S., Anantharaman, M., & Srinivas, T. (2006). Status of cassava in India: An overall
view, Central Tuber Crops Research Institute (Indian Council of Agricultural
Research). Technical Bulletin Series, 46.
Ehrlich, K. C., Chang, P. K., Yu, J., & Cotty, P. J. (2004). Aflatoxins biosynthesis cluster gene
cyp A is requiered for G aflatoxin formation. Applied Environmental Microbiology, 70,
6518–6524.
Ejiofor, M. A. N., & Okafor, N. (1981). Comparison of pressed and unpressed cassava pulp
for gari making. In 1. Triennial Root Crops Symposium of the International Society for
Tropical Root Crops, Ibadan (Nigeria), 8-12 Sep 1980. IDRC.
Ellis, W. O., Smith, J. P., Simpson, B. K., Oldham, J. H., & Scott, P. M. (1991). Aflatoxins in
food: occurrence, biosynthesis, effects on organisms, detection, and methods of
control. Critical Reviews in Food Science & Nutrition, 30(4), 403-439.
El-Nezami, H. S., Nicoletti, G., Neal, G. E., Donohue, D. C., & Ahokas, J. T. (1995).
Aflatoxin M1 in human breast milk samples from Victoria, Australia and Thailand.
Food and Chemical Toxicology, 33, 173–179.
Ene, L. S. O. (1992). Prospects for processing and utilization of root and tuber crops in Africa.
In Proc. 4th Symposium, ISTRC–AB. 7-15.
Espinosa-Calderón, A., Contreras-Medina, L. M., Muñoz-Huerta, R. F., Millán-Almaraz, J. R.,
González, R. G. G., & Torres-Pacheco, I. (2011). Methods for Detection and
Quantification of Aflatoxins. In: Detection, Measurement and Control. 109-128.
Torres-Pacheco, I., Eds., In Tech, Rijeka.
European Commission. (1998). Commission Regulation (EC) No 1525/98 of 16 July 1998,
amending Regulation (EC) No 194/97 of 31 January 1997 setting maximum levels for
certain contaminants in foodstuffs. Official Journal of the European Communities L
201, 43-46.
Page 70
55
European Commission. (2001). Commission Regulation (EC) No 466/2001 of 8 March 2001
setting maximum levels for certain contaminants in foodstuffs. Official Journal of the
European Communities L., 77, 1-13.
European Commission. (2002). Commission Regulation EC No 178/2002 – Laying down the
general principles and requirements of food law, establishing the European Food
Safety Authority and laying down procedures in matters of food safety.
https://ec.europa.eu/food/sites/food/files/safety/docs/gfl_fitc_survey_ev_stakeholders
en.pdf
European Commission. (2004). Commission Regulation (EC) No 683/2004 of 13 April 2004
amending Regulation (EC) No 466/2001 as regards aflatoxins and ochratoxin A in
foods for infants and young children. Official Journal of the European Union L., 106,
3-5.
European Commission. (2006a). Commission Regulation (EC) No 1881/2006 of 19 December
2006 setting maximum levels for certain contaminants in foodstuffs. Official Journal
of the European Union L., 364, 5-24.
European Commission (2006b). Commission Regulation (EC) No. 401/2006. Official Journal
of the European Communities, L., 70, 12-34.
European Commission. (2010). Commission regulation (EU) No 165/2010 of 26 February
2010 amending regulation (EC) No 1881/2006 setting maximum levels for certain
contaminants in foodstuffs as regards aflatoxins. Official Journal of the European
Commission. L., 50, 8–12.
European Commission. (2014). Commission regulation (EC) No 884/2014 of 13 August 2014
imposing special conditions governing the import of certain feed and food from certain
third countries due to contamination risk by aflatoxins and repealing regulation (EC)
No 1152/2009. Official Journal of the European Commission. L., 242, 4–19.
European Food Safety Authority (2007). Opinion of the scientific panel on contaminants in the
food chain [CONTAM] related to the potential increase of consumer health risk by a
Page 71
56
possible increase of the existing maximum levels for aflatoxins in almonds, hazelnuts
and pistachios and derived products. Journal of European Food Safety Authority, 446,
1–127.
Farombi, E. O. (2006). Aflatoxin contamination of foods in developing countries: implications
for hepatocellular carcinoma and chemopreventive strategies. African Journal of
Biotechnology, 5, 1–14.
FAO/WHO (1990). FAO/WHO Standards Programme. Codex Alimentarius Commission,
Alinorm 91/29.
FAO/WHO (1992). FAO/WHO Standards Programme. Codex Alimentarius Commission,
Alinorm 93/12.
Fernanda, M., De Castro, P. P. M., Pachelo, I. A., Soares, M. V., Furlant, R. P. Z., De Paula,
D. C., & Bolonhezi, S. (1996). Warehouse control of Aspergillus flavus link and
Aspergillus parasiticus speare on peanuts (Arachis hypogaea) by phosphine
fumigation and its effect on aflatoxin production. Journal of Food Protection, 59, 407–
411.
Food and Agriculture Organization (2000). Drought in Kenya: Food situation in deteriorating
rapidly first starvation-related deaths. Press release 00/40.
http://www.fao.org/WAICENT/OIS/PRESS_NE/PRESSENG/2000/pren0040.htm.
Accessed on February 4, 2017.
Food and Agriculture Organization (2004). Worldwide Regulations for Mycotoxins in Foods
and Feeds in 2003. FAO Food and Nutrition Paper 81. Rome, Italy.
Franz, C. M., Huch, M., Mathara, J. M., Abriouel, H., Benomar, N., Reid, G., & Holzapfel, W.
H. (2014). African fermented foods and probiotics. International journal of food
microbiology, 190, 84-96.
GB 2761-2011 (2011). National food safety standard of maximum levels of mycotoxins in
foods. Beijing, China.
Page 72
57
Ghali, R., Belouaer, I., Hdiri, S., Ghorbel, H., Maaroufi, K., & Hedilli, A. (2009).
Simultaneous HPLC determination of aflatoxins B1, B2, G1 and G2 in Tunisian
sorghum and pistachios. Journal of Food Composition and Analysis, 22(7), 751-755.
Gilbert, J., & Anklam, E. (2002). Validation of analytical methods for determining mycotoxins
in foodstuffs. TrAC Trends in Analytical Chemistry, 21, 468-486.
Giwa, S., Abdullah, L. C., & Adam, N. M. (2010). Investigating “egusi” (Citrullus colocynthis
L.) seed oil as potential biodiesel feedstock. Energy., 3, 607–618.
Gnonlonfin, G. J. B., Hell, K., Adjovi, Y., Fandohan, P., Koudande, D. O., Mensah, G. A.,
Sanni, A., & Brimer, L. (2013). A Review on Aflatoxin Contamination and Its
Implications in the Developing World: A Sub- Saharan African Perspective. Critical
Reviews in Food Science and Nutrition, 53, 349-365.
Gomes, E., Souza, S. R. D., Grandi, R. P., & Silva, R. D. (2005). Production of thermostable
glucoamylase by newly isolated Aspergillus flavus A 1.1 and Thermomyces
lanuginosus A 13.37. Brazilian Journal of Microbiology, 36(1), 75-82.
Goto, T., Wicklaw D. T., & Ito Y. (1996). Aflatoxin and cyclopiazonic acid production by a
sclerotium producing starin of Aspergillus tamarii. Applied Environmental
Microbiology, 62, 4036–4038.
Gqaleni, N., Smith, J. E., Lacey, J., & Gettinby, G. (1997). Effects of temperature, water
activity and incubation time on production of aflatoxins and cyclopiazonic acid by an
isolate of Aspergillus flavus in surface agar culture. Appleid Environmental
Microbiology, 63, 1048–1053.
Groopman, J. D., & Donahue, K. F. (1988). Aflatoxin, A human carcinogen: determination in
foods and biological samples by monoclonal antibody affinity chromatography.
Journal of Association of Official Analytical Chemists’, 71, 861.
Groopman, J. D., Cain, L. G., Kensler, T. W., & Harris, C. C. (1988). Aflatoxin exposure in
human populations: measurements and relationship to cancer. CRC Critical reviews in
Toxicology, 19(2), 113-145.
Page 73
58
Grove, A. T., & Rackham, O. (2003). The nature of Mediterranean Europe: an ecological
history. Yale University Press.
Hahn, S. K., Reynolds, L., & Egbunike, G. N. (1988). Cassava as livestock feed in Africa.
In Proceedings of the IITA/ILCA/University of Ibadan. Workshop on the Potential
Utilisation of Cassava as Livestock Feed in Africa. International Institute of Tropical
Agriculture. International Livestock Centre for Africa.
Hamilton, D. (2000). Toxic fungus threatens health of consumers: Mycotoxins in food in West
Africa: current situation and possibility of controlling it. African Journal of
Biotechnology, 2(9), 254-263.
Heathcote, J. G., & Hibbert, J. R. (1978). Aflatoxins: Chemical and Biological Aspects.
Elsevier, New York, USA. 212.
Hell, K., Cardwell, F. K., & Poehling, H. M. (2003). Relationship between management
practices, fungal infection and aflatoxin for stored maize in Benin. Journal of
Phytopathology, 151, 690–698.
Hennigen, M. R., Valente Soares, L. M., Sanchez, S., Di Benedetto, N. M., Longhi, A.,
Eyherabide, G., & Zanelli, M. (2000). Fumonisin in corn hybrids grown in Argentina
for two consecutive seasons. In Proceeding of the Xth international IUPAC symposium
on mycotoxins and phycotoxins. (21-25).
Hernández-Hierro, J. M., García-Villanova, R. J., & González-Martín, I. (2008). Potential of
near infrared spectroscopy for the analysis of mycotoxins applied to naturally
contaminated red paprika found in the Spanish market. Analytica Chimica Acta, 622,
189-194.
Horn, B. W., Moore, G. G., & Carbone, I. (2009a). Sexual reproduction in Aspergillus flavus.
Mycologia, 101, 423–29.
Horn, B. W., Ramirez-Prado, J. H., & Carbone, I. (2009b). The sexual state of Aspergillus
parasiticus. Mycologia, 101, 275–80.
Page 74
59
Howeler, R. H. (2000). Cassava agronomy research in Asia: Has it benefited cassava farmers.
In Cassava’s Potential in Asia in the 21st Century: Present Situation and Future
Research and Development Needs. Proc. 6th Regional Workshop, held in Ho Chi Minh
city, Vietnam (345-382).
Howeler, R. L., Thomas, N., Arrieta Bolaños, S., Ochoa Henríquez, J. M., Odio Echeverría,
F., Moreno, V., & Boerger, J. (2013). Save and grow: cassava. A guide to sustainable
production intensificationProduire plus avec moins Ahorrar para crecer (No. FAO
633.6828 S266). FAO, Roma (Italia).
Huang, B., Han, Z., Cai, Z., Wu, Y., & Ren, Y. (2010). Simultaneous determination of
aflatoxins B1, B2, G1, G2, M1 and M2 in peanuts and their derivative products by
ultra-high-performance liquid chromatography–tandem mass spectrometry. Analytica
Chimica Acta, 662, 62-68.
Hudson, B. J. F., & Ogunsua, A. O. (1974). Lipids of cassava tubers (Manihot esculenta
Crantz). Journal of the Science of Food and Agriculture, 25(12), 1503-1508.
International Agency for Research on Cancer (1993). Aflatoxins. IARC Monographs on the
Evaluation of Carcinogenic Risks to Humans: Some Naturally Occurring Substances:
Food Items and Constituents, Heterocyclic Aromatic Amines and Mycotoxins, 56, 245-
395.
ISO 13690 (1999). International Standard. Cereals, pulses and milled products – sampling of
static batches.
Ito, Y., Peterson, S. W., Wicklow, D. T., & Goto, T. (2001). Aspergillus pseudotamarii, a new
aflatoxin producing species in Aspergillus section Flavi. Mycological Research, 105,
233–239.
Iyayi, E. A., & Losel, D. M. (2001). Protein enrichment of cassava by-products through solid
state fermentation by fungi. The Journal of Food Technology in Africa, 6(4), 116-118.
Page 75
60
Jackson, B. A., Adamade, C. A., Azogu, I. I., & Oni, K. C. (2013). Melon pod fermentation
and its effects on physio-chemical characteristics of melon seeds. Scientific Research
and Essays, 8(17), 664-669.
Jonathan, S. G., Abdul-Lateef, M. B., & Ayansina, A. D. (2013). Fungal and aflatoxin
detection in fresh and stored “garri” Ijebu (locally processed food). Report and
Opinion, 5, 13-9.
Josephs, R. D., Derbyshire, M., Stroka, J., Emons, H., & Anklam, E. (2004). Trichothecenes:
reference materials and method validation. Toxicology Letters, 153, 123-132.
Junior, C. B., & Campos, L. (2004). Identification and characterization of a novel cassava
(Manihot esculenta Crantz) clone with high free sugar content and novel starch. Plant
Molecular Biology, 56(4), 643-659.
Kademi, H. I. (2016). Investigating the occurrence of Vibrio parahaemolyticus in various
seafood consumed in Turkish Republic of Northern Cyprus. Master’s thesis, Near East
University.
Khayoon, W. S., Saad, B., Yan, C. B., Hashim, N. H., Ali, A. S. M., Salleh, M. I., & Salleh, B.
(2010). Determination of aflatoxins in animal feeds by HPLC with multifunctional
column clean-up. Food Chemistry, 118, 882-886.
Kos, J., Mastilović, J., Hajnal, E. J., & Šarić, B. (2013). Natural occurrence of aflatoxins in
maize harvested in Serbia during 2009–2012. Food Control, 34(1), 31-34.
Krska, R., Schubert-Ullrich, P., Molinelli, A., Sulyok, M., MacDonald, S., & Crews, C.
(2008). Mycotoxin analysis: An update. Food Additives and Contaminants A, 25, 152-
163.
Kulshrestha, R., Gupta, C. P., Shukla, G., Kundu, M. C., Bhatnagar, S. P., & Katiyar, C. K.
(2008). The effect of water activity and storage temperature on the growth of
Aspergillus flavus in Medicinal herbs. Planta Medica, 74, 1308-1315.
Page 76
61
Kurtzman, C. P., Horn, B. W., & Hesseltine, C. (1987). A. nominus, a new aflatoxin producing
species related to A. flavus and A. tamarii. Antonie van Leeuwenhoek 53, 147–158.
Kushwaha, H. L., Srivastava, A. P., & Singh, H. (2005). Development and performance
evaluation of an okra seed extractor.
Lahai, B. N. (1991). An evaluation of the level of female participation in cassava and sweet
potato on-farm trials and demonstrations in Sierra Leone. In Symposium on Tropical
Root Crops in a Developing Economy 380 (55-61).
Lanyasunya, T. P., Wamae, L. W., Musa, H. H., Olowofeso, O., & Lokwaleput, I. K. (2005).
The risk of mycotoxins contamination of dairy feed and milk on small holder dairy
farms in Kenya. Pakistan Journal of Nutrition, 4, 162–169.
Lebot, V. (2009). Tropical root and tuber crops: cassava, sweet potato, yams and aroids (No.
17). CABI.
Leslie, J. F., Bandyopadhyay, R., & Visconti, A. (Eds.). (2008). Mycotoxins: detection
methods, management, public health and agricultural trade. CABI.
Lozovaya, V. V. (1998). β-1,3-Glucanase and resistance to Aspergillus flavus infection in
maize. Crop Science, 38, 1255–1260.
Magan, N., & Aldred, D. (2007). Post-harvest control strategies: Minimizing mycotoxins in
the food chain. International Journal of Food Microbiology, 119, 131–139.
Măruţoiu, C., Puiu, S., Moise, M. I. Soran, L., Măruţoiu, O. F., & Boboş, L. (2004).
Optimization of the separation of some aflatoxins by thin-layer chromatography. JPC-
Journal of Planar Chromatography, 17, 372-374.
Minto, R. E., & Townsend, C. A. (1997). Enzymology and molecular biology of aflatoxin
biosynthesis. Chemical Reviews, 97, 2537–2555.
Molina, M., & Giannuzzi, L. (2002). Modelling of aflatoxin production by Aspergillus
parasiticus in a solid medium at different temperatures, pH and propionic acid
concentrations. Food Research International, 35, 585–594.
Page 77
62
Mora, M., & Lacey, J. (1997). Handling and aflatoxin contamination of white maize in Costa
Rica. Mycopathologia, 138, 77–89.
Moreno, R. A. (1992). Recent developments in cassava agronomy. Roots, tubers, plantains
and bananas in animal feeding. FAO Animal Production and Health Paper, (95).
Nakai, V. K., de Oliveira Rocha, L., Gonçalez, E., Fonseca, H., Ortega, E. M. M., & Corrêa,
B. (2008). Distribution of fungi and aflatoxins in a stored peanut variety. Food
Chemistry, 106, 285-290.
Nassar, N. M., & Sousa, M. V. (2007). Amino acid profile in cassava and its interspecific
hybrid. Genetics and Molecular Research, 6(2), 192-197.
Ngiki, Y. U., Igwebuike, J. U., & Moruppa, S. M. (2014). Utilisation of cassava products for
poultry feeding: A review. The International Journal of Science and Technology, 2(6),
48.
Njapau, H. (Ed.). (2006). Mycotoxins and Phycotoxins: Advances in Determination,
Toxicology, and Exposure Management: Proceedings of the XIth International IUPAC
Symposium on Mycotoxins and Phycotoxins, May 17-21, 2004, Bethesda, Maryland,
USA. Wageningen Academic Pub.
Northolt, M. D., van Egmond, H. P., & Paulsch, W. E. (1977). Differences in Aspergillus
flavus strains in growth and aflatoxin B1 production in relation to water activity and
temperature. Journal of Food Protection, 40, 778–781.
Omafuvbe, B. O. (1998). Evacuation of the microbiological and biochemical properties of two
cowpea (Vigna unguiculata) varieties. Plant Foods for Human Nutrition, 53, 321-332.
Onwueme, I. C. (1978). The tropical tuber crops: yams, cassava, sweet potato, and cocoyams.
John Wiley and Sons.
Osundare, B. (2007). Effects of different interplanted legumes with cassava on major soil
nutrients, weed biomass, and performance of cassava (Manihot esculenta Crantz) in
the Southwestern Nigeria. ASSET: An International Journal (Series A), 7(1), 216-227.
Page 78
63
Otsuki, T., Wilson, J. S., & Sewadeh, M. (2001). Saving two in a billion: Quantifying the trade
effect of European food safety standards on African export. Food Policy, 26, 495–514.
Owusu-Darko, P. G., Paterson, A., & Omenyo, E. L. (2014). Cocoyam (corms and cormels)—
An underexploited food and feed resource. Journal of Agricultural Chemistry and
Environment, 3(01), 22.
Oyenuga, V. A., & Fetuga. B. L. (1975). Some aspects of the bio- chemistry and nutritive
value of the watermelon seed (Citrullus vulgaris, Schrad). Journal of the Science of
Food and Agriculture, 26, 843.
Palmgren, M. S., & Hayes A. W. (1987). Aflatoxins in food. In Mycotoxins in Food, Palle
Kroghs, Ed., Academic Press, London, 65-96.
Peterson, S. W., Ito, Y., Horn, B. W., & Goto, T. (2001). Aspergillus bombycis, a new
aflatoxigenic species and genetic variation in its sibling species, Aspergillus nomius.
Mycologia, 93, 689–703.
Picinin, L. C. A., Cerqueira, M. M. O. P., Vargas, E. A., Lana, A. M. Q., Toaldo, I. M., &
Bordignon-Luiz, M. T. (2013). Influence of climate conditions on aflatoxin M1
contamination in raw milk from Minas Gerais State, Brazil. Food Control, 31, 419-
424.
Piperno, D. R. (2011). The origins of plant cultivation and domestication in the New World
tropics: patterns, process, and new developments. Current anthropology, 52(4), 453-
470.
Pitt, J. I. (2000). Toxigenic fungi and mycotoxins. British Medical Bulletin, 56, 184-192.
Pitt, R. E. (1993). A descriptive model of mold growth and aflatoxin formation as affected by
environmental conditions. Journal of Food Protection, 56, 139–146.
Pomeranz, Y., & Meloan, C. E. (1987). Food Analysis Theory and practice, An Avi
Book. London, England.
Page 79
64
Pons, W. A., & Franz, A. O. (1977). High performance liquid chromatography of aflatoxins in
cotton products, Jornal of Association of Official Analytical Chemists’, 60, 89.
Prandini, A., Tansini, G., Sigolo, S., Filippi, L., Laporta, M., & Piva, G. (2009). On the
occurrence of aflatoxin M1 in milk and dairy products. Food and Chemical
Toxicology, 47, 984-991.
Promthong, S., Kanto, U., Tirawattanawanich, C., Tongyai, S., Isariyodom, S., Markvichitr,
K., & Engkagul, A. (2005). Comparison of nutrient compositions and carbohydrate
fractions of corn, cassava chip and cassava pellet ingredients: Animals. In Proceedings
of 43rd Kasetsart University Annual Conference, Thailand.
Quinto, M., Spadaccino, G., Palermo, C., & Centonze, D. (2009). Determination of aflatoxins
in cereal flours by solid-phase micro extraction coupled with liquid chromatography
and post-column photochemical derivatization-fluorescence detection. Journal of
Chromatography A, 1216, 8636-8641.
Rachaputi, N. R., Wright G. C., & Kroschi, S. (2002). Management practices to minimise pre-
harvest aflatoxin contamination in Australian groundnuts. Australian Journal of
Experimental Agriculture, 42, 595-605.
Rahimi, E., Bonyadian, M., Rafei, M., & Kazemeini, H. R. (2010). Occurrence of aflatoxin
M1 in raw milk of five dairy species in Ahvaz, Iran. Food and Chemical Toxicology,
48, 129–131.
Ramos, A. J., & Hernández, E. (1996). In-situ absorption of aflatoxins in rat small intestine.
Mycopathologia, 134(1), 27-30.
Rapid Alert System for Food and Feed (2012). Notification details. Rapid alert system for
food and feed. European Commission, Health and Food Safety. Annual Report.
Retrieved on 5th
February, 2017. Available at.
https://ec.europa.eu/food/sites/food/files/safety/docs/rasff_annual_report_2012_en.pdf
Reiter, E. V., Vouk, F., Böhm, J., & Razzazi-Fazeli, E. (2010). Aflatoxins in rice - A limited
survey of products marketed in Austria. Food Control, 21, 988-991.
Page 80
65
Roze, L. V., Arthur, A. E., Hong, S. J., Chanda, A., & Linz, J. E. (2007). The initiation and
pattern of spread of histone H4 acetylation parallel the order of transcriptional
activation of genes in the aflatoxin cluster. Molecular Microbiology, 66, 713–726.
Saleh, A., Abdullahi, I. O., & Olonitola, O. S. (2016). Determination of aflatoxin
contamination in cassava flour sold in selected markets in Zaria, Kaduna state;
Nigeria. Bayero Journal of Pure and Applied Sciences, 9(2), 145-147.
Sanchez, A., Fuller, A. B., Yahiku, P. Y., & Baldsin, M. V. (1972). Supplementary value of
blackeyed peas, peanuts and egusi seed on the typical West African diet of plant origin.
Nutritional Reports International, 6, 171.
SANCO. (2009). Method validation and quality control procedures for pesticide residue
analysis in food and feed. Document No. SANCO/10684/2009, Implemented by
01/01/2010.
Sassahara, M., Netto, D. P., & Yanaka, E. K. (2005). Aflatoxin occurrence in foodstuff
supplied to dairy cattle and aflatoxin M1 in raw milk in the North of Parana state. Food
and Chemical Toxicology, 43, 981-984.
Scholten, J. M., & Spanjer, M. C. (1996). Determination of aflatoxin B1 in pistachio kernels
and shells. Journal of Association of Official Analytical Chemists’, 79, 1360-1364.
Scott, G. J. (2000). Roots and tubers in the global food system: a vision statement to the year
2020. Report to the Technical Advisory Committee (TAC) of the Consultative Group
on International Agricultural Research (CGIAR). IITA.
Set, E., & Erkmen, O. (2010). The aflatoxin contamination of ground red pepper and pistachio
nuts sold in Turkey. Food and chemical Toxicology, 48, 2532-2537.
Sheibani, A., & Ghaziaskar, H. S. (2009). Pressurized fluid extraction for quantitative
recovery of aflatoxins B1 and B2 from pistachio. Food Control, 20, 124-128.
Shephard, G. S. (2006). Mycotoxins in the context of food risks and nutrition issues. Barug,
D., Bhatnagar, D. Van Egmond, HP, Van Der Kamp, JW, Van Osenbruggen, WA und
Page 81
66
A. Visconti (Editors): The Mycotoxin Factbook: Food and Feed Topics. Wageningen
Academic Publishers, 21-36.
Shephard, G. S. (2009). Aflatoxin analysis at the beginning of the twenty-first century.
Analytical and Bioanalytical Chemistry, 395, 1215-1224.
Shouman, B. O., El-Morsi, D., Shabaan, S., Abdel-Hamid, A. H., & Mehrim, A. (2012).
Aflatoxin B1 Level in Relation to Child’s Feeding and Growth. Indian Journal of
Pediatrics, 79, 56-61.
Smith, J. E., & Moss, M. O. (1985). Mycotoxins. Formation, analysis and significance. John
Wiley & Sons Ltd.
Somorin, Y., Akinyemi, A., Bertuzzi, T., & Pietri, A. (2016). Co-occurrence of aflatoxins,
ochratoxin A and citrinin in “egusi” melon (Colocynthis citrullus L.) seeds consumed
in Ireland and the United Kingdom. Food Additives & Contaminants: Part B, 9(3),
230-235.
Speijers, G. J. A., & Speijers, M. H. M. (2004). Combined toxic effects of mycotoxins.
Toxicology Letters, 153, 91–98.
Srinivas, T. (2009). Economics of sweet potato production and marketing. In The Sweet
potato (235-267). Springer Netherlands.
Stoloff, L. (1972). Analytical methods for mycotoxins, Clinical Toxicology, 5, 465.
Stroka, J., & Anklam, E. (2000). Development of a simplified densitometer for the
determination of aflatoxins by thin-layer chromatography. Jouranl of
Chromatography A, 904, 263-268.
Tavva, S., & Nedunchezhiyan, M. (2012). Global status of sweet potato cultivation. Fruit,
Vegetable and Cereal Science and Biotechnology, 6(1), 143-147.
Thiel, P. G. (1986). HPLC determination of aflatoxin and mammalian aflatoxin metabolites, in
Mycotoxins and Phycotoxins, Steyn, P. S. and Vleggaar, R., Eds., Elsevier, New York,
329.
Page 82
67
Thuvander, A., Moller, T., Barbieri, H. E., Jansson, A., Salomonsson, A. C., & Olsen, M.
(2001). Dietary intake of some important mycotoxins by the Swedish population. Food
Additives and Contaminants, 18, 696-706.
Tran-Dinh, N., Pitt, J. I., & Carter, D. A. (1999). Molecular genotype analysis of natural
toxigenic and nontoxigenic isolates of A. flavus and A. parasiticus. Mycological
Research, 103, 1485–90.
Tripathi, S., & Mishra, H. N. (2011). Modeling and optimization of enzymatic degradation of
aflatoxin B (AFB) in red chili powder using response surface methodology. Food and
Bioprocess Technology, 4, 770-780.
Turner, N. W., Subrahmanyam, S., & Piletsky, S. A. (2009). Analytical methods for
determination of mycotoxins: A review. Analytica Chimica Acta, 632, 168-180.
Turner, P. C., Sylla, A., Diallo, M. S., Castegnaro, J. J., Hall, A. J., & Wild, C. P. (2002). The
role of aflatoxins and hepatis viruses in the etiopathogenesis of hepatocellular
carcinoma: A basis for primary prevention in Guinea-Conakry, West Africa. Journal of
Gastroenterology and Hepatology, 17, 5441-5448.
Turner, P. C., Sylla, A., Gong, Y. Y., Diallo, M. S., Sutcliffe, A. E., Hall, A. J., & Wild, C. P.
(2005). Reduction in exposure to carcinogenic aflatoxins by postharvest intervention
measures in West Africa: a community-based intervention study. Lancet., 365, 1950–
1956.
U.S. Food and Drug Administration. (1996). Sec. 527. 400 Whole milk, low fat milk, skim
milk- aflatoxin M1 (CPG 7106.210). FDA compliance policy guides. FDA,
Washington, DC, 219.
Umoh, I. B., & Oke, O. L. (1974). Nutritive value of some lesser known oilseeds in rats.
Nutrition Reports International, 9, 453.
Uzogara, S. G., Agu, L. N., & Uzogara, E. O. (1990). A review of traditional fermented foods,
condiments and beverages in Nigeria: Their benefits and possible problems. Ecology of
food and nutrition, 24(4), 267-288
Page 83
68
Var, I., Kabak, B., & Gök, F. (2007). Survey of aflatoxin B1 in helva, a traditional Turkish
food, by TLC. Food Control, 18, 59-62.
Villordon, A. Q., Ginzberg, I., & Firon, N. (2014). Root architecture and root and tuber crop
productivity. Trends in plant science, 19(7), 419-425.
Vlavonou, B. M. (1988). Cassava Processing Technologies in Africa. In Praise of Cassava,
Proceedings of the Interregional Experts’ Group Meeting on the Exchange of
Technologies for Cassava Processing Equipment and Food Products, IITA, Ibadan,
Nigeria. Apr 13–19, 1988; Hahn, N.D., Ed.; UNICEF House: New York, 19–25.
Wilson, D. M., Mubatanhema, W., & Jurjevic, Z. (2002). Biology and ecology of
mycotoxigenic Aspergillus species as related to economic and health concerns.
Advances in Experimental Medicine and Biology, 504, 3–17.
Wilson, W. M., & Dufour, D. L. (2002). Why “Bitter” Cassava? Productivity of “Bitter” and
“Sweet” Cassava in a Tukanoan Indian Settlement in the Northwest Amazon
1. Economic Botany, 56(1), 49-57.
Xie, L., Chen, M., & Ying, Y. (2016). Development of Methods for Determination of
Aflatoxins. Critical reviews in food science and nutrition, 56(16), 2642-2664.
Yabe, K., & Nakajima, H., (2004). Enzyme reactions and genes in aflatoxin biosynthesis.
Applied Microbiology and Biotechnology, 64, 745–755.
Yu, J. (2003). Genetics and biochemistry of mycotoxins synthesis. In: Handbook of fungal
biotechnology (2nd Edition). Arora, D.K. Ed., New York, Marcel Dekker, In press.
Yu, J., Chang, P. K., Cary, J. W., Wright, M., Bhatnagar, D., Cleveland, T. E., Payne, G. A.,
& Linz, J. (1995). Comparative mapping of aflatoxin pathway gene clusters in
Aspergillus parasiticus and Aspergillus flavus. Applied Environmental Microbiology,
61, 2365–2371.
Yusuf, O., Sanni, A., Ojuekaiye, E. O., & Ugbabe, O. O. (2008). Profitability of “egusi”
Melon (Citrullus lanatus Thunb. Mansf). Production under sole and mixed cropping
Page 84
69
Systems in Kogi State, Nigeria. ARPN Journal of Agricultural and Biological
Sciences, 3, 14-18.
Zain, M. E. (2010). Impact of mycotoxins on humans and animals. Journal of Saudi Chemical
Society, 15, 1–16.
Zöllner, P., & Mayer-Helm, B. (2006). Trace mycotoxin analysis in complex biological and
food matrices by liquid chromatography–atmospheric pressure ionisation mass
spectrometry. Journal of Chromatography A, 1136, 123-169.
Page 86
71
APPENDIX 1
AFLATOXINS MAXIMUM TOLERABLE LIMITS BY EU
Table 1.1: The current European Union legislative limits (FAO/WHO, 1990:1992; Otsuki
et al., 2001).
Aflatoxins µg/kg
Product type
B1
Total
aflatoxins
(B1+B2+G1+G2)
M1
Groundnuts, nuts, dried fruit, and
processed products thereof for direct
human consumption or as a food
ingredient
2 4
Groundnuts to be subjected to sorting
or other physical treatment, before
human consumption or as a food
ingredient
8
15
Nuts and dried fruit to be subjected to
sorting or other physical treatment,
before human consumption or as a
food ingredient
5 10
Cereals and processed products
thereof for direct human consumption
or as a food ingredient
2 4
Chilies, chili powder, cayenne pepper,
paprika, white and black pepper,
nutmeg, ginger, and turmeric
5 10
Milk (raw milk, milk for the
manufacture of milk-based products
and heat-treated milk)
0.05
Page 87
72
APPENDIX 2
FAO/WHO JOINT EXPERT COMMITTEE LIMITS ON AFLATOXINS
Table 2.1: Aflatoxin legislations set by the Joint FAO/WHO Expert Committee (FAO/WHO,
1990:1992; Otsuki et al., 2001).
Aflatoxin
Tolerance level
(µg/kg)
Food/feed
B1 0.5 Feed for dairy cattle
M1 0.05 Milk
B1+G1+B2+G2 15 Raw peanut for human
consumption
Page 88
73
APPENDIX 3
CHEMICAL AND PHYSICAL PROPERTIES OF AFLATOXINS
Table 3.1: Chemical and physical properties of aflatoxins (Asi et al., 2012).
AF
Formula
Molecular
weight
Melting point
(º C)
Optical
rotation
[α]D (CHCl3)
B1 C17 H12 O6 312 268-269 -558º
G1 C17 H12 O7 328 247-250 -556º
B2 C17 H14 O6 314 287-289 430º
G2 C17 H14 O7 330 230 454º
M1 C17 H12 O7 328 299 280º