Incidence, prevalence, and trends of general practitioner–recorded diagnosis of peanut allergy in England, 2001 to 2005 Daniel Kotz, PhD, a,b Colin R. Simpson, PhD, b and Aziz Sheikh, MD a,b Maastricht, The Netherlands, and Edinburgh, United Kingdom Background: Previous descriptions of the epidemiology of peanut allergy have mainly been derived from small cross- sectional studies. Objective: To interrogate a large national research database to provide estimates for the incidence, prevalence, and trends of general practitioner (GP)–recorded diagnosis of peanut allergy in the English population. Methods: Version 10 of the QRESEARCH database was used with data from 2,958,366 patients who were registered with 422 United Kingdom general practices in the years 2001 to 2005. The primary outcome was a recording of clinician-diagnosed peanut allergy. Results: The age-sex standardized incidence rate of peanut allergy in 2005 was 0.08 per 1000 person-years (95% CI, 0.07- 0.08), and the prevalence rate was 0.51 per 1000 patients (95% CI, 0.49-0.54). This translated into an estimated 4000 incident cases (95% CI, 3500-4600) and 25,700 prevalent cases (95% CI, 24,400-27,100) of GP-recorded diagnosis of peanut allergy in England in 2005. During the study period, the incidence rate of peanut allergy remained fairly stable, whereas the prevalence rate doubled. In those under 18 years of age, the crude lifetime prevalence rate was higher in males than females. A significant inverse relationship between prevalence and socioeconomic status was found. Conclusion: These data on GP-recorded diagnosis of peanut allergy from a large general practice database suggest a much lower prevalence in peanut allergy than has hitherto been found. This difference may in part be explained by underrecording of peanut allergy in general practice. Further research is needed to assess the true frequency of peanut allergy in the population and whether there has been a true increase in recent years. (J Allergy Clin Immunol 2011;127:623-30.) Key words: Peanut allergy, incidence, prevalence, time trend, primary care, demographic associations, consultation rate The peanut is a widely distributed nutritious aliment that is associated with food allergy in some individuals. About 34 million tons of peanuts were produced worldwide in 2009. 1 Pea- nuts contain many important nutrients (including vitamin E, nia- cin, folate, calcium, phosphorus, magnesium, zinc, and iron) and are a good source of protein. Unfortunately, peanuts are also the most common food-related cause of IgE-mediated allergic reac- tions. 2 Peanut allergy is also one of the most severe food allergies because it can cause life-threatening anaphylaxis and because only a minority of people who have allergic reactions to peanuts early in life will outgrow their allergy. 3 People who are allergic to peanuts can react to smaller doses of food than people with other food allergies. 2 For instance, an allergic reaction may be trig- gered by breathing the dust from peanuts or eating foods that have been processed with machines that have previously pro- cessed peanuts. The frequency of peanut allergy has been reported in several previous studies. 4-14 The estimated prevalence rates in children ranged from 0.4% to 1.9%, and some studies 6,9,11,13 found an in- creasing trend in prevalence, whereas others 4,12 did not. How- ever, most of these estimates have been based on data from cross-sectional surveys of samples from the population. These offer the opportunity for detailed assessments to identify those with peanut allergy correctly; however, the methods used for the recruitment of participants into these surveys (ie, priming of respondents toward research on food allergy) as well as non- response may have introduced selection bias, whereas the use of geographically limited sampling frames and the small sample sizes may have reduced the generalizability of findings for the total population. Another limitation of cross-sectional designs is that it is very difficult to estimate accurately the incidence rates of the disease. Mounting large-scale representative national birth cohort studies would overcome these limitations, but the costs and logistics of such endeavors are likely to prove prohibitive. We used a different methodology in an attempt to obtain insights into the epidemiology of peanut allergy in the English population by interrogating one of the largest anonymized aggregated health databases in the world (QRESEARCH). Some major advantages of this approach are the use of representative data of the English population, a longitudinal assessment of the disease, and large numbers of cases, which potentially allow a more precise calculation of population estimates. A limitation is that the data are routinely collected by primary clinicians for patient care and not primarily for research purposes. From a the Department of General Practice, CAPHRI School for Public Health and Primary Care, Maastricht University Medical Center; and b the Allergy and Respiratory Research Group, Centre for Population Health Sciences, University of Edinburgh. Supported by the NHS Health and Social Care Information Centre. D.K. is supported by a short-term research fellowship from the Dutch Asthma Foundation. C.R.S. is supported by a national postdoctoral fellowship from the Chief Scientist’s Office of the Scottish Government. Disclosure of potential conflict of interest: The authors have declared that they have no conflict of interest. Received for publication July 5, 2010; revised September 20, 2010; accepted for publi- cation November 5, 2010. Available online January 13, 2011. Reprint requests: Aziz Sheikh, MD, Allergy and Respiratory Research Group, Centre for Population Health Sciences, University of Edinburgh, Teviot Place, Edinburgh EH8 9AG. E-mail: [email protected]. 0091-6749/$36.00 Ó 2011 American Academy of Allergy, Asthma & Immunology doi:10.1016/j.jaci.2010.11.021 623
Transcript
Incidence, prevalence, and trends of generalpractitioner–recorded diagnosis of peanut allergy inEngland, 2001 to 2005
Daniel Kotz, PhD,a,b Colin R. Simpson, PhD,b and Aziz Sheikh, MDa,b Maastricht, The Netherlands, and Edinburgh,
United Kingdom
Background: Previous descriptions of the epidemiology ofpeanut allergy have mainly been derived from small cross-sectional studies.Objective: To interrogate a large national research database toprovide estimates for the incidence, prevalence, and trends ofgeneral practitioner (GP)–recorded diagnosis of peanut allergyin the English population.Methods: Version 10 of the QRESEARCH database was usedwith data from 2,958,366 patients who were registered with 422United Kingdom general practices in the years 2001 to 2005.The primary outcome was a recording of clinician-diagnosedpeanut allergy.Results: The age-sex standardized incidence rate of peanutallergy in 2005 was 0.08 per 1000 person-years (95% CI, 0.07-0.08), and the prevalence rate was 0.51 per 1000 patients (95%CI, 0.49-0.54). This translated into an estimated 4000 incidentcases (95% CI, 3500-4600) and 25,700 prevalent cases (95% CI,24,400-27,100) of GP-recorded diagnosis of peanut allergy inEngland in 2005. During the study period, the incidence rate ofpeanut allergy remained fairly stable, whereas the prevalencerate doubled. In those under 18 years of age, the crude lifetimeprevalence rate was higher in males than females. A significantinverse relationship between prevalence and socioeconomicstatus was found.Conclusion: These data on GP-recorded diagnosis of peanutallergy from a large general practice database suggest a muchlower prevalence in peanut allergy than has hitherto beenfound. This difference may in part be explained byunderrecording of peanut allergy in general practice. Furtherresearch is needed to assess the true frequency of peanutallergy in the population and whether there has been a trueincrease in recent years. (J Allergy Clin Immunol2011;127:623-30.)
From athe Department of General Practice, CAPHRI School for Public Health and
Primary Care,Maastricht UniversityMedical Center; and bthe Allergy and Respiratory
Research Group, Centre for Population Health Sciences, University of Edinburgh.
Supported by the NHSHealth and Social Care Information Centre. D.K. is supported by a
short-term research fellowship from the Dutch Asthma Foundation. C.R.S. is
supported by a national postdoctoral fellowship from the Chief Scientist’s Office of
the Scottish Government.
Disclosure of potential conflict of interest: The authors have declared that they have no
conflict of interest.
Received for publication July 5, 2010; revised September 20, 2010; accepted for publi-
cation November 5, 2010.
Available online January 13, 2011.
Reprint requests: Aziz Sheikh, MD, Allergy and Respiratory Research Group, Centre for
Population Health Sciences, University of Edinburgh, Teviot Place, Edinburgh EH8
� 2011 American Academy of Allergy, Asthma & Immunology
doi:10.1016/j.jaci.2010.11.021
Key words: Peanut allergy, incidence, prevalence, time trend,primary care, demographic associations, consultation rate
The peanut is a widely distributed nutritious aliment that isassociated with food allergy in some individuals. About 34million tons of peanuts were produced worldwide in 2009.1 Pea-nuts contain many important nutrients (including vitamin E, nia-cin, folate, calcium, phosphorus, magnesium, zinc, and iron) andare a good source of protein. Unfortunately, peanuts are also themost common food-related cause of IgE-mediated allergic reac-tions.2 Peanut allergy is also one of the most severe food allergiesbecause it can cause life-threatening anaphylaxis and becauseonly a minority of people who have allergic reactions to peanutsearly in life will outgrow their allergy.3 People who are allergic topeanuts can react to smaller doses of food than people with otherfood allergies.2 For instance, an allergic reaction may be trig-gered by breathing the dust from peanuts or eating foods thathave been processed with machines that have previously pro-cessed peanuts.The frequency of peanut allergy has been reported in several
previous studies.4-14 The estimated prevalence rates in childrenranged from 0.4% to 1.9%, and some studies6,9,11,13 found an in-creasing trend in prevalence, whereas others4,12 did not. How-ever, most of these estimates have been based on data fromcross-sectional surveys of samples from the population. Theseoffer the opportunity for detailed assessments to identify thosewith peanut allergy correctly; however, the methods used forthe recruitment of participants into these surveys (ie, primingof respondents toward research on food allergy) as well as non-response may have introduced selection bias, whereas the use ofgeographically limited sampling frames and the small samplesizes may have reduced the generalizability of findings for thetotal population. Another limitation of cross-sectional designsis that it is very difficult to estimate accurately the incidencerates of the disease. Mounting large-scale representative nationalbirth cohort studies would overcome these limitations, but thecosts and logistics of such endeavors are likely to proveprohibitive.We used a different methodology in an attempt to obtain
insights into the epidemiology of peanut allergy in the Englishpopulation by interrogating one of the largest anonymizedaggregated health databases in the world (QRESEARCH).Some major advantages of this approach are the use ofrepresentative data of the English population, a longitudinalassessment of the disease, and large numbers of cases, whichpotentially allow a more precise calculation of populationestimates. A limitation is that the data are routinely collected byprimary clinicians for patient care and not primarily for researchpurposes.
This study builds on our ongoing program of work to assessthe epidemiology of allergic diseases.15-21 The overall aimwas to describe the frequency of peanut allergy as seen inprimary care and the associated use of primary care servicesfor patients with a diagnostic label of peanut allergy. More spe-cifically, we wanted to obtain estimates of the incidence andprevalence of a general practitioner (GP)–recorded diagnosis ofpeanut allergy in England for the years 2001 to 2005. Further-more, we aimed to assess associations of theses rates with demo-graphic characteristics (age, sex, and level of socioeconomicdeprivation).
METHODSWe used version 10 of the QRESEARCH database for this analysis (http://
www.qresearch.org). The database has been developed by the University of
Nottingham in conjunction with Egton Medical Information Systems
(EMIS), the largest supplier of general (family) practice computer systems
in the United Kingdom (UK). The data quality has been examined and found
to be high (data quality reports are available from http://www.emis-online.
com).
General practices were included in the analysis if they had transmitted
complete data to the central QRESEARCH repository for thewhole of January
1, 1999, through December 31, 2005. Practices were required to have been
using EMIS for at least 2 years before the start of the study period to give the
practices sufficient time to become accustomed to using their computer system
for routinework. The analysis was based on a set of fixed practices to eliminate
the possibility that trends in rates across the 5-year study period could be a
result of the inclusion of different practices in each analysis year. Although
QRESEARCH does have practices in Wales, Scotland, and Northern Ireland,
this analysis was restricted to practices based in England. This yielded a total
of 422 practices and 2,958,366 patients.
Patients were included in each year of analysis if they were registered for
the whole of the analysis year in question. Thus, patients who might have had
incomplete data available for the analysis year (ie, temporary residents, newly
registered patients, and those who left or died during the year) were excluded
from the analysis.
Main outcomesWe considered patients to have peanut allergy if they had a computer-
recorded diagnosis of peanut allergy (Read code SN582) in their electronic
health record during the study period. Thus, our case definition of peanut
allergy was dependent on patients with peanut allergy presenting to primary
care and then being correctly diagnosed and recorded as such by their primary
care clinicians or the diagnosis being made in a specialist setting and this
diagnosis being communicated to primary care clinicians and recorded onto
their electronic health record systems.
The reported incidence refers to the number of new cases of peanut allergy
diagnosed in each study year, with the number of person-years as the
denominator term (calculated from the number of patients registered with
practices and their length of registration). The lifetime prevalence refers to the
number of people ever recorded with peanut allergy on at least 1 occasion in
the general practice records, with the number of registered patients as the
denominator term.
We determined the GP or nurse consultation rate per person per year for
patients with peanut allergy. The total number of consultations for patients
with peanut allergy, which included consultations in the surgery, by
telephone, at home, and at other locations (which accounted for 84%, 9%,
4%, and 3% of consultations, respectively, in the general population in
2005),22 was included in the numerator term, and the total number of patients
with peanut allergy was included in the denominator term. We compared this
rate with the overall consultation rate of the general population, with the total
number of consultations in the surgery, by telephone, at home, and at other
locations in the numerator term and all current registered patients in the de-
nominator term.
CovariatesThe patient’s age, sex, and level of deprivation were included as covariates
in our study. The level of deprivation was defined using the Townsend Index,
which is derived from the patient’s postcode and is calculated by combining 4
census variables: households without a car, overcrowded households, house-
holds not owner-occupied, and persons unemployed.23 The higher the number
on this index, the greater the measure of deprivation.
Statistical analysesIncidence and prevalence rates were standardized by using sex and 5-year
age bands. The estimated midyear population in England for each year was
used as the reference population (50.466 million in 2005).24 We calculated
95% CIs around these estimates. We also scaled up the results to give the
estimated number of patients with a recorded diagnosis of peanut allergy in
England in 2005. Where appropriate, x2 tests were used to test whether there
were statistical associations between categorical variables and to test whether
there was a trend across time.
RESULTS
Incidence of GP-recorded diagnosis of peanut
allergyIn 2005, the crude incidence rate of GP-recorded diagnosis
of peanut allergy was 0.07 per 1000 person-years (95% CI, 0.06-0.08). The median age of diagnosis was 8 years old, and thehighest incidence rates were found in boys 0 to 4 years old (0.64/1000; 95% CI, 0.45-0.84) and girls (0.38/1000; 95% CI, 0.22-0.53). Fig 1 shows differences in crude incidence rates betweenmales and females within various age bands. Across all ages,the crude incidence rate was higher in males (0.08/1000; 95%CI, 0.06-0.09) than females (0.07/1000; 95% CI, 0.05-0.08), butthis difference was not statistically significant (P5 .27). Further-more, the crude incidencewas higher in the most affluent group ofpatients (0.08/1000; 95% CI, 0.06-0.10) than in the least affluentgroup (0.06/1000; 95% CI, 0.04-0.08), but the overall associationbetween incidence and level of deprivation was only marginallystatistically significant (P 5 .06).The age-sex–standardized incidence rate of peanut allergy was
0.08 per 1000 person-years (95% CI, 0.07-0.08), which translatedinto an estimated 4000 people (95% CI, 3500-4600) with a newdiagnosis of peanut allergy in England in 2005. The age-sex–standardized incidence rates are presented stratified by age andlevel of deprivation in Table I.
Prevalence of GP-recorded diagnosis of peanut
allergyIn 2005, the crude lifetime prevalence rate of GP-recorded
diagnosis of peanut allergy was 0.49 per 1000 registered patients(95% CI, 0.46-0.51). Most patients presenting to primary carewith peanut allergy were under 20 years of age (1.59/1000; 95%CI, 1.49-1.68). The highest rates were found in boys 5 to 9 years
FIG 1. Crude incidence rate of GP-recorded diagnosis of peanut allergy in England in 2005, stratified by age
and sex.
TABLE I. Age-sex-standardized incidence of GP-recorded
diagnosis of peanut allergy in England in 2005, stratified by sex,
age, and level of deprivation
Stratum
Total
patients
(N)
Incident
cases
(N)
Standardized
rate per 1000
patient-years 95% CI
Sex
Female 1,485,738 98 0.07 0.06-0.09
Male 1,472,628 114 0.09 0.07-0.11
Age band (y)
0-4 125,020 64 0.51 0.39-0.64
5-9 173,923 55 0.32 0.23-0.40
10-14 187,861 37 0.20 0.13-0.26
15-19 181,864 19 0.10 0.06-0.15
20-24 167,994 8 0.05 0.01-0.08
25-29 181,230 12 0.07 0.03-0.10
301 1,940,474 17 0.01 0.00-0.01
Deprivation
(quintiles)
1st 648,634 50 0.09 0.07-0.12
2nd 580,431 53 0.11 0.08-0.14
3rd 552,702 44 0.09 0.07-0.12
4th 515,271 25 0.06 0.04-0.08
5th 567,835 33 0.06 0.04-0.08
Level of deprivation based on Townsend Index with 1st quintile representing the most
affluent group of patients. Crude rates are reported by age bands.
J ALLERGY CLIN IMMUNOL
VOLUME 127, NUMBER 3
KOTZ, SIMPSON, AND SHEIKH 625
old (2.51/1000; 95% CI, 2.18-2.84) and girls (2.07/1000; 95%CI,1.76-2.37; Fig 2). In the age group 0 to 19 years, the crude lifetimeprevalence rate was higher in males (1.77/1000; 95% CI, 1.63-1.91) than females (1.39/1000; 95% CI, 1.27-1.52; P < .001). Inthe age group 20 years and older, however, the crude lifetimeprevalence rate was lower in men (0.13/1000; 95% CI, 0.11-
0.15) than women (0.19/1000; 95% CI, 0.17-0.22; P < .001).We also found a significant inverse relationship between recordedpeanut allergy prevalence and socioeconomic status (P < .001),with the highest prevalence found in the most affluent group(0.65/1000; 95% CI, 0.58-0.71).The age-sex–standardized lifetime prevalence rate of GP-
recorded peanut allergy was 0.51 per 1000 registered patients(95% CI, 0.49-0.54), which translated into an estimated total of25,700 people (95%CI, 24,400-27,100) with a recorded diagnosisof peanut allergy in England in 2005. The age-sex–standardizedlifetime prevalence rates are presented stratified by age and levelof deprivation in Table II.
Trends in incidence and prevalence of GP-recorded
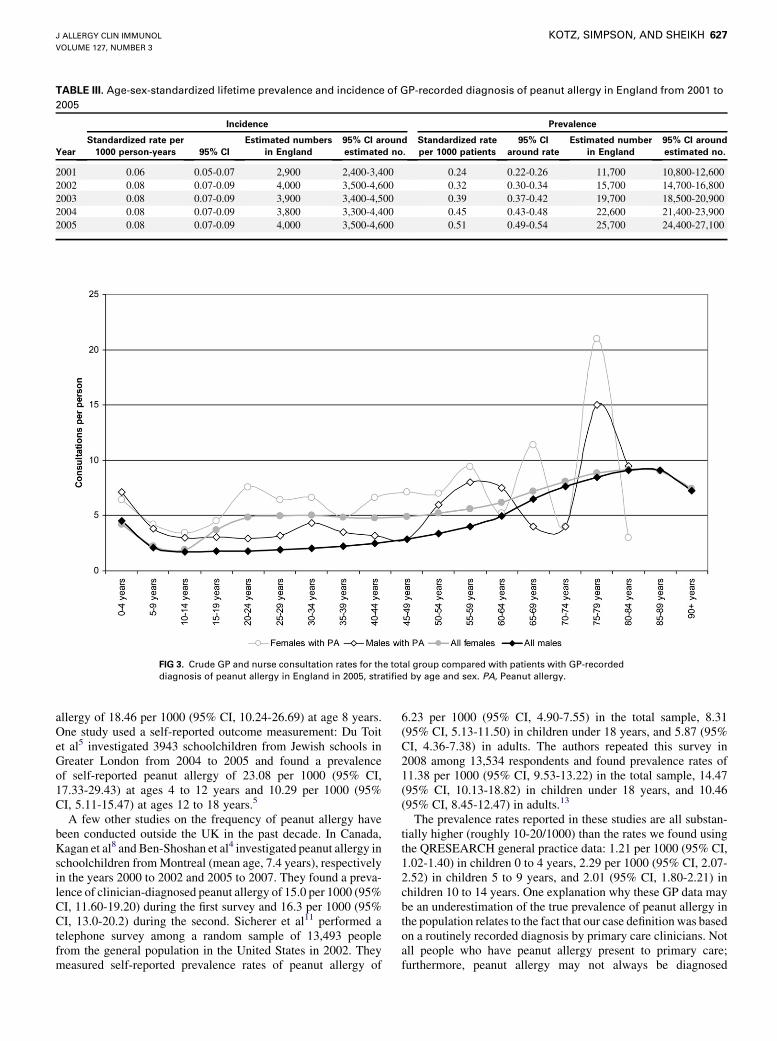
diagnosis of peanut allergy from 2001 to 2005Table III shows age-sex–standardized incidence rates, lifetime
prevalence rates, and corresponding estimated incident and prev-alent cases of recorded peanut allergy in England for each year inthe period of 2001 to 2005. There was little variation in incidencerates and estimated number of newly diagnosed cases of peanutallergy. The prevalence rates, however, roughly doubled from0.24 per 1000 patients in 2001 (95% CI, 0.22-0.26) to 0.51/1000 in 2005 (95% CI, 0.49-0.54). The increase was highest inthe age group 10 to 14 years and higher in males compared tofemales.
GP/nurse consultation rateFig 3 shows the overall crude GP and nurse consultations rates
compared with those for patients with a recorded diagnosis ofpeanut allergy in 2005. Consultation rates in patients with peanutallergy tended to be higher than the overall consultation rate.
FIG 2. Crude lifetime prevalence rate of GP-recorded diagnosis of peanut allergy in England in 2005,
stratified by age and sex.
TABLE II. Age-sex-standardized lifetime prevalence of GP-
recorded diagnosis of peanut allergy in England in 2005,
stratified by sex, age, and level of deprivation
Stratum
Total
patients
(N)
Prevalent
cases
(N)
Standardized
rate per
1000 patients 95% CI
Sex
Female 1,485,738 680 0.47 0.44-0.51
Male 1,472,628 758 0.55 0.52-0.60
Age band (y)
0-4 125,020 151 1.21 1.02-1.40
5-9 173,923 399 2.29 2.07-2.52
10-14 187,861 377 2.01 1.80-2.21
15-19 181,864 134 0.74 0.61-0.86
20-24 167,994 67 0.40 0.30-0.49
25-29 181,230 75 0.41 0.32-0.51
301 1,940,474 235 0.12 0.11-0.14
Deprivation
(quintiles)
1st 648,634 419 0.70 0.64-0.78
2nd 580,431 297 0.57 0.50-0.63
3rd 552,702 292 0.57 0.51-0.64
4th 515,271 179 0.36 0.31-0.42
5th 567,835 215 0.36 0.31-0.41
Level of deprivation based on Townsend Index with 1st quintile representing the most
affluent group of patients. Crude rates are reported by age bands.
J ALLERGY CLIN IMMUNOL
MARCH 2011
626 KOTZ, SIMPSON, AND SHEIKH
DISCUSSIONByusing data from theQRESEARCHgeneral practice database,
we estimated that in England in 2005, the age-sex–standardizedincidence rate of GP-recorded diagnosis of peanut allergywas 0.08per 1000 person-years, and lifetime prevalence was 0.51 per 1000registered patients. This translated into an estimated 4000 people
(ie, 11/d) newly recorded with a diagnosis of peanut allergy. Anestimated 25,700 peoplewere found to have a recorded diagnosis ofpeanut allergy in England. This was most prevalent in boys andgirls 5 to 9 years old (2.29/1000). Under the age of 20 years, wherethe majority of patients presented with peanut allergy, rates tendedto be higher in males than in females. Also, patients from the mostsocioeconomically affluent group had the highest prevalence ofrecorded peanut allergy. Over the study period, whereas theincidence remained fairly stable,weobserved a substantial increasein the lifetime prevalence rate of recorded peanut allergy.
This work in the context of previous research:
frequency of peanut allergySeveral studies have previously reported data on the frequency
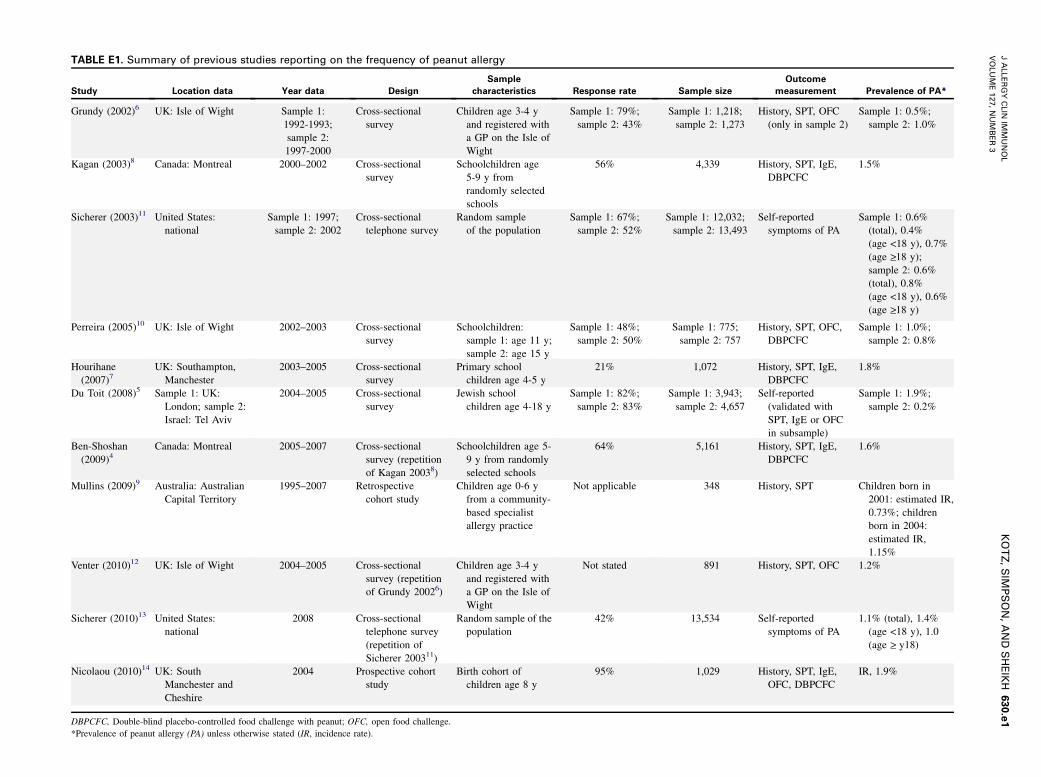
of peanut allergy in the UK (see this article’s Table E1 in the On-line Repository at www.jacionline.org). Among the studies usinga clinician-diagnosed outcome measurement, Grundy et al6 in-vestigated 1218 children age 3 to 4 years and registered with aGP on the Isle of Wight in 1994 and 1273 children in 2000and reported prevalence rates of peanut allergy of 4.93 per1000 children (95% CI, 0.99-8.86) and 10.21 per 1000 (95%CI, 4.69-15.74), respectively. In 2005, Venter et al12 repeatedthis study in 891 children and found a prevalence rate of 12.35per 1000 (95% CI, 5.10-19.60). In the years 2002 to 2003, Pereiraet al10 investigated 1532 schoolchildren on the Isle of Wight andreported a prevalence rate of 10.32 per 1000 (95% CI, 3.21-17.44) in 11-year-olds and 7.93 per 1000 (95% CI, 1.61-14.24)in 15-year-olds. Hourihane et al7 recruited 1072 children throughprimary schools in Southampton and Manchester in the years2003 to 2005 and reported a prevalence rate of 18.66 per 1000(95% CI, 10.56-26.76) at age 4 to 5 years.7 In the most recentstudy, Nicolaou et al14 reported an incidence rate of peanut
FIG 3. Crude GP and nurse consultation rates for the total group compared with patients with GP-recorded
diagnosis of peanut allergy in England in 2005, stratified by age and sex. PA, Peanut allergy.
J ALLERGY CLIN IMMUNOL
VOLUME 127, NUMBER 3
KOTZ, SIMPSON, AND SHEIKH 627
allergy of 18.46 per 1000 (95% CI, 10.24-26.69) at age 8 years.One study used a self-reported outcome measurement: Du Toitet al5 investigated 3943 schoolchildren from Jewish schools inGreater London from 2004 to 2005 and found a prevalenceof self-reported peanut allergy of 23.08 per 1000 (95% CI,17.33-29.43) at ages 4 to 12 years and 10.29 per 1000 (95%CI, 5.11-15.47) at ages 12 to 18 years.5
A few other studies on the frequency of peanut allergy havebeen conducted outside the UK in the past decade. In Canada,Kagan et al8 and Ben-Shoshan et al4 investigated peanut allergy inschoolchildren fromMontreal (mean age, 7.4 years), respectivelyin the years 2000 to 2002 and 2005 to 2007. They found a preva-lence of clinician-diagnosed peanut allergy of 15.0 per 1000 (95%CI, 11.60-19.20) during the first survey and 16.3 per 1000 (95%CI, 13.0-20.2) during the second. Sicherer et al11 performed atelephone survey among a random sample of 13,493 peoplefrom the general population in the United States in 2002. Theymeasured self-reported prevalence rates of peanut allergy of
6.23 per 1000 (95% CI, 4.90-7.55) in the total sample, 8.31(95% CI, 5.13-11.50) in children under 18 years, and 5.87 (95%CI, 4.36-7.38) in adults. The authors repeated this survey in2008 among 13,534 respondents and found prevalence rates of11.38 per 1000 (95% CI, 9.53-13.22) in the total sample, 14.47(95% CI, 10.13-18.82) in children under 18 years, and 10.46(95% CI, 8.45-12.47) in adults.13
The prevalence rates reported in these studies are all substan-tially higher (roughly 10-20/1000) than the rates we found usingthe QRESEARCH general practice data: 1.21 per 1000 (95% CI,1.02-1.40) in children 0 to 4 years, 2.29 per 1000 (95% CI, 2.07-2.52) in children 5 to 9 years, and 2.01 (95% CI, 1.80-2.21) inchildren 10 to 14 years. One explanation why these GP data maybe an underestimation of the true prevalence of peanut allergy inthe population relates to the fact that our case definition was basedon a routinely recorded diagnosis by primary care clinicians. Notall people who have peanut allergy present to primary care;furthermore, peanut allergy may not always be diagnosed
J ALLERGY CLIN IMMUNOL
MARCH 2011
628 KOTZ, SIMPSON, AND SHEIKH
correctly, and a diagnosed case of peanut allergy may not alwaysbe recorded in a correct and uniform way. For example, althoughmost patients with peanut allergy assessed by specialist allergyclinics or discharged back into the community by secondary careservices will be managed by primary care–based physicians, notevery GP may record a patient who has been diagnosed by aspecialist as having peanut allergy. Furthermore, physicians mayapply differing thresholds before recording a diagnosis in thepatient’s record, and it is therefore possible that the parent Readcode ‘‘food allergy’’ (SN58.) is used. Once data become available,future work should also include an assessment of confirmedspecialist diagnosis in the GP records.Whereas our methodology probably led to an underestimation,
the methodology used in previous studies may have resulted in anoverestimation of the true prevalence of peanut allergy in thepopulation. Surveys performed in specific subgroups of thepopulation limit the generalizability of findings to the wholepopulation. Furthermore, when information letters for the re-cruitment of participants include information on the goal of thestudy (assessment of allergy), selection bias may occur becausepeople at high risk of allergy are more likely to respond.Differences in prevalence rates are also related to differences insample size. Because of the relatively small sample size in theprevious studies (about 1000-3000 subjects), there is substantiallygreater statistical uncertainty about the reported prevalenceestimate, resulting in wider CIs around the estimate. The lowerCIs reported (2-5/1000) are quite close to our estimate. Takingthese methodologic considerations together, we tend to assumethat the true estimate of peanut allergy in the population is likelyto lie somewhere between the estimates provided in this andprevious studies.
This work in the context of previous research:
associations with demographic factorsData from our study suggest that peanut allergy may be more
common in males in the age group under 20 years and in womenin the age group over 20 years. The only other UK study thatpresented prevalence rates stratified by sex was published by DuToit et al,5 showing no differences between males and females.5
In the Canadian studies by Kagan et al8 and Ben-Shoshanet al,4 however, the percentage male schoolchildren was higherin the group that was allergic to peanuts than in the group thanwas not allergic to peanuts: 59.4% versus 48.6% (P 5 .086)from 2000 to 2002, and 63.0% versus 49.2% from 2005 to 2007(P 5 .01). Similar to our study, the US study by Sicherer et al11
reported a significantly higher prevalence rate of peanut allergyin boys under 18 years of age (0.98% vs 0.20% in girls; P 5.02), but a lower rate in men over 18 (0.28% vs 0.44% in women;P <.001). Such differencesmay be a result of sex-specific changesin illness perception and health behavior but also different diseasemechanisms including the role of sex steroids, as has beensuggested with regard to the presentation of asthma.25
Our data also suggests that peanut allergy may be morecommon in people with higher socioeconomic backgrounds.This finding is unlikely to be explained simply by primary careclinicians recording more details or more diagnoses in this groupof patients overall, because the recording of other diseases in thisdatabase is more common in patients with lower socioeconomicbackgrounds (including, for example, asthma20 and chronic ob-structive pulmonary disease26). We are not aware of any other
study analyzing associations between socioeconomic status andthe frequency of peanut allergy. However, higher socioeconomicstatus seems to be linked to an increased risk of anaphylaxis ingeneral.27 Furthermore, a meta-analysis found that children infamilies with higher educational level had an increased risk offood allergy.28 That meta-analysis did not find an associationwith household income, but an increase in the number of childrenin the household decreased the risk of food allergy.
This work in the context of previous research: time
trendsDuring the 5-year period of our study, the incidence rate of GP-
recorded diagnosis of peanut allergy remained the same, whereasthe prevalence rate roughly doubled from 0.24 per 1000 patientsin 2001 to 0.51 in 2005. There may be multiple reasons for thisincrease in prevalence. Improved patient and clinician awarenessof food allergy could have resulted in an increased use of primarycare health services for those with previously diagnosed peanutallergy. However, because this increase mainly occurred in malesand children approaching their teenage years, it could alsoindicate a trend of fewer children outgrowing their peanut allergy.Several other studies that used repeated cross-sectional surveysreported an increase in prevalence across the years of observation.In the UK, Grundy et al6 reported a 2-fold increase in prevalenceduring a 6-year interval (0.5% in 1994; 1.0% in 2000). There was,however, no further increase 2 years later (1.2% in 2005).12 In theUnited States, Sicherer et al observed a 2-fold increase of self-reported peanut allergy in children during a 5-year interval,from 0.4% in 1997 to 0.8% in 2002,11 and a further increase to1.4% in 2008.13 Aggregated data from 2 US national surveysshowed that other types of food allergy also increased from1997 to 2007 in children under 18 years.29 Mullins et al9 per-formed a retrospective study among patients diagnosed with pea-nut allergy at a community-based specialist allergy practice in theAustralian Capital Territory. The estimated incidence of peanutallergy by age 6 years rose from 0.73% for those born in 2001to 1.15% for those born in 2004, and the number of newly diag-nosed patients with peanut allergy increased more than 10-foldfrom 1995 to 2007.Not all studies reported an increase in the frequency of peanut
allergy, however. In Canada, Ben-Shoshan et al4 measured stableprevalence rates of peanut allergy in the 5-year period between2000 to 2002 and 2005 to 2007. A recent review concluded thatit is unclear whether food allergies in general are increasingbecause of a lack of uniformity for diagnostic criteria.30
This work in the context of previous research:
consultation ratesWe found indications that primary care physician and nurse
consultation rates were higher in patients with peanut allergy thanin patients from the general primary care population. Under theage of 40 years, female and male patients with a recordeddiagnosis of peanut allergy consulted their GP or nurse on averageabout 1.5 times more often per year. To the best of our knowledge,no other studies have reported and compared consultations ratesspecifically for patients with peanut allergy. However, differentstudies using the QRESEARCH database found that consultationrates for patients with eczema19 and patients with multiple aller-gic disorders18 were also higher thanmean consultation rates. The
J ALLERGY CLIN IMMUNOL
VOLUME 127, NUMBER 3
KOTZ, SIMPSON, AND SHEIKH 629
reason for higher GP or nurse consultations for patients with pea-nut allergy compared with the general population is unclear. It ispossible that the symptoms and consequences of this disease andthe probable presence of other allergy-related comorbidities mayrequire greater involvement in the day-to-day treatment ofpatients by primary care.
General strengths and limitations of this workThemajor strength of the current study is that it is based on data
from one of the largest anonymized aggregated health databasesin the world. The large number of patients in this database offersthe potential for a more reliable estimation of frequency measuresthan previous studies that involved small samples. This resulted inmuch smaller CIs around the estimates in the current study.Furthermore, the practices included in the database are broadlyrepresentative of practices in England in terms of the age-sexstructure of the death rates, birth rates, and prevalence of otherchronic diseases. This suggests the findings are likely to be highlygeneralizable to England.The major limitation of this work is that our analyses are based
on diagnoses entered in the GP clinical computer system by ahealth care professional. This methodology may underestimatethe true frequency of disease because not every patient with adiagnosis of peanut allergy will also have a physician-assesseddiagnosis of peanut allergy. Furthermore, we cannot be certainabout the validity of the diagnosis of peanut allergy because thegold standard for assessment is a double-blind placebo-controlledfood challenge. Although the high rate of primary care encountersfound will have provided greater opportunities for primary careclinicians to ascertain peanut allergy in these patients, it was notpossible from this analysis of routinely collected data fromgeneral practices to distinguish reliably between a true increase ina disease measure, better screening, and better ascertainment orimproved recording of disease on the clinical computer system.The system that was used for the coding of the diagnosis peanut
allergy was the Read Clinical Classification system. An advan-tage of this system is that it was produced for clinicians in primarycare and is used by the majority of primary care electronic patientrecord systems. A disadvantage of this system is the limitednumber of food allergy concepts available.31 It is therefore possi-ble that a great wealth of information on a patient’s allergy statusis entered as free text.We conclude that the prevalence of a GP recorded diagnosis of
peanut allergy is much lower than previous estimates from cross-sectional surveys of samples from the population. Nevertheless,more than 25,000 people in England have peanut allergy andshow increased primary health care use. More research is nowneeded to assess whether there has been a true increase in theprevalence of the disease in recent years and which factors mightbe associated with such a trend. Such research would benefit fromconsistency in the collection, analysis, and reporting of data,clearly distinguishing between estimates of peanut allergy de-rived from self-reports, self-reports of clinician diagnosis, clini-cian diagnosis, clinician-recorded diagnosis, and oral foodchallenge or its variants (Table E1).
We thank the contributing EMIS practices and patients and EMIS for
providing technical expertise in creating and maintaining QRESEARCH. We
thank QRESEARCH staff (Julia Hippisley-Cox, Govind Jumbu, Alex Porter,
Mike Heaps, and RichardHolland) for their contribution to data extraction and
presentation. These findings have been reported in a report to the funders,
‘‘Primary care epidemiology of allergic disorders: analysis using QRE-
SEARCH database 2001–2006.’’
Key messages
d The prevalence of a GP-recorded diagnosis of peanut al-lergy is considerably lower than the 0.4% to 1.9% esti-mates derived from cross-sectional surveys.
d The prevalence of GP-recorded diagnosis of peanut al-lergy is more common in boys than in girls and in moreaffluent than in more deprived people.
REFERENCES
1. US Department of Agriculture. Foreign Agricultural Service’s production, supply
and distribution online database: table 13: peanut area, yield, and production.
Available at: http://www.fas.usda.gov/psdonline. Accessed June 7, 2010.
2. Boulay A, Houghton J, Gancheva V, Sterk Y, Strada A, Schlegel-Zawadzka M,
et al. A EuroPrevall review of factors affecting incidence of peanut allergy: prior-
ities for research and policy. Allergy 2008;63:797-809.
3. Skolnick HS, Conover-WalkerMK, Koerner CB, Sampson HA, BurksW,Wood RA,
et al. The natural history of peanut allergy. JAllergyClin Immunol 2001;107:367-74.
4. Ben-Shoshan M, Kagan RS, Alizadehfar R, Joseph L, Turnbull E, St Pierre Y, et al.
Is the prevalence of peanut allergy increasing? a 5-year follow-up study in children
in Montreal. J Allergy Clin Immunol 2009;123:783-8.
5. Du Toit G, Katz Y, Sasieni P, Mesher D, Maleki SJ, Fisher HR, et al. Early con-
sumption of peanuts in infancy is associated with a low prevalence of peanut al-
lergy. J Allergy Clin Immunol 2008;122:984-91.
6. Grundy J, Matthews S, Bateman B, Dean T, Arshad SH. Rising prevalence of al-
lergy to peanut in children: data from 2 sequential cohorts. J Allergy Clin Immunol