Inclusive Growth Dynamics and Determinants in Emerging Markets * Shanaka Jay Peiris IMF Resident Representative to the Philippines ThFederation of ASEAN Economics Association Conference, Manila * Based on IMF’s Regional Economic Outlook for Asia and Pacific (October 2011), IMF country report 2012 and forthcoming IMF Working Paper by Anand, Mishra and Peiris. The views expressed are those of the authors and do not necessarily reflect those of the IMF.
Transcript
Inclusive Growth Dynamics and Determinants in Emerging Markets*
Shanaka Jay PeirisIMF Resident Representative to the Philippines
ThFederation of ASEAN Economics Association Conference, Manila
* Based on IMF’s Regional Economic Outlook for Asia and Pacific (October 2011), IMF country report 2012 and forthcoming IMF Working Paper by Anand, Mishra and Peiris. The views expressed are those of the authors and do not necessarily reflect those of the IMF.
2
STYLIZED FACTS EMS AND ASIA’S
EXPERIENCE OVER THE LAST TWO
DECADES
3
In the last two decades, Asia has grown rapidly, enabling significant reductions in poverty…
0
2
4
6
8
Developing Asia
NIEs ASEAN-5 Middle East and North
Africa
Sub-Saharan Africa
Latin America and the
Caribbean
Central and Eastern Europe
Source: IMF WEO database.
Emerging Markets: Real GDP Growth (annual percent change, 1990-2010)
Sri Lanka (2007, 7.00/29.1)Malaysia (2009, 0.00/2.30)
Mongolia (2005, 22.4/49.1)
$2/day
$1.25/day
Sources: World Bank; and IMF staff calculations.1 At 2005 PPP prices. In parentheses, the latest available year and corresponding
poverty headcount ratios at $1.25 and $2 per day, respectively.
Asia: Change in Poverty Headcount, Last Two Decades1
(in percentage points since 1990)
4
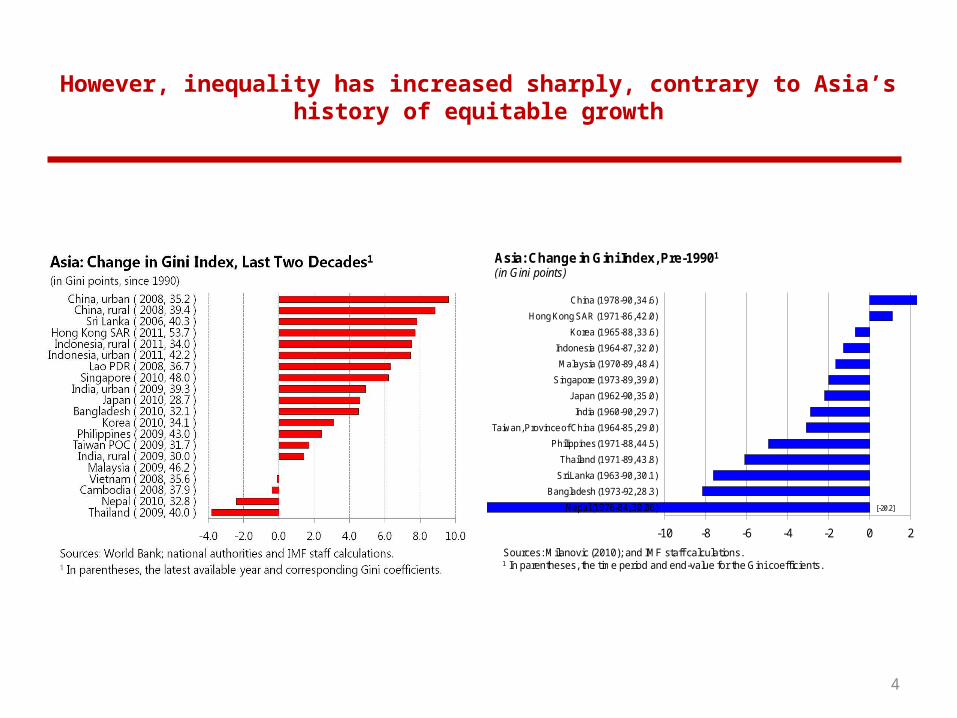
However, inequality has increased sharply, contrary to Asia’s history of equitable growth
-10 -8 -6 -4 -2 0 2
Nepal (1976-84, 30.06)
Bangladesh (1973-92, 28.3)
Sri Lanka (1963-90, 30.1)
Thailand (1971-89, 43.8)
Philippines (1971-88, 44.5)
Taiwan, Province of China (1964-85, 29.0)
India (1960-90, 29.7)
Japan (1962-90, 35.0)
Singapore (1973-89, 39.0)
Malaysia (1970-89, 48.4)
Indonesia (1964-87, 32.0)
Korea (1965-88, 33.6)
Hong Kong SAR (1971-86, 42.0)
China (1978-90, 34.6)
Sources: Milanovic (2010); and IMF staff calculations.1 In parentheses, the time period and end-value for the Gini coefficients.
Asia: Change in Gini Index, Pre-19901
(in Gini points)
[-20.2]
5
Inequality has risen more sharply in Asia than elsewhere and is now approaching global highs
-4.0 -2.0 0.0 2.0 4.0 6.0 8.0 10.0 12.0
Central and Eastern Europe
Latin America and the Caribbean
Middle East and North Africa
Sub-Saharan Africa
ASEAN-5
NIEs
Advanced Asia
South Asia
East Asia
Population-weighted average
Simple Average
Sources: CEIC Data Company Ltd.; World Bank, PovcalNet database; WIDER income inequality database; Milanovic (2010); national authorities and IMF staff calculations.
Emerging Economies: Change in Gini Index1
(in Gini points)
20
25
30
35
40
45
50
55
Advanced Asia South Asia Middle East and North
Africa
NIEs ASEAN-5 Central and Eastern Europe
East Asia Sub-Saharan Africa
Latin America and the
Caribbean
Sources: CEIC Data Company Ltd.; World Bank, PovcalNet database; WIDER income inequality database; Milanovic (2010); national authorities and IMF staff calculations.
Latest Gini Index1
(population-weighted, in Gini points)
6
HOW PRO-POOR IS ASIA’S GROWTH?
7
Empirical Strategy: Data
• Growth is pro-poor if it reduces poverty (Ravallion and Chen, 2003)
• Data Sources: World Bank Povcal database, household surveys for NIEs, and Penn World tables.
• Sample: Unbalanced panel of 105 developing and emerging economies, covering 1971-2010.
8
Empirical Strategy: Model
• Estimate following regression:
P is poverty headcount below the $2 line in country i at time t,
y is real per capita income in country i at time t
GINI is the Gini coefficient in country i at time t, and γ and ρ are country and decade dummies
• Equation in logs, so β and δ are elasticity of poverty reduction
with respect to growth and inequality, respectively.
𝑙𝑛𝑃𝑖,𝑡 = 𝛾𝑖 +𝛽𝑖,𝑑𝑙𝑛𝑦𝑖,𝑡 +𝛿𝑖,𝑡𝑙𝑛𝐺𝐼𝑁𝐼𝑖,𝑡 +𝜌𝑑 +𝜀𝑖,𝑡
9
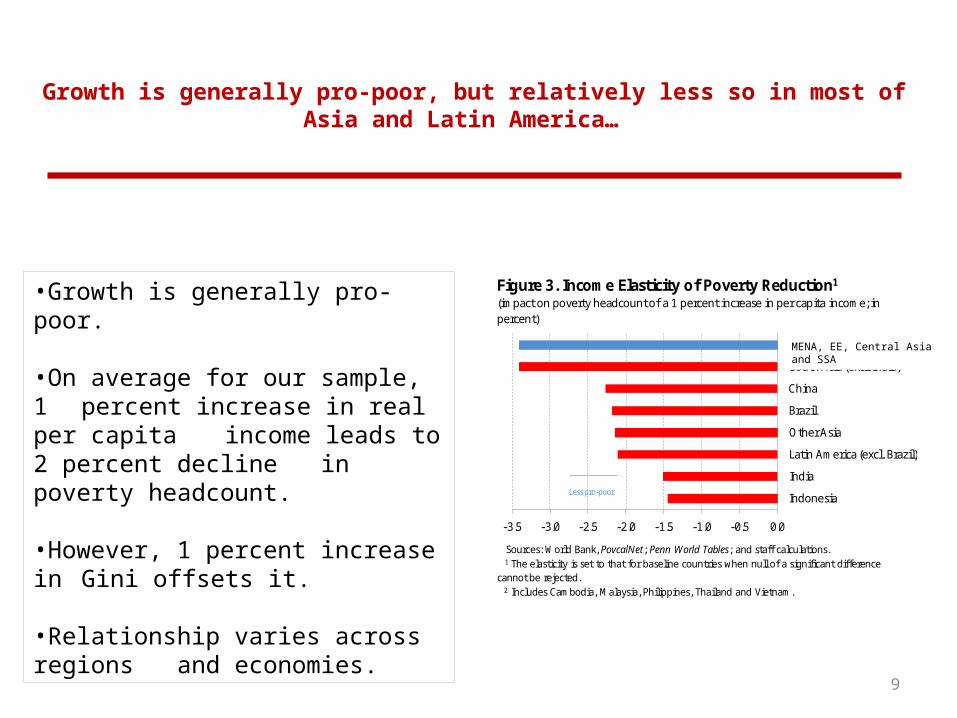
Growth is generally pro-poor, but relatively less so in most of Asia and Latin America…
-3.5 -3.0 -2.5 -2.0 -1.5 -1.0 -0.5 0.0
Indonesia
India
Latin America (excl. Brazil)
Other Asia
Brazil
China
South Asia (excl. India)
Baseline
Figure 3. Income Elasticity of Poverty Reduction1
(impact on poverty headcount of a 1 percent increase in per capita income; in percent)
Sources: World Bank, PovcalNet; Penn World Tables; and staff calculations.1 The elasticity is set to that for baseline countries when null of a significant difference
cannot be rejected.2 Includes Cambodia, Malaysia, Philippines, Thailand and Vietnam.
Less pro-poor
•Growth is generally pro-poor.
•On average for our sample, 1 percent increase in real per capita
income leads to 2 percent decline in poverty headcount.
•However, 1 percent increase in Gini offsets it.
•Relationship varies across regions and economies.
MENA, EE, Central Asia and SSA
10
HOW INCLUSIVE IS ASIA’S GROWTH?
11
Inclusive growth is both pace and distribution
Cumulative share of population, 0≤ i ≤1
i = 100 (when the entire population is covered)
Income per capita (y)
𝑦ത A
B
A1
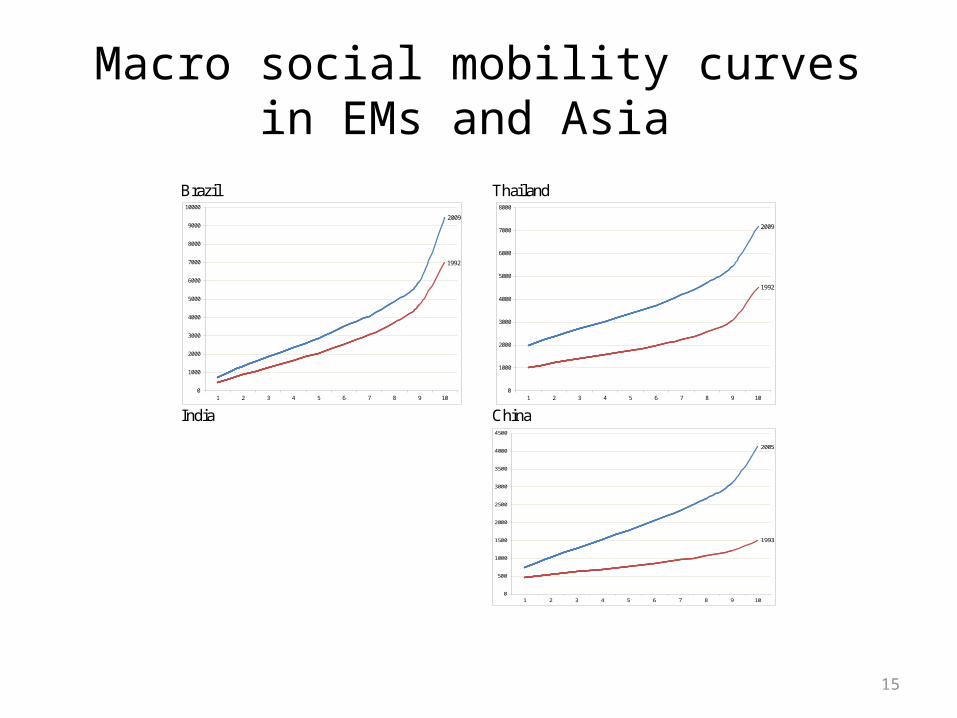
•Curve AB is a macro social mobility curve. This is, in fact, a generalized concentration curve when the individuals are arranged in ascending order of their incomes. • Growth will be inclusive if it shifts the social mobility curve upward at all points.•The two social mobility curves with the same average income (Ybar) but different degrees of inclusiveness. Social mobility curve (A1B) is more inclusive than the social mobility curve AB, as the average income of the bottom segment of the society is higher.
12
Measure of inclusivenessCalculate an index from the area under the curve as in Ali and Son 2007:
The greater the Ystar the greater will be the income available to the population. If everyone in the population has exactly the same income, then will be equal to Ybar.
Thus, we propose a macro income equity index (IEI) as in Ali and Son 2007:
Higher the value of omega (closer to one), the higher is the income equity.
To achieve inclusive growth, we need to increase Ystar, which can be accomplished by increasing the average level of income or increasing the equity index or both.
13
Only a few countries have achieved high YSTAR
14
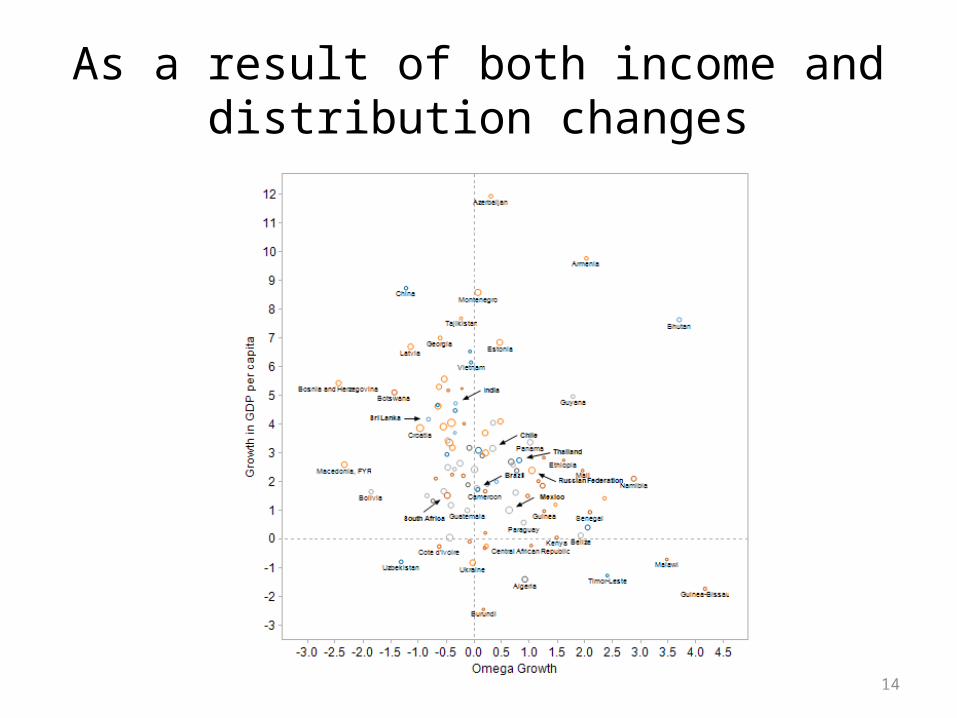
As a result of both income and distribution changes
15
Macro social mobility curves in EMs and Asia
Brazil Thailand
India China
1992
2009
0
1000
2000
3000
4000
5000
6000
7000
8000
9000
10000
1 2 3 4 5 6 7 8 9 10
2009
1992
0
1000
2000
3000
4000
5000
6000
7000
8000
1 2 3 4 5 6 7 8 9 10
2005
1994
0
500
1000
1500
2000
2500
1 2 3 4 5 6 7 8 9 10
2005
1993
0
500
1000
1500
2000
2500
3000
3500
4000
4500
1 2 3 4 5 6 7 8 9 10
16
WHAT EXPLAINS INCLUSIVE GROWTH?
17
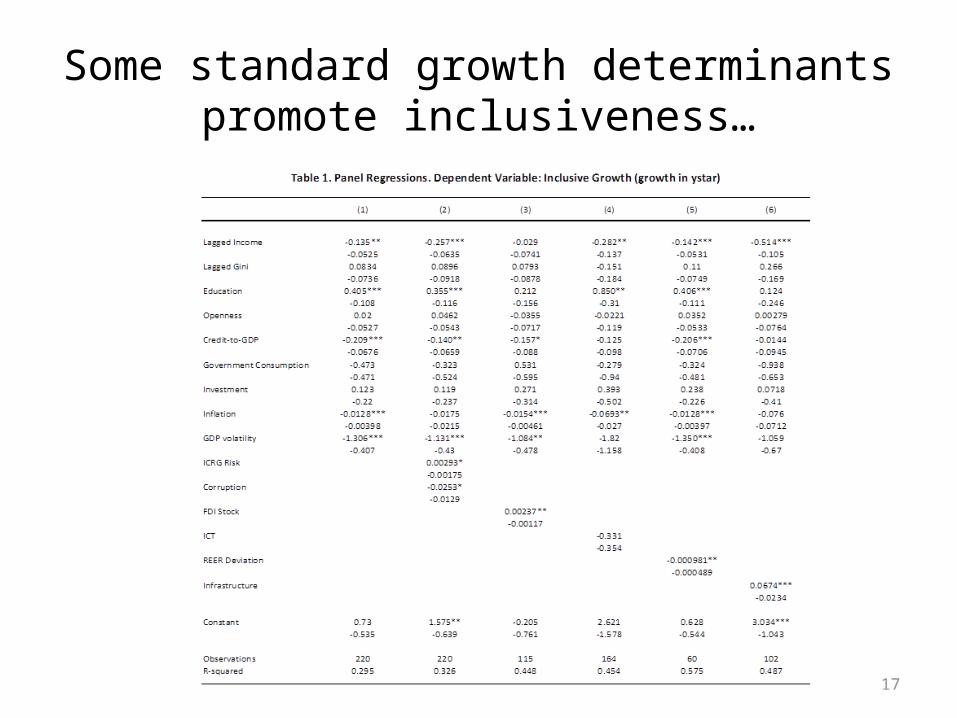
Some standard growth determinants promote inclusiveness…
18
1. Tax and transfer policies are less equitable in Asia, with lower (and more regressive) tax takes and lower (and less targeted) social spending…
19
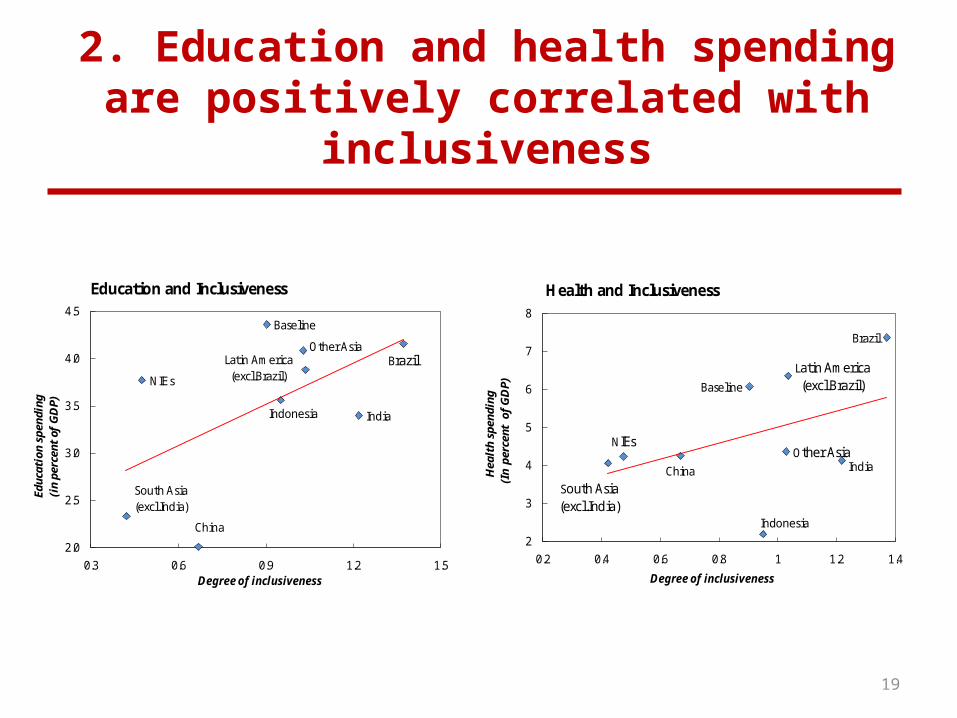
2. Education and health spending are positively correlated with inclusiveness
Other Asia
China
Indonesia
NIEs
South Asia (excl.India)
India
Latin America (excl.Brazil)
Brazil
Baseline
2.0
2.5
3.0
3.5
4.0
4.5
0.3 0.6 0.9 1.2 1.5
Educ
atio
n sp
endi
ng
(in
perc
ent of
GD
P)
Degreeof inclusiveness
Education and Inclusiveness
Other AsiaChina
Indonesia
NIEs
South Asia(excl.India)
India
Latin America (excl.Brazil)
Brazil
Baseline
2
3
4
5
6
7
8
0.2 0.4 0.6 0.8 1 1.2 1.4
Hea
lth
spen
ding
(In
perc
ent
of G
DP)
Degreeof inclusiveness
Health and Inclusiveness
20
3. Inclusiveness is positively associated with degree of employment protection and minimum wage levels
Other Asia
China Indonesia
NIEs
South Asia(excl. India) India
Latin America (excl.Brazil)
Brazil
Baseline
0.1
0.2
0.3
0.4
0.5
0.3 0.6 0.9 1.2 1.5Degree of inclusiveness
Min
imum
wag
e/ a
vera
geva
lue
adde
d
Minimum Wage and Inclusiveness
2
Other AsiaChina
Indonesia
NIEs
South Asia (excl.India)
IndiaLatin America (excl. Brazil)
BrazilBaseline
0.2
0.3
0.4
0.5
0.6
0.7
0.8
0.3 0.6 0.9 1.2 1.5
Empl
oym
ent
law
s in
dex
2
Degreeof inclusiveness
Employment Laws and Inclusiveness
3
21
5. Narrow access to financial services hurts the poor disproportionately
22
Conclusions• Macroeconomic stability, human capital and competitiveness are
found to be key determinants of inclusive growth in emerging markets. • The standard growth drivers such as education, initial income and
institutions are also important while technological change and trade globalization has a less discernible impact.
• In terms of financial globalization, foreign direct investment (FDI) fosters inclusive growth but financial depth has a negative impact, as in IMF (2007), highlighting need for financial inclusion. A striking feature is that the distribution of income (both inequality and poverty) does not appear to matter when controlling for economic fundamentals, while inflation and GDP volatility are unambiguously detrimental for inclusive growth.
• Competitiveness, measured by deviations REER deviations from PPP, and infrastructure are also important for inclusive growth