1 INCLUSIVE GROWTH POLICY NOTE 4 Planning for Uganda‘s Urbanization 1 1. Introduction 1. Uganda has started its journey into urbanization and economic development. The pace of urbanization is picking up – currently at 4.5% per year, and likely to accelerate with rising incomes. The economic benefits from urban growth will come from exploiting economies of scale and agglomeration and by increasing fluidity in factor markets that enable substitution between land and non land inputs. Uganda‘s urban transformation is occurring in a period of particular flux – a changing climate is likely to adversely influence rainfed agriculture, which will have bearing on the prospects of small towns that serve as interlocutors with the rural economy. At the other end, closer economic integration in East Africa will increase the reach of the country‘s largest metropolis, but place it in direct competition with other metropolises in the region. As prices of tradables converge in an open economy, considerable thought and effort will be needed to reduce the prices of non tradable services that can help maintain economic competitiveness. Policymakers – both at the national and local levels – need to see themselves as change managers who encourage flexibility in how Uganda‘s towns and cities respond to emerging needs of business and households. Planning ahead is important, but not locking settlements into today‘s market needs becomes even more important. 2. What are policy priorities to harness economic and social aims from urbanization? This policy note is organized in three sections to answer this question. The first section provides stylized facts on the pace, form and efficiency of Uganda‘s urban transformation. Section 2 identifies how land policies, urban planning and transport constraints, and housing shortages are choking urbanization and the economy. Section 3 lays out a framework for prioritizing and sequencing urbanization policies. A statistical annex is also provided at the end. 2. Urbanization and the Economy 2.1 Pace and magnitude of urbanization 3. Rapid urbanization is one of the most striking features of economic development. Developing countries are urbanizing at rates similar to what developed countries experienced about a century ago. On average, today‘s developed countries increased their urban shares by 7.7 percentage points between 1880 and 1900; today‘s developing countries have seen urban share increases of 8 percentage points between 1985 and 2005. 2 Similarly, urbanization is taking off in Uganda where urbanization is estimated at around 13 percent and urban growth rates are around 4.5% per year and 1 This note has been prepared by Somik Lall drawing on inputs from the Inclusive growth team including Martin Onyach-Olaa(AFTUW), Frank Byamugisha(AFTAR), and Clarence Tsimponkenge (AFTP2). 2 World Development Report (2009), Reshaping Economic Geography. Public Disclosure Authorized Public Disclosure Authorized Public Disclosure Authorized Public Disclosure Authorized Public Disclosure Authorized Public Disclosure Authorized Public Disclosure Authorized Public Disclosure Authorized
Transcript
1
INCLUSIVE GROWTH POLICY NOTE 4
Planning for Uganda‘s Urbanization1
1. Introduction
1. Uganda has started its journey into urbanization and economic development. The pace of
urbanization is picking up – currently at 4.5% per year, and likely to accelerate with rising incomes. The
economic benefits from urban growth will come from exploiting economies of scale and agglomeration
and by increasing fluidity in factor markets that enable substitution between land and non land inputs.
Uganda‘s urban transformation is occurring in a period of particular flux – a changing climate is likely to
adversely influence rainfed agriculture, which will have bearing on the prospects of small towns that
serve as interlocutors with the rural economy. At the other end, closer economic integration in East Africa
will increase the reach of the country‘s largest metropolis, but place it in direct competition with other
metropolises in the region. As prices of tradables converge in an open economy, considerable thought and
effort will be needed to reduce the prices of non tradable services that can help maintain economic
competitiveness. Policymakers – both at the national and local levels – need to see themselves as change
managers who encourage flexibility in how Uganda‘s towns and cities respond to emerging needs of
business and households. Planning ahead is important, but not locking settlements into today‘s market
needs becomes even more important.
2. What are policy priorities to harness economic and social aims from urbanization? This policy
note is organized in three sections to answer this question. The first section provides stylized facts on the
pace, form and efficiency of Uganda‘s urban transformation. Section 2 identifies how land policies, urban
planning and transport constraints, and housing shortages are choking urbanization and the economy.
Section 3 lays out a framework for prioritizing and sequencing urbanization policies. A statistical annex is
also provided at the end.
2. Urbanization and the Economy
2.1 Pace and magnitude of urbanization
3. Rapid urbanization is one of the most striking features of economic development.
Developing countries are urbanizing at rates similar to what developed countries experienced about a
century ago. On average, today‘s developed countries increased their urban shares by 7.7 percentage
points between 1880 and 1900; today‘s developing countries have seen urban share increases of 8
percentage points between 1985 and 2005.2 Similarly, urbanization is taking off in Uganda where
urbanization is estimated at around 13 percent and urban growth rates are around 4.5% per year and
1 This note has been prepared by Somik Lall drawing on inputs from the Inclusive growth team including Martin
Onyach-Olaa(AFTUW), Frank Byamugisha(AFTAR), and Clarence Tsimponkenge (AFTP2). 2 World Development Report (2009), Reshaping Economic Geography.
Pub
lic D
iscl
osur
e A
utho
rized
Pub
lic D
iscl
osur
e A
utho
rized
Pub
lic D
iscl
osur
e A
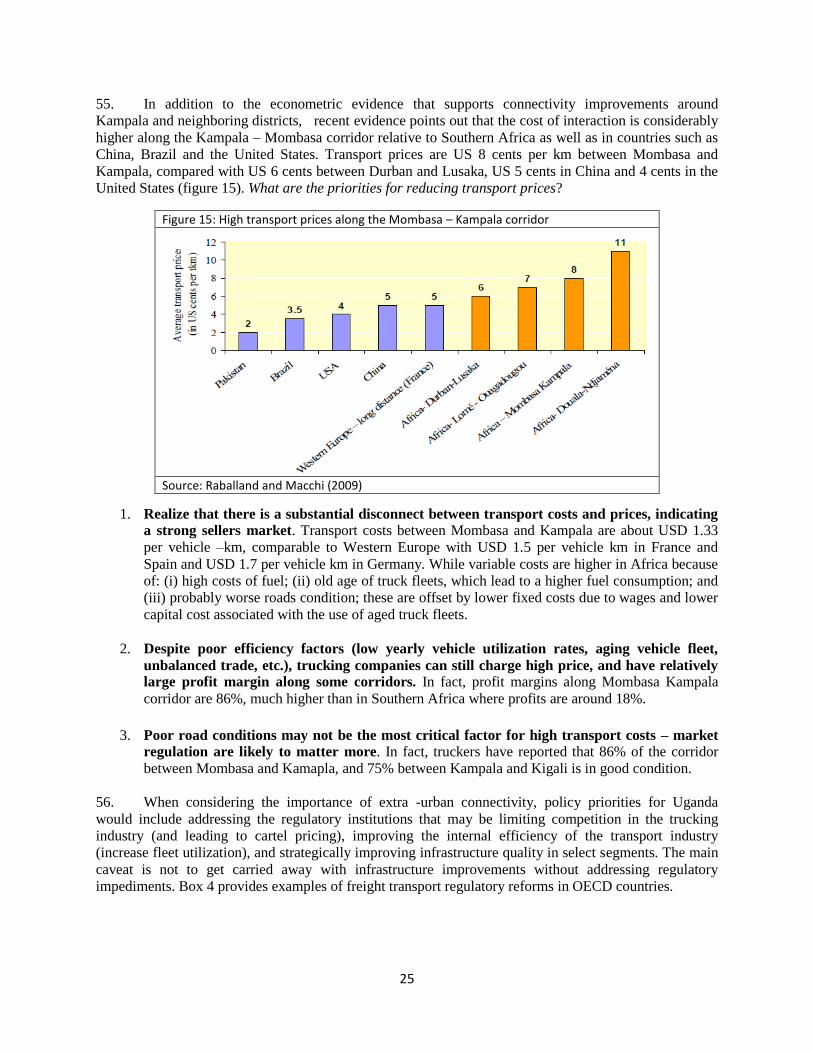
utho
rized
Pub
lic D
iscl
osur
e A
utho
rized
Pub
lic D
iscl
osur
e A
utho
rized
Pub
lic D
iscl
osur
e A
utho
rized
Pub
lic D
iscl
osur
e A
utho
rized
Pub
lic D
iscl
osur
e A
utho
rized
wb406484
Typewritten Text
69523
wb406484
Typewritten Text
2
projected to increase further. The urban population projected to increase from 13.3 million in 2010 to 20
million in 2030.3 International evidence highlights that urbanization proceeds slowly at initial stages of
economic development, accelerates (in the stage where countries classified as middle income) and slows
down at high levels of income. In this context, Uganda‘s urban deluge is yet to come.4 Uganda‘s urban
shares are still low relative to its neighbors, though there appears to be a consistent link between
increasing incomes and changes in urban shares (figure 1).
Figure 1: Uganda: Urbanization relative to neighbors
Source: WDI data
4. Urbanization rates in Uganda are higher than official estimates if one considers an alternate
measure – the Agglomeration Index, which considers density, urban size and proximity to the urban
center. In fact, this can be thought of as the shadow of the core urban area – with vibrant economic and
social interactions with the urban core. The agglomeration index does not use statistical definitions of
‗urban areas‘ – it instead uses three indicators to estimate the level of urban concentration in a country or
region – population density, the population size of large urban centers, and travel time to the nearest such
urban center.5 The agglomeration index is the ratio of the population in the agglomeration area to the total
population of the country or region of interest. Using this index, Uganda’s urbanization moves up
from 13 percent to 25 percent using proximity to cities of 50,000 people; however the index drops to
14 percent if cities of 100,000 or more people are considered (figure 2).
5. A similar pattern is seen in neighboring Kenya, where urbanization is 20 percent using statistical
definitions, but increases to 28 percent using the AI using a city size cutoff of 50000; but it drops to 22
percent when the city size cutoff is set at 100,000 people. In contrast, official statistical estimates are
higher than the AI for Tanzania, Rwanda and DRC. In DRC for instance, official estimates suggest
urbanization of 30 percent compared with the AI estimate of 25 percent. The important point is that the
availability and quality of the transport network is likely to have considerable bearing on the extent of
3 World Urbanization Prospects, 2009 revision
4 The underlying rationale behind this transformation is that at low levels of incomes, most of the labor force is
employed in agriculture at subsistence levels. Trade between urban and rural areas is determined by demand for food by the small urban population and demand for urban goods by the rural population. At low incomes, large proportions of income are spent on food with limited demand for urban goods. As incomes rise – possibly due to technological changes in agriculture, the proportion of income spent on food declines and demand for other goods increases. This increases the demand for non food goods as well as demand for labor in urban areas. 5 Uchida and Nelson 2010
3
urban interactions. Dense settlements in close proximity but without transport connectivity would have
fewer interactions in comparison with better connected but further settlements.
Zooming in within Uganda, the AI is estimated to have increased 7 percentage points between 2002 and
2010 (figure 3). The AI is highest in the central region (54 percent in 2010) and growing rapidly in
the Eastern region (11.5 percent points). In 2010, the Western region is the least agglomerated and had
the slowest pace of urbanization.6
6 The AI uses a city population cutoff of 50,000. Important to note that transport connectivity is measured by
design definitions of road quality and does not take into account actual road quality or traffic volumes
Figure 2: Agglomeration Index - Uganda and Neighbors
Source: Uchida and Nelson (2010)
Figure 3: Uganda – Agglomeration (population) across regions
Source: Mukwaya et al 2011
0
5
10
15
20
25
30
35
Uganda Kenya Tanzania Rwanda DR Congo
Pe
rce
nt
AI 50K
AI100k
UN
0
10
20
30
40
50
60
Central Eastern Northern Western UGANDA
AI 2002
AI 2010
Change AI
4
6. Urbanization is driven by natural population growth, rural urban migration, and land use reclassification. In principle, rapid population growth is not a necessary condition for rapid urbanization
– in fact urbanization can proceed with zero population growth. High fertility is contributing to in situ
growth, but new evidence shows that fertility in urban areas – especially in Kampala – is lower, and the
number of children is closer to the desired one.7 However, the move to cities – rural urban migration has
been a key source of urban growth and has been a large part of policy discussions in developing countries.
The underlying economic logic is that the migrant is a rational actor seeking to reduce the observed wage
differential between his/her rural wage and the prevailing urban wage. In this logic, it is important to
adjust the rural-urban nominal wage differential for cost of living differences and other (dis)amenities –
including congestion and pollution. In fact, poor living conditions in urban areas would reduce the real
wage differential.
7. People are mobile in Uganda, but move short distances. While 25 percent of the working age
population has been a migrant at some point, most of the movement is within the same district. Less than
40 percent of migrants—and only 10 percent of the overall population—move to another district. And
majority of movement within and between districts is from one rural area to another – not to urban areas
(it is not clear if these rural areas are adjacent to urban area).8 The search of arable land influences
migration in Uganda‘s predominantly agrarian economy where differences in soil quality, land tenure and
access to markets matter have considerable bearing on where people want to live. In addition, the flight
from conflict has also motivated household decisions to move. The country‘s civil conflict has
displacement many Northerners where 70 percent migrants report insecurity is the leading factor driving
migration -- (with 70 percent). In the other three regions, jobs, education and marriage are leading
reasons for moving.
8. The move to cities is welfare enhancing. A simulation exercise based on econometric analysis
of UNHS data for 2005/06 shows that similar households (size, composition, education) do better when
they migrate to urban areas, and generally intra-district migrant households to do better than inter-district
households in the receiving district.9 One reasonable explanation for this finding is that households that
move, but stay within their district of origin, will know the customs, practices, languages, and perhaps
even the job market better than ―immigrants‖ from a neighboring district. Furthermore, intra-district
migrant households may have closer ties (e.g. a larger network at their destination) than inter-district
migrant households because they are more likely to have family or kin living within the same district.
These findings also help explain the observation made earlier that the majority of internal migration in
Uganda is within the same district rather than between districts.
9. Urban expansion through reclassification of land use from rural to urban has become an important contributor to the urbanization process. In fact, cities across the world are rapidly growing
at their edges, surrounding and transforming villages and farmlands. Consider Kampala, which has grown
from an administrative township of 0.7 sq km in 1902 to over 195 sq km by 1968. Spatial expansion was
possible by annexing adjacent townships and rural areas. Now sprawling across 839 sq km, Metropolitan
Kampala is continuously converting the rural landscape into urban uses.10
7 World Bank (2011) Demography and Economic Growth in Uganda. draft
8 Koola and Ozden (2010), based on 2005/06 UNHS
9 Koola and Ozden (2010), based on 2005/06 UNHS
10 Nyakaana, Sengendo et al. 2004
5
10. The process of urban expansion is not unique to Uganda or the Kampala Metropolitan Area. Figure 4 shows Kampala‘s spatial expansion between 1995 and 2001where suburban built up area
has come up on previously open rural space. Urban expansion – measured by the change in built up area
is around 6 percent annually, which is faster than either the regional or global pace of urban expansion.
However, average densities have declined much slower -- at around 2 percent annually (suggesting
redevelopment within the city), which is faster than regional trends but in line with what is happening
globally. This process of urban expansion or sprawl will accelerate as incomes rise and people demand
larger homes (which can be developed at
the city’s periphery) and afford cars for comfortable commuting.
11. Beyond pure spatial expansion,
administrative reclassifications also
influence the pace and magnitude of
urbanization. The Ministry of Local
Government classifies Gazette cities,
municipalities and town councils as urban
areas and the Local Government (LG) Act
CAP 243 empowers the ministry to declare
an area urban if it satisfies the following
criteria11
: a minimum 25,000 people for
town council; 100,000 people for
municipality; and 500,000 people for a city;
has a master plan for land use; has available
water sources and is able to meet the cost of
providing services. In addition, the local
government act declares all district
headquarters as towns. There has been a
proliferation of new districts over the past
25 years (by carving out parts of existing
districts) -- from 35 in 1986 to 45 in 1998
and 112 in 2010 – and the new district
headquarters are automatically gazetted as
town councils reclassifying the population
urban.
11 In 2010 Parliament has approved the creation of additional nine municipalities although some may not meet all the criteria. The
nine Municipalities which became effective Jul 1, 2010 are Hoima, Masindi, Kasese, Busheyi/Ishaka, Ntungamo, Busia, Iganga,
Mukono and Rukungiri.
Figure 4: Urban expansion in Kamapla
Source: Angel (2010)
6
2.2 Portfolio of cities
12. Zooming in from the urbanization
process to the texture of urban growth – why
do some Ugandan cities do better than others –
at attracting people and nurturing economic
activities? Why is Kampala so big? And why are city sizes not equalizing over time? Home to
1.6 million, Kampala dominates the urban
landscape, accounting for one-third of Uganda‘s
urban population. The next largest town is Kira
with 179,000 located barely 4 kms from
Kampala‘s CBD12
. The Northern cities of Gulu
and Lira are two other cities with more than
100,000 people (figure 5). The skewed
distribution of city sizes is of considerable
concern to policymakers who would like to
stimulate growth in small and medium sized cities.
However, this pattern of city sizes is not an
outlier, but an empirical regularity across
countries and over time.
13. The distribution of large, medium and
small towns is typically dictated by the distribution of economic activities. The number and
distribution of small towns is particularly linked with the level and distribution of agriculture activity. The
hierarchy of economies of scale found in the manufacture of different products, along with the
agglomeration economies then influences the hierarchy of the size of settlements. In this context, each
type and size of urban settlements has its own unique function. And these functions tend to be broadly
complementary to each other and not substitutes. The alternative to a large city is another large city, not a
small town. The kind of economic activities that give rise to a big city – high end manufacturing and
services, transportation nodes, government centers, and financial centers (generating urbanization and
localization economies) – if displaced will merely give rise to other big cities, not a bunch of small
towns. Activities in small towns are related more to the demand of the agriculture hinterland and rely
more on scale economies at the level of the plant. The more prosperous the agricultural hinterland, the
more demand for urban services.
14. In fact, the size distribution of cities is fairly stable and tends to follow a power law (called Zipfs
law). Ranking the populations size of cities in a country and calculating the natural logarithm of the rank
and of the city population will generate a log-linear graph – the rank size distribution. Figure 6 plots the
rank size distribution for Uganda, and compares with neighboring Kenya and Tanzania. What is evident
that a wide range of city sizes coexist – not only the dominant primate cities or a group of cities of similar
size. The challenge is to enable all parts of the urban portfolio to deliver their appropriate economic
functions.
12
In fact under the new Kampala City Metropolitan Planning Authority, Kira and Nansana are part of the new Kampala Metropolitan Area.
Figure 5: Size distribution of Ugandan cities 2011
Source UBOS Statistical Abstract 2010
0 500,000 1,000,000 1,500,000 2,000,000
KampalaKira
GuluLira
MbaleNansana
JinjaMbararaEntebbe
KaseseMasaka
SorotiNjeruArua
KitgumMukono
IgangaKoboko
BusiaFort Portal
KabaleMasindi
TororoHoima
Mityana
7
15. Uganda’s urban portfolio is dominated by Kampala, which accounts for over 35 percent of
the country’s urban population. Kampala‘s primacy is not an outlier – when compared with other
countries in Africa (or low income countries in general). In 2007, 22.5 percent of Ethiopia‘s urban
population lived in Addis Ababa and the city was more than ten times larger than the second largest city.
Nairobi holds 38 percent of all Kenyan urban dwellers and is 3.7 times the size of Mombasa.
Antananarivo‘s 1.69 million is 8.5 times the second largest city in Madagascar. Mogadishu holds 46
percent of all urban Somalis, and Dar es Salaam 29 percent, Kigali 48.6 percent and Asmara 64.0 percent
respectively of their nation‘s urban dwellers. Urban primacy is widespread in Africa.
2.2.2 Is Kampala too big?
16. A cursory look at figure 6 would suggest that Kampala is larger than what the rank size
distribution would predict. This is even worse when Kampala is considered in its new definition as the
Kampala metropolitan area. But answering question of whether Kampala is too big is not straightforward.
First, consider that Kampala is the economic (and political) capital of a small landlocked country thereby
limiting the markets that the primate city can serve. Recent work by Paul Collier and Tony Venables
shows that Africa‘s political fragmentation has hurt city size and productivity. As small countries
generally have smaller cities, some of the productivity benefits from city size are foregone.13
Econometric
analysis shows that country area and population are highly significant drivers of city size and that a
merger of two similar size countries – i.e. a doubling of population and area – would lead to a 75%
increase in the size of the largest city. As a heuristic, consider the merger of 10 countries, in each of
which the largest city has 3 million people. Based on Collier and Venables estimates, the largest city in
the combined country will have 19 million people, and a size distribution of city populations that
drastically declines for other towns (19, 9.5, 6.3, 4.7, 3.8, 3.1, 2.7, 2.4 and so on).
17. And this illustration has bearing when the East African Community integrates further, helping
Kampala serve a larger economy. The extent to which Kampala grows in response to regional integration
will depend on how it well provides a range of amenities and services that an integrated economy will
desire. As such the question on Kampala‘s optimal size is not very useful – but it is more useful to ask if
13
Collier and Venables 2007
Figure 6: Urban rank size distribution – Uganda and select neighbors
the metropolis is serving the needs of its firms and households and is it flexible to compete with similar
metropolises in the region. Getting urban function right will guide city size.
2.2.3 Economic role of cities
18. Economic benefits from urban growth
come from exploiting economies of scale and
agglomeration and enabling substitution between land and non land inputs. The link
between urbanization and economic growth is
based on the propensity of non agriculture
activities – manufacturing and services – to
concentrate in urban areas. Why? Non agriculture
activities respond to the size and density of a
settlement. As agriculture is land intensive, there
is limited scope for a large number of people to
concentrate in one settlement. Even though some
degree of substitution between land and capital as
well as land and labor is possible, its scope is
limited compared with manufacturing and
services. For manufacturing, capital can
substitute land by building high rise factories or
by designing processes where use of land is
minimized. And services can be carried out in
buildings on any size – further increasing the
substitution of land by capital. In addition, the
presence of scale and agglomeration economies increases likelihood of the spatial concentration of
industry and services. The functioning of industries require complementary services such as banking and
finance as well as proximity to other manufacturing facilities for procuring inputs as well as selling
intermediate products. Similarly for many retail and business services, a minimum population catchment
is needed for profitability (inventories in retail trade and consumers for financial services). Hence, the
combination of scale and agglomeration economies and comparatively high non land- land substitution
elasticities in industry and services enhance gains from urbanization.
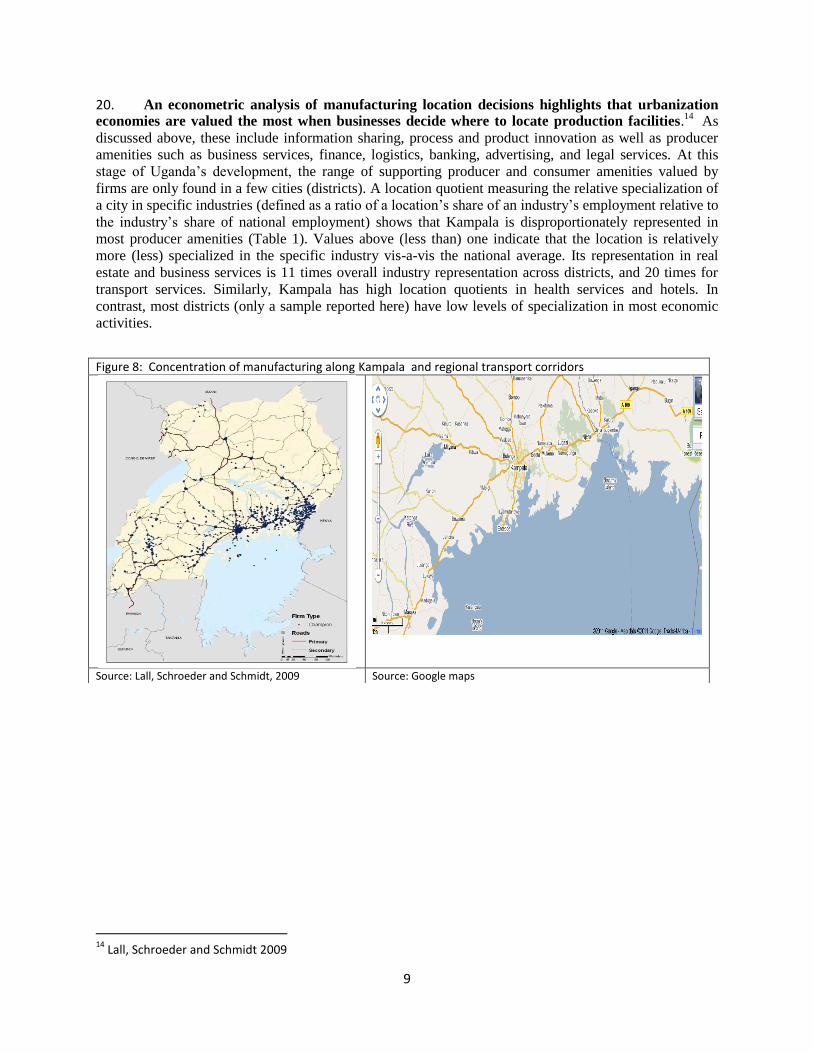
19. Uganda has a small urban footprint (figure 7), dominated by the corridor that connects Kampala
with neighboring cities such as Kira, Nansana and Entebbe and Jinja in the East. In fact by 2001, 70% of
the country’s 12,000 manufacturing plants with 5 or more employees were clustered around Kampala and the regional transport corridor (figure 8). In fact, the Herfindahl – Hirschman index
across industries shows a high degree of spatial concentration (ranges between 0 and 1, 1 is extreme
concentration) – and is higher in business services (finance and insurance) relative to manufacturing
(figure 9 and Annex Table 1). An alternate measure on industry concentration – the Duranton Overman
index also shows high degree of spatial concentration – with the printing and publishing sector being the
most concentrated (see box 1).
Figure 7: Uganda – Urban footprint
Data : MODIS
9
20. An econometric analysis of manufacturing location decisions highlights that urbanization economies are valued the most when businesses decide where to locate production facilities.
14 As
discussed above, these include information sharing, process and product innovation as well as producer
amenities such as business services, finance, logistics, banking, advertising, and legal services. At this
stage of Uganda‘s development, the range of supporting producer and consumer amenities valued by
firms are only found in a few cities (districts). A location quotient measuring the relative specialization of
a city in specific industries (defined as a ratio of a location‘s share of an industry‘s employment relative to
the industry‘s share of national employment) shows that Kampala is disproportionately represented in
most producer amenities (Table 1). Values above (less than) one indicate that the location is relatively
more (less) specialized in the specific industry vis-a-vis the national average. Its representation in real
estate and business services is 11 times overall industry representation across districts, and 20 times for
transport services. Similarly, Kampala has high location quotients in health services and hotels. In
contrast, most districts (only a sample reported here) have low levels of specialization in most economic
activities.
14
Lall, Schroeder and Schmidt 2009
Figure 8: Concentration of manufacturing along Kampala and regional transport corridors
Source: Lall, Schroeder and Schmidt, 2009 Source: Google maps
10
Figure 9: Spatial concentration of economic activities in Uganda (Herfindahl index)
Data source: Uganda Business Registry (2006/07)
Table 1: Economic Specialization across regions (LQs> 1 reflect specialization)
Data source: Uganda Business Registry (2006/07)
0.0000 0.2000 0.4000 0.6000 0.8000 1.0000 1.2000
Fishing
NGO
Post and Telecommunications
Electricity, Gas & Water
Mining & Quarrying
Transport
Finance & Insurance
Public Administration and Defence
Agriculture
Education
Real Estate & Business Services
Social Work Activities
Construction
Trade
Community, Social and Personal Services
Manufacturing
Health
Hotels & Restaurants
#Firms Employment
District Health
Hotels &
Restauran
ts
Manufact
uring
Real
Estate &
Business
Services
Social
Work
Activities Trade Transport Total
KALANGALA 0.0 0.1 0.0 0.0 0.1 0.1 0.0
KAMPALA 8.9 6.6 1.4 11.0 64.4 5.9 20.3 0.5
MASAKA 1.4 0.4 0.0 0.0 1.0 0.2 0.0
MPIGI 0.4 0.0 0.0 0.0 0.0
MUBENDE 0.1 0.1 0.1 0.0 0.1 0.0
MUKONO 1.2 0.3 0.3 0.1 4.8 0.1 0.1
WAKISO 0.7 1.1 0.2 0.1 1.9 0.3 0.8 0.1
IGANGA 0.1 0.1 0.0 0.1 2.0 0.1 0.0
JINJA 0.6 1.2 0.4 0.5 0.4 0.2 0.1
MBALE 0.6 1.3 0.0 0.2 0.1 0.0 0.0
TORORO 0.2 0.5 0.1 0.1 0.1 0.1 0.0
GULU 2.3 0.4 0.0 0.2 0.1 0.2 0.0
LIRA 0.0 0.2 0.0 0.0 1.2 0.2 0.4 0.0
11
1.1.1 Box 1: A spatially detailed measure of industry concentration – the Duranton
Overman index Giles Duranton and Henry Overman – well known economic geographers – have developed a methodology to
measure industry localization/ clustering. Their methodology is based on a point pattern approach where physical
distances between plants are used to measure the extent to clustering. A potential advantage of this measure is
that indicators based on administrative classifications are sensitive to the spatial scale of measurement. Thus,
measures utilizing fairly aggregate spatial data may overstate the extent of clustering. For the United Kingdom,
Duranton and Overman show that a distance-based measure measuring localization shows lower industrial
clustering compared to other measures, such as that developed by Glenn Ellison and Edward Glaeser (EG). If the
EG index is used, 94 percent of UK industries show clustering -- are localized; however, the distance measure
shows that only 51 percent of industries in the United Kingdom are localized and 26 percent are dispersed.
If an industry is concentrated, the plant to plant distances will be less for firms in that industry than for a
randomly chosen firm from the economy at large. The index is computed in two phases: (a) calculate the
distribution of inter plant distances in an industry and (b) compare actual distribution with a random assignment
of the chosen industry‘s firms across all manufacturing firm locations (generating 95% and 99% confidence
bands based on 1000 randomizations). If for a particular industry, the actual distribution is (a) above confidence
bands: significant clustering than overall manufacturing, (b) within confidence bands: about as distributed as
overall manufacturing, and (c) below confidence bands: more spread out than overall manufacturing. As geo
referenced data on plant location are necessary, there are only a handful of developing countries where this
measure has been implemented.
In Uganda, the national business registry provides a comprehensive listing of all establishments in the country. A
total of 165,000 establishments are included in this database for 2001. For each establishment, we know the
physical location (measured by a GPS system), four digit industrial classification, year that it started operations,
and number of employees. The GPS coordinates provide a unique location identifier (latitude and longitude) for
each establishment, within an accuracy of ten to fifteen meters.
Box Figure: Duranton Overman Industry Localization Measures for Uganda
The figure above plots the distribution of inter firm distances and the confidence bands (in red) for three industry
sectors – Printing, wearing apparel, and grain milling. Printing is the most concentrated sector with an average
inter-plant distance of 1.8 kilometers. The figure above shows that the peak of the actual distribution is much
higher that the confidence bands at short distances. Wearing apparel is also clustered at short distances – but
there are a couple of ―spikes‖ at higher distances, suggesting that smaller clusters exist in an additional two
locations. Finally, grain milling is dispersed, with the actual distribution under the confidence bands for short
distances, and following overall industry patterns at higher distances.
12
2.2.4 Extending services to towns and rural areas
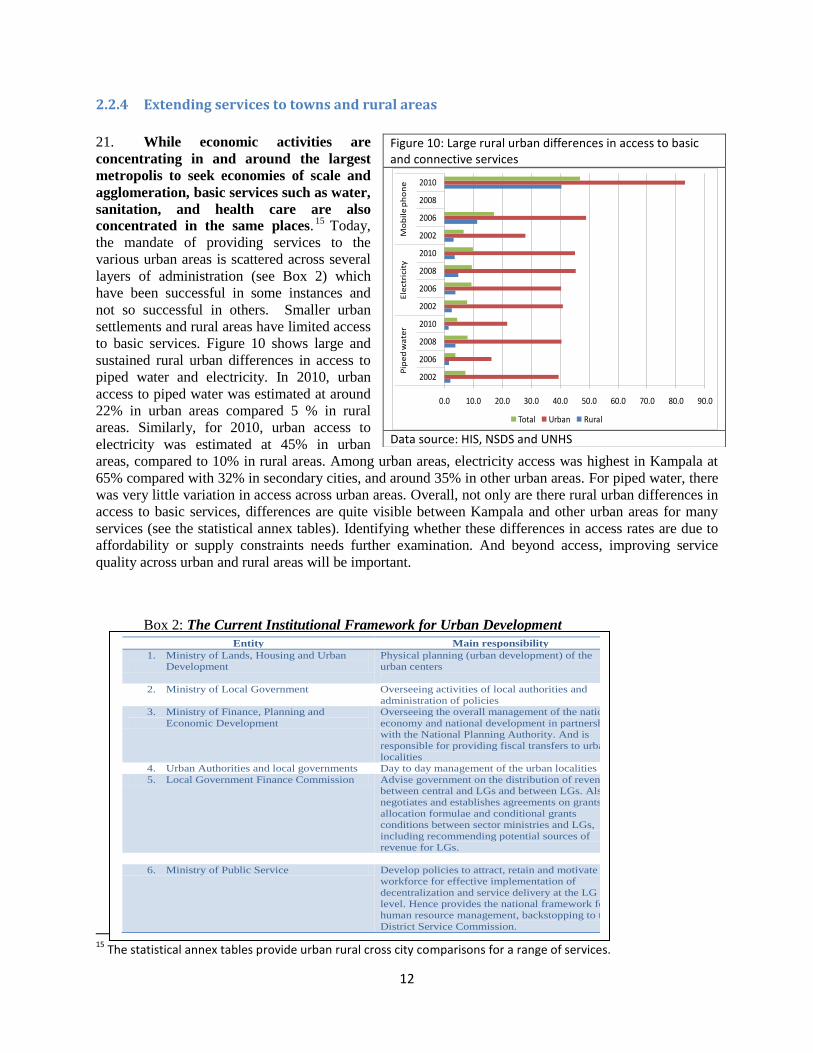
21. While economic activities are
concentrating in and around the largest
metropolis to seek economies of scale and
agglomeration, basic services such as water,
sanitation, and health care are also
concentrated in the same places.15
Today,
the mandate of providing services to the
various urban areas is scattered across several
layers of administration (see Box 2) which
have been successful in some instances and
not so successful in others. Smaller urban
settlements and rural areas have limited access
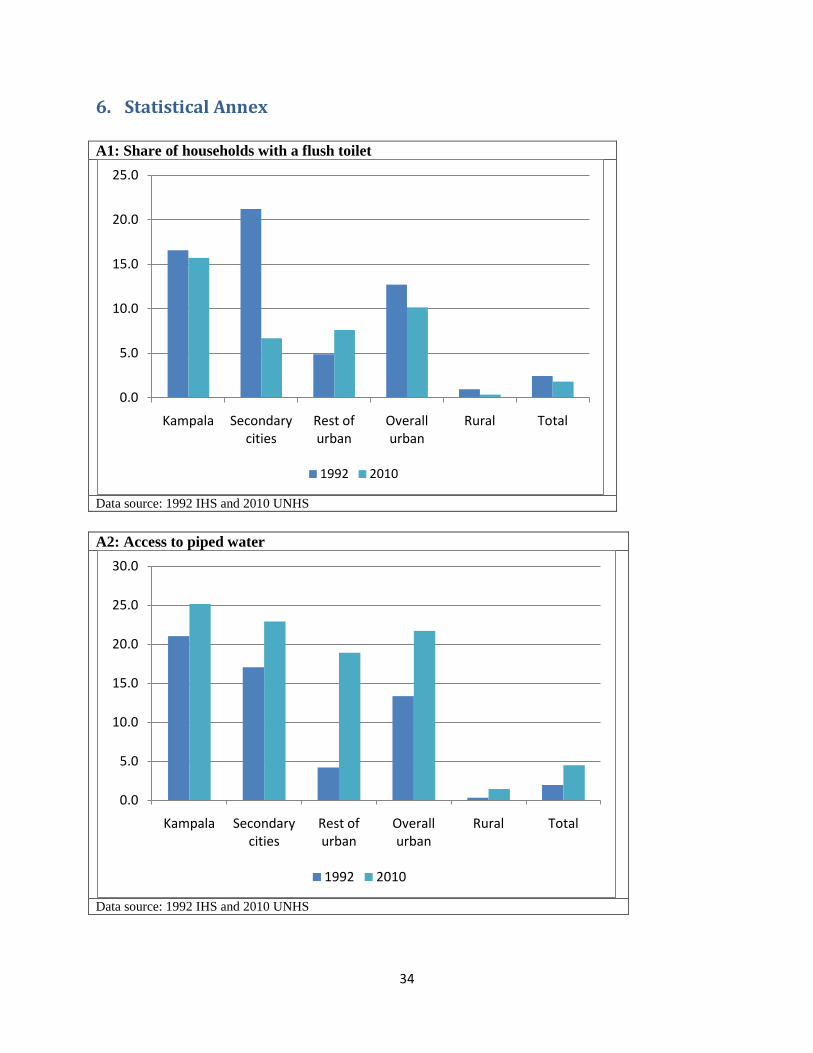
to basic services. Figure 10 shows large and
sustained rural urban differences in access to
piped water and electricity. In 2010, urban
access to piped water was estimated at around
22% in urban areas compared 5 % in rural
areas. Similarly, for 2010, urban access to
electricity was estimated at 45% in urban
areas, compared to 10% in rural areas. Among urban areas, electricity access was highest in Kampala at
65% compared with 32% in secondary cities, and around 35% in other urban areas. For piped water, there
was very little variation in access across urban areas. Overall, not only are there rural urban differences in
access to basic services, differences are quite visible between Kampala and other urban areas for many
services (see the statistical annex tables). Identifying whether these differences in access rates are due to
affordability or supply constraints needs further examination. And beyond access, improving service
quality across urban and rural areas will be important.
Box 2: The Current Institutional Framework for Urban Development
15
The statistical annex tables provide urban rural cross city comparisons for a range of services.
Figure 10: Large rural urban differences in access to basic and connective services
Data source: HIS, NSDS and UNHS
0.0 10.0 20.0 30.0 40.0 50.0 60.0 70.0 80.0 90.0
2002
2006
2008
2010
2002
2006
2008
2010
2002
2006
2008
2010
Pip
ed
wa
ter
Ele
ctri
city
Mo
bil
e p
ho
ne
Total Urban Rural
Entity Main responsibility
1. Ministry of Lands, Housing and Urban
Development
Physical planning (urban development) of the
urban centers
2. Ministry of Local Government Overseeing activities of local authorities and
administration of policies
3. Ministry of Finance, Planning and
Economic Development
Overseeing the overall management of the national
economy and national development in partnership
with the National Planning Authority. And is
responsible for providing fiscal transfers to urban
localities
4. Urban Authorities and local governments Day to day management of the urban localities
5. Local Government Finance Commission Advise government on the distribution of revenue
between central and LGs and between LGs. Also
negotiates and establishes agreements on grants
allocation formulae and conditional grants
conditions between sector ministries and LGs,
including recommending potential sources of
revenue for LGs.
6. Ministry of Public Service Develop policies to attract, retain and motivate the
workforce for effective implementation of
decentralization and service delivery at the LG
level. Hence provides the national framework for
human resource management, backstopping to the
District Service Commission.
13
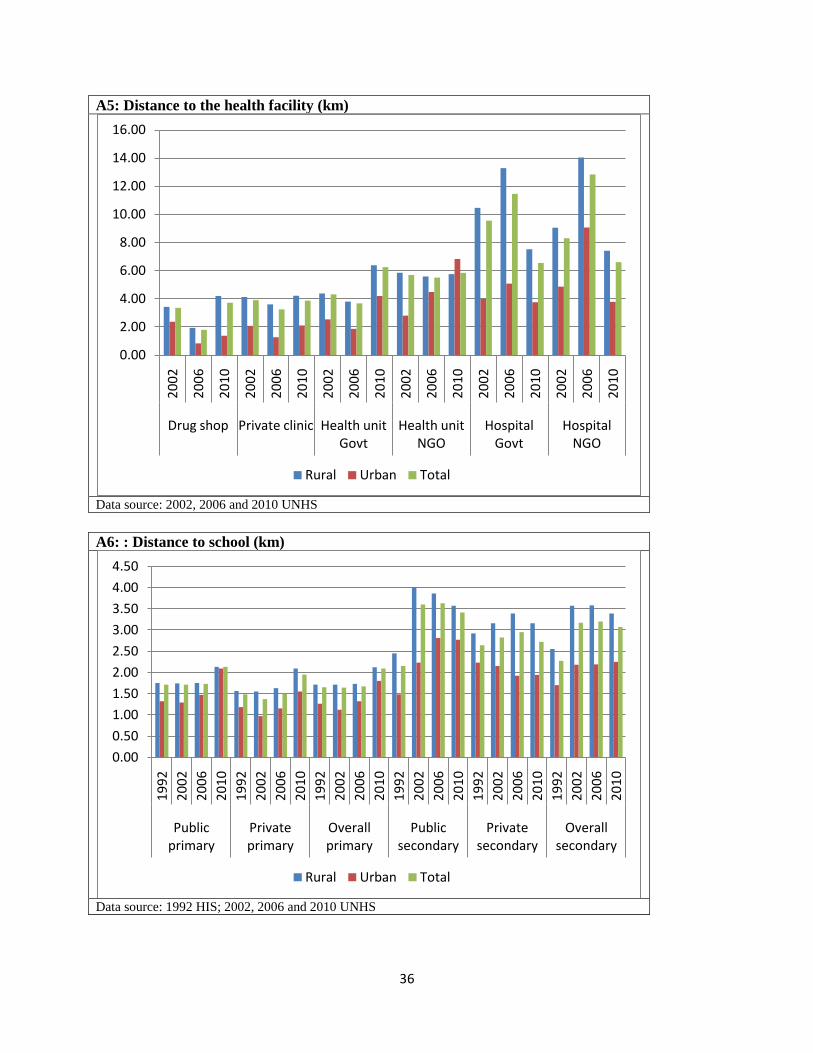
22. In stark contrast, there is spatial equity in primary school enrollments, which are over 85%
overall and there is virtually no difference between rural and urban enrollment rates. While enrollment
shares are around the same for private and public primary schooling is urban areas, publicly provided
schools dominate in rural areas. Much of the equity in primary school enrollments can be attributed to the
governments‘ UPE program. However, there are quality and cost constraints to actual education
outcomes. Dropout rates are higher in rural areas as is proficiency in learning. This, together with unequal
access to secondary has led to large differences in secondary school enrollments between rural and urban
areas. For the year 2010, secondary enrollment rates were 45% in urban areas and 19% in rural areas.
23. In summary, the facts on urbanization and the economy show Kampala dominating the urban
landscape, accounting for one-third of Uganda‘s urban population and connecting the country with the
East African economy. However, most of Uganda‘s population lives in small towns and rural areas,
where public policy has not yet been successful in setting up institutional foundations for ensuring
universal access to basic services, and reducing impediments for changing land use in anticipation of
future market needs. Going forward, it becomes important to amplify the gains from the country‘s
economic engines while planning for urban transformation across the country. The next section
identifies specific planning, policy, and investment bottlenecks that limit the pace and returns from urbanization. The focus is on institutional challenges that limit economic density and land use changes,
infrastructure that connects rural and urban areas and maintains urban mobility, and targeted interventions
for improving living conditions –especially shelter, in cities. Institutions that extend services everywhere
are important, but covered in a companion policy note on integrating lagging and leading areas.
3. Challenges for efficiency and inclusion
3.1 Institutions governing land markets 24. Increasing densities of economic activities is one of the key features of successful urbanization,
enabled by reusing the same piece of land for higher value activities over time. Policies that assign
property rights and encourage trade of land can enhance economic efficiency and allow settlements to
respond to changing needs of the market. Fluid land markets help the transition out of agriculture, where
rural land can be sold and/or rented for urban uses, and rural residents can seek more rewarding
opportunities in non -farm activities in urban areas. For instance in Vietnam, strengthening of land tenure
security quadrupled participation in rental markets from 3.8% in 1993 to 15.8% and resulted in an
increase in rural urban migration from 29% in 1993 to 64% in 1998.16
In addition, both rental and sales
markets had unambiguously positive impacts on productivity.
25. International evidence identifies positive impacts of tenure security on investment and
productivity – however in Uganda, the lack of clear property rights has removed a large proportion of
land from the market. In fact, only 18% of private land is registered and titled. While land registration is
not a necessary condition for land tenure security, there is considerable international evidence that it
enhances land tenure security by defining the nature and content of land rights, availing all information on
land ownership in a public record (the land registry) for inspection and having its correctness assured by
the state.17
16
Deininger and Jin, 2003 17
Deininger 2003
14
26. In addition, unclear property rights and land-related conflicts in Uganda reduce agricultural
output by about 8 percent.18
Data from the UNHS 2010 show that 37 % of land could not be sold, 34 %
could not be rented, and 44 % of land could not be used as security for a loan. This is partly attributed to
the predominance of the mailo land tenure system, which is beset by overlapping land rights between
those who are registered owners and the lawful or bona fide occupants, as per the Uganda Land Act of
1998. Overlapping property rights on mailo land have created investment disincentives and reduced
productivity by up to 25 percent. On the other hand, in western, eastern, and northern regions, customary
land tenure systems restricts the sale of land to outsiders to the community.
27. There has also been a decline in land rental markets following the 1998 Land Act and the Land
Amendment (2010) Act which has increased powers of tenants over landlords associated with the
introduction of the concept of ―bona fide‖ occupants, making it very difficult for landlords to evict
tenants. These legal instruments should be reviewed to reverse the unintended effects of dampening the
rental land market. Improving fluidity of land markets will require 3 areas of reforms: (i) reducing land
conflicts and overlapping land rights on mailo land (ii) reversing a decline in land rental market activity
which started in the early 2000s; and (iii) encouraging land rental markets in areas of communal land
ownership such as northern Uganda to attract investment there.
28. Reducing Land Conflicts and Overlapping Land Rights. One way to address land disputes is to
re-activate the District Land Tribunals which were introduced by the 1998 Land Act but disbanded in
early 2000s and take them out of the Judiciary so that they can operate as alternative dispute resolution
(ADR) instruments as proposed under the draft National Land Policy. In the case of disputes of
specialized nature, the government should strengthen the capacity of local land administration institutions
in those particular areas of conflict and accelerate systematic land adjudication and demarcation in those
areas; for northern Uganda, communal lands should be demarcated and registered to protect local
community land against non-community land incursions. As for overlapping land rights on mailo land,
the government should increase funding and improved operations of the Land Fund to extend subsidized
loans to bona fide and lawful occupants to buy out residual land rights of landlords.
29. Reversing the Decline in Land Rental Market Activity. The Land Act (1998) and corresponding
Land Amendment Act (2010) should be reviewed to reverse the unintended effects of scaring landlords
from renting out land. Incentive systems like taxation could also be used to encourage landowners to rent
out or sell underutilized or unused land. In this case, the proposed reform of taxing beyond a threshold
under the draft National Land Policy should be encouraged.
30. Encouraging land Rental Markets in Areas of Communal Land Ownership. To encourage the
flow of capital as well as people with greater agricultural skills into those regions where land sales are
discouraged by customary practices, rental markets should be encouraged through demarcation and
registration of community lands for many of the clans that are willing to register themselves and own land
as Communal Land Associations as provided for under the 1998 Land Act. Such Communal Land
Associations will be in a strong position to negotiate with investors seeking long term leases for
agriculture.
31. Another important issue in improving fluidity of land markets is to strengthen capacity of land administration institutions. In the medium to longer term, this will help prepare Uganda to set up a system
to value land (including an integrated land management/ registration system), manage land transactions
(including compensation during acquisition), settle land related disputes, and review regulations that
govern land transactions. Even today‘s highly urbanized countries such as South Korea sowed the
institutional foundations for fluidity in land transformation at incipient stages of urbanization (see Box 2).
18
Deininger and Castagnini (2004)
15
32. Land market reforms everywhere in the world are encumbered with political economy
challenges. Lessons from other countries many times provide some guidance on how to overcome
some of these challenges, even though individual country characteristics are critical. Table 2 below
provides some hints of where to look in handling the key reforms being suggested in land reforms
3.1.2 Box 2: Sequencing policies to make land markets flexible : Learning from South Korea
Incipient Intermediate Advanced Future plans
•Establishing land
management and
ownership
•Adopting building
permits, urban planning
districts, and zoning
•Project bases: Land
Acquisition Act,
Downtown improvement
program(redevelopment),
Land readjustment
program(new
development)
•Agricultural land reform
after Korean
Independence
•Expanding urban planning
districts
•Adopting Floor Area
Ratio regulations(‗70)
•Land use change permit,
Regulation of
appropriation of
agricultural and forest
lands (‘72)
•Project bases: Industrial
base development through
land acquisition by
complete purchase(‗80)
•Long-term planning
: National land
development plan, urban
comprehensive plan
•Integrating land
use management
systems in urban
and non-urban
areas
•Adopting a
regional
metropolitan
plan system
• Land management
for preventing chaotic
development and
ensuring social equity
•Reasonable, efficient,
and cooperative
planning system
•Urban policies
focused on urban
region
Source: Park et al (2011): Korea Urbanization Review case study, KRIHS
16
Table 2: Reforming land in spite of political economy challenges
Reforming Land
Markets
Political Economy Risks Where to learn from
experience?
Mitigation Measures
Reform 1. Reduce land insecurity, conflicts and disputes caused by overlapping land rights:
(i)Activate District
land tribunals as per
1998 Land Act and
Take them out of the
Judiciary back to
Ministry of Lands
(ii) Strengthen
capacity of local
governments in
Bunyoro, Amuru,
etc(ie, the conflict
areas)
(iii) Effective
management of the
land fund, including
increasing its funding
to give lawful and
bona fide occupants
subsidized loans to
buy out residual
rights of landlords
There is a stalemate on
whether tribunals should
operate under the umbrella
of Ministry of Lands or the
Judiciary
Inadequate funding for
decentralization has left
many districts, especially
new ones, grossly
underfunded and weak
Well funded Land Fund
could be wrongly perceived
as a political solution to buy
out and silence landlords
regarded as wealthy while
benefiting bona fide and
lawful occupants who are
not regarded as the most
deserving land poor.
In Tanzania and Zambia,
the Tribunals are under the
Ministry of Lands
Kenya, Tanzania and
Rwanda are stepping up
funding to strengthen
decentralization of land
administration
Malawi and South Africa
have well designed and
funded land redistribution
programs focused on
poverty reduction; the
Malawi program is funded
by the World Bank
Learn from experience of
other countries and adopt best
international practice
Publicize awareness of what
other countries are doing to
fund and strengthen
decentralization of land
administration
1. Improve the design,
funding and operations of the
Land Fund to increase its
credibility as a pro-poor
development program
2. Conduct an awareness
campaign of the
developmental benefits of an
improved Land Fund
Reform 2. Promoting land rental market activity:
(i) Review the land
laws(1998 and 2010)
(that increase powers
of tenants) to reverse
the unintended effects
of scaring landlords
from renting out land
(ii) Institute an
incentive system to
encourage rent or sale
of underutilized land
(e.g taxation and or
penalties for hoarding
vacant land for
speculative purposes)
Reluctance by authorities to
reduce legal powers of
tenants sometimes due to
political concerns.
While the draft National
Land Policy advocates for
this policy reform, there is
some opposition among
political leaders who own
lots of land that it would tax
their personal interests
Viet Nam, China and
Thailand have progressive
policies that promote land
rental markets which have
increased land access for
the poor and promoted
transformational growth for
the respective countries
Kenya‘s new National
Land Policy and new
Constitution provide for
introduction of taxation of
unused land and
prescription of maximum
acreage of private land
ownership
Demonstrate to government
that mutually agreed tenancy
arrangements between
landlords and tenant are
superior to legal threats to
landlords in promoting the
interests of tenants in the way
of increased scope, certainty
and efficiency of land rental
markets
Review and draw from
experiences of other
countries especially Kenya
whose new land policy is a
result of very thorough
professional review and
broad consultations
Reform 3. Transforming communal land towards more productivity and benefit for the community:
Encourage land rental
markets in areas of
communal land
ownership by
promoting the
organization of
communities into
Fear on the part of local
communities where there is
communal land ownership
that the government would
collude with investors to
grab their land under the
guise of providing them
Tanzania, Mozambique
and Ghana have on-going
programs to mobilize
communities into formal
land owning entities and to
survey and register land in
the names of the
Undertake a two pronged
approach to raise awareness
over registration of
community land rights while
also piloting organization of
communal land associations
and registering their land
17
Reforming Land
Markets
Political Economy Risks Where to learn from
experience?
Mitigation Measures
communal
associations and
registering their land
rights as per 1998
Land Act
with title deeds communities rights
Reform 4. Strengthen capacity of land administration institutions:
(i) Accelerate the
development of a
land information
system that integrates
land management,
registration and
valuation functions
(ii) Accelerate the
registration of land
rights
(iii) Clarify and
strengthen the
respective roles of
local and central
agencies in land
administration
Manual processes and poor
systems of land records
contribute to inefficiency
and lack of transparency in
land administration
In some parts of the country,
there is misplaced suspicion
by local communities that
systematic land titling
programs could lead to a
loss of their land by wealthy
and politically connected
people
Land administration is weak
at local level in part because
of poor funding and lack of
anticipation that many more
new districts would be
created after the Land Law
was passed in 1998
Many countries world-wide
and in the region including
Rwanda, Kenya and
Tanzania are re-
engineering and
computerizing processes,
workflows and land
records to improve
efficiency and transparency
Kenya has more than 35
percent of its land already
registered compared to 18
percent for Uganda;
Rwanda will have all its
land registered by the end
of 2013 and Tanzania is
planning a big program of
systematic titling after it
registered success in
piloting it
Tanzania, Kenya and
Rwanda are re-examining
their decentralization
arrangements for land
administration with a view
to matching the
decentralized functions
with resources available to
execute them at local level
Disseminate and publicize
international good practices
to gain political support for
on-going computerization
initiatives
Increase awareness of results
from piloting systematic land
titling in order to gain
support for scaling it up
Review and draw from
experiences of other
countries to refocus
decentralization of land
administration so that it can
become effective and
sustainable
3.2 Planning to manage urban change 33. The growth of Ugandan cities has been unplanned – with high rates of spatial expansion (sprawl)
and unplanned growth, lack of integration between sectoral and spatial planning, inadequate provision of basic services, weak urban management capacity and significant fiscal constraints. As a consequence,
congestion diseconomies are setting in early and limiting the ability of towns and cities to exploit
agglomeration economies. Chaos prevails with the landscape dominated by informal housing and slums
and a deteriorating urban environment. Currently about 60% of urban population live in unplanned
settlement (slums) and dirt roads make up a large percentage of the road network with the few tarmac
ones full of pot holes. There are no street lights, drainage channels are inadequate and silted, scattered
waste (both organic and inorganic) contaminates water sources when they overflow during the rainy
season; and water and sanitation services are lousy with majority of the population not connected to
neither piped water nor sewer.
18
34. Urban health has been compromised by the nature of urban development that exposes a majority
of urban dwellers to disease outbreaks – primarily due to inadequate infrastructure and sanitation facilities
in the informal settlements. Drainage channels are also open sewers that run through neighborhoods. For
example in Kampala City, cholera outbreaks have occurred frequently since 1997 with the most recent
between October 30th and mid January 2007 that registered 634 cases with 9 deaths.
35. Urban water supply is the responsibility of the National Water and Sewerage Corporation
(NWSC)19
. Although Uganda is endowed with a number of fresh water bodies20
which covers about 18%
of its surface area, there are great disparities in availability and use within the country because water
resources are unevenly distributed. Currently the NWSC is responsible for provision of water and
sanitation in nineteen urban centers.21
It supplies about 1.4 million customers with 150 million liters per
day. Water in small urban centers (towns) is the responsibility of the Directorate of Water Development
(DWD) which provides grants to small towns to extend piped water to individual households. However,
sometimes access and the amount needed are compromised due to the problem of affordability of the
water tariff. As a result people resort to other sources such as springs, wells and boreholes, which
sometimes are contaminated. Table 2 shows the urban access to water by source which indicates that over
30% of urban dwellers (55%) is without access to suitable water services.
Total 100.0 100.0 100.0 100.0 100.0 100.0 Data source: UNHS
36. Basic hygiene practices including safe water and proper sanitation are also lacking in many urban
communities. Piped water and sewerage services combined are available for only about 8% of urban
dwellers while the rest of the urban population predominately use either pit latrines or septic tanks and
household level. The situation is getting worse with rapid population growth increased with unplanned
spatial expansion of urban areas.
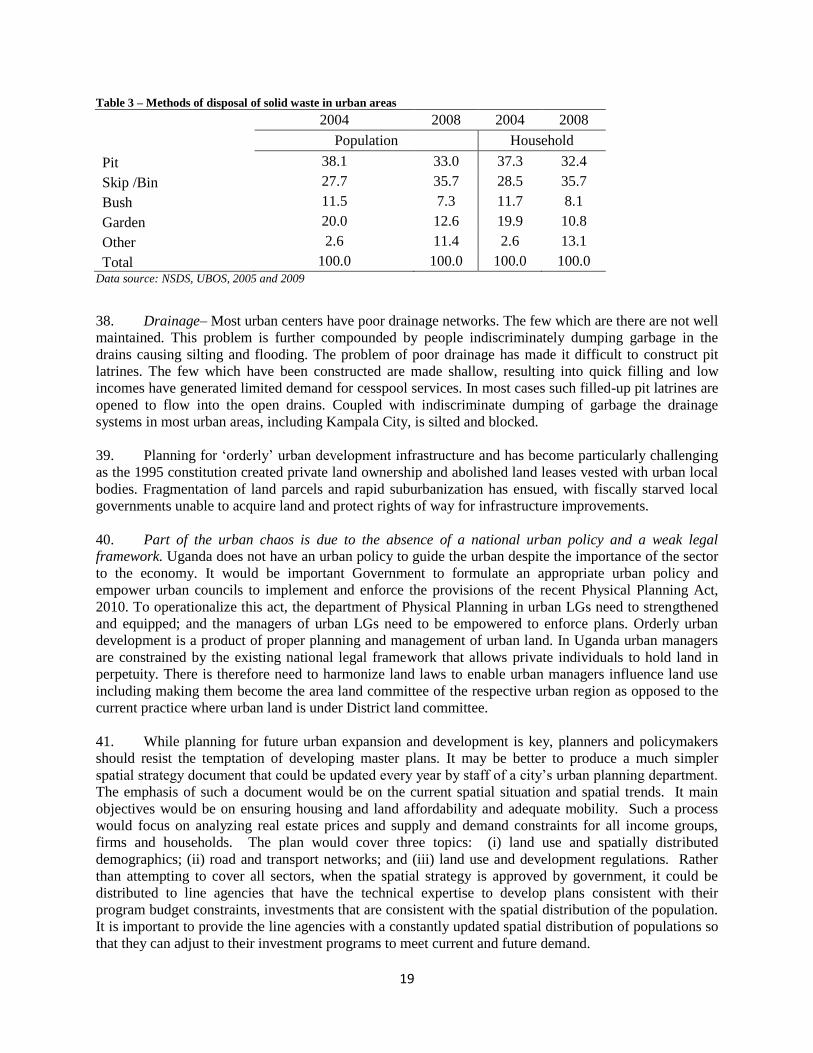
37. Solid waste disposal – Under the LG Act CAP 243, solid waste collection, transportation and
disposal is one of the responsibilities of local governments. In most urban areas the standards of refuse
disposal is generally low. Table 3 below summarizes the methods of solid waste disposal in urban areas.
The most serious problem of solid waste management in urban LGs is associated with the lack of
treatment and disposal facilities. The unscientific manner of disposal of solid waste, dumping in open
sites and low lying areas constitutes a serious public health issue.
19
The NWSC is a public Corporation wholly owned by the GoU established under the NWSC Act to operate and provide water
and sewerages services in areas entrusted to it under the Water Act. 20 Lakes, rivers, springs, wells 21
Kampala (including Kajjansi and Nansana), Jinja/Njeru, Entebbe, Tororo, Mbale, Mbarara, Gulu, Lira, Fort Portal, Kasese,
Kabale, Arua, Bushenyi/Ishaka, Soroti, Mukono, Malaba, Iganga, and Lugazi towns.
19
Table 3 – Methods of disposal of solid waste in urban areas
2004 2008 2004 2008
Population Household
Pit 38.1 33.0 37.3 32.4
Skip /Bin 27.7 35.7 28.5 35.7
Bush 11.5 7.3 11.7 8.1
Garden 20.0 12.6 19.9 10.8
Other 2.6 11.4 2.6 13.1
Total 100.0 100.0 100.0 100.0
Data source: NSDS, UBOS, 2005 and 2009
38. Drainage– Most urban centers have poor drainage networks. The few which are there are not well
maintained. This problem is further compounded by people indiscriminately dumping garbage in the
drains causing silting and flooding. The problem of poor drainage has made it difficult to construct pit
latrines. The few which have been constructed are made shallow, resulting into quick filling and low
incomes have generated limited demand for cesspool services. In most cases such filled-up pit latrines are
opened to flow into the open drains. Coupled with indiscriminate dumping of garbage the drainage
systems in most urban areas, including Kampala City, is silted and blocked.
39. Planning for ‗orderly‘ urban development infrastructure and has become particularly challenging
as the 1995 constitution created private land ownership and abolished land leases vested with urban local
bodies. Fragmentation of land parcels and rapid suburbanization has ensued, with fiscally starved local
governments unable to acquire land and protect rights of way for infrastructure improvements.
40. Part of the urban chaos is due to the absence of a national urban policy and a weak legal framework. Uganda does not have an urban policy to guide the urban despite the importance of the sector
to the economy. It would be important Government to formulate an appropriate urban policy and
empower urban councils to implement and enforce the provisions of the recent Physical Planning Act,
2010. To operationalize this act, the department of Physical Planning in urban LGs need to strengthened
and equipped; and the managers of urban LGs need to be empowered to enforce plans. Orderly urban
development is a product of proper planning and management of urban land. In Uganda urban managers
are constrained by the existing national legal framework that allows private individuals to hold land in
perpetuity. There is therefore need to harmonize land laws to enable urban managers influence land use
including making them become the area land committee of the respective urban region as opposed to the
current practice where urban land is under District land committee.
41. While planning for future urban expansion and development is key, planners and policymakers
should resist the temptation of developing master plans. It may be better to produce a much simpler
spatial strategy document that could be updated every year by staff of a city‘s urban planning department.
The emphasis of such a document would be on the current spatial situation and spatial trends. It main
objectives would be on ensuring housing and land affordability and adequate mobility. Such a process
would focus on analyzing real estate prices and supply and demand constraints for all income groups,
firms and households. The plan would cover three topics: (i) land use and spatially distributed
demographics; (ii) road and transport networks; and (iii) land use and development regulations. Rather
than attempting to cover all sectors, when the spatial strategy is approved by government, it could be
distributed to line agencies that have the technical expertise to develop plans consistent with their
program budget constraints, investments that are consistent with the spatial distribution of the population.
It is important to provide the line agencies with a constantly updated spatial distribution of populations so
that they can adjust to their investment programs to meet current and future demand.
20
42. This is not a revolutionary proposal. Most master plans around the world are largely ignored
(even in China). In Vietnam these plans are often referred to as ―Hanging Plans‖ suggesting that they
often decorate the walls of planning departments, but are rarely implemented. Changing the planning
process to be more in line with market dynamics would lead to better and consistent development
outcomes. Singapore and Hong Kong are good examples of land use planning and internal consistency
between spatial objectives and the provision of physical and social infrastructure.
3.3 Connectivity and mobility within cities 43. Spatially integrated labor markets enhance the economic efficiency of cities. The spatial
extent of urban areas and efficiency of the urban economy is reduced with diseconomies from congestion.
However cities in Uganda, as in most of East Africa are mobility constrained. There are concerns that
motor vehicle ownership is on the rise, with cars and station wagons increasing from 11,000 in 2002 to
over 27,000 in 2009, and motorcycles increasing almost tenfold from 11,000 to over 100,000.22
While the
pace of motorization may appear alarming, these trends are only going to accelerate as incomes rise and
cost of vehicles reduce. The challenge here is to manage private vehicle use, rather than focus on vehicle
ownership.
44. In the absence of strategic planning to accommodate long term growth, cities will face challenges in coordinating, acquiring, planning and developing land for infrastructure (or for
―public use‖ in general). Weak fiscal capacities of local governments exacerbate the problems of
compensating landowners at market rates. Own source revenues are derived from trading licenses,
cultural heritage, property rates, occupation permits, administrative fees like parking fees, livestock and
abattoir fees, and market dues. Urban Local Governments also receive revenues through professional
levis, fines and penalties, graduated tax compensation from central government, statutory transfers from
central governments (unconditional grants, conditional grants, and equalization grants), fee for approval
of building plans, local service tax, ground rent and premium, rental of urban council facilities (halls,
buildings and compounds) for private functions. With the exception of Kampala City which raises about
50% of its budget from own source revenue, all other urban councils in Uganda depend on central
government transfers to finance development programs.23
45. Since provision and financing of urban roads are responsibilities of urban local
governments – their limited finances do not allow them to finance compensation for land
acquisition as well as maintaining existing road networks. As a consequence, the main arteries in
urban areas – particularly in Kampala – are getting rapidly congested. The congestion challenge is
compounded by the Government‘s decision to divest itself from provision of public transport. Public
transport in Uganda now is dominated by 14 seater private mini buses and there has been an explosion of
private motor vehicles (estimated to be growing at 11% per year). Traffic snarls are a big problem –
particularly in Kampala, which receives 1 million people commuters into the city. Transport experts
suggest that the public transport system in Kampala could be improved by (i) signalization at major
junctions and conversion of some streets to one way (traffic management), and (ii) widening of some
streets and making provision for a bus rapid transit (BRT) system (capacity expansion).
22
Data source: Uganda Revenue Authority 23
Martin (2011). Background paper
21
46. The main challenge confronting rapidly growing and expanding cities is to maintain labor
mobility while ensuring that land and property prices remain affordable to a majority of households. Land use and mobility are closely interconnected in principle – but difficult to coordinate in
practice. Maintaining urban mobility requires investments in trunk infrastructure and assigning rights of
way – which have to be planned and financed in advance, where as the supply elasticity of housing
depends to a larger extent on idiosyncratic preferences of where households want to live (depends on
tastes, incomes, etc). Innovations such as smart growth and transit oriented development are bein tried
out in some countries to integrate land use and transport – these need to be examined to see how these can
be tailored to Uganda, keeping in mind that incomes and institutional capacities for implementation and
execution will improve over time (see Box 3 for examples of these innovations).
1.1.2 Box 3: Integrating land use and transport planning –smart growth and transit oriented
development
Smart growth generally calls for higher-density settlement with an emphasis on providing a balanced mix of
housing, jobs, and shopping opportunities within a community. The origin of this trend is often attributed to the
experience of the Brazilian city of Curitiba, which outlined Master Plan in 1965, with the main goals of limiting
central area growth and encouraging commercial and service sector growth along two structural north-south
transport arteries, radiating out from the city center.
Two co-ordinated planning instruments were combined in implementationof the plan.
Development control was used pro-actively. On land sites located along the structural axes local legislation
permits buildings to have a total floor space up to six times the total plot size. Developments close to other
roads with good public transport are allowed floor space up to four times plot size. The coefficient decreases
the further a site is from public transport. This encouraged new commercial developments outside the
city,along each structural axis, and also high density residential developments so there is a match between
residential and commercial areas and public transport provision.
Second, planning for public transport was incorporated centrally in land-use planning. The city center was
pedestrianized with access to public transport but not to private transport. Each of the five main arteries
contains one two-way lane devoted exclusively to express buses. This inner lane is flanked on either side by
1) a local access lane for cars and 2) a high-capacity one-way route for use by both cars and buses.
Separating traffic types and establishing exclusive bus lanes on the city's predominant arteries helped to
ensure a safe, reliable, and efficient bus service operating without the hazards and delays inherent to mixed-
traffic bus service
As the problems of motorization have become more apparent, many cities in the world have begun to think
further in terms of ―transit oriented development‖ (TOD), the major element of which is a congregation of
housing, jobs, shops, and other activities around mass transit stations. Associated with improved access to these
varied land uses, the physical environment is often enhanced with wide sidewalks, an absence of surface parking
lots and large building setbacks. TOD is not only relevant to new development where a high capacity public
transport system has been created. For example, TOD around the BRT network in Brisbane, Australia, can be
classified in three categories. First, the busways are serving existing areas that had many TOD characteristics,
but lacked a dedicated transit connection. Second, the busways are serving as a catalyst for new, green field
development near stations. Finally, the busways are catalyzing urban infill, including significant air rights
development.
22
47. However, public transport is unaffordable to many at current income levels. Data reported in the
UNHS suggest that 64 % of urban dwellers walk to work, and walking trips are as high as 70% in
Kampala (figure 12). As cities in Uganda are expanding their spatial footprints, the limited reach of
walking trips severely limits labor market opportunities for people who live further away from economic
centers, and may even exacerbate slum formation as many people will tradeoff housing quality to be close
to jobs. Typically, transport choice is determined by incomes, with the mode and number of trips
increasing with incomes. What little data available shows that households in Kampala pay US$ 13 per
month on transport fares, which is about 8 percent of the household budget. While this is consistent with
global estimates of what people pay for transport, transport fares are particularly high for the poor. In fact,
the 20% of households end up paying 41% of their incomes on transport – which makes transport services
unaffordable to this group. This is consistent with the situation in many African cities.24
48. In Addis Ababa, 70 percent of trips are by walking and public transport is estimated to cost 3-37
percent of household income, with average distance walked is 5 kms. In Nairobi, it is 4 kms, where 48
percent of trips are by nonmotorized transport, including walking – and the poor pay 34 percent of their
incomes on transport. And in Dar es Salaam, the average distance walked is 2.2 kms and share of non
motorized transport is 45 percent, with transport expenditures for the poor accounting for 53% of
incomes.25
This implies that at low income levels, the wider availability of different service levels and
modes at different prices is a useful strategy for provision of urban transport services.
24
AICD, stuck in traffic. 25
SSATP 2002 and AICD
Figure 12: How people get to work?
All urban areas Kampala
Source: UNHS 2010
Walking, 64.3Taxi (car), 8.6
Boda-boda, 5.4
Bus/minibus, 19.2
Motorcycle, 0Bicycle, 0
Other, 2.6
Walking, 70.3
Taxi (car), 14.6
Boda-boda, 5.9
Bus/minibus, 9.2
Motorcycle, 0Bicycle, 0 Boat, 0 Other, 0
23
49. While most people walk, there are
hardly any facilities and safety standards to
protect pedestrian road users (figure 13).
Improving sidewalks and street lights and other
measures to protect pedestrian users should be
important in an urban transport strategy. The wide
availability of choices is an essential feature of a
responsive strategy. In the short term, it is
important to enable the availability of a wide range
of service levels / modes at different prices – and
invest in sidewalks to reduce pedestrian fatalities in
traffic accidents. In the longer term, policies for
taxing motor vehicle use (say with gasoline taxes)
and supply of public transport choices will be
necessary components of a functioning urban area.
3.4 Connectivity across cities
50. As economic activities concentrate along the corridors linking Kampala and Eastern Africa,
it becomes important to improve connectivity of the metropolis with neighboring urban and rural
areas. To help prioritize transport investments, an econometric and simulation exercise was carried out to
rank order locations where transport improvements would generate the highest returns. As discussed
earlier in this note.26
Uganda‘s industry is clustered and dominated by production activities that are
standardized and require low technology by global standards. These include food processing, garments
and textiles, clay products and furniture. However, many of these products and business lines are new to
the country, so they can be considered locally as ―sunrise‖ activities, while being ―sunset‖ activities
globally. The econometric model of location choice examined the factors influencing the decisions of
entrepreneurs to locate industrial establishments (as reported in the business registry). The choice set
includes all 56 districts (using 2002 definitions) in the country. The model has a good predictive fit and
successfully predicts actual location decisions for 98 percent of the firms in the sample. The main drivers
of industry location are the following:
Market access, measured by transport connectivity to cities of 100,000 or more people
Access to the power grid
Urbanization economies (economic diversity)
Human capital (availability of workers who have primary or more schooling)
51. Based on the location analysis, areas were identified where public infrastructure investments will
produce the highest economic returns in terms of national industrial growth. If we consider the location
attributes of districts to be fixed in the short term, the effects of infrastructure improvements will depend
on the relative ‗stock‘ of these attributes across districts. Based on the model, the relative profitability to
manufacturing firms across districts is predicted (see figure 14). From this figure it is clear that expected
profits are highest in Kampala, Wakiso and Jinja. These are high return areas for private manufacturing.
Districts at the borders of these agglomerations and those along the road leading to the Kenyan border
also offer profitable opportunities for manufacturing
26
See Lall et al (2009) for details
Figure 13: Pedestrian fatalities highest in road
accidents
Source: Kajuna 2011
24
Figure 14: Relative profits for manufacturing firms across districts
Source: Lall et al (2009)
52. Given the distribution of relative profits and the ‗preconditions‘ for success, it is possible to
simulate where infrastructure investments will produce the highest returns? Two scenarios are considered:
In the first case, road conditions are simulated to improve around the Northern cities of Gulu and
Lira to increase travel speeds from 60 to 100 km/h. This would reduce the time it takes to travel
from these cities to market centers of 100,000 people from an average of 5 hours to 3 hours.
In the second case, roads conditions are simulated to improve around high profit cities– Iganga,
Mpigi and Mubende, which are in the country‘s main industrial agglomeration. Again these road
improvements are assumed to increase travel speeds from 60 to 100 km/h.
53. In the simulation, improving roads has two effects. First, it could increase access to markets, and
second it would increase the spatial extent of agglomeration economies as firms can effectively be
‗closer‘ to a larger number of firms in their industry. The simulations show that transport improvements
only provide modest gains for industry location in the Northern districts of Gulu and Lira. In Gulu, the
share of national food and beverage establishments increases from 1.7 percent to 2 percent. In Lira, it
moves from 1.9 to 2.3%. In comparison, in Iganga district that adjoins Kampala, transport improvements
increase the share of establishments that would locate in the district from 5.8 percent to 10.5 percent.
54. Overall the ―pull‖ of agglomeration economies is strong and reduces the impact of
complementary investments to decentralize manufacturing activity. This simple simulation exercise uses
results from the empirical analysis and identifies that private returns to public infrastructure investments,
measured by new industrial development, is highest in areas that offer ―preconditions‖ for success. In
particular, the stock of human capital and an existing mix of diverse economic activities are important
ingredients in a successful growth ―recipe‖. And these hese preconditions are offered in the country‘s
main urban agglomerations.
25
55. In addition to the econometric evidence that supports connectivity improvements around
Kampala and neighboring districts, recent evidence points out that the cost of interaction is considerably
higher along the Kampala – Mombasa corridor relative to Southern Africa as well as in countries such as
China, Brazil and the United States. Transport prices are US 8 cents per km between Mombasa and
Kampala, compared with US 6 cents between Durban and Lusaka, US 5 cents in China and 4 cents in the
United States (figure 15). What are the priorities for reducing transport prices?
1. Realize that there is a substantial disconnect between transport costs and prices, indicating
a strong sellers market. Transport costs between Mombasa and Kampala are about USD 1.33
per vehicle –km, comparable to Western Europe with USD 1.5 per vehicle km in France and
Spain and USD 1.7 per vehicle km in Germany. While variable costs are higher in Africa because
of: (i) high costs of fuel; (ii) old age of truck fleets, which lead to a higher fuel consumption; and
(iii) probably worse roads condition; these are offset by lower fixed costs due to wages and lower
capital cost associated with the use of aged truck fleets.
unbalanced trade, etc.), trucking companies can still charge high price, and have relatively large profit margin along some corridors. In fact, profit margins along Mombasa Kampala
corridor are 86%, much higher than in Southern Africa where profits are around 18%.
3. Poor road conditions may not be the most critical factor for high transport costs – market
regulation are likely to matter more. In fact, truckers have reported that 86% of the corridor
between Mombasa and Kamapla, and 75% between Kampala and Kigali is in good condition.
56. When considering the importance of extra -urban connectivity, policy priorities for Uganda
would include addressing the regulatory institutions that may be limiting competition in the trucking
industry (and leading to cartel pricing), improving the internal efficiency of the transport industry
(increase fleet utilization), and strategically improving infrastructure quality in select segments. The main
caveat is not to get carried away with infrastructure improvements without addressing regulatory
impediments. Box 4 provides examples of freight transport regulatory reforms in OECD countries.
Figure 15: High transport prices along the Mombasa – Kampala corridor
Source: Raballand and Macchi (2009)
26
3.4.2 Box 4 Regulatory reforms in road freight: case studies in OECD, Mexico, and South
Korea
OECD countries (Boylaud and Nicoletti, 2001)
The road freight industry has grown very rapidly. There has been a tendency in many OECD countries to implement major liberalization reforms. Two broad categories of road freight regulations exist: (i) regulations on traffic and vehicles, and (ii) regulations on the operations of the market. The challenge facing road freight regulators is to do so without limiting intra-industry competition and competition with other modes of freight transportation.
The available empirical evidence suggests that liberalization has promoted efficiency and consumer welfare. None of the adverse consequences feared by the industry have come about: in reforming countries competition is thriving in a stable industry environment and safety levels have generally improved. At the same time, freight rates have been reduced, productivity has been enhanced and innovative activity stimulated. In the future, viable comparative measures (indicators) of economic performance in the road freight industry should be identified.
Mexico (Dutz et al., 2000)
From an extreme degree of rigid regulation and government interference, Mexico implemented from 1989 regulatory reforms for the road transport industry based on free entry and market- based price setting. Main lessons of Mexico’s experience for other countries include: (1) The positive role of increased competition in the road freight industry in fostering economy-wide innovation and growth; (2) Successful reform requires careful planning, execution and high-level political support; (3) Sufficient attention and resources should be devoted to assist the oversight institution in adapting to post-regulatory reform conditions; (4) Pro-market rules to offset remaining market failures should be introduced concurrently with removal of distortionary anti-competition rules; and (5) The competition agency has a critical role to play in any regulatory reform initiative, both in terms of up-front advocacy and ex post enforcement activities.
However, there are still unresolved issues that hold back a full-scale logistics revolution in Mexico: (1) The persistent segmentation between large, technologically sophisticated providers of road freight services and low-technology fringe providers; (2) The Mexican government’s unwillingness to enforce technical standards and maximum load restrictions, and (3) Failure to fully implement the transportation related provisions of NAFTA and to ensure more homogeneous federal-state regulatory reforms.
South Korea (Smith et al, 1986)
When South Korea reached the intermediate stage of urbanization in 1984, the Korean Government evaluated the regulations governing its trucking industry. Its objective was to find whether deregulation could bring down costs, contribute to energy conservation, and serve users better. The study, overseen by the World Bank, drew the conclusion that the benefits of regulatory reform in trucking would indeed be large: US$ 240-400 million per year (about 6-9% of total trucking expenditure).
3.5 Targeted interventions to improve slums and housing 57. Rapid population growth and rural urban migration has generated housing shortages in many
urban areas. The private sector, which generates most of the housing units has only been able to meet a
small share of demand, and the Government owned developer – the National Housing and Construction
Company (NHCC) has built only 2300 housing units in the last 30 years – about 77 units only on average
per year. The Uganda Population and Housing Census of 2002 and the National Household Survey
2002/03 estimate a backlog of 83,000 houses in Kampala alone. And reports suggest that 85 % of the
27
city‘s population lives in slums – higher than most East African countries.27
Nationally there is a housing
shortage of 560,000 units, with over 400,000 in rural areas (Table 4). The housing challenge is
exacerbated by the complex land tenure system where the Constitution vested land ownership to residents
with urban authorities no longer holding statutory leases. 28
Table 4–Housing Shortages in Uganda
No Indicator Kampala Urban Rural National
1 Population (‗000,000) 1.359 3.829 23.523 27.352
2 Average Household size(Person/household) 3.800 4.100 5.300 5.091
3 Estimated housing need (‗000,000) 0.358 0.934 4.438 5.372