15
Inclusive Growth: the role of budgetary governance Luiz de Mello Deputy Director – Public Governance & Territorial Development Senior Budget Officials, Rome – 12 June 2015
| Date post: | 13-Aug-2015 |
| Category: |
Government & Nonprofit |
| Upload: | oecd-governance |
| View: | 133 times |
| Download: | 0 times |

Inclusive Growth: the role of budgetary governance
Luiz de Mello
Deputy Director – Public Governance & Territorial Development
Senior Budget Officials, Rome – 12 June 2015
• Motivation and context
• What is the OECD doing in this area?
• How can budgeting contribute?

Motivation and context
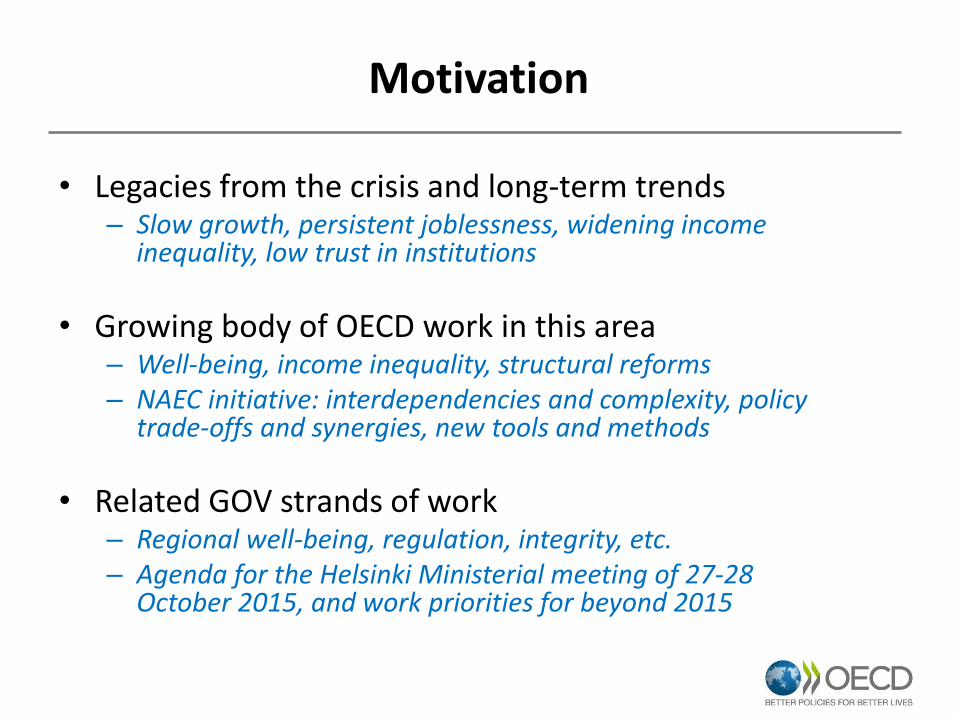
Motivation
• Legacies from the crisis and long-term trends – Slow growth, persistent joblessness, widening income
inequality, low trust in institutions
• Growing body of OECD work in this area – Well-being, income inequality, structural reforms – NAEC initiative: interdependencies and complexity, policy
trade-offs and synergies, new tools and methods
• Related GOV strands of work – Regional well-being, regulation, integrity, etc. – Agenda for the Helsinki Ministerial meeting of 27-28
October 2015, and work priorities for beyond 2015

The context: slow growth and persistent joblessness
Note: OECD Economic Outlook database.
Long-term unemployment (jobless for over 1 year, % of total unemployed)
Real GDP (2007:3=100)
0
10
20
30
40
50
60
0
10
20
30
40
50
60
UnitedStates
OECD Japan Euro area
Q4 2007 Q4 2014
80
90
100
110
120
130
140
20
07
Q3
20
08
Q1
20
08
Q3
20
09
Q1
20
09
Q3
20
10
Q1
20
10
Q3
20
11
Q1
20
11
Q3
20
12
Q1
20
12
Q3
20
13
Q1
20
13
Q3
20
14
Q1
20
14
Q3
20
15
Q1
20
15
Q3
EUR JPN USA WLD

The context: widening income disparities
Note: OECD Income Distribution database.
Gini coefficients of income inequality (mid-1980s and 2013, or latest available year)
0.15
0.20
0.25
0.30
0.35
0.40
0.45
0.50
1985 2013 or latest
Increase Little change Decrease
What has the OECD been doing in this area?

Inclusive Growth: A three-pronged approach
• Multidimensionality: grounded in growth but looks at more than income (employment, education, health)
Which growth?
• Distribution-focused: not only “averages”, but also incidence and impact
Whose growth?
• Policy-relevant: broaden policy surveillance to non-income dimensions
What drivers?

An illustration of different growth path
Note: OECD calculations based on OECD National Accounts, Health and Income Distribution databases.
Median households (Average yearly change in %, 1995-2007)
• Usual metrics • GDP per capita vs
“multidimensional living standards”
• An illustration for
US and EU • Faster income growth
in the US, but slower progress in health and widening income distribution

OECD analysis of growth, wellbeing, equality

How can budgeting contribute?

Response required across all of Public Governance
• Regional development – regional wellbeing indicators, impacts on policy design
• Open government – transparency, participation, data
• Centre of government – vision, goals, coordination
• Regulation – broadening scope, nature of RIA
• Budgeting –
what needs to change?
what should we be doing differently?
(a) From a “Pro-growth” to an “Inclusive growth” fiscal framework
• Growth-friendly fiscal rules, objectives?
• Highlighting the “growth dividend” of inclusiveness?
– E.g. systematic underinvestment by bottom 40% of individuals in their education?
• Protecting and prioritising capital investment?
• Social and environmental dimensions of infrastructural investment?

(b) Evaluating multi-dimensional impacts of budgetary choices
• From income impact assessments to a multi-dimensional model?
• Systematic reform of evaluation (along lines of RIA)?
• Implications for government-wide strategic planning?
• Use of Key National Indicators as “fixed stars” for national policy-making and international becnhmarking

(c) Inclusiveness and engagement in policy-making
• Can be parliaments be “activated” as participants in policy-making across the policy cycle?
• “windows of engagement” for citizens in budget-making?
• Promoting a realistic debate on relative priorities?
• Social media, crowdsourcing, “deliberative dialogue” – opportunities and risks from new tools of engagement?


