Working Papers of the Finnish Forest Research Institute 70 http://www.metla.fi/julkaisut/workingpapers/2008/mwp070.htm ISBN 978-951-40-2082-7 (PDF) ISSN 1795-150X www.metla.fi Income and Employment Effects of Change of Roundwood Use in Eastern Finland and the Republic of Karelia Ilkka Pirhonen, Pekka Ollonqvist, Jari Viitanen, Mikko Toropainen and Vladimir Bungov
Transcript
Working Papers of the Finnish Forest Research Institute 70 http://www.metla.fi/julkaisut/workingpapers/2008/mwp070.htm ISBN 978-951-40-2082-7 (PDF) ISSN 1795-150X
www.metla.fi
Income and Employment Effects of Change of Roundwood Use in Eastern Finland and the Republic of Karelia
Ilkka Pirhonen, Pekka Ollonqvist, Jari Viitanen, Mikko Toropainen and Vladimir Bungov
Working Papers of the Finnish Forest Research Institute 70 http://www.metla.fi/julkaisut/workingpapers/2008/mwp070.htm
2
Working Papers of the Finnish Forest Research Institute publishes preliminary research results and conference proceedings. The papers published in the series are not peer-reviewed. The papers are published in pdf format on the Internet only. http://www.metla.fi/julkaisut/workingpapers/ ISSN 1795-150X Office Unioninkatu 40 A FI-00170 Helsinki tel. +358 10 2111 fax +358 10 211 2101 e-mail [email protected] Publisher Finnish Forest Research Institute Unioninkatu 40 A FI-00170 Helsinki tel. +358 10 2111 fax +358 10 211 2101 e-mail [email protected] http://www.metla.fi/
Working Papers of the Finnish Forest Research Institute 70 http://www.metla.fi/julkaisut/workingpapers/2008/mwp070.htm
3
Authors
Pirhonen, Ilkka, Ollonqvist, Pekka, Viitanen, Jari, Toropainen, Mikko & Bungov, Vladimir
Title
Income and employment effects of change of roundwood use in Eastern Finland and the Republic of Karelia Year
2008
Pages
36
ISBN
978-951-40-2082-7 (PDF)
ISSN
1795-150X
Unit / Research programme / Projects
Joensuu Research Unit / Distinct projects – Social impacts of forests / 3384 Development of Forest Sector in Northwest Russia and its Impacts in Finland / 3504 Russia in Flux – Impacts of Changes in Forest and Economic Policy and Business Preconditions in Russia and Finland Accepted by
Timo Karjalainen, Professor, 28 January 2008
Abstract
Using input-output –method, this study evaluates direct and indirect income and employment effects of reducing roundwood imports from Russia on both the wood working and the pulp and paper industry in Eastern Finland. Four different scenarios of roundwood import reduction and two different possibilities to increase domestic roundwood procurement were analysed. Due to lack of data, similar effects for the Republic of Karelia are calculated using two alternative scenarios to compensate reducing exports. The results indicate that forest industry, together with multiplier effects on other sectors, in Eastern Finland is facing considerable structural changes if the custom tariffs programme for roundwood exports from Russia is fulfilled. The key issue for the development of employment and incomes in Eastern Finland’s forest industry is how the domestic wood procurement or roundwood imports from other countries can be increased to compensate the roundwood imports from Russia. In the worst scenario with only limited possibilities to increase domestic wood procurement, unemployment will increase nearly six thousand and value of production will decrease even by over one milliard euros. Even if domestic wood procurement can compensate the reducing roundwood export amounts to some extent, the employment will decrease by few hundreds of employees and the loss in production value will be in the range of tens of thousands millions to over several hundred million euros. The only sector which will face positive income and employment effects is forestry because of increasing domestic loggings, transportation and other related services. The corresponding results for the Republic of Karelia due to the decreasing roundwood exports indicate also considerable increasing unemployment and decreasing value of output in regional economy, if the domestic production capacity especially in mechanical wood working industry is not able to increase production volumes. Keywords
Roundwood trade, income and employment effects, input-output method, Eastern Finland, Republic of Karelia, forest industry Available at
Pekka Ollonqvist, Finnish Forest Research Institute, Joensuu Research Unit, Yliopistokatu 6, FI-80100 Joensuu, Finland. E-mail [email protected] Other information
Working Papers of the Finnish Forest Research Institute 70 http://www.metla.fi/julkaisut/workingpapers/2008/mwp070.htm
2 Development of Forest Sector in Eastern Finland and in the Republic of Karelia in 1990 – 2006 ..............................................................................................7 2.1 Development in Eastern Finland.......................................................................................7
2.1.1 Roundwood Use and Imports .................................................................................7 2.1.2 Development of Production and Employment .....................................................10
2.2 Forest Sector in the Republic of Karelia.........................................................................12
3 Input-Output Analysis in Measuring Direct and Indirect Impacts of Output Change ....................................................................................................................14 3.1 Background of Input-Output Method .............................................................................14 3.2 Input-Output Tables........................................................................................................15 3.3 The Production Model ....................................................................................................18 3.4 Regionalisation of National Tables.................................................................................19 3.5 Possibilities and Constraints of Input-Output Method....................................................21
4 Data Description.....................................................................................................22 4.1 Supply and Use Tables in Finland ..................................................................................22 4.2 Provincial Data ...............................................................................................................22 4.3 Industries of Forest Sector ..............................................................................................23
5 Scenarios ................................................................................................................24 5.1 Regional Program Target and Sustainability Level ........................................................24 5.2 Import Scenarios.............................................................................................................25
6 Results ....................................................................................................................26 6.1 Changes in Total Output.................................................................................................26 6.2 Changes in Employment.................................................................................................28 6.3 Changes in Value Added ................................................................................................29 6.4 Changes in the Republic of Karelia ................................................................................30 6.5 Interpretation of Results .................................................................................................31
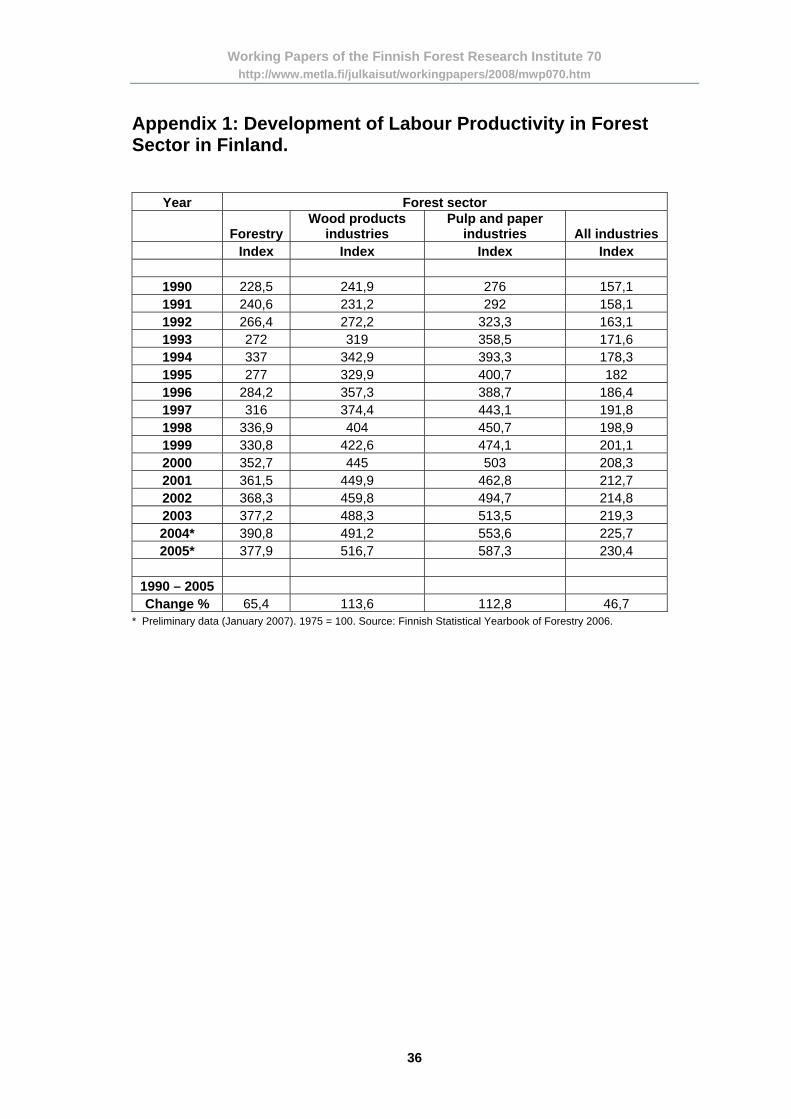
Appendix 1: Development of Labour Productivity in Forest Sector in Finland. ...36
Working Papers of the Finnish Forest Research Institute 70 http://www.metla.fi/julkaisut/workingpapers/2008/mwp070.htm
5
1 Introduction Imported roundwood and wood residues from Russia into Finland have become a necessary part of the wood procurement for Finnish forest industry. The implementation of Finland’s National Forest Programme 2010 was planned in the early 2000 by forecasting constant annual volumes in roundwood imports. However, annually the imported volumes of roundwood have increased more than 9 million cubic meters from that of the average annual level during 1995-1999 which was a base of NFP 2010 forecasts. The imported roundwood volumes from Russia into Finland have tripled from the early 1990s until 2006 consisting of 15.3 million cubic metres, which cov-ers about 80 percent of the total roundwood imports into Finland. Along with the increased im-port volumes also the distribution of the roundwood species has changed. While the birch pulp-wood is still the major imported assortment, the share of softwood logs has increased during the recent years (Tilli et al. 2004, Mutanen et al. 2005, Vinokurova et al. 2005). In 2006, Russian roundwood accounted for about 20 percent of the total industrial wood consumption in Finland. Therefore, the continuation of roundwood imports from Russia is currently one of the main items concerning the future and location of Finnish forest industry.
In 2007, the Federal Government of Russia introduced programme to increase tariffs of round-wood exports. When this programme, which was initiated with 10 €/m3 tariffs on softwood and hardwood logs in 1st July 2007, will gradually become fully effective until on 1st January 2011, the tariffs will be 50 €/m3 at minimum for all roundwood assortments. The purpose of these ex-port customs is to promote domestic Russian forest industry, create value added and to encour-age foreign investments in forest sector in Russia.1 When coming fully into force, it is evident that this programme pushes unit prices of Russian roundwood at the border up and makes the roundwood trade between Finland and Russia unprofitable.2 Even without any customs the bor-der prices of imported roundwood have risen considerably during the recent years threatening the continuation of roundwood trade (Mutanen and Toppinen 2007). Forest industry units in Eastern Finland, consisting of plants in forestry centres of North-Karelia, Southeast Finland, North- and South-Savo, have consumed majority of the imported roundwood from Russia. In 2006, the shares of domestic and imported roundwood of the total wood use were 58 and 42 percent, respectively. The corresponding shares of domestic and im-ported pulpwood were 53 and 47 percent. One fourth of the logs in the industrial use in Eastern Finland were of foreign origin. Thus, in the short run, the forest industry in Eastern Finland is highly dependent on roundwood imports, and is vulnerable on the decreases of roundwood trade from Russia. Especially, the mechanical wood working industry finds it difficult to replace im-ported log volumes with increase in domestic log procurement together with increasing stump-age prices via increasing domestic demand. Also, imports of birch pulpwood are difficult to substitute by domestic supply.
1 For more discussion on this subject, see Holopainen et al. (2006) and Ollonqvist et al. (2007). 2 While writing this paper, the export tariffs on roundwood are still under negotiation between Russia and EU, and alterations and reversals of announced program schedule are possible.
Working Papers of the Finnish Forest Research Institute 70 http://www.metla.fi/julkaisut/workingpapers/2008/mwp070.htm
6
Correspondingly, the exports of roundwood have become one of the main income sources for Russian forestry and the decrease of it is likely to have consequential effects in regional econo-mies in Northwest Russia and especially in the Republic of Karelia what concerns aggregate incomes and employment. While there are only limited possibilities for the domestic capacity to increase roundwood use and compensate reducing roundwood exports, the cease of international roundwood trade will affect not only on the profitability of wood procurement organisations but also on forestry in general together with indirect effects, for example, to forest road construc-tion. Similar effects can also be suspected to arise in other areas close to the Russian border. In particular, the effects close to Chinese border can be large while China is the largest importer of Russian roundwood. This paper, as a part of the wider research project “Development of Forest Sector in Northwest Russia and its impact in Finland”, uses input-output method to evaluate the direct and indirect effects of Russian roundwood export customs programme on income, employment and indus-trial use of roundwood in forest industries in Eastern Finland and in the Republic of Karelia. The calculations and scenarios for Eastern Finland are based on four different implementations of export customs, starting from tariffs on softwood logs and ending up announced tariffs for all roundwood assortments, and two different possibilities to increase and intensify domestic roundwood use. Due to the lack of data, the corresponding calculations for the Republic of Ka-relia are based only on the total cease of roundwood exports without any changes in domestic roundwood use or alternatively with doubled mechanical wood processing production in Kare-lia. The motivation for this study is not hard. Such economic effects have not been conducted ear-lier in Eastern Finland. Even though Forsman et al. (2007) and Honkatukia et al. (2008) include empirical macroeconomic evidence of reducing roundwood trade on whole Finland, their aims and methodology differ from that of ours. According to our knowledge, this study is among the first attempts to evaluate the reduction of roundwood exports on regional economy in Northwest Russia. This paper is organised as follows. Chapter 2 briefly considers the development of roundwood use, capacity, production and the corresponding changes in employment of Eastern Finland’s forest industry. Especially, the special emphasis is on describing the gradually in-creased dependence on the imported Russian roundwood after the collapse of Soviet Union on forest industry in Eastern Finland. Also, Chapter 2 briefly describes the corresponding devel-opments of roundwood exports and forest sector production in the Republic of Karelia. Chapter 3 describes the theoretical basis of input-output model and Chapter 4 presents the used data and the problems it involves. Based on the different roundwood import scenarios and possibilities to increase domestic cuttings presented in Chapter 5, Chapter 6 presents the direct and indirect effects of roundwood imports reductions on income, employment and value added in Eastern Finland. The corresponding but more concise results are given from the Republic of Karelia. Finally, Chapter 7 concludes with short discussion.
Working Papers of the Finnish Forest Research Institute 70 http://www.metla.fi/julkaisut/workingpapers/2008/mwp070.htm
7
2 Development of Forest Sector in Eastern Finland and in the Republic of Karelia in 1990 – 2006
2.1 Development in Eastern Finland 2.1.1 Roundwood Use and Imports The use of industrial roundwood in Eastern Finland has increased over 50 percent during the past fifteen years. The total volume of industrial use was 22.1 million m3 in 1990 and 34.4 mil-lion m3 in 2006. However, as can be seen in Fig. 1, this increase is mainly due to the increase in roundwood imports (including chips) while the increase of domestic roundwood use in Eastern Finland has been only moderate. The corresponding uses of domestic and imported roundwood were 17.5 and 4.6 million m3 in 1990 and 19.9 and 14.5 million m3 in 2006, respectively. Thus, the roundwood imports into Eastern Finland have more than tripled during the period. The rea-sons for this change are manifold.
Fig. 1 Roundwood use in Eastern Finland 1990 – 2006.
Source: Finnish Statistical Yearbook of Forestry 2006 In Russia, the early years of 1990s were the time of political and economical turmoil together with liberalisation of markets and foreign trade, and privatisation of forest industry and logging companies, lespromhozes. In order to survive, the companies started to participate in foreign trade of roundwood to receive currency incomes for maintaining daily business. Also, in Russia, there was willingness to trade those assortments, such as birch, which did not have any domes-tic demand. On the other hand, even though pine and birch pulpwood were import assortments even in the 1980s, Finnish forest enterprises discovered a profitable source of raw material and
0 5
10
1520
25
30
35
40
1990 1992 1994 1996 1998 2000 2002 2004 2006
Mill. m3
Import Domestic
Working Papers of the Finnish Forest Research Institute 70 http://www.metla.fi/julkaisut/workingpapers/2008/mwp070.htm
8
assortments that complemented and smoothed domestic insufficient supply under a time of dif-ferent price negotiation systems in Finland.3
Fig. 2 The ratio between imported and domestic roundwood in Eastern Finland. Source: Finnish Statistical Yearbook of Forestry 2006
Fig. 3 Structural changes of total roundwood imports in Eastern Finland. Source: Finnish Statistical Yearbook of Forestry 2006 The industrial use of roundwood in Eastern Finland has increased rather steadily after 1992. The only hiccough was in 2005, when there was prolonged dispute in Finnish pulp and paper indus-try. As Fig. 2 depicts, the share of imports in 1990 was only about one fifth of total industrial
3 For wider discussion on history of roundwood trade between Finland and Russia see Vinokurova et al. (2005). See also Ollonqvist and Viitanen (2004) and Tilli et al. (2004) for the details of different negotia-tions systems in Finland in 1990s.
0 102030405060708090
1990 1992 1994 1996 1998 2000 2002 2004 2006
%
Import Domestic
0 12345678
1990 1992 1994 1996 1998 2000 2002 2004 2006
Mill. m3
Pine Spruce Hardwood
Working Papers of the Finnish Forest Research Institute 70 http://www.metla.fi/julkaisut/workingpapers/2008/mwp070.htm
9
use of roundwood in Eastern Finland. The growth of this share increased rather moderately up to the year 1997, but after 1998 devaluation of rouble the share has increased strongly being 42 percent in 2006. The highest share of 43 percent was in 2005.
Fig. 4 Distribution of total roundwood imports into Eastern Finland. Source: Finnish Statistical Yearbook of Forestry 2006 Along with the structural changes in use between domestic and imported roundwood in Eastern Finland, the structure of imports has also changed (Fig. 3 and 4.). As discussed in more details in Tilli et al. (2004) and Mutanen et al. (2005), the imports from Russia in the early 1990s were mainly consisting of pine and birch pulpwood while the other import volumes were only mar-ginal. In 1990, the total share of pulpwood in roundwood imports was about 90 percent, that is, 4.2 million cubic metres. Birch was dominating import assortment with 68 percentage value, 2.8 million cubic metres. Since then, the volumes of imports have increased considerably together with wider distribution in assortments. Even though birch is still the main assortment to be im-ported, its relative share has been slightly decreasing after the mid 1990s with respect to the softwood, the imports of which have increased especially after the increase of price competi-tiveness due to the devaluation of rouble in 1998. In 2006, the imports of birch, consisting mainly in birch pulpwood, were 7.1 million cubic meters. Another structural change is the dis-tribution between pulpwood and logs, the share of latter has gradually increased since the late 1990s. Especially, the imports of spruce logs have increased considerably. However, the abso-lute quantity of pulpwood imports is still multifold compared to logs.
%
0
10
20
30
40
50
60
70
80
90
100
1990 1992 1994 1996 1998 2000 2002 2004 2006
%
Birch logs Pine logs Spruce logs Spruce pulpwood Pine pulpwood Birch pulpwood Chips
3.8
7.0
10.9
11.6
7.8
45.5
13.5
Working Papers of the Finnish Forest Research Institute 70 http://www.metla.fi/julkaisut/workingpapers/2008/mwp070.htm
10
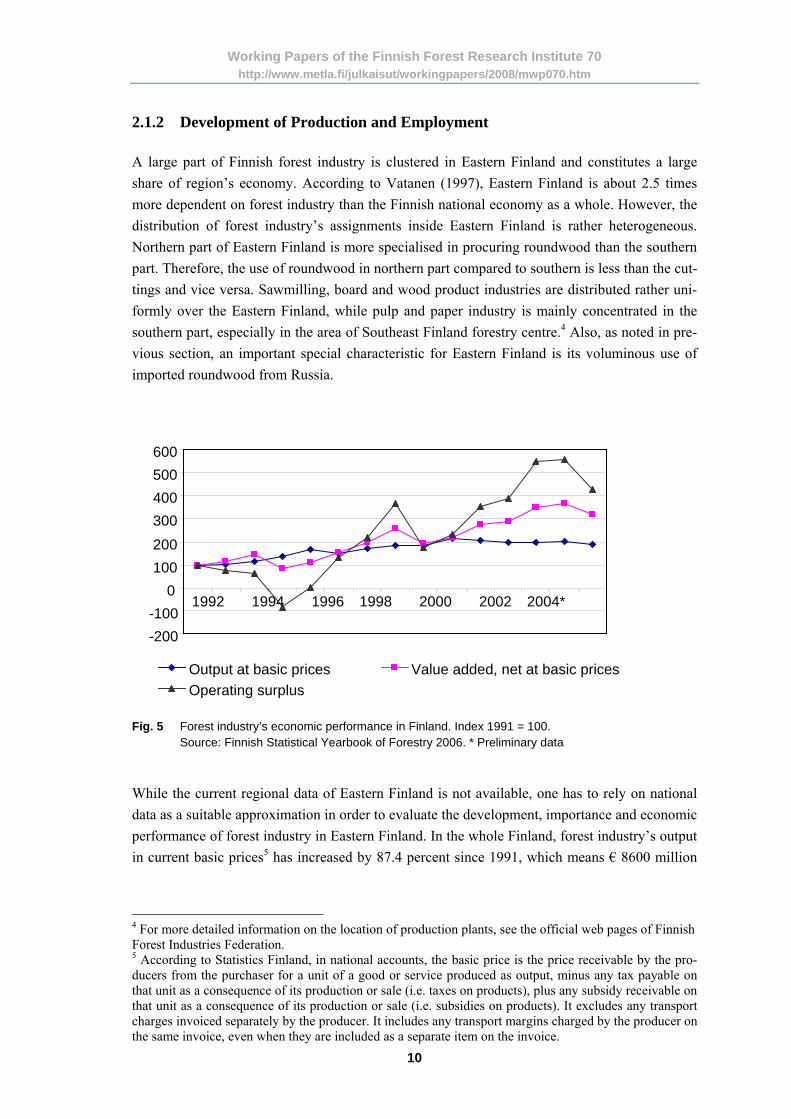
2.1.2 Development of Production and Employment A large part of Finnish forest industry is clustered in Eastern Finland and constitutes a large share of region’s economy. According to Vatanen (1997), Eastern Finland is about 2.5 times more dependent on forest industry than the Finnish national economy as a whole. However, the distribution of forest industry’s assignments inside Eastern Finland is rather heterogeneous. Northern part of Eastern Finland is more specialised in procuring roundwood than the southern part. Therefore, the use of roundwood in northern part compared to southern is less than the cut-tings and vice versa. Sawmilling, board and wood product industries are distributed rather uni-formly over the Eastern Finland, while pulp and paper industry is mainly concentrated in the southern part, especially in the area of Southeast Finland forestry centre.4 Also, as noted in pre-vious section, an important special characteristic for Eastern Finland is its voluminous use of imported roundwood from Russia.
Fig. 5 Forest industry’s economic performance in Finland. Index 1991 = 100.
Source: Finnish Statistical Yearbook of Forestry 2006. * Preliminary data While the current regional data of Eastern Finland is not available, one has to rely on national data as a suitable approximation in order to evaluate the development, importance and economic performance of forest industry in Eastern Finland. In the whole Finland, forest industry’s output in current basic prices5 has increased by 87.4 percent since 1991, which means € 8600 million
4 For more detailed information on the location of production plants, see the official web pages of Finnish Forest Industries Federation. 5 According to Statistics Finland, in national accounts, the basic price is the price receivable by the pro-ducers from the purchaser for a unit of a good or service produced as output, minus any tax payable on that unit as a consequence of its production or sale (i.e. taxes on products), plus any subsidy receivable on that unit as a consequence of its production or sale (i.e. subsidies on products). It excludes any transport charges invoiced separately by the producer. It includes any transport margins charged by the producer on the same invoice, even when they are included as a separate item on the invoice.
-200-100
0100 200 300 400 500 600
1992
1994
1996
1998
2000
2002
2004*
Output at basic prices Value added, net at basic prices Operating surplus
Working Papers of the Finnish Forest Research Institute 70 http://www.metla.fi/julkaisut/workingpapers/2008/mwp070.htm
11
growth during the period.6 Annually, this is slightly over € 570 million. As shown in Fig. 5, af-ter 1992, the output has increased rather steadily until 2000. After that the production values has been stable until the reduction in 2005 caused by prolonged labour dispute in paper industry in Finland.
In the early 1990s, the global economic crisis also caused a brief decline in Finnish forest indus-try’s operating surplus and value added. Value added has increased from € 1624 million in 1991 to € 2416 million in 2005. The growth of operating surplus has been even faster – boom from € 563 million in 1991 to € 2416 million in 2005. Even though the annual volatility of both operat-ing surplus and value added has been high, Finnish forest industry has managed simultaneously to improve its overall efficiency and to integrate in new global environment and competition. In Finland, labour productivity in forest sector has increased constantly during the whole ob-served time period. From 1990 to 2005, the labour productivity in Finland has increased 47 in general, in forest industry 114 and in forestry 65 percent, respectively. More exact figures are given in Appendix 1. Forest industry’s importance for Finnish and especially for Eastern Finland’s employment has had a decreasing trend during 1990 – 2005. As depicted in Fig. 6, the proportion of the forest industry’s total employment in Finland has decreased moderately by 1.5 percent unit to 4.3 percent in 2005, which means 43 thousand employees less. In North Karelia and North Savo forestry centres, the change has even been more remarkable because the relative change has been from 9.1 to 6.8 percent and from 7.4 to 5.7 percent, respectively. Therefore, the increased effectiveness and mechanisation in forestry has had a direct effect on employment’s development.
Fig. 6 Forest industry’s proportion of total employment by forestry centres.
Source: Statistics Finland.
6 Due to Statistics Finland’s division of the industries, the furniture industry in this chapter is excluded from output, value added and operating surplus.
0 2 4 6 8
10121416
1990 1992 1994 1996 1998 2000 2002 2004
%
Whole country Southeast Finland South Savo North Savo North Karelia
Working Papers of the Finnish Forest Research Institute 70 http://www.metla.fi/julkaisut/workingpapers/2008/mwp070.htm
12
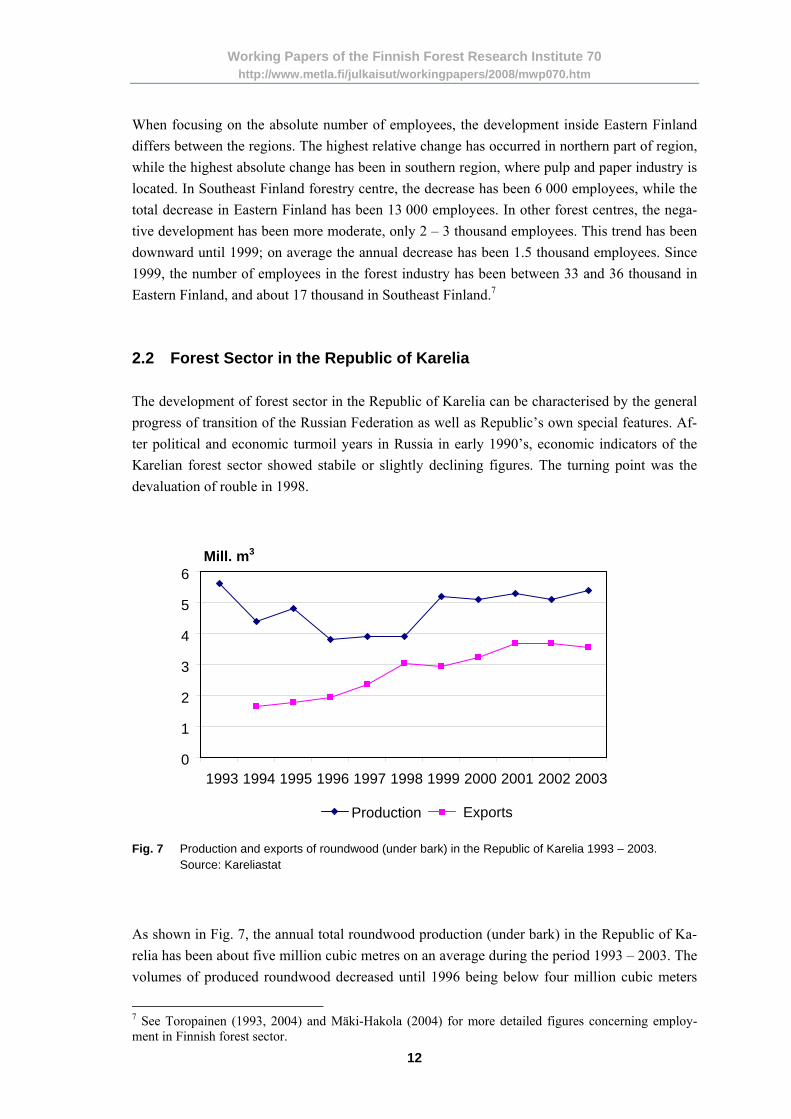
When focusing on the absolute number of employees, the development inside Eastern Finland differs between the regions. The highest relative change has occurred in northern part of region, while the highest absolute change has been in southern region, where pulp and paper industry is located. In Southeast Finland forestry centre, the decrease has been 6 000 employees, while the total decrease in Eastern Finland has been 13 000 employees. In other forest centres, the nega-tive development has been more moderate, only 2 – 3 thousand employees. This trend has been downward until 1999; on average the annual decrease has been 1.5 thousand employees. Since 1999, the number of employees in the forest industry has been between 33 and 36 thousand in Eastern Finland, and about 17 thousand in Southeast Finland.7 2.2 Forest Sector in the Republic of Karelia The development of forest sector in the Republic of Karelia can be characterised by the general progress of transition of the Russian Federation as well as Republic’s own special features. Af-ter political and economic turmoil years in Russia in early 1990’s, economic indicators of the Karelian forest sector showed stabile or slightly declining figures. The turning point was the devaluation of rouble in 1998.
Fig. 7 Production and exports of roundwood (under bark) in the Republic of Karelia 1993 – 2003.
Source: Kareliastat
As shown in Fig. 7, the annual total roundwood production (under bark) in the Republic of Ka-relia has been about five million cubic metres on an average during the period 1993 – 2003. The volumes of produced roundwood decreased until 1996 being below four million cubic meters
7 See Toropainen (1993, 2004) and Mäki-Hakola (2004) for more detailed figures concerning employ-ment in Finnish forest sector.
Working Papers of the Finnish Forest Research Institute 70 http://www.metla.fi/julkaisut/workingpapers/2008/mwp070.htm
13
per annum up to 1998. Then, after the devaluation of rouble, the production volumes climbed rapidly to about 5 million cubic metres. However, period’s last figure, 5.4 million cubic meters in 2003, is only 96 percent of the total production volume in 1993. At the same time, the price competitiveness of exported roundwood improved and export volumes started to increase ex-cept a brief hiccough in 1998 – 1999. The share between domestic consumption of roundwood and exports has declined substantially after the early 1990s, even though this share has re-mained rather stable during 2000s.
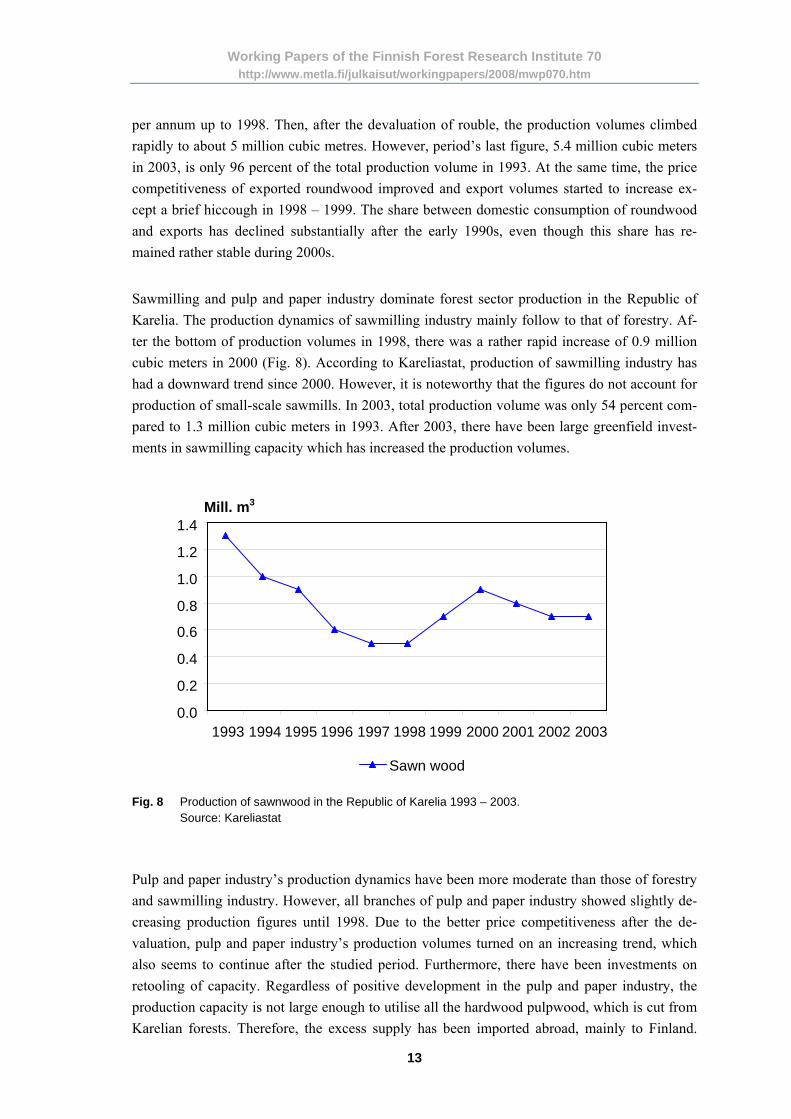
Sawmilling and pulp and paper industry dominate forest sector production in the Republic of Karelia. The production dynamics of sawmilling industry mainly follow to that of forestry. Af-ter the bottom of production volumes in 1998, there was a rather rapid increase of 0.9 million cubic meters in 2000 (Fig. 8). According to Kareliastat, production of sawmilling industry has had a downward trend since 2000. However, it is noteworthy that the figures do not account for production of small-scale sawmills. In 2003, total production volume was only 54 percent com-pared to 1.3 million cubic meters in 1993. After 2003, there have been large greenfield invest-ments in sawmilling capacity which has increased the production volumes.
Fig. 8 Production of sawnwood in the Republic of Karelia 1993 – 2003. Source: Kareliastat Pulp and paper industry’s production dynamics have been more moderate than those of forestry and sawmilling industry. However, all branches of pulp and paper industry showed slightly de-creasing production figures until 1998. Due to the better price competitiveness after the de-valuation, pulp and paper industry’s production volumes turned on an increasing trend, which also seems to continue after the studied period. Furthermore, there have been investments on retooling of capacity. Regardless of positive development in the pulp and paper industry, the production capacity is not large enough to utilise all the hardwood pulpwood, which is cut from Karelian forests. Therefore, the excess supply has been imported abroad, mainly to Finland.
Working Papers of the Finnish Forest Research Institute 70 http://www.metla.fi/julkaisut/workingpapers/2008/mwp070.htm
14
Pulp and paper industry’s total production in 2003, 1.3 million tons, was 22 percent higher than in 1993.
05000
100001500020000250003000035000400004500050000
1997 1998 1999 2000 2001 2002 2003 2004 2005 2006
Forestry Mechanical forest industryChemical forest industry Forest sector total
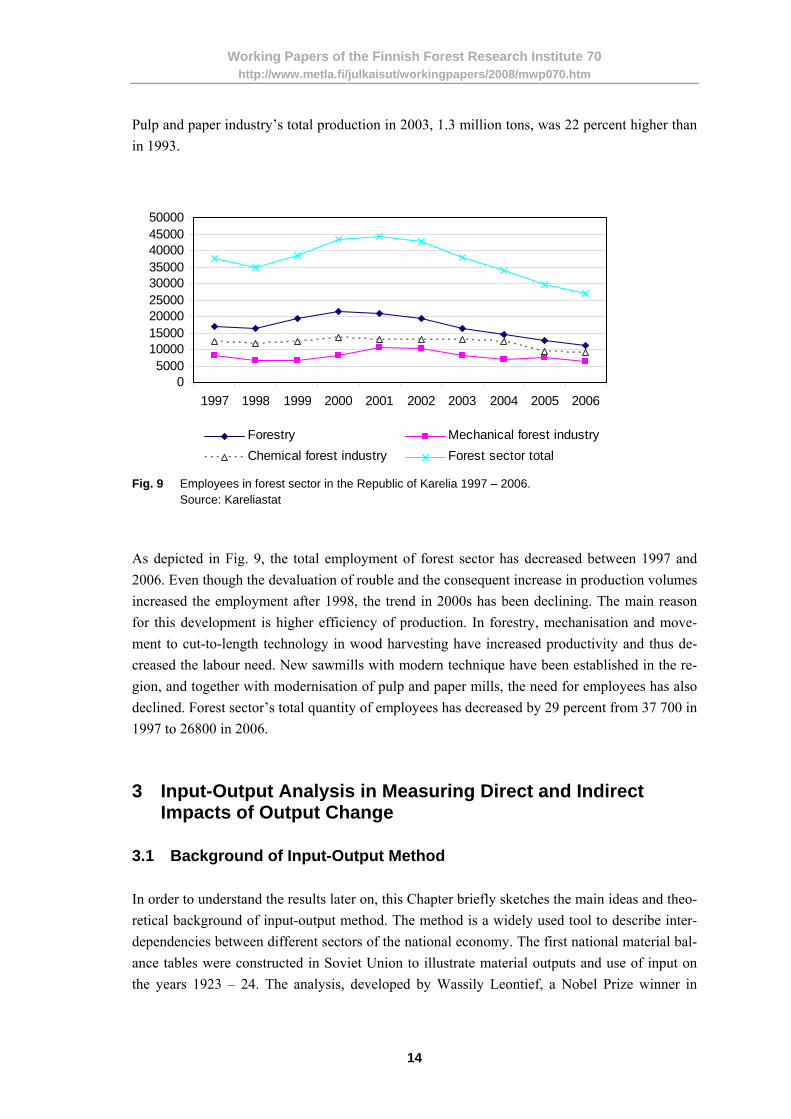
Fig. 9 Employees in forest sector in the Republic of Karelia 1997 – 2006.
Source: Kareliastat As depicted in Fig. 9, the total employment of forest sector has decreased between 1997 and 2006. Even though the devaluation of rouble and the consequent increase in production volumes increased the employment after 1998, the trend in 2000s has been declining. The main reason for this development is higher efficiency of production. In forestry, mechanisation and move-ment to cut-to-length technology in wood harvesting have increased productivity and thus de-creased the labour need. New sawmills with modern technique have been established in the re-gion, and together with modernisation of pulp and paper mills, the need for employees has also declined. Forest sector’s total quantity of employees has decreased by 29 percent from 37 700 in 1997 to 26800 in 2006. 3 Input-Output Analysis in Measuring Direct and Indirect
Impacts of Output Change 3.1 Background of Input-Output Method In order to understand the results later on, this Chapter briefly sketches the main ideas and theo-retical background of input-output method. The method is a widely used tool to describe inter-dependencies between different sectors of the national economy. The first national material bal-ance tables were constructed in Soviet Union to illustrate material outputs and use of input on the years 1923 – 24. The analysis, developed by Wassily Leontief, a Nobel Prize winner in
Working Papers of the Finnish Forest Research Institute 70 http://www.metla.fi/julkaisut/workingpapers/2008/mwp070.htm
15
1973, widens the Walrasian general equilibrium model.8 In the national economy, enterprises produce different commodities, which can be used either by other enterprises as intermediate products, or by households, public and export sector as final products. If the production is con-sidered from the producer’s side, it is called output. If it is considered from the side of its use, it is either input for other producers in their production or final product for final user. The analysis simply answers to two questions: “Who gets from whom?” and “Who gives to whom?”9 In the analysis, output is composed into two different parts. The part of production, which is used either by producer itself or by other producers to produce other commodities, is called in-termediate production. If the output of production is used by households, non-profit-making institutions, government and municipal sector, or used in gross capital formation or exported, it is called final product production. Together the intermediate and final productions are called total production or output. 3.2 Input-Output Tables Input-output analysis is based on input-output tables. In these tables, which in Finland are col-lected by Statistics Finland, the national economy is divided into different production sectors. The most wide-ranging division used by Statistics Finland consists of 182 different lines of business. For different purposes these lines can be aggregated if needed. Input-output table, as presented in the Fig. 7, is received by combining both input and output data. Before making any model based on the input-output table, three important assumptions are re-quired. First, each industry produces only one homogeneous commodity. Second, each industry uses a fixed input ratio for the production of its output. Third, production in every industry is subject to constant returns to scale in a way that a k-fold change in every input will result in an exactly k-fold change in the output. (Chiang 1984, p.116).
8 The idea of using input and output tables as a basis of actual input-output analysis was represented in Leontief’s (1951) book “The Structure of American Economy 1919 – 39”. The other important developer of the analysis was Sir Richard Stone, Nobel Prize winner in 1984. 9 For more information of input-output analysis’ history, see also Miller (1985) and Forssell (1985).
Working Papers of the Finnish Forest Research Institute 70 http://www.metla.fi/julkaisut/workingpapers/2008/mwp070.htm
In order to better understand the structure of the table, consider the four quarters in Fig. 10. The upper quarter on the left is (nxn) matrix, which includes economy’s output for intermediate products. This matrix is called X = [xij], and its elements xij show how much industry j uses in-termediate input from industry i’s production, or reversely how much industry i’s production is used as an intermediate input for industry j. Vertical (nx1) vector x = {x.j} shows industry j’s structure of intermediate use, and column sum
(1) ∑=
=n
iijj xx
1.
shows the total use of intermediates in the industry j. The row sum
(2) ∑=
=n
jiji xx
1.
is the use of industry i’s production as intermediate inputs. (nxm) matrix in the upper corner on the right is called final product matrix, and it includes con-sumption, capital formation and export. It is denoted as Y = [yih], and the elements yih illustrate how much production from industry i is used as final product by category h. Vertical vector y = {y.h} shows the structure of the category h, so that its cell yih reveals how much industry i adds total sum of category h. The column sum
(3) ∑=
=n
iihh yy
1.
Working Papers of the Finnish Forest Research Institute 70 http://www.metla.fi/julkaisut/workingpapers/2008/mwp070.htm
17
is the total sum of category h. The row sum
(4) ∑=
=m
hihi yy
1.
shows how much industry i’s production is used as final product. Lower quarter on the left is (lxn) primary input matrix Z = [zkj] consisting of imports and value added. Imports are corrected by taking into account cif/fob correction, consumers' expenditure in abroad, foreign consumers' expenditure in Finland and product taxes minus product subsidies. Value added at basic prices consists of compensation of employees, other taxes and subsidies on production, consumption of fixed capital and net operating surplus. In Fig. 7, they are presented as imports, salaries, operation surplus and indirect taxes for the sake of simplicity. The column sum
(5) ∑=
=k
kkjj zz
1.
shows the total use of primary inputs in industry j. The column elements zkj illustrate how much different primary inputs are used in industry j’s production. The row elements zkj show the allo-cation of primary input k between the industries, respectively. Lower quarter on the right illustrates the use of primary inputs as final products. Normally, in calculations this quarter is empty, because its information remains outside the formulated mod-els. However, in national accounting it is used. Vertical (nx1) vector x = {xi} shows the total production of industries. The elements
(6) ∑ ∑= =
+=+=n
j
m
hihijiii yxyxx
1 1..
illustrate the total production of industry i. Respectively, the (1xn) row vector x = {xj} shows the total production of industries in a way that the elements (7) ∑ ∑
= =
+=+=n
j
k
kkjijjjj zxzxx
1 1..
illustrate the total production of industry j. Thus, the following connection between the rows and columns of matrix can be depicted: (8) ∑ ∑∑ ∑
= == =
=+=+=+=+=n
jjjj
k
kkjij
n
j
m
hihijiii xzxzxyxyxx
1..
11 1.. .
Input-output table gives a good description of flows of inputs and outputs in economy. It also describes average structure of industries’ costs, and it gives logical framework, based on coher-ent construct, for different analyses.
Working Papers of the Finnish Forest Research Institute 70 http://www.metla.fi/julkaisut/workingpapers/2008/mwp070.htm
18
3.3 The Production Model Following Forssel (1985) and Toropainen (1998), building up the production model starts from the equation
(9) ,∑ += iiji yxx where the total use of production (xi) from industry i is divided between intermediate (Σxij) and final production (yi ), respectively. Information in input-output tables is given in monetary values. For wider usability, however, the proportions for each value, called input coefficients, are needed. Input coefficients
(10) xxa
j
ij
ij = are calculated by dividing every single cell xij of column j with respect to the sum of column j. These coefficients reveal how much production from industry i is used as intermediate by indus-try j to produce one production unit. Input coefficients are assumed to be fixed. While the equa-tion (10) results xij = aijxj, substituting this back to the row equation (9), equation for production model can be written as
(11) ∑=
=+=n
jiiiji inyxax
1,...,1, ,
or with matrix notation:
(12) yAxx += , where x and y are (nx1) vectors representing total production and final use of products of indus-tries i = 1,…,n, respectively. A is (nxn) input coefficient matrix. While the production model has as many linear equations to be solved as there are unknown variables and while the total pro-ductions of industries are in the production model also as dependent variable, it is convenient to solve the equation (12) with respect to x:
(13) yAIx 1)( −−= . (I – A)-1 = [bij] is called Leontief’s inverse matrix. It depicts how total productions of industries are dependent on demand of final products. Parameter bij shows how much production from in-dustry i is needed to receive one final product unit in industry j. The columns of inverse matrix reveal how much production is needed from each industry (rows) to get produced each indus-try’s (column) one final product unit. The column sum of inverse matrix reveals the aggregated total production needed to produce one final product unit of column’s industry. The diagonal of Leontief’s matrix includes industry’s direct and indirect effects on industry’s own production. Thus, diagonals are always more than unity. The other elements of matrix include industries’ indirect effects on production of other ones.
Working Papers of the Finnish Forest Research Institute 70 http://www.metla.fi/julkaisut/workingpapers/2008/mwp070.htm
19
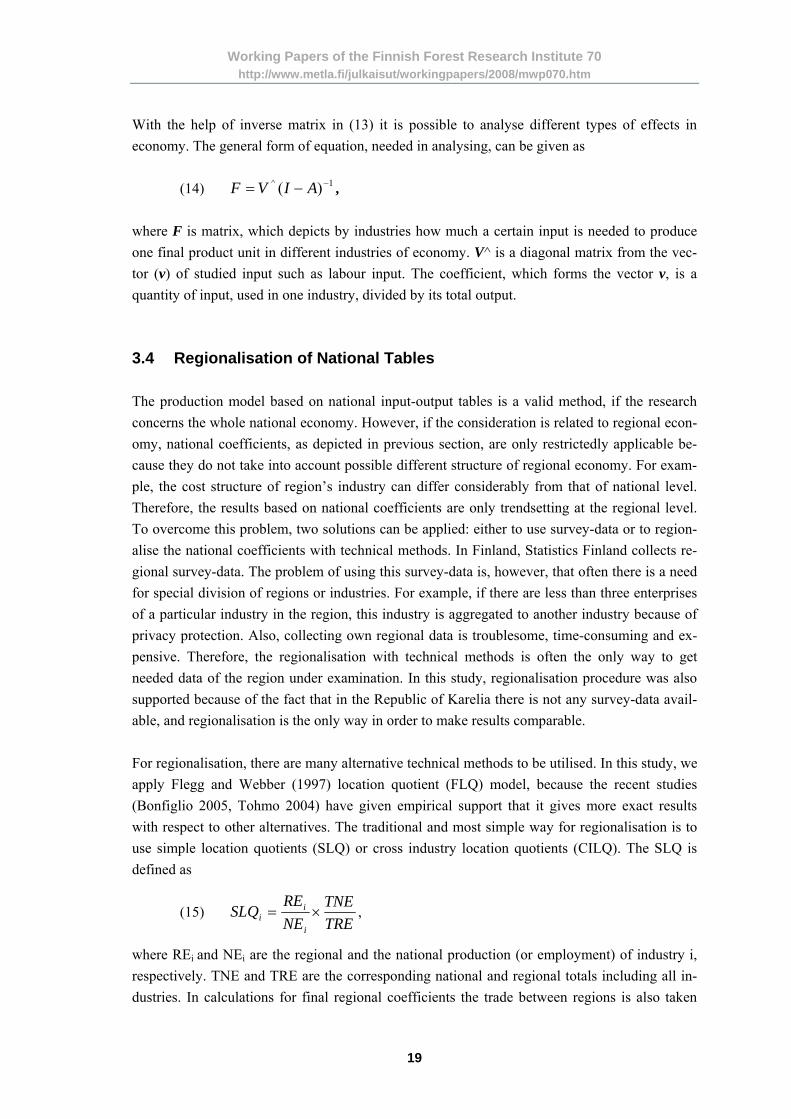
With the help of inverse matrix in (13) it is possible to analyse different types of effects in economy. The general form of equation, needed in analysing, can be given as
(14) 1^ )( −−= AIVF , where F is matrix, which depicts by industries how much a certain input is needed to produce one final product unit in different industries of economy. V^ is a diagonal matrix from the vec-tor (v) of studied input such as labour input. The coefficient, which forms the vector v, is a quantity of input, used in one industry, divided by its total output. 3.4 Regionalisation of National Tables The production model based on national input-output tables is a valid method, if the research concerns the whole national economy. However, if the consideration is related to regional econ-omy, national coefficients, as depicted in previous section, are only restrictedly applicable be-cause they do not take into account possible different structure of regional economy. For exam-ple, the cost structure of region’s industry can differ considerably from that of national level. Therefore, the results based on national coefficients are only trendsetting at the regional level. To overcome this problem, two solutions can be applied: either to use survey-data or to region-alise the national coefficients with technical methods. In Finland, Statistics Finland collects re-gional survey-data. The problem of using this survey-data is, however, that often there is a need for special division of regions or industries. For example, if there are less than three enterprises of a particular industry in the region, this industry is aggregated to another industry because of privacy protection. Also, collecting own regional data is troublesome, time-consuming and ex-pensive. Therefore, the regionalisation with technical methods is often the only way to get needed data of the region under examination. In this study, regionalisation procedure was also supported because of the fact that in the Republic of Karelia there is not any survey-data avail-able, and regionalisation is the only way in order to make results comparable. For regionalisation, there are many alternative technical methods to be utilised. In this study, we apply Flegg and Webber (1997) location quotient (FLQ) model, because the recent studies (Bonfiglio 2005, Tohmo 2004) have given empirical support that it gives more exact results with respect to other alternatives. The traditional and most simple way for regionalisation is to use simple location quotients (SLQ) or cross industry location quotients (CILQ). The SLQ is defined as (15)
TRETNE
NERE
SLQi
ii ×= ,
where REi and NEi are the regional and the national production (or employment) of industry i, respectively. TNE and TRE are the corresponding national and regional totals including all in-dustries. In calculations for final regional coefficients the trade between regions is also taken
Working Papers of the Finnish Forest Research Institute 70 http://www.metla.fi/julkaisut/workingpapers/2008/mwp070.htm
20
into account by multiplying national input coefficients with SLQs in industries, where SLQ < 1. If SLQ ≥ 1, national input coefficients are used as such without any adjustment. The CILQ for industries i and j is calculated as (16)
j
j
i
iij NE
RENERECILQ /= ,
where REf and NEf, f = i,j, are regional and national output (or employment) of supplying indus-try i and using industry j. If CILQij < 1, regionalisation is implemented by multiplying national coefficient with CILQij. According to Flegg et al. (1995, p. 550), no adjustment is made, if CILQij ≥ 1. Because CILQ does not take into account size of local industry, Smith and Morrison (1974, p. 66) suggested replacing diagonals with SLQs. Unfortunately, the direct application of both SLQ and CILQ leads to biased results. Both meth-ods systematically overestimate trading flows (selling and buying) inside the region, which re-sults in overestimated input coefficients. Also, an unfavourable characteristic of CILQ is that it does not take into account the relative size of the region, TRE/TNE. Therefore, to overcome these problems, Flegg et al. (1995) presented location quotient (FLQ) correction, which does not have above-mentioned faults of SLQ or CILQ. The idea of FLQ is to correct CILQ matrix, where SLQs are in diagonal, with special multiplier in a way that the relative size of the region is taken into account. The formula of FLQ is
(17) ijij CILQFLQ ×= *λ where
(18) σ
λ ⎥⎦
⎤⎢⎣
⎡⎟⎠⎞
⎜⎝⎛ +=
TNETRE1log* 2 .
In the equation (18) σ is parameter, 0 < σ < 1, which have to be estimated.10 The interpretation and application are similar to that of CILQ. If FLQij < 1, it is multiplied with corresponding element of national input coefficient table and, if FLQij ≥ 1, there is no need for adjustment. After these corrections the regional input-output matrix can be used for regional studies as explained in the case of national model. In order to evaluate the changes in Eastern Finland, two complement models are used in calcu-lations. The first one measures the changes of import based production, when import of round-
10 In practice, there are two alternative ways to formulate the correcting multiplier. As shown in Flegg
and Webber (1997), the first form can be represented as ⎟⎠⎞
⎜⎝⎛ +=
TNETRE
TNETRE 1log/ 2λ . However, while
λ is insensitive to variations in TRE/TNE, revised version of FLQ, where correcting multiplier is denoted with λ*, was developed. While most empirical research (Bonfiglio 2005, Tohmo 2004) also gives support for λ*, it is also applied in this study.
Working Papers of the Finnish Forest Research Institute 70 http://www.metla.fi/julkaisut/workingpapers/2008/mwp070.htm
21
wood is changed. The second model evaluates the effects on domestic roundwood based pro-duction, when supply of domestic roundwood changes. Combining results of these calculations results on total effect for different scenario combinations. Technically, the calculations for Eastern Finland are based on the parameter value σ = 0.1 in regionalisation while in the Republic of Karelia the value is assumed to be σ = 0.3. The differ-ence is due to available and used data. The main focus was naturally on forest industries and forestry. Experiments with Finnish data by different values of σ showed that the value of 0.1 gave the most exact estimate of the roundwood use in sawmilling industry.11 For the Republic of the Karelia, exact figures of production are not available. Therefore, there is a risk to overes-timate regional multipliers, when national tables are regionalised. According to Bonfiglio (2005), this problem can be avoided by using augmented FLQ with σ = 0.3. 3.5 Possibilities and Constraints of Input-Output Method Input-output analysis is undoubtedly the most widely used method to assess different direct and indirect effects between the industries in national and regional economy. Its concepts are inter-nationally uniform and the empirical applications are wide. One major advantage of the analysis is that it needs only exiguous data for calculations. Also, even though the results are presented at values, they represent quantities in fixed prices, which are interpretatively easier to analyse. However, input-output method suffers from a few shortcomings which one should be aware of when applying and interpreting the results. One shortcoming is that the analysis is based only on one year’s cross-sectional data and, therefore, it is static. Another deficiency is that the coeffi-cients, which describe the interdependencies between different industries and sectors in econ-omy, are assumed to be fixed. Also, inputs are assumed completely flexible, and the analysis takes into account only the viewpoint of demand without any attention to supply impacts. When findings of input-output analysis are interpreted, one has to remember that input-output coeffi-cient functions are assumed as linear, while the real world can be non-linear. That is, the results can be sensitive for example for demand and supply elasticities which are assumed completely elastic in input-output analysis. In spite of these shortcomings, however, Ainali (2000) has shown empirical evidence that the precision of the results is definite in the time scale of 5 to 10 years.
11 This result is also supported by Bonfiglio (2005) who showed that the parameter value between 0.08 – 0.27 results on most reliable outcome.
Working Papers of the Finnish Forest Research Institute 70 http://www.metla.fi/julkaisut/workingpapers/2008/mwp070.htm
22
4 Data Description 4.1 Supply and Use Tables in Finland In Finland, Statistics Finland collects the supply and use tables, which are the basis of input-output tables. Based on national accounting, these tables describe the final and intermediate product flows between the industries in the national economy. In supply tables, national econ-omy’s production and imports of products and services are described in the level of commodity group. The use tables describe the use of these products and services, that is, whether the prod-ucts are used for intermediate or final use of production. Supply is valuated in basic prices while the use is valuated in purchaser’s prices. Input-output tables describe the use of the output of industries as intermediate products of other industries or for final use. The industrial classification used in supply and use tables is based on the Standard Industrial Classification TOL 2002 used in national accounting. TOL 2002 is based on EU’s industrial classification NACE Rev 1. The commodity group classification used in compiling stage builds up on the EU's classification by activity (CPA) and applied in national accounts. Although Sta-tistic Finland uses also surveys in compiling, most of the data is taken from different national statistics, among which the most important are national accounting, different production and structure statistics of economy, and statistics of foreign trade. Establishing supply and use tables starts from product level of CPA classification including 952 different products. Products are aggregated in compilation stage to 182 industries. In published version, there are either 34 or 60 industries depending on the required aggregation. In this study, basic data set of 65 industries’ input-output tables of production, imports and employment from year 2003, are utilised. Division of industries will be restructured to include 33 industries retain-ing seven industries of forest sector. 4.2 Provincial Data Even though Statistics Finland produces provincial input-output tables as well, for our purposes, however, they are not usable because of three reasons. First, the division of regions in these ta-bles is established according to Finnish provinces. In this study, however, the target area is Eastern Finland comprised according to division of forestry centres of Eastern Finland. Thus, the regional division of Statistics Finland and the studied area differ from each other. Second problem of provincial tables is the industrial distribution; forest sector consists only of three industries – forestry, other wood products and pulp and paper. Furthermore, pulp and paper in-dustry is combined to printing and publishing industry due to the business data protection, be-cause an industry can be published only if there are at least three manufacturers in the area Therefore, the contemporary regional tables are not suitable for this analysis. Finally, data of provincial input-output tables cannot be aggregated because the roundwood imports from rest of Finland cannot be separated from the trade inside the studied region.
Working Papers of the Finnish Forest Research Institute 70 http://www.metla.fi/julkaisut/workingpapers/2008/mwp070.htm
23
The aggregation problems can be avoided by regionalising above-mentioned national tables from year 2003 with technical methods illustrated in Chapter 3. The needed regionalised pro-duction, value added and employment data was purchased from Statistics Finland. Due to lack of time and money we were restricted not to use the existent survey-methods. Besides this basic data, the complete analysis needed data for total output, employment and roundwood use and imports from Russia. Required total output and employment data were also purchased from Sta-tistics Finland. While employment coefficients are most rapidly changing coefficients of econ-omy’s input table, the regional employment coefficients applied in this study were updated to the level of 2007 using the average changes of productivity (national figures by main industrial classes). Thus, the estimated coefficients illustrate employment in man-years in 2007 with fixed 2003 prices. Other calculations are based on 2003 level. The data concerning the use of domes-tic and imported roundwood was received from the official statistics of Finnish Forest Research Institute. 4.3 Industries of Forest Sector In this study, the forest sector in Eastern Finland is divided in six different industries and for-estry. This division is made according to the following list:
1. Sawmilling industry consists of industries producing sawn, planed and impregnated wood.
2. Board industry produces veneer, plywood and other wood-based boards. 3. Other wood products industry produces wooden houses, other carpenter products used
in house building, other wooden materials, wooden packaging materials and other wooden products belongs to other wood products industry.
4. Furniture industry consists of industries producing fittings, non-metallic furniture, mat-tresses, awnings and blinds.
5. Pulp and paper industry produces cellulose, semi-chemical and mechanical pulp, paper and paperboard.
6. Paperboard products industry produces fibreboard, sacks and pouches, other packages made from paper or paperboard, wallpapers and other paper or board products.
Forestry includes the following activities: growing of forest, timber harvesting, other forestry and logging activities as well as forestry and logging related service activities. In the Republic of Karelia, the available data given by Rosstat consists only of one industry de-scribing the whole forest sector. For more detailed analysis, this sector is disaggregated for log-gings, wood processing and pulp and paper sectors. Disaggregated input-output matrix was cal-culated as a sum of augmented and distinguishing matrixes according to the method described in Wolsky (1984). Augmented matrix was constructed according to the shares of new three sec-tors, and distinguishing matrix was constructed with the use of Finnish national tables for
Working Papers of the Finnish Forest Research Institute 70 http://www.metla.fi/julkaisut/workingpapers/2008/mwp070.htm
24
choosing parameters describing differences between new three sectors with respects to demand and supply to other sectors and to each other. In contrast to Eastern Finland, employment of the Republic of Karelia was studied using pure employment coefficients from 2003. 5 Scenarios 5.1 Regional Program Target and Sustainability Level It is evident that the planned programme to increase custom tariffs for roundwood exports in Russia and the consequent decreasing imports of roundwood do not affect fully and at the corre-sponding magnitude on the use of roundwood in Eastern Finland. Certain proportion of the de-creasing roundwood import volumes to Finland can be compensated by increasing domestic wood procurement and roundwood supply. In calculations, we apply two distinct calculatory ways to increase domestic roundwood use. The first assessment is based on Regional Forest Programme targets in 2010. The second alternative is based on Sustainable Annual Allowable Cutting target programme for the years 2006 – 2015. The major difference between these two approaches is the assumptions behind the targets.
1) Regional forest programme is a part of Finnish forest planning. In the programme, allow-able cutting potential is estimated by regional boards consisting of forestry professionals and of representatives of various interest groups. Regional forest programmes lead up to stabilise targets of different use’s of forest. The aim of programme is to find out maxi-mum level of cuttings by taking into account economical, ecological and social aspects.
2) In sustainable annual allowable cutting target programme, the persistence of forest use
and different specific natures of forestry centres is considered. The maximum level of cuttings, which take cognizance of the sustainability both in economical mean and wood production, is determined by maximising the present value of net income with interest rate of four percent. The total cuttings and net income are always at least on the level of the previous decade. The accumulation of logs remain at least on the level of first decade, and the productive value of growing stock calculated with four percent interest rate in the end of period is at least on the level of starting time. This ensures the sustainability of wood production. The growth-removal ratio, forest’s age classification or the quantity of regeneration cutting are not constrained in programme. Also, there is not any requirement for sustainability by species. The amounts of cuttings are assessed as maximum of allowable cuttings, if the sustainability of wood production on the area of forestry centre is considered as aspired.12
12 See Nuutinen et al. (2007) for more detailed description of the programmes.
Working Papers of the Finnish Forest Research Institute 70 http://www.metla.fi/julkaisut/workingpapers/2008/mwp070.htm
25
Table 1. Cuttings in 2003 and cutting targets according to different programmes.
1000 cubic meters per annum. Fuel wood is excluded from the figures.
As depicted in Table 1, cuttings in Eastern Finland can be increased only modestly with respect to the realised cuttings in 2003. According to regional forest programme, total fellings can be increased by 13 percent while in sustainable annual allowable cutting target programme fellings can be increased by 20 percent. Generally, the fellings of pine logs and pulpwood can be in-creased to some extent. In the case of spruce logs and pulpwood, the fellings in 2003 are close or even above the sustainable level, respectively. While total hardwood (mainly birch) fellings are not yet close to the sustainable level, their economically profitable utilisation may be diffi-cult. 5.2 Import Scenarios As described in previous section, the scenario calculations concerning increase of wood pro-curement in Eastern Finland are based on the targets of 1) Regional Forest Programme 2010 or 2) Sustainable Allowable Annual Cuttings. The scenarios for Russian roundwood imports are dissected as follows:
a) Imports of coniferous logs are ceased. Other roundwood imports remain unchanged. b) Imports of all logs are ceased. Other roundwood imports remain unchanged. c) Imports of all coniferous roundwood and hardwood logs are ceased. Hardwood pulp-
wood imports remain unchanged. d) All roundwood imports are ceased.
Supply of chips is assumed to be unchanged. Because the scenarios a and b concern of decreas-ing imports of logs, which are mainly used in mechanical wood processing industry, the calcula-tions neglect pulp and paper industry. In reality, however, when imports of pulpwood remain
Cuttings in
2003 Regional Forest
Programme Sustainable Annual Allowable
Cuttings Pine 4025 4860 5484
Spruce 5414 5220 5870 Hardwood 624 790 1054
Logs
Total 10064 10870 12407 Pine 3662 4600 4100
Spruce 3445 3410 3288 Hardwood 2007 2840 3183
Pulpwood
Total 9114 10850 10572 Pine 7687 9460 9584
Spruce 8860 8630 9158 Hardwood 2631 3630 4237
Total
Total 19178 21720 22979
Working Papers of the Finnish Forest Research Institute 70 http://www.metla.fi/julkaisut/workingpapers/2008/mwp070.htm
26
unchanged, the increasing demand for logs leads to increasing harvestings which produce also pulpwood as by-products and leads to oversupply of pulpwood in the markets. The scenarios a and b do not examine these effects. In scenarios c and d the economical effects are analysed on all forest industries. 6 Results Due to the structure and methodology of input-output method, the outcomes from the analyses are reported as precise quantitative estimates of the production, value added and employment. However, it must be emphasised that the calculated results must be interpreted as relative mag-nitudes. Thus, their information is more descriptive than strictly concluding. The reported fig-ures include both direct and internal indirect effects of industry to be examined. Multiple effects of an industry on other forest industries are included in effects on other industries. Summation of results is represented in Fig. 11 and in Tables 2, 3 and 4. 6.1 Changes in Total Output In scenario 1a, targets of regional forest programmes are realised and imports of coniferous logs are ceased. According to this scenario, Eastern Finland’s total industrial production declines only slightly. Decrease of total production in mechanical wood processing industry is € 299 mil-lion, but variation between the industries is significant. In absolute terms, the fall is most crucial in sawmilling industry. In furniture industry, the decrease in production is relatively largest. Multiple effects on other forest industries and on industries outside forest sector reveal also a decrease in their production. Multiple effects of mechanical wood processing industry’s produc-tion changes on forestry, which increases by € 34 million, are based on increasing domestic roundwood procurement which is same in scenarios 1a and 1b.
Fig. 11 Relative changes of total output and employment in different import scenarios, when targets of regional forest programme are realised.
-6 -5 -4 -3 -2 -1 0 1 2
a b c d
%
Total Output Employment
Working Papers of the Finnish Forest Research Institute 70 http://www.metla.fi/julkaisut/workingpapers/2008/mwp070.htm
27
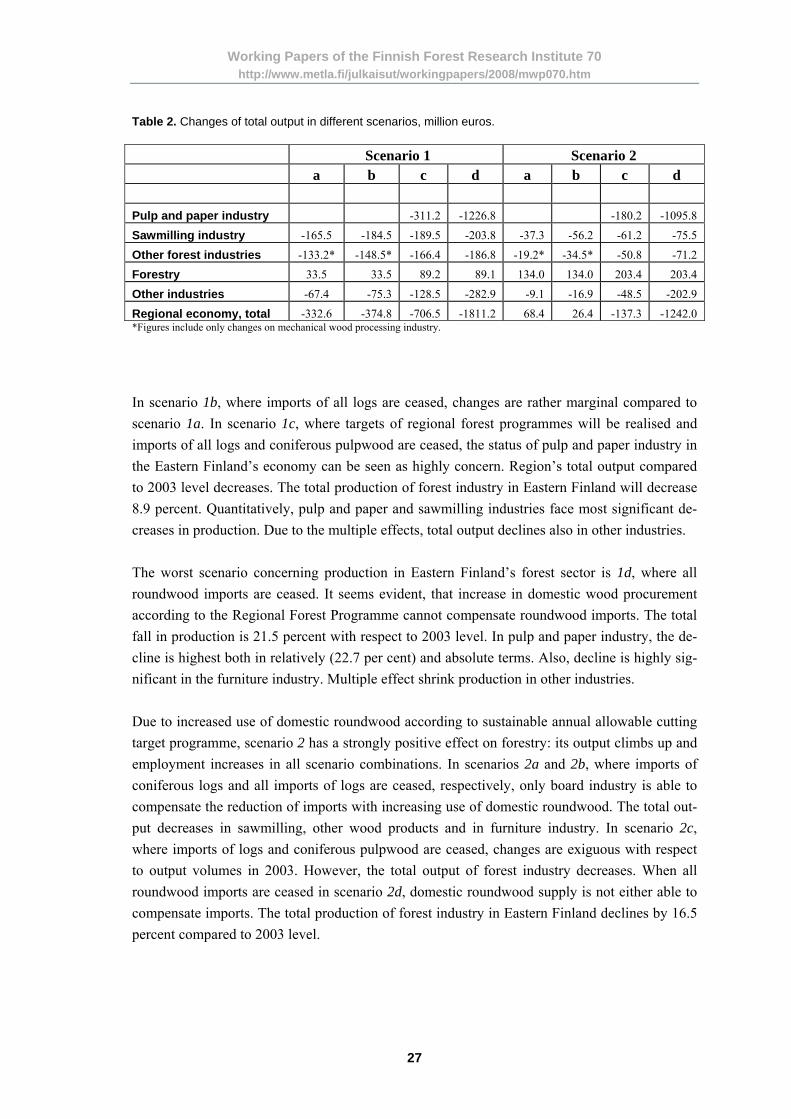
Table 2. Changes of total output in different scenarios, million euros. Scenario 1 Scenario 2 a b c d a b c d
Pulp and paper industry -311.2 -1226.8 -180.2 -1095.8
Sawmilling industry -165.5 -184.5 -189.5 -203.8 -37.3 -56.2 -61.2 -75.5
Other industries -67.4 -75.3 -128.5 -282.9 -9.1 -16.9 -48.5 -202.9
Regional economy, total -332.6 -374.8 -706.5 -1811.2 68.4 26.4 -137.3 -1242.0 *Figures include only changes on mechanical wood processing industry.
In scenario 1b, where imports of all logs are ceased, changes are rather marginal compared to scenario 1a. In scenario 1c, where targets of regional forest programmes will be realised and imports of all logs and coniferous pulpwood are ceased, the status of pulp and paper industry in the Eastern Finland’s economy can be seen as highly concern. Region’s total output compared to 2003 level decreases. The total production of forest industry in Eastern Finland will decrease 8.9 percent. Quantitatively, pulp and paper and sawmilling industries face most significant de-creases in production. Due to the multiple effects, total output declines also in other industries. The worst scenario concerning production in Eastern Finland’s forest sector is 1d, where all roundwood imports are ceased. It seems evident, that increase in domestic wood procurement according to the Regional Forest Programme cannot compensate roundwood imports. The total fall in production is 21.5 percent with respect to 2003 level. In pulp and paper industry, the de-cline is highest both in relatively (22.7 per cent) and absolute terms. Also, decline is highly sig-nificant in the furniture industry. Multiple effect shrink production in other industries. Due to increased use of domestic roundwood according to sustainable annual allowable cutting target programme, scenario 2 has a strongly positive effect on forestry: its output climbs up and employment increases in all scenario combinations. In scenarios 2a and 2b, where imports of coniferous logs and all imports of logs are ceased, respectively, only board industry is able to compensate the reduction of imports with increasing use of domestic roundwood. The total out-put decreases in sawmilling, other wood products and in furniture industry. In scenario 2c, where imports of logs and coniferous pulpwood are ceased, changes are exiguous with respect to output volumes in 2003. However, the total output of forest industry decreases. When all roundwood imports are ceased in scenario 2d, domestic roundwood supply is not either able to compensate imports. The total production of forest industry in Eastern Finland declines by 16.5 percent compared to 2003 level.
Working Papers of the Finnish Forest Research Institute 70 http://www.metla.fi/julkaisut/workingpapers/2008/mwp070.htm
28
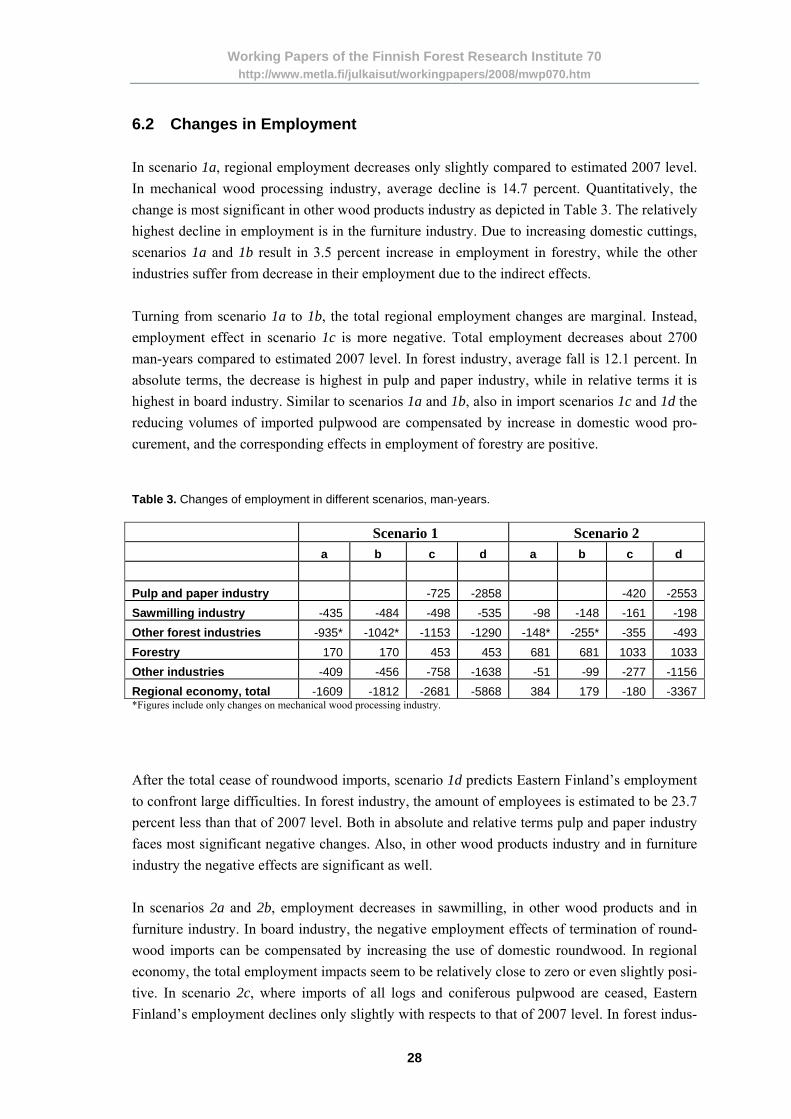
6.2 Changes in Employment In scenario 1a, regional employment decreases only slightly compared to estimated 2007 level. In mechanical wood processing industry, average decline is 14.7 percent. Quantitatively, the change is most significant in other wood products industry as depicted in Table 3. The relatively highest decline in employment is in the furniture industry. Due to increasing domestic cuttings, scenarios 1a and 1b result in 3.5 percent increase in employment in forestry, while the other industries suffer from decrease in their employment due to the indirect effects. Turning from scenario 1a to 1b, the total regional employment changes are marginal. Instead, employment effect in scenario 1c is more negative. Total employment decreases about 2700 man-years compared to estimated 2007 level. In forest industry, average fall is 12.1 percent. In absolute terms, the decrease is highest in pulp and paper industry, while in relative terms it is highest in board industry. Similar to scenarios 1a and 1b, also in import scenarios 1c and 1d the reducing volumes of imported pulpwood are compensated by increase in domestic wood pro-curement, and the corresponding effects in employment of forestry are positive. Table 3. Changes of employment in different scenarios, man-years. Scenario 1 Scenario 2 a b c d a b c d Pulp and paper industry -725 -2858 -420 -2553 Sawmilling industry -435 -484 -498 -535 -98 -148 -161 -198 Other forest industries -935* -1042* -1153 -1290 -148* -255* -355 -493 Forestry 170 170 453 453 681 681 1033 1033 Other industries -409 -456 -758 -1638 -51 -99 -277 -1156 Regional economy, total -1609 -1812 -2681 -5868 384 179 -180 -3367 *Figures include only changes on mechanical wood processing industry.
After the total cease of roundwood imports, scenario 1d predicts Eastern Finland’s employment to confront large difficulties. In forest industry, the amount of employees is estimated to be 23.7 percent less than that of 2007 level. Both in absolute and relative terms pulp and paper industry faces most significant negative changes. Also, in other wood products industry and in furniture industry the negative effects are significant as well. In scenarios 2a and 2b, employment decreases in sawmilling, in other wood products and in furniture industry. In board industry, the negative employment effects of termination of round-wood imports can be compensated by increasing the use of domestic roundwood. In regional economy, the total employment impacts seem to be relatively close to zero or even slightly posi-tive. In scenario 2c, where imports of all logs and coniferous pulpwood are ceased, Eastern Finland’s employment declines only slightly with respects to that of 2007 level. In forest indus-
Working Papers of the Finnish Forest Research Institute 70 http://www.metla.fi/julkaisut/workingpapers/2008/mwp070.htm
29
try, the computational fall is 4.8 percent. However, between the industries there is a large devia-tion even though the employment change in all industries is negative. When all roundwood im-ports are ceased in scenario 2d, forest industry’s employment decreases 16.3 percent from 2007 level. 6.3 Changes in Value Added In the input-output analysis value added is primary input. It is possible to divide value added, caused by production of an industry in two parts, which are caused either by direct effects or by indirect effects. Indirect value added formation, however, is not possible to divide by industries. Thus in this study changes of value added and its components are described as total sums. Value added, produced by forest industry, decreases in described scenarios relatively more moderately than those of production and employment. This is a consequence of increased use of domestic roundwood. As shown in table 4, in scenario 1a value added in Eastern Finland’s re-gional economy decreases due to production changes in mechanical wood processing industry € 74 million. Production decrease of other wood products industry lessens regional value added € 33.5 million. Changes in board industry’s production have least influence on Eastern Finland’s value added.
Table 4. Changes of value added and its components. Scenario 1 Scenario 2 a* b* c d a* b* c d Compensation of employees -57,1 -64,1 -116,8 -281,9 4,7 -2,3 -30,4 -195,5 Other taxes minus subsidies on production
0,6 0,7 0,8 1,4 -0,1 -0,1 0,0 0,6
Consumption of fixed capital -10,8 -12,5 -29,9 -98,6 14,2 12,5 6,5 -62,3 Operating surplus -6,6 -9,4 -22,2 -144,5 67,3 64,5 76,3 -46,0 Values added on basic prices -73,9 -85,3 -168,1 -523,6 86,1 74,6 52,4 -303,2 *Figures include only changes on mechanical wood processing industry.
Impact of scenario 1b on value added differs only slightly from that of scenario 1a. Increasing use of domestic roundwood is not able to compensate ceasing imports in scenario 1c where the aggregated fall in value added is € 168 million compared to 2003 level. In quantitative terms, the most important effect is caused by production changes in pulp and paper industry. Rela-tively, value added declines most by changes in furniture industry. In scenario 1d, region’s total value added decreases by € 524 million. In quantitative terms, pulp and paper industry’s
Working Papers of the Finnish Forest Research Institute 70 http://www.metla.fi/julkaisut/workingpapers/2008/mwp070.htm
30
changes inflict most strongly on value added formation. In relative terms, the formation of value added diminishes most in paper and paperboard products industry. Due to increasing use of domestic roundwood, region’s total value added increases in scenarios 2a and 2b € 86 and € 75 millions, respectively. Only changes on furniture industry’s production seem to have decreasing effect on value added. Scenario 2c’s effect on region’s value added is close to neutral. Increase is only about € 50 million with respect to 2003 level. In scenario 2d, increasing use of domestic roundwood is not enough to remain the total change in value added positive. The fall from 2003 level is close to € 300 million. 6.4 Changes in the Republic of Karelia Due to the lack of data, the economic effects for the Republic of Karelia are calculated using two alternative scenarios. The basic scenario for the Republic of Karelia is that all the round-wood exports will be ceased and production of wood processing industry as well as inter-regional trade of roundwood in Northwest Russia remains unchanged. In the alternative sce-nario, along with the total cease of roundwood exports the domestic mechanical wood process-ing production is doubled in the Republic of Karelia to compensate the reducing export demand of logs. It is also noteworthy, that in input-output methodology, the reduction of roundwood exports are alike with the decrease of final demand, and the calculations are much simpler with respect to the Eastern Finland. In 2003, the total value of loggings in the Republic of Karelia was 4396.3 million roubles. While 48 percent of the loggings were exported, the value of roundwood exports was 2110.2 million roubles. This sum is also the direct negative production effect on logging, if all the roundwood exports will be ceased. Taking into account the multiplier impacts, the value of total output of Karelian economy will decrease by 2605.7 million roubles, if all the roundwood ex-ports are ceased without any capacity changes in regional wood processing industries or on in-ter-regional exports. According to the statistics of Rosstat, the total value of industrial produc-tion of the Republic of Karelia in 2003 was 38848 million roubles. Thus, the relative decrease is 6.7 percent with respect to the region’s industrial total output value in 2003. In the alternative scenario, the use of logs and production capacity of mechanical wood process-ing industry is doubled, while all the roundwood exports are ceased. In 2003, the value of total output of Karelian mechanical wood processing industry was 2887.7 million roubles, while only 36 percent of maximum capacity was in use. Doubling the production increases the total output value by 3565.7 million roubles including the multiplier impacts. After the effects of cease of roundwood exports are also considered, the total result implicates an increase of 960 million roubles. Thus, in relative terms the increase is 2.5 percent from that of 2003 level. In the basic scenario, the cease of roundwood exports will decrease employment directly by 8234 man-years, and after considering the multiplier impacts the decrease is 10158 man-years.
Working Papers of the Finnish Forest Research Institute 70 http://www.metla.fi/julkaisut/workingpapers/2008/mwp070.htm
31
While the total employment in the Republic of Karelia in 2003 was 353100 man-years accord-ing to the Goskomstat, the total decline in relative terms is 2.9 percent. Without any change in roundwood exports doubling the use of logs and the production of mechanical wood processing industry in the alternative scenario will increase the employment directly by 8497 man-years. After including the multiplier impacts the increase is 10848 man-years. After compiling the re-sults above the total employment increases by 690 man-years, which are only 0.2 per cent from the employment level of 2003. 6.5 Interpretation of Results When interpreting the results a few remarks should be considered. First, the calculations are based on the assumption that there are no other exogenous or endogenous changes in economy or policy.13 Second, even though the changes are represented in monetary values, they do not describe values as such, but quantitative changes presented in fixed 2003 prices. Third, accord-ing to the basic assumption of input-output method, increased supply of roundwood increases the quantity of production as equal relative share. In real world, however, production capacity is typically restricted in the short run and the supply of domestic roundwood depends on many different issues such as price elasticities. Fourth, the imports scenarios a and b, where the ceased imports of logs are assumed to be compensated with domestic supply, would imply increasing cuttings and, consequently, also supply of pulpwood. The impacts of this increased supply on domestic pulpwood markets, and consequent effects on pulp and paper industry or on paper and paperboard industry were not studied. It is also noteworthy that pulp and paper industry in Finland has suffered from excess supply of final products in world markets and, therefore, the price development of certain paper qualities has been unsatisfactory. Thus, even without any changes in wood procurement there has been a high pressure of capacity reductions because of low profitability. Partly to overcome this prob-lem, large Finnish forest industry corporations, UPM, M-Real and Stora Enso have announced capacity reductions. The corresponding decreasing effect for employment is assumed to be over 2000 employees in Finland. In mechanical wood processing industry, development in main final market areas in Europe and Asia has been exceptionally good until the autumn 2007, and sig-nificant decrease of employment has not yet been adapted. Keeping in mind the restrictions above the results indicate hard adjustment times for Eastern Finland. If the roundwood export tariffs are becoming effective only for softwood logs, decrease of production and the corresponding employment effects concern mainly on wood working in-dustry together with the indirect impacts on other industries. Relatively, the most important ef-fect for forest industry in Eastern Finland is the cease of imports of hardwood pulpwood. The effect with respect to the other scenarios is multifold. While there are only limited possibilities to increase domestic birch pulpwood procurement, the cease of all roundwood imports will lead
13 In economic language, ceteris paribus is often used concept when interpreting the results meaning that when other things remain equal in economy only studied issues have explanatory power.
Working Papers of the Finnish Forest Research Institute 70 http://www.metla.fi/julkaisut/workingpapers/2008/mwp070.htm
32
to reducing capacity and output, and increasing unemployment in Eastern Finland. For example, the increase in unemployment, measured in man-years, will be thousands of employees. The only positive effect is on forestry via increasing domestic demand for roundwood. The key issue for forest industry in Eastern Finland to survive is to find compensating possibili-ties to ensure roundwood procurement in a way that production is still profitable. Even though the imports from other countries such as the Baltic States and Sweden can help to some extent, crucial issue is how to increase domestic procurement for roundwood in Finland. The bottle-necks that will arise are the lack of employees in forestry and in wood procurement organisa-tions, condition and resistance of forest roads and railway tracks as well as uncertain weather conditions. It is also worth noting that majority of increased amounts of roundwood should be procured from peetlands where bearing capacity is low, thus requiring new technology in wood harvesting. Also, the effect of increasing demand for roundwood on stumpage prices, and the corresponding effect on profitability, remains unknown. The corresponding income and employment effects in the Republic of Karelia seem neither positive. Even though the calculations revealed that the negative effects of cease of roundwood exports can be compensated to some extent by increasing regional production especially in me-chanical wood working industry, the actual possibility to increase production can be suspected. The machinery inherited mainly from the Soviet period is typically out-of-date and economi-cally unprofitable, and output can be increased mainly via investments in new capacity. It is also noteworthy, that because only about 10 percent of the cuttings in the Republic of Karelia consist of birch, the calculation results do not essentially differ from each other if the exports tariffs are becoming effective for all roundwood exports or for other assortments than hardwood pulp-wood. Thus, the results from basic scenario together with only limited possibilities to compen-sate reducing exports by increasing utilisation degree of capacity can be seen as most reliable. This, in turn, means that the reduction of total output value and employment are both consider-able in the Republic of Karelia if the custom tariffs program become effective as announced. 7 Concluding Remarks Forest industry has traditionally had large impacts on the regional economies in Eastern Finland through direct income and employment effects, but also through multiplier impacts. In 2006, forest industry constituted about 15 percent of the gross national product in Eastern Finland. While in recent years over 40 percent of the industrial use of roundwood in Eastern Finland has been based on imports of which the majority has been of Russian origin, the customs pro-gramme for roundwood exports will imply severe adjustment for forest industry’s wood pro-curement, production and employment together with their multiplier effects on regional econ-omy. Correspondingly, the collapse of roundwood exports is likely to have consequential effects in the Republic of Karelia.
Working Papers of the Finnish Forest Research Institute 70 http://www.metla.fi/julkaisut/workingpapers/2008/mwp070.htm
33
This study has tried to evaluate both the direct and indirect income and employment impacts of custom programme for roundwood exports and the corresponding reduce of roundwood trade both on Eastern Finland and the Republic of Karelia. The results for Eastern Finland, based on input-output –method, four different scenarios of roundwood import reduction and two alterna-tive possibilities to increase domestic wood procurement, indicate that forest industry in Eastern Finland will face considerable structural changes. In the worst scenario with only limited possi-bilities to increase domestic roundwood procurement, unemployment is likely to increase nearly six thousand man-years and the value of production may decrease even by over one milliard euros. Even though it is more realistic to evaluate the effects in such a way that the domestic roundwood procurement can be increased to some extent to compensate the roundwood im-ports, the employment and income effects are still considerable. In that case, the reduction in employment will remain a few hundreds of employees and the loss in production value – even at it’s best – will be in the range of tens of thousands millions to over one hundred million eu-ros. Especially, if the custom tariffs for hardwood pulpwood are also coming into effect, this leads into difficulties in forest industry. While in Finland it is not possible, in a profitable way, to re-place the hardwood imports with increasing domestic hardwood loggings, the results with re-spect to other export tariff possibilities are manifold. The only sector, which will face positive income and employment effects, is forestry via increasing demand for loggings, transportation and other related services. However, it should be noted that the increasing effect is merely cal-culatory. In real world, due to frictional unemployment, it is difficult to find professional labour force, for example, in harvesting. To retrain unemployed from narrow and special education demanding sector, such as pulp and paper industry to other special educated sector such as har-vesting, is at least time consuming and requires massive re-education. If the total domestic roundwood procurement in Finland is aimed to be increased by about 10 – 15 million cubic me-ters to compensate majority of the imports decrease, the capacity of transport equipments and infrastructure calls for additional investments not only by forest sector but also by public sector. Even though the domestic loggings can be increased to some extent, the corresponding stump-age and delivery price effects in domestic roundwood markets together with development in final demand markets in Europe and Asia remain unknown, thus challenging the profitability and price competitiveness of forest industry. Neither are the scenarios for the Republic of Karelia positive. Even though the collapse of roundwood exports due to the custom tariffs programme for roundwood exports can be com-pensated to some extent by increasing regional production especially in mechanical wood work-ing industry, the actual possibility to increase production can be suspected. The machinery in the Republic of Karelia is typically out-of-date and economically unprofitable. Thus, output can be increased mainly through investments in new capacity. Also, while only about ten percent of the loggings in the Republic of Karelia consist of birch, the calculation results do not essentially differ from each other if the exports tariffs are becoming effective for all roundwood exports or for other assortments than hardwood pulpwood. Thus, the results with only limited possibilities to compensate reducing exports by increasing the utilisation degree of capacity can be seen as
Working Papers of the Finnish Forest Research Institute 70 http://www.metla.fi/julkaisut/workingpapers/2008/mwp070.htm
34
most reliable. This, in turn, implies that the reduction of both total output value and employment are considerable in the Republic of Karelia if the programme to increase tariffs of roundwood exports come effective as announced. It is also worth mentioning that only the Republic of Ka-relia was studied here. However, roundwood exports in many other regions in Northwest Russia are important part of the local forest sector as well. Thus, similar impacts and conclusions can be expected also in those areas. To summarise the results, forest industry and regional economies both in Eastern Finland and the Republic of Karelia will suffer from custom tariffs programme for roundwood exports an-nounced by Federal Government of Russia. In the short run, it is difficult to find complementing roundwood amounts in Eastern Finland, from other parts of Finland or increasing imports from the Baltic States or Sweden. Especially, hardwood pulpwood imports from Russia cannot be compensated completely by increasing domestic wood procurement. Thus, it is likely to suspect that further structural changes and reductions of capacity in Finland will continue. In the Repub-lic of Karelia, the programme will create loss of incomes together with increase of unemploy-ment, because it is unlike to suspect that the domestic capacity and investments are able to util-ise the replacement of the roundwood exports. Acknowledgements This study has been implemented with collaboration between Finnish Forest Research Institute and Karelian Research Centre, Institute of Economics. Dr. Vladimir Bungov would like to ex-press his gratitude to the Academy of Finland (grant number 121564) and Russian Academy of Science giving a financial support to visit Finland. Comments by Professor Timo Karjalainen and Mr. Antti Mutanen are greatly acknowledged. References Ainali, S. 2000. Alueellisen panostuotostutkimuksen mahdollisuudet. Sisäasiainministeriö,
Aluekehitysosaston julkaisu 7/2000. Bonfiglio, A. 2005. Can Non-survey Methods Substitute for Survey-based Models? A Performance
Analysis of Indirect Techniques of Estimating I-O Coefficients and Multipliers. Università Politecnica delle Marche, Diparimento di Economia, Quaderno di Recerca n. 230/2005.
Chiang, A.C. 1984. Fundamental Methods of Mathematical Economics. 3rd edition. McGraw-Hill. Flegg A.T., Webber, C.D. and Elliot, M.V. 1995. On the Appropriate Use of Location Quotients in
– and Webber, C.D. 1997. On the Appropriate Use of Location Quotients in Generating Regional Input-Output Tables: Reply. Regional Studies 31(8): 759 – 805.
Forssell, O. 1985. Panos-tuotosmallit. Elinkeinoelämän tutkimuslaitos, 1985. Holopainen, P., Ollonqvist, P. and Viitanen, J. 2006. Factors Affecting Investments in Northwest Russian
Forest Sector and Industry. Workin Papers of the Finnish Forest Research Institute 32. Available at: http://www.metla.fi/julkaisut/workingpapers/2006/mwp032.htm
Honkatukia, J., Hänninen, R., Kallio, M. and Pohjola, J. 2008. Raakapuun tuonnin vähenemisen vaikutukset metsäsektorin ja kansantalouteen. Unpublished manuscript. 21 p.
Working Papers of the Finnish Forest Research Institute 70 http://www.metla.fi/julkaisut/workingpapers/2008/mwp070.htm
35
Leontief, W. 1951. The Structure of American Economy, 1919-1939. Oxford University Press. Miller, R.E. and Blair, P.D. 1985. Input-output Analysis. Foundations and Extensions. Prentice-Hall. Miller, R.E., Polenske, K.R. and Rose, A.Z. 1989. Frontiers of Input-Output Analysis. Oxford University
Press. Mutanen, A., Viitanen, J., Toppinen, A., Hänninen, R. and Holopainen, P. 2005. Forest Resources,
Production and Exports of Roundwood and Sawnwood from Russia. Working Papers of the Finnish Forest Research Institute 9. Available at: http://www.metla.fi/julkaisut/workingpapers/2005/mwp009.htm
– and Toppinen, A. 2007. Price Dynamics in the Russian-Finnish Roundwood Trade. Scandinavian Journal of Forest Research 22(1): 71-80.
Mäki-Hakola, M. and Toropainen, M. 2005. Metsien suojelun vaikutukset tuotantoon ja työllisyyteen – Alueellinen ja valtakunnallinen panos-tuotosanalyysi. Pellervon taloudellisen tutkimuslaitoksen raportteja N:o 194/2005.
Nuutinen, T., Hirvelä, H., Salminen, O. and Härkönen, K. 2007. Alueelliset hakkuumahdollisuudet valtakunnan metsien 10. inventointien perusteella, maastotyöt 2004 – 2006. Metsätieteen aikakauskirja 2B/2007: 215-248.
Ollonqvist, P. and Viitanen, J. 2004. Raakapuun tuonnin rakennemuutos. In Toppinen, A. and Toropainen, M. (eds.). Puun tuonti Suomeen ja Itämeren alueen metsäsektorin kehitys. Finnish Forest Research Institute, Research papers 925: 11-18.
–, Viitanen, J., Holopainen, P., Pirhonen, I., Marttila, J. and Toropainen, M. 2007. Metsäteollisuuden investoinnit Luoteis-Venäjällä sekä puunkäytön lisäyksen aluetaloudelliset vaikutukset Itä-Suomessa. In Karjalainen, T., Ollonqvist, P., Saastamoinen, O. and Viitanen, J. (eds.). Kohti edistyvää metsäsektoria Luoteis-Venäjällä – Tutkimushankkeen loppuraportti. Working Papers of Finnish Forest Research Institute 62, pp. 69-89. Available at: http://www.metla.fi/julkaisut/workingpapers/2007/mwp062.htm
Smith, P. and Morrison, W.I. 1974. Simulating the Urban Economy: Input-Output Techniques. Pion, London.
Tilli, T., Toivonen, R. and Toppinen, A. 2004. Koivu-, mänty- ja kuusikuidun tuonnin vaikutukset Suomen puumarkkinoihin. In Toppinen, A. and Toropainen, M. (eds.). Puun tuonti Suomeen ja Itämeren alueen metsäsektorin kehitys. Finnish Forest Research Institute, Research papers 925: 19-26.
Tohmo, T. 2004. New Developments in the Use of Location Quotients to Estimate Regional Input-Output Coefficients and Multipliers. Regional Studies 38(1): 43 – 54.
–. 1998. The Forest Sector and National Economy. In Kellomäki, S. (ed.). Forest Resources and Sustainable Management. Fapet Oy, Helsinki, 1998.
–. 2004. Raakapuun tuonnin tulo- ja työllisyysvaikutukset. In Toppinen, A. and Toropainen, M. (eds.). Puun tuonti Suomeen ja Itämeren alueen metsäsektorin kehitys. Finnish Forest Research Institute, Research Papers 925: 44-56 .
Vatanen, E. 1997. Itä-Suomen metsäsektorin rakenneanalyysi. Metsäntutkimuslaitoksen tiedonantoja 663/1997.
Vinokurova, N., Ollonqvist, P., Holopainen, P., Viitanen, J., Mutanen, A. and Gerasimov, Y. 2005. Challenges in Roundwood Trade between Finland and Russia – a Cultural Approach. Working Papers of the Finnish Forest Research Institute 7. Available at:
http://www.metla.fi/julkaisut/workingpapers/2005/mwp007.htm Wolsky, A.M. 1984. Disaggregating Input-Output Models. Review of Economics and Statistics 66(2):
283-291.
Working Papers of the Finnish Forest Research Institute 70 http://www.metla.fi/julkaisut/workingpapers/2008/mwp070.htm
36
Appendix 1: Development of Labour Productivity in Forest Sector in Finland.