TD(X)/RT.1/1 UNITED NATIONS CONFERENCE ON TRADE AND DEVELOPMENT UNCTAD X High-level Round Table on Trade and Development: Directions for the Twenty-first Century INCOME DISTRIBUTION AND DEVELOPMENT
Transcript
TD(X)/RT.1/1
UNITED NATIONS CONFERENCE ON TRADE AND DEVELOPMENT
UNCTAD X
High-level Round Table on Trade and Development:Directions for the Twenty-first Century
INCOME DISTRIBUTION AND DEVELOPMENT
Distr.GENERAL
TD(X)/RT.1/123 November 1999
Original: ENGLISH
UNCTAD X
High-level Round Table on Trade and Development:Directions for the Twenty-first Century
Bangkok, 12 February 2000
INCOME DISTRIBUTION AND DEVELOPMENT*
Paper prepared by Frances Stewart
Oxford University, United Kingdom
* The views expressed in this paper are those of the author and do not necessarily reflect the views of theUNCTAD secretariat.
GE.99-
- iii -
Executive Summary
Income distribution is extremely important for development, since it influences thecohesion of society, determines the extent of poverty for any given average per capita income andthe poverty-reducing effects of growth, and even affects people’s health. The paper reviews theconnections between income distribution and economic growth. It finds that the Kuznetshypothesis that income distribution worsens as levels of income increase is not at all stronglysupported by the evidence, while growth rates of income are not systematically related to changesin income distribution. However, evidence is accumulating that more equal income distributionraises economic growth. Both political and economic explanations have been advanced. Thefinding suggests that more equal income distribution is desirable both for equity and for promotinggrowth.
Strategies to promote more egalitarian growth are reviewed, with examples given.However, although these strategies seem both feasible and desirable, in the 1980s and 1990s therehas been a strong tendency for income distribution to worsen in both developed and developingcountries. A variety of explanations as to the cause for this have been advanced including tradeliberalization, technology change, and the impact of liberalization and globalization moregenerally. Most of the paper is concerned with the distribution of pre-tax household income. Abrief survey of findings on the incidence of taxation and expenditure shows that tax incidence isoften neutral, or proportionate to income, and occasionally either progressive or regressive. Incontrast, the incidence of public expenditure is mostly progressive, so an increase in the levels oftaxation and expenditure would tend to improve the distribution of welfare. Little direct evidencehas been collected on the distribution of measures of well-being, such as human developmentindicators, but there is strong evidence that health achievements are related to income levels, whileaverage societal health standards tend to worsen as inequality increases.
Most of the paper, along with much of the literature, is devoted to exploring thetraditional concept of vertical income distribution The paper points to the importance ofexamining horizontal inequalities (or inequalities between groups divided on religious, ethnic,racial or other cultural grounds), since these are closely related to societal stability. In conclusion,all the analysis and evidence points to the desirability of achieving egalitarian income distributionfor development. Yet current trends seem to be going in the opposite direction.
This paper has benefited greatly from the research assistance of Emma Samman.*
The evidence is surveyed in Wilkinson, 1996.1
- 1 -
INCOME DISTRIBUTION AND DEVELOPMENT
Frances Stewart*
INTRODUCTION
The distribution of income within a society is of enormous importance. It influences thecohesion of the society and, for any given level of GDP, determines its poverty level. Somerelatively high-income economies have very unequal income distribution with the result that thereare large cleavages in society and high levels of poverty, as in Brazil. Other countries with moreequal income distribution have less poverty and there is a sense of fairness within the societywhich makes for political stability, as in Costa Rica. The sensitivity of poverty to growth dependson a country’s income distribution; for example, a 1 per cent growth rate of GDP leads to a 0.21per cent reduction in poverty in Zambia, if distribution is unchanged, compared with a 3.4 per centreduction in Malaysia (Sen, 1995). There is also considerable evidence that the distribution ofincome has a significant influence on the rate of growth, with more equal societies growing fasterthan less equal ones. Moreover, the average health status of a society depends on its incomedistribution, to that countries with more unequal distributions experience lower life expectancy.1
An equitable distribution of income, as well as the achievement of social goals, are, therefore,essential aspects of development, over and above economic growth.
This paper aims to explore the connections between income distribution and economicgrowth, and to identify some policy conclusions emerging from the analysis. There have beenmany investigations of the relationship between income distribution and development, startingwith a classic paper by Kuznets, who argued that income distribution was generally relativelymore equal at low levels of income in the early stages of development, became more unequal asdevelopment proceeded, and finally a reverse move took place so that income distribution becamemore equal again as countries approached the levels of incomes of the developed countries. Thework of Kuznets, and others, identified correlations between levels and growth of per capitaincome and income distribution. Behind these correlations lie two possible types of causality: first,how growth affects the distribution of income; and secondly, how distribution affects growth.Both will be investigated, before exploring recent trends in income distribution.
There is, of course, a lot of overlap among these alternatives.2
- 2 -
The paper is organized as follows: section I considers some important definitional issues;section II reviews findings on the ways in which growth affects income distribution; section IIIlooks at the reverse causality, i.e. how income distribution affects growth; section IV discussesgrowth strategies which are likely to generate more equal income distribution; section V reviewsrecent trends in income distribution; section VI explores wider dimensions of inequality extendingbeyond pre-tax private incomes, to encompass the incidence taxation and expenditure, and someindicators of inequalities in capabilities; section VII discusses horizontal (or group) inequalities;section VIII briefly reviews changes in global income distribution; and finally, section IXconcludes.
I. SOME IMPORTANT DEFINITION ISSUES
Key issues concern distribution of what, among whom and within which unit.
(a) Distribution of what? In almost all discourse, the focus is on the distribution of currentmonetary (or private) income – normally pre-tax and subsidy but sometimes post-tax and subsidy.Even within the ‘income’ paradigm of welfare, one needs to extend this to include future income(e.g. by adding current asset distribution). But alternative approaches to well-being suggest theneed for concern with one, other, or all of the following: the distribution of social income (i.e.goods and services provided by the State) as well as private income; distribution of capabilitiesor functioning; of basic needs goods and services; or of human development achievements. A2
broader approach to distribution is needed, whether it is a matter of assessing distribution in asociety from the perspective of well-being, or from that of investment (i.e. the impact of currentdistribution on growth). For example, inequality in access to education, which is acute in manysocieties, is a major influence on future household income, and may also affect the rate of growth,since in many occupations those deprived of education are unlikely to be as productive as theeducated. Inequality in access to health services can be much more important than inequality inprivate incomes, since life itself may depend upon it. Nonetheless, most of the literature focuseson the distribution of private incomes.
In addition to household income distribution, there is the question of functional incomedistribution, i.e. the distribution between profits, wages, rents, etc. This indeed was the ‘great’question of Ricardo on household distribution. Functional distribution is important because it isa major determinant of household distribution, as well as being a determinant of savings,accumulation, and growth. Yet it is virtually ignored in most current empirical, and muchtheoretical, work (see, for example, reviews by Kanbur and Lustig, 1999; Kanbur, 1998).
(b) Distribution among whom? The appropriate level of analysis depends on why theinformation is needed. If the aim is to assess well-being, and an individualistic approach to well-being is adopted – as with utilitarian and capability approaches – then the individual is theappropriate level. But much of the data is collected at a household level, as it is difficult to get
- 3 -
information at the level of the individual. Frequently, household and individual information is usedinterchangeably, but there has been some effort to correct household data, in order to translateit into information about individuals, for example, by allowing for intra-household distribution(and sometimes correcting income to allow for the needs of people of different ages or genderswithin the household).
However, for some important aspects of well-being, the relevant distribution is that amonggroups, not individuals, such as distribution of income between groups of different ethnicities,religions, regions or races. We term this type of distribution horizontal, to differentiate it from thenormal vertical measures of distribution among households or individuals. Horizontal distributionis one of the major causes of conflict between groups. It can also be directly relevant to individualwell-being, where people identify strongly with the group to which they perceive themselves asbelonging. For other purposes, such as for North-South negotiations, the appropriate measure ofinequality may be average differences among nations.
(c) Distribution within which unit? Another issue is the unit within which inequality isassessed. Conventionally, this unit is the nation, the obvious rationale being that this is the majorpolicy-making unit. But some policies are made at the local level, so that the local administrativeunit would be the relevant one. For purposes of aid and other international policies, the globallevel is appropriate, and for intra-regional policies, distribution within the region.
In practice, almost all the literature relates to private income distribution amongindividuals within a nation, thereby excluding many important issues. Much of this paper will dolikewise, but will return to some of the broader definitions at the end.
II. HOW GROWTH AFFECTS DISTRIBUTION
As noted earlier, in 1955 Kuznets famously propounded the view that there is an inverted“U” curve relating levels of per capita income to income distribution, with income distributionfirst becoming more unequal, and at a later state more equal, as per capita incomes rise. Kuznetsderived this from cross-country evidence. Historical work on the changing income distributionin industrialized countries also provided supporting evidence (Paukert, 1973). But it should benoted that the Kuznets work relates to levels of income per capita, not to the growth rate.Moreover, further work on the Kuznets curve has found the relationship weak, as it is dependenton the precise functional form adopted (e.g. Anand and Kanbur, 1993a; Deininger and Squire,1998). Bourguignon concludes: “If there is any parabolic relationship between income inequalityand GDP per capita across countries... it is probably very weak and unstable over time... [and]longitudinal data ... seem to suggest that there is much freedom in the way distribution in a givencountry may change over time” (Bourguignon, 1995: 47). Deininger and Squire (1998) also find‘virtually no support’ for the Kuznets hypothesis. However, there is no uniform agreement on this.Several investigations have found some support for the Kuznets hypothesis (e.g. Oswang, 1994;Ali, 1998; Milanovic, 1994; as well as Fishlow, 1995).
- 4 -
Despite its fragile empirical foundations – made even more so by the recent increase ininequality in developed countries – the Kuznets curve has been widely accepted, and sometimesused as an excuse, for taking no action on income distribution, on the assumption that the naturallaws represented by Kuznets will unavoidably be realized. It may, of course, be that there are‘natural laws’ leading to a Kuznets relationship in a laissez-faire development process, but thesecan be countered by policy which explains the many exceptions to the curve. It is in this spirit thatit is worth briefly surveying the explanations that have been put forward for the Kuznetsrelationship:
(i) In the case of a dualistic economy, with a low productivity, more egalitarianagrarian sector, and a high productivity, less egalitarian industrial sector,development causes a sectoral shift to occur. Consequently, inequality rises, bothbecause of the differences in average incomes between the sectors and becausepeople are shifting from a less to a more egalitarian sector. But when the wholeeconomy becomes part of the modern industrial sector, the inequality arising fromthe between-sector differences disappears, and when full employment is reached,income inequality within the modern sector also diminishes. This explanation,termed the Kuznets process, was developed into a formal model by Anand andKanbur (1993b);
(ii) Another explanation, derived from the Lewis growth model, is that productivityand incomes growth is confined to the modern sector, where the profit share rises,while in the stagnant traditional sector incomes remain low (and may even fall aspopulation growth occurs), so that between-sector inequality rises;
(iii) A third explanation attributes the process to an initially unequal distribution ofassets, which contributes to rising inequality, as those with more assets alsoaccumulate more; but, eventually, the rate of return to capital falls and theunequalizing effect of capital is offset by an equalizing effect arising from labourincomes.
Empirical work on growth (as against levels) of per capita income, however, shows norelationship between growth rates and inequality (Ahluwalia, 1976); and recent work confirmsthis (Bruno, Ravallion and Squire, 1995; UNCTAD, 1997). Histories of individual countries showthat in some countries income distribution has worsened over time (e.g. Brazil ) and in others ithas improved (e.g. Indonesia in the 1970s). In fact we can observe countries in each of the fourpossible quadrants representing combinations of growth and changes in income distribution, asshown in table 1.
The conclusion, then, is that growth is ‘distribution neutral’, i.e. it does not necessarilylead to either a worsening or an improvement in income distribution, and may be consistent witheither. Structural factors and policy stances determine countries’ experiences.
Kaldor (1956) suggested that in a full-employment economy higher investment would lead to a higher profit3
share, so that growth and inequality would be likely to be associated, although the causation in this model ran frominvestment to profits/savings, not the other way round.
Including Alesina and Rodrik, 1994; Birdsall, Ross and Sabot, 1995; Bourguignon, 1995; Deininger and4
Squire, 1996; Sarel, 1997; Larrain and Vergara, 1997.
- 5 -
Table 1
Growth and distribution in different economies
High growth Low growth
Distribution worsening Brazil (1960s to early 1990s); Post-Soviet Russia; most easternPakistan (1970–1985); European countries, 1980s;China (1980s); Mexico 1980s; Thailand (1970s and 1980s); Kenya 1980s; Ethiopia 1980s;Botswana, 1970s Guatemala 1970s and 1980s
Distribution improving Indonesia (1973–1993); Sri Lanka (1960–1970); Malaysia (1970–1990); Cuba; Colombia, 1980s; Taiwan Province of China Morocco (1970–1984); (1950–1980); Trinidad and Tobago (1970s andRepublic of Korea (1950–1980); 1980s)Mauritius (1980s and 1990s)
Source: Demery et al. (1995); Chu et al. (1999).
III. HOW INCOME DISTRIBUTION AFFECTS ECONOMIC GROWTH
In the 1950s it was assumed that more unequal income distribution led to higher growth,via higher savings – and possibly incentive effects (e.g. Galenson and Leibenstein, 1955). Higher3
savings propensities associated with more unequal income distribution were variously attributedto the effect of a rising profit share (more, or only, savings out of profits, as assumed by Marx,Kaldor and Lewis), or of more unequal household income distribution (with a Keynesianconsumption function). The early choice-of-technique literature (Dobb, 1956–57; Sen, 1968)argued that more capital-intensive techniques should be chosen to maximize surplus andreinvestible funds. From this, the view emerged that countries should grow first and redistributelater. This view was challenged, for example, by Adelman and Morris (1973), who argued thatmore equal initial income distribution would lead to higher growth.
Recent literature has supported Adelman and Morris; empirical work shows that countrieswith more equal income distribution have higher growth (Alesina and Perotti, 1993; Persson andTabellini, 1994; and many others ). Owing to data constraints, most work involves cross-country4
Deininger and Squire (1996) produced a ‘cleaned’ data set, excluding 1,200 out of 2,000 observations. But5
the cleaning process inevitably introduces its own biases; for example, more equal countries are likely to produce morereliable data on income distribution as particular groups have less reason to conceal their incomes.
- 6 -
regressions. There are especially severe data problems in the area of income distribution, as under-declaration of income is common for obvious reasons. Here too the robustness of the findings5
has been questioned, notably by Fishlow (1995), who finds no statistically significant evidence ofa relationship between growth and equality, when a dummy variable is introduced for LatinAmerica. However, investigations over time in developed countries have confirmed therelationship between greater equality and higher growth (e.g. Panizza, 1999, who investigatedgrowth performance in states in the United States from 1920). However, the very large numberof studies finding some relationship gives some confidence in the existence of a positiverelationship between equality and economic growth – and certainly refutes the prior and oppositeconclusion.
A variety of mechanisms to explain the positive relationship between income distributionand economic growth have been suggested.
(a) One type of mechanism relates to the political economy of more or less equal societies,and how, as a result of political developments, high inequality translates into growth-impeding factors. For example:
(i) It is argued that higher inequality leads to more political instability, moreuncertainty, less investment and lower growth (Alesina and Perotti, 1994a;Bertola, 1993; Perotti, 1993; Persson and Tabellini, 1994);
(ii) It is suggested that higher inequality leads to populist redistributive tax policies,more disincentive effects and lower growth (Alesina and Rodrik, 1994; Perssonand Tabellini, 1994);
(iii) Higher inequality gives a disproportionate influence to rich groups which lobbyfor preferential tax treatment, leading to over-investment in certain areas andreducing growth (Bruno, Ravallion and Squire, 1995).
(b) Other explanations relate to the economic effects of higher equality/inequality:
(i) Higher equality of land ownership leads to more labour input, and higher landproductivity (e.g. Lipton, 1993). There is abundant evidence that more equal landdistribution is associated with higher agricultural productivity as well as moreequally distributed rural incomes, and in rural economies this accounts for asignificant proportion of total incomes.
(ii) Higher equality reduces poverty, and leads to more human development (nutrition,education and health), with a more productive workforce, more innovation, etc.(Birdsall, Ross and Sabot, Stewart and Raffirez, 1995; Ranis, 2000).
- 7 -
(iii) Higher equality in asset distribution leads to a more even access to credit andinformation, and more opportunities for the poor to make productive investments(Galor and Zeria, 1993; Deininger and Squire, 1998).
(iv) Higher equality leads to larger domestic markets, greater exploitation ofeconomies of scale and hence more industrialization and growth (Murphy, Shleiferand Vishny, 1989).
(v) Higher inequality, on the other hand, leads to higher fertility, since those who arepoor and less educated have larger families, and this in turn reduces growth(Benabou, 1996; Khoo and Dennis, 1999; Bloom et al., 1998).
These are all hypotheses, none of which have been thoroughly tested. The politicaleconomy explanations mostly rest on an assumption about the behaviour of the ‘median voter’,which is not relevant in non-democratic societies. Moreover, the statistical evidence supportingthe positive relationship between more equality and higher growth appears to apply to non-democratic countries, not democratic ones, according to Deininger and Squire (1998). In addition,the model assumes that more inequality leads to higher government spending, when in fact thereverse appears to be true (Benabou, 1996). The ‘human development’ explanation (i.e. that moreequality leads to more education, better nutrition and health, and hence more productive people(see (v) above) is much better supported. There is considerable evidence that a more equal incomedistribution leads to a greater spread and level of education, as well as improved health andnutrition, and that this in turn brings about higher growth (Birdsall and Sabot, 1994; Ranis et al.,2000). However, this does not seem to be the whole story, as empirical work has found thatgreater equality has an independent positive impact on growth, in addition to the impact viaeducation levels (Birdsall and Sabot, 1994; Bourguignon, 1995).
Whatever the mechanisms – still subject to investigation – there is broad agreement on theempirical evidence, which shows that more equality is associated with higher economic growth.Moreover, the order of magnitude of the effect is quite high. For example, Bourguignon estimatesthat a change of one standard deviation in inequality is responsible for half a percentage point ofadditional growth.
Taking the findings of sections II and III together would seem to point to the followingfairly optimistic conclusion; namely, that more egalitarian income distribution is better for growth;and that cross-country evidence shows that growth neither increases nor decreases inequality inany systematic way. Since more equal income distribution is desirable as an intrinsic part of thedevelopment agenda, as a mechanism for reducing poverty and enhancing human development,and as instrumental to growth, the agenda should be to identify which types of growth are morelikely to improve income distribution and which policies would help bring about egalitarianpatterns of growth.
- 8 -
IV. EGALITARIAN PATTERNS OF GROWTH
The distribution of income is the outcome of complex economic processes. Individuals’incomes depend on their incomes from assets and from their own current activities. Income fromassets is a function of asset ownership and the rate of return on assets; and income from currentactivities depends, similarly, on quantity of, and returns to, employment (or self-employment), thereturns to employment normally being a function of the individual’s level of education and skills.For an economy as a whole, income distribution then depends on asset distribution, distributionof human capital, and returns on each. It is thus not surprising that we observe a large range ofincome distribution across countries – contrast, for example, Brazil, where 48 per cent of theincome goes to the top 10 per cent of the population, and just 0.8 per cent of total income goesto the bottom 10 per cent, with India, where 25 per cent of the income goes to the top 10 per centof the population, and 4.1 per cent to the bottom 10 per cent. This way of looking at incomedistribution indicates one rather obvious point: a large part of any particular distribution isdetermined by factors inherited from the past – in particular, the stock and distribution of capital(monetary, physical and human). Hence, unless there is very radical action involving assetredistribution (as was taken in Taiwan; Province of China; and the Republic of Korea in the1950s) or the destruction or flight of human capital (as in Cambodia), we should not expect largechanges in income distribution in shortish periods of time.
Statistical investigation shows the importance of asset distribution. For example, educationhas been estimated to account for 10–20 per cent of observed inequality (Fishlow, 1995);Bourguignon and Morrisson estimate that inequality in land distribution accounts for 17 per centof income inequality; they also show that the abundance of mineral resources in a country has tobe associated with higher inequality (Bourguignon and Morrisson, 1990).
Aside from asset redistribution, changes in income distribution depend on changes in theamount and returns to current activities, that is to say, employment of different types of labour,and returns to that employment. The poor are invariably among those with low earnings. Somework for long hours but at very low rates of remuneration, and others have little or noemployment. Some combination of low hours of work and low remuneration is normally foundin the agriculture sector, in the informal urban economy, and among some unskilled jobs in theformal sector. From this perspective, growth strategies likely to improve the earnings of the poor,and hence improve income distribution, include those which raise returns to agriculture, increasethe availability of unskilled work, and extend basic education.
This analysis and cross-country comparisons suggest the following factors are likely tolead to more egalitarian growth:
• Agrarian-focused strategies, especially those also favouring rural industrialization;• Employment-intensive strategies (export-led, and/or supported by labour-intensive
employment schemes);• High levels of and widespread education;
- 9 -
• Asset redistribution. This is important, not only for the immediate impact on incomefrom assets, but also because it influences the rest of the development strategy in avariety of ways; for example, more equality leads to more widely spread education,and it may, lead to mass markets for labour-intensive consumer goods rather than élitegoods. The consequent political economy tends to favour more pro-poor economicdecisions;
• Government policies towards structuring the market, so that education, training, andasset accumulation is directed towards deprived groups.
Examples of each of these approaches are presented briefly below:
(a) Agrarian-focused strategies
Considering that in the poorest countries a majority of the population works in agriculture,that the rural sector is typically poorer than the urban one, and that the percentage of the labourforce in agriculture generally exceeds the share of agriculture in GDP, increasing the productivityof the rural sector should clearly promote more equitable growth. Indeed, Lipton saw ‘urban bias’as the major source of poverty in developing countries (Lipton, 1977).
A wide range of strategies would tend to promote agrarian-focused growth. These includereducing macroeconomic biases against agriculture, which almost always arise as countriesattempt to promote industrialization; introduce land reform; improve access to extension services,market information and input and output markets for smallholders; develop rural infrastructure;and promote agricultural diversification and the non-farm rural sector (e.g. through agro-processing, which has forward and backward linkages, and can employ those with little or noland).
One study estimated that in Pakistan, in the absence of government price interventions,farm incomes from the five major crops would have been 40 per cent higher over the 1983–1987period (Dorosh and Valdes, 1990). The effect of the price interventions for the five major cropstranslated into a transfer out of agriculture of 25 per cent of GDP in the 1978–1987 period. Incontrast, Taiwan Province of China had relatively moderate macro-bias against agriculture, strongand egalitarian agricultural growth and high levels of rural industrialization (Burmeister et al.,1999).
Most countries that have done well in agriculture have taxed the sector moderately andprovided strong support for it. For example, in Malaysia, in the 1970s, total commodity taxationwas relatively low at 19 per cent of value of output, while government spending in direct supportof agriculture was 10 per cent of the sector’s value added. Malaysia had an agricultural growthrate of 5 per cent per year. By contrast, in the same decade, Ghana taxed agricultural commoditiesby over 60 per cent and spent only 3 per cent of value added on support – its farm output fellmore than 1 per cent per year. Similarly, Latin America taxed agriculture much more heavily thanEast Asia (directly and via an overvalued exchange rate) and the growth in agricultural output andproductivity was substantially lower (Schiff and Valdes, 1992).
Data from Khan and Muqtada, 1997.6
- 10 -
Rural industrialization also tends to improve income distribution. This is more likely to bedynamic where agricultural output is rising fast, so that there are strong agriculture/non-agriculture linkages; such linkages can also be promoted by government support for ruralinfrastructure and credit, and are likely to be stronger where land distribution is more egalitarian(Ranis and Stewart, 1987). Decomposition of the factors accounting for the increase in equalityin Taiwan Province of China over the 1960s has shown that an important element was risinghousehold incomes from non-agricultural sources (Fei, Ranis and Kuo, 1979).
A study in Bangladesh showed the strong impact of investment in rural infrastructure onrural incomes. A comparison between villages which had benefited from greater provision ofinfrastructure compared with those that had not, found a one-third increase in average householdincomes among the beneficiary villages. Crop income grew by 24 per cent, wage income by 92per cent, and livestock/fishery income by 78 per cent, all benefiting the poor. Non-farm businessesincreased by 17 per cent, which benefited both the non-poor and the poor via improved non-farmemployment opportunities (World Bank, 1990).
(b) Employment-intensive strategies
Quite sharp differences can be observed in the employment-intensity of output increases.For example, the employment elasticity with respect to output growth was estimated at plus 0.5in East and South-East Asia (1971–1992), compared with minus 0.5 in Latin America. WithinAsia, it was higher in some places (+0.7 in Indonesia), and lower elsewhere (for the 1980s, +0.3in India, negative in the Philippines). In general, more rapid growth in employment is likely to6
be associated with more egalitarian income distribution.
These differences are partly due to the output mix between and within sectors, and partlyto choice of technique. Rapid expansion of labour-intensive exports – observed in many Asiancountries – contributes to fast growth in employment. Policies which support this, and also favourmore labour-intensive techniques (e.g. by not subsidizing capital and by securing more credit forsmall enterprises) promote employment-intensity (Stewart, 1987). Trade liberalization mayincrease labour-intensive exports in countries with abundant labour, but only if infrastructure isadequate and the labour has at least minimal education (Wood, 1994). In economies, where thedominant export is minerals or plantation agricultural crops, trade liberalization can worsenincome distribution.
Employment schemes can also contribute – for example, the Maharashtra EmploymentScheme, the very extensive employment schemes in Chile in the early 1980s, and in Bangladeshin the 1970s.
- 11 -
(c) Asset redistribution
A more egalitarian asset distribution not only contributes to more equality in incomedistribution directly, but also indirectly by increasing the employment intensity of output in bothagriculture and non-agriculture, and strengthening domestic linkages (i.e. the demands thatagriculture generates for non-agriculture; and the demands that the formal sector generates forthe products of the informal sector (Ranis and Stewart, 1987, 1993, 1999)). More equaldistribution of land also raises output – Deininger and Squire (1997) show that a difference of onestandard deviation in the initial Gini coefficient for land is associated with income gains of 0.5 percent for the population as a whole, with gains of 1 per cent for the poorest 20 per cent and 0.9per cent for the poorest 40 per cent.
A comparison between Viet Nam and Bangladesh provides an illustration: in Viet Nam,land distribution is much more egalitarian and there is much less landlessness; Viet Nam hasexperienced an agricultural growth rate of 5 per cent per annum, compared with a rate of 2 percent in Bangladesh over the past decade (Ahmed and Goletti, 1998).
Land reform has been very effective in some economies (e.g. Taiwan Province of Chinaand the Republic of Korea, and also Egypt in the 1960s), but political obstacles are often severe.In quite a number of countries, even though reforms have been only partially implemented,substantial land redistribution has been achieved. (Powelson, 1984; Lipton, 1993). Moreover,even the more limited reforms generate some improvements in rural income distribution (El-Ghonemy, 1990; Besley and Burgess, 1998). There is a strong case for making land reform a highpriority in strategies to improve equity and growth.
With industrialization, land distribution is becoming of lesser aggregate significance, whilethe distribution of industrial and financial assets is of growing importance. The public ownershipof such assets previously represented a way of moderating asset inequality, but this is no longerregarded as a policy option. In highly unequal societies, as in South Africa, more direct policiesto tackle asset inequalities are needed. Wealth and inheritance taxation is one option.
The distribution of credit influences accumulation and the distribution of assets. In general,formal-sector credit tends to be biased against the low-income groups because of their lack ofcollateral, while informal sources are extremely expensive. Surveys of the informal sectorgenerally report that less than one per cent have access to formal sector credit (see, for example,surveys quoted in IADB, 1999; Anderson, 1982; Stewart, Thomas and de Wilde, 1990). The self-employed and employees of micro-enterprises are generally among the lower-income groups; forexample, in Latin America it is estimated these enterprises account for 30–40 per cent of low-income earners. New lending mechanisms, such as the group lending procedures of the GrameenBank, can help to redirect credit to low-income groups.
- 12 -
(d) Education
According to Thompson (1998), “Considering the high payoff from investment in humancapital, the unequal distribution of education opportunities is often a more important determinantof the skewed income distribution than is the skewed access to land”. Higher (primary andsecondary) school enrolment rates tend to be associated with lower inequality . On the basis ofcross-country analysis, Bourguignon and Morrisson estimate that a one per cent increase in theshare of the labour force having at least secondary education increases the share of incomereceived by the bottom 40 per cent by 6 per cent, and that received by the bottom 60 per cent by15 per cent (Bourguignon and Morrisson, 1990). One recent study (Behrman, 1993) finds thatthose with no schooling have a 56 per cent probability of being among the poorest 20 per cent,while those with university training have only a 4 per cent chance. In Brazil, an average 25-year-old in the top decile has an average of 11 years of education, while one in the bottom decile hasjust two years of education (IADB, 1999).
A study of Latin America in the 1980s found that about a quarter of the inequality amongworkers’ incomes was due to differences in educational levels (Psacharopoulos et al., 1996).Education benefits the rural as well as the urban population – educated farmers are more likelyto adopt new technologies and obtain higher returns on land (shown by studies in Malaysia, theRepublic of Korea and Thailand.) Chou and Lau (1987) show that in Thailand one additional yearof schooling adds about 2.5 per cent to farm output. Even in the informal sector, there seem tobe high returns to education. Returns were estimated to be as high as 33 per cent for women self-employed in the retail textile sector in Peru, and 14 per cent for post-primary educated men in theservice sector (World Bank, 1990).
Educational access and expenditure is often distributed very unevenly. Adult literacy variesfrom over 80 per cent in East Asia to as little as 13 per cent in Niger, and only 36 per cent inPakistan. Zambia spent nearly a quarter of its educational budget on tertiary education, with anestimated enrolment rate of 2 per cent in 1980, while Bangladesh spent 8 per cent with anenrolment rate of 3 per cent, and the Republic of Korea also spent 8 per cent, but with a muchgreater enrolment rate of 48 per cent.
Increasing educational access improves both equity and efficiency, and can make otherreforms more effective, such as those aimed at promoting agricultural growth or labour-intensiveexports.
(e) Structuring the market
This describes a set of policies directed towards ensuring that particular deprived groupsget favoured access to assets, including education, in a market economy. A range of policies canbe used to this effect; for example, employment regulations that require enterprises to employ acertain proportion of a targeted group, such as those introduced as part of the Africanizationpolicies of many newly independent African States. Restrictions can also be directed towards
- 13 -
educational institutions (as in the positive discrimination policies in the United States), towardsbanks, in the distribution of government expenditure, and so on.
The Malaysian New Economic Policy is another example. In Malaysia in 1970, themajority population (the Malays or Bumiputra) were economically the most disadvantaged sectionof the population, with an average household income 40 per cent less than that of the ethnicChinese income. A New Economic Policy (NEP) was introduced designed to improve theeconomic position of the Malays. Targets were defined: 95 per cent of new lands were to besettled on Malays; at least 30 per cent of the equity of all public companies was to be owned byMalays; educational quotas in public institutions were specified in line with population shares;credit policies favoured Malays, with credit allocations and more favourable interest rates.
The policy was a success from many perspectives. The employment share of Malays inmanufacturing rose from 26 per cent to 41 per cent between 1967 and 1987, with their share inprofessional and technical employment rising from 47 per cent to 56 per cent; the share ofownership in public companies rose from 4.3 per cent in 1971 to 19.4 per cent in 1988; theiruniversity enrolment share rose from 12 per cent in 1969 to 61.8 per cent in 1988. The incomegap between Malays and other groups was almost eliminated. The success of the structuredmarket in Malaysia in meeting its own objectives (narrowing gaps between Malays and others)was achieved without undermining growth, while income distribution improved. Malaysia'sgrowth rate over the period was one of the fastest in the world, at 6.3 per cent per annum duringthe period 1960–1989, while there was a marked improvement in income distribution, with theshare of income of the bottom 40 per cent rising from 11 per cent in 1970 to 14 per cent in 1987,and the share of the top 10 per cent falling from 41 per cent to 35 per cent over the same period.
To some extent these strategies for achieving more egalitarian growth are complements,and to another extent, substitutes. Thus, extending education will make land reform moreeffective, but it can also contribute to greater equality in the absence of land reform. A structuredmarket generally would improve income distribution so long as the groups targeted for improvedaccess are relatively deprived, but it would probably also contribute to greater efficiency only ifaccompanied by supportive policies towards education and employment. The appropriate strategypartly depends on the initial conditions of the country concerned, including resource availability,distribution of assets and particular weaknesses. For example, in resource-rich areas, labour-intensive strategies may not be feasible, and therefore emphasis would need to be placed oninvestment in human resources, innovation and upgrading technology, so as to improveinternational competitiveness and generate jobs in the export sector. This is the strategy advocatedfor Latin America by ECLAC in its integrated approach towards improving social equity throughchanging production patterns (ECLAC, 1992). However, it seems unlikely that this strategy alonewould markedly improve income distribution without also tackling the gross inequalities in assetsprevalent in many countries in the region.
The political feasibility of the alternative approaches, their economic desirability, and theirprobable impact on income distribution and development are likely to vary according to theprevailing conditions, so any policy suggestions need to be country specific. From this perspective
- 14 -
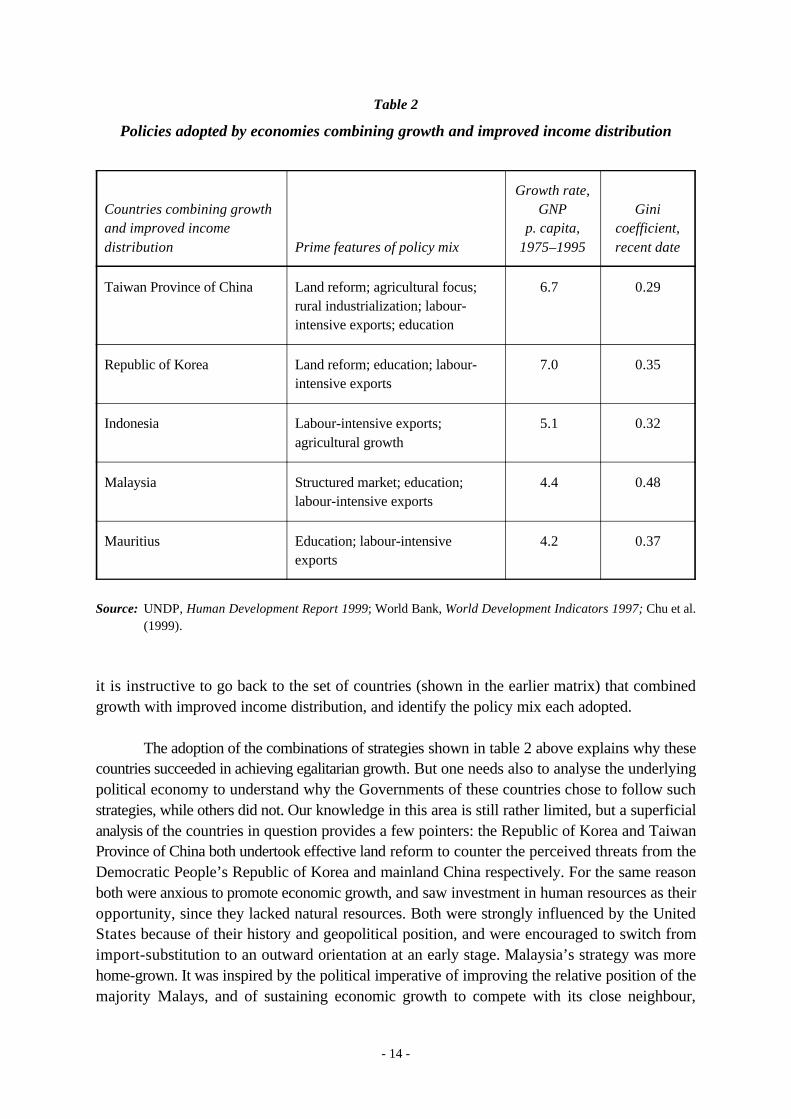
Table 2
Policies adopted by economies combining growth and improved income distribution
Countries combining growth GNP Giniand improved income p. capita, coefficient,distribution Prime features of policy mix 1975–1995 recent date
Growth rate,
Taiwan Province of China Land reform; agricultural focus; 6.7 0.29rural industrialization; labour-intensive exports; education
Republic of Korea Land reform; education; labour- 7.0 0.35intensive exports
Indonesia Labour-intensive exports; 5.1 0.32agricultural growth
Malaysia Structured market; education; 4.4 0.48labour-intensive exports
Source: UNDP, Human Development Report 1999; World Bank, World Development Indicators 1997; Chu et al.(1999).
it is instructive to go back to the set of countries (shown in the earlier matrix) that combinedgrowth with improved income distribution, and identify the policy mix each adopted.
The adoption of the combinations of strategies shown in table 2 above explains why thesecountries succeeded in achieving egalitarian growth. But one needs also to analyse the underlyingpolitical economy to understand why the Governments of these countries chose to follow suchstrategies, while others did not. Our knowledge in this area is still rather limited, but a superficialanalysis of the countries in question provides a few pointers: the Republic of Korea and TaiwanProvince of China both undertook effective land reform to counter the perceived threats from theDemocratic People’s Republic of Korea and mainland China respectively. For the same reasonboth were anxious to promote economic growth, and saw investment in human resources as theiropportunity, since they lacked natural resources. Both were strongly influenced by the UnitedStates because of their history and geopolitical position, and were encouraged to switch fromimport-substitution to an outward orientation at an early stage. Malaysia’s strategy was morehome-grown. It was inspired by the political imperative of improving the relative position of themajority Malays, and of sustaining economic growth to compete with its close neighbour,
- 15 -
Singapore. The Indonesian Government was also partly motivated by the desire to promote localentrepreneurs relative to the Chinese, and partly by the objective of cementing the very fissiparouscountry by spreading education and health services throughout the country. The Government ofMauritius believed it was imperative to replace its dominant export, sugar, which had poorprospects, and therefore promoted education and the immigration of textiles entrepreneurs fromHong Kong (China) and from elsewhere, in order to achieve this.
V. RECENT TRENDS IN INCOME DISTRIBUTION
Earlier sections have shown the desirability of more equal income distribution, and alsosuggested ways of achieving this by adopting particular growth strategies, which would beespecially effective when combined with asset redistribution or structured markets. The politicalrealism of these strategies is shown by the large number of examples where they (or elements ofthem) have been put into effect. But this rather optimistic conclusion is countered by recent trendsin income distribution.
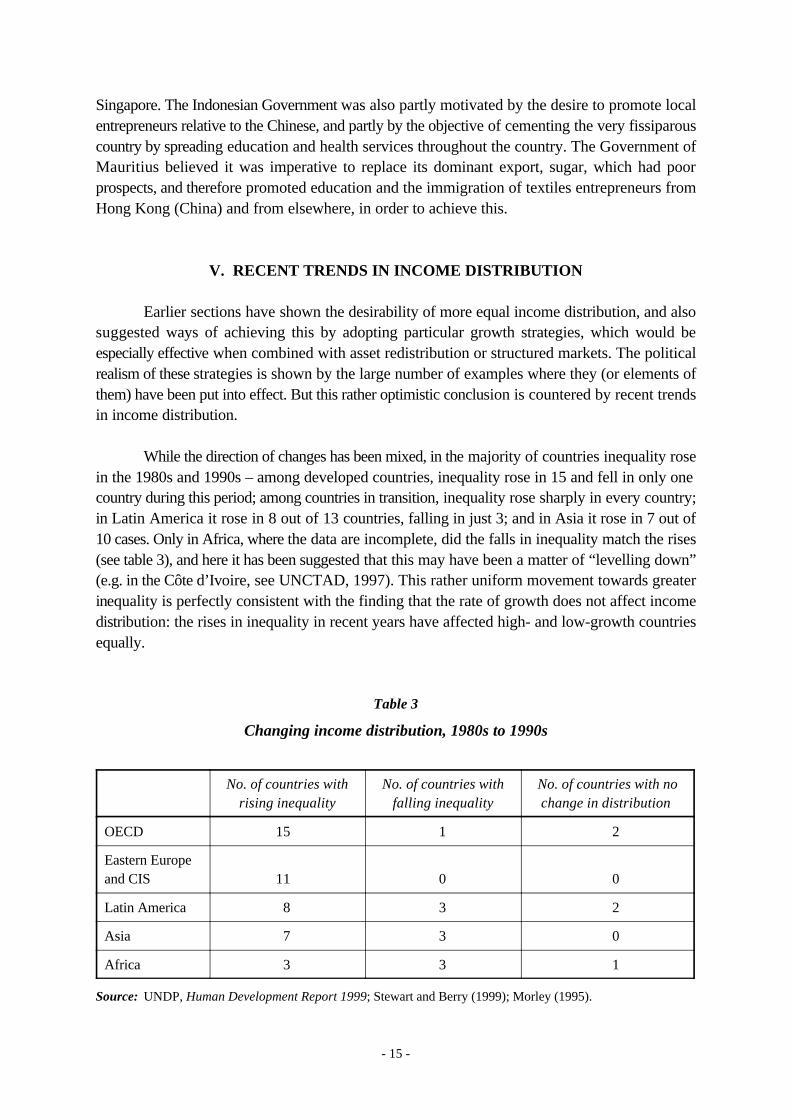
While the direction of changes has been mixed, in the majority of countries inequality rosein the 1980s and 1990s – among developed countries, inequality rose in 15 and fell in only onecountry during this period; among countries in transition, inequality rose sharply in every country;in Latin America it rose in 8 out of 13 countries, falling in just 3; and in Asia it rose in 7 out of10 cases. Only in Africa, where the data are incomplete, did the falls in inequality match the rises(see table 3), and here it has been suggested that this may have been a matter of “levelling down”(e.g. in the Côte d’Ivoire, see UNCTAD, 1997). This rather uniform movement towards greaterinequality is perfectly consistent with the finding that the rate of growth does not affect incomedistribution: the rises in inequality in recent years have affected high- and low-growth countriesequally.
Table 3
Changing income distribution, 1980s to 1990s
No. of countries with No. of countries with No. of countries with norising inequality falling inequality change in distribution
OECD 15 1 2
Eastern Europeand CIS 11 0 0
Latin America 8 3 2
Asia 7 3 0
Africa 3 3 1
Source: UNDP, Human Development Report 1999; Stewart and Berry (1999); Morley (1995).
- 16 -
It is essential to explore why inequality has been rising, if we are to determine whether apro-equality agenda is possible in the current world situation, and how. The context in which therise in equality occurred was one of increased marketization, liberalization and globalization, andrapid information-intensive technological change, all of which affected most countries in the worldin one way or another. It seems likely that each of these broad changes contributed to the risinginequality. Clearly, since we are dealing with a mass of heterogeneous countries, different specificreasons applied in different situations.
Deconstruction of the change in income distribution shows that the increased inequalitywas generally due, in part, to increased inequality in wage and salary earnings, and in part, to arise in the profit share and a fall in the wage share, increasing the proportion of income arisingfrom the ownership of assets, which is invariably distributed more unequally than work income.In the OECD countries, earnings inequality worsened in most countries (Gottschalk andSmeeding, 1997). This also occurred in most transition countries, but here the fall in wage shareplayed a more important role (Cornia, 1996). A study of changing wage dispersion from the late1970s to the late 1980s showed a rise in the majority of developing countries, in eight out of ninecountries in Latin America, three out of five in Africa and six out of ten in Asia (van der Hoeven,1999; see also Berry, 1997; Robbins, 1995, 1996; and Làchler, 1997).
The following specific reasons have been suggested to explain rising inequality:
(a) Freer international trade – Following the Stolper-Samuelson theorem, one might expectinequality to decrease with trade liberalization in labour-surplus developing economies, asemployment and the share of wages rise because of the expansion of exports of labour-intensivemanufactures. Indeed, this seems to have been a characteristic of the countries that combinedgrowth with improved equity over the longer period, as just noted. In resource-rich areas,however, tradeables are not labour intensive; moreover, in import-substituting economies, importliberalization can undermine the wage-earning class (Taylor and Krugman, 1978; Berry, 1997;Roemer and Guherty 1997). For example, studies in Chile and Mexico found that opennessincreased the wage gap between skilled and unskilled labour (Beyer, Rojas and Vergara, 1999;Ghiara, 1999). In some primary producing areas (African economies largely), trade liberalizationmay reduce the income share of urban workers and may raise incomes of peasant farmers, whogenerally have lower incomes than urban workers. But rising differentiation within rural areas canoffset this income-equalizing effect.
A number of studies have shown that trade liberalization has not benefited unskilled labourin developing countries in any straightforward way (Davis, 1996). Earnings dispersion has tendedto increase with more trade liberalization; empirical work has shown that land- and capital-intensive countries have a less equal income distribution, while skill-intensive countries have moreequal income distribution (Wood, 1995; Freeman and Katz, eds. 1995; Spilimbergo, Londono andSzékely, 1999).
Freer international trade might be expected to worsen income distribution in labour-scarcecountries (i.e. the developed countries), where production of labour-intensive goods is
This is also supported by a careful marshalling of evidence by Morley (one of the authors of a World Bank7
report, see 1993), whose conclusion is slightly stronger than that of the World Bank: “real minimum wages appear tohave an equalising effect on the distribution” (Morley, 1995: 162).
A preliminary evaluation by the Confederation of British Industry, the main employers’ organization, reports8
that the minimum wage introduced into Britain in April 1999 had not had adverse effects on employment in the first fivemonths, nor increased average earnings; it had had some effect in reducing wage differentials, and had led tomodernization of work practices (upgrading skills) in some companies (Financial Times, 1/11/99).
- 17 -
undermined by competition from cheap labour in developing countries. This does seem to explainsome of the deterioration in income distribution in developed countries, but the extent is open todebate; for example, Wood (1994) attributes one third to one half of the deterioration to this, andothers, such as Leamer (1995), point to technology change as a major factor.
(b) Technology change – The rapid pace of technology change has raised the demand forskilled labour leading to rising income differentials among workers in both developed anddeveloping countries (Leamer, 1995; Láchler, 1997; Robbins, 1995,1996; Berman, Bound andMachin, 1997). The effect is likely to be particularly acute in developed countries which specializein technology-intensive goods and services. But it seems also to be affecting intermediate stageeconomies which have moved on from unskilled labour-intensive products (e.g. Mexico; TaiwanProvince of China).
(c) The abolition or erosion of the minimum wage – This also seems to be an elementincreasing inequality in some countries. The question of the impact of minimum wages on incomedistribution and poverty is a controversial one: neo-classical theory suggests a rise in the minimumwage should reduce employment, and this could offset the impact of any rise on poverty. ButKeynesian (and other) accounts of the determination of employment challenge this conclusion.A study of changes in inequality in Latin America in the 1980s found that the real minimum wagefell in almost every case where inequality worsened and rose in the three cases where inequalitylessened. They concluded that “real minimum wages may have an equalizing effect on the incomedistribution” (World Bank, 1993: 26). The rise in wage inequality in the United States has also7
largely been explained by the decrease in the minimum wage (Teulings,1998; DiNardo, Fortin andLemieux, 1996). Lustig and McCleod (1996) find that higher minimum wages are associated withlower poverty in developing countries, though they also lead to higher unemployment. Someevidence suggests a negative impact on employment (e.g. Neumark and Wascher, 1991; Rama,1996; Abowd, Kramarz and Margokis, 1999); some suggest a switch from the formal sector toinformal employment (Jones, 1998); while yet other studies show that a rise in minimum wagesis associated with no change or even a rise in employment (e.g. Card, Katz and Krueger, 1994;Dickens et al., 1994; Card and Krueger, 1994). While, evidently, many firms disobey minimumwage regulations – especially in developing countries – in general, the coincidence of erodingminimum wages with worsening wage dispersion in numerous countries supports the view thatminimum wages can improve income distribution. However, clearly the level of the minimumwage needs to be calculated carefully in line with the economic conditions of the country.8
- 18 -
(d) Transition from communism to capitalism – Rising inequality in Eastern Europe and theformer Soviet Union has been “one of the biggest and fastest increases ever recorded”, accordingto Milonavic (1998), with an average increase in the Gini coefficient of between 0.25 and 0.28to between 0.35 and 0.38 in less than 10 years. This is explained by a peeling away of the factorswhich previously assured a high degree of equality, including privatization of assets, reducedrestrictions on earnings differentials and a rising share of income from self-employment (includingthe black market) (Milanovic, 1998; Cornia, 1996).
(e) Changing functional income distribution – The functional income distribution (i.e. theshares of factors of production) is an important determinant of household distribution, sincehousehold incomes depend on the returns on the various assets they possess (including theirlabour), as well as their quantity. Since the upper income groups own most financial and physicalassets, they are likely to gain relatively when the share of profits rises and the share of wage-income falls. For example, in Brazil – an extreme example of an unequal society – the lowestdecile of households receives 0.8 per cent of non-labour income, compared with 47.2 per cent forthe top decile (IADB, 1999). The rather limited evidence suggests that the share of wages fell,and that of profits rose, in the majority of countries over this period. In developed countries, theprofit share in manufacturing rose in 10 out of 12 countries from 1979 to 1989, the exceptionsbeing Norway and Japan, and the biggest rises in profits took place in Australia, Belgium, Swedenand the United Kingdom (Glyn, 1992). Comparisons between the periods 1985–1992 and1975–1980 show that among developing countries the share of wages in manufacturing fell in fiveLatin American countries and rose in three (comparing 1985–1992 with 1975–1980), with thebiggest falls being in Mexico, Colombia and Venezuela; among Asian economies, it fell in fourand rose in six, with big falls in Pakistan and Sri Lanka; and in Africa and the Mediterranean it fellin seven and rose in one, with the largest falls in Ghana and Turkey (UNCTAD, 1997). There wasthus a broad coincidence between changes in the functional distribution and changes in thehousehold income distribution, suggesting that the former is partly responsible for the latter. Onethen needs to explain why the functional distribution has changed in this way. It is not possibleto do this here in any depth, but the process of globalization and liberalization, and possibly thenew technologies creating Schumpeterian profits, seem likely factors.
(f) Globalization in general can be expected to increase returns to capital, especially in thecontext of a rapid reduction in restrictions on capital movements, while restrictions on themovements of unskilled labour are maintained. In developed countries, capital-intensive processesgain through trade specialization, and capital-owners gain by their ability to export capital; incapital-importing countries, liberalization alone should decrease returns to capital, as the ‘supply’of capital rises relative to labour, but this may be offset by privatization, reduced regulation, etc.,all of which tend to raise the gross returns to capital, as well as changes in the tax systemfavouring capital, which tend to raise the net returns. Globalization has decreased the bargainingpower of labour and increased the power of capital, because capital (and goods) can move aroundthe world relatively freely, while there are severe restrictions on the movement of labour,especially unskilled labour. Consequently, labour is discouraged from bargaining in case itfrightens off capital and thus reduces employment. This may explain why there has been aworldwide decline in Trade Union membership (van der Hoeven, 1999).
- 19 -
VI. WIDENING THE DIMENSIONS OF INEQUALITY: IMPLICATIONS
At the beginning of the paper we pointed to the need to consider a broader set ofindicators than simply pre-tax private household income, to which most of the previous discussionwas related. A first requirement is to look at intra-household income distribution; secondly, post-tax income distribution; thirdly, the impact of state transfers (pensions etc.); fourthly, to includesocial income (i.e. publicly provided goods, services), which is an extremely important componentof human well-being; and, fifthly, it would be desirable to examine the distribution of more directmeasures of well-being, such as health, nutrition, and even happiness. This paper does not go farin these directions, but points to some ways in which extending the indicators may alter theconclusions.
(a) Intra-household income distribution
Uneven distribution of income within the household (by gender, age) greatly increasesoverall inequality among individuals; however, because the needs of people of different genderand age differ, it is difficult to determine what an equal distribution would look like. For example,one study suggests that allowing for intra-household income distribution increases inequality by30–40 per cent (Haddad and Kanbur, 1990). Policies to counter inequality should include policiesdirected at correcting household inequality, for example, by improving female educational andearning opportunities.
(b) Post-tax income distribution
Numerous studies of the progressivity, or otherwise, of tax systems have come to differingconclusions, partly due to differences in methodology. On balance, there appears to be mildprogressiveness in the tax systems, with very few cases in which post-tax income distribution ismore unequal than pre-tax. For example, Shah and Whalley (1990 and 1991), surveying seven taxincidence studies in developing countries, showed that mostly the tax systems were mildlyprogressive. A more recent survey of studies in developing countries found that 13 out of 36 caseswere progressive, seven proportional and seven regressive, with income tax being almostinvariably progressive (Chu, Davoodi and Gupta, 1999). But it seems that on balance theprogressiveness of tax systems has been falling, with a declining proportion of income tax (Chu,Davoodi and Gupta, 1999; Atkinson, 1999). Tanzi (1995) notes a general decline in rates ofindividual and corporation income tax. However, some developing countries – including Jamaica,Turkey and Indonesia – managed to reduce inequality significantly through the tax system (Chu,Davoodi and Gupta, 1999).
(c) State transfers
These include pensions and other state benefits, such as unemployment or disabilitybenefits, which, in principle, can be substantial. Transfers are large and generally redistributive inmany developed countries. But they are typically small, with less clear distributional implications,in developing countries because benefits are often largely confined to the relatively privileged
However, government expenditure is often not ‘well-targeted’, when this is defined as occurring where the9
poor receive a higher proportion of benefits than their share of population (Chu, Davoodi and Gupta, 1999).
Grunberg (1998) explores the forces that reduce revenue as a result of globalization – including the reduction10
in trade taxes; financial liberalization, the globalization of income; tax competition, leading to a general fall in tax rateson individuals and companies; and the growth of the (untaxed) informal economy. Her aggregate evidence for the 1980sshows a small fall in the proportion of national income going to Government in developing countries, but a quitesignificant rise in developed countries.
- 20 -
formal sector workers. In Latin America such systems have been shown to be regressive in somecases (Mesa-Largo, 1983). However, when appropriately designed they can be highlyredistributive (e.g. means-tested widows’ pensions and disability pensions introduced in TamilNadu (see Guhan, 1992; Dreze and Chen, 1995; Dréze and Sen, 1991).
(d) Social income
Most government expenditure is progressive compared with pre-tax incomes. Despite9
the fact that a substantial proportion of benefits from social expenditure invariably goes to upper-income groups, expenditure on health and education is almost always progressive (i.e. moreequally distributed than pre-tax incomes): 31 out of 55 studies show that government educationexpenditure is progressive, and 30 out of 38 studies show health expenditure is progressive. Butthere is considerable diversity among countries. For example, in Guinea the bottom fifth ofhouseholds receives 5 per cent of school expenditure and the top fifth receives 44 per cent, whilein Costa Rica, the bottom fifth receives 18 per cent and the top fifth 20 per cent; the poorest fifthof the population receives 4 per cent of total health expenditures in Guinea, compared with 30 percent in Costa Rica (Castro-Leal et al., quoted in Mehrotra et al., 1999). As is well known,expenditure on primary education is most progressive and expenditure on tertiary education isoften regressive. For the most part, the limited evidence shows some improvement in theprogressivity of the distribution of public expenditure over time.
Taking the evidence on tax and government expenditure incidence together, since taxationis normally either progressive or neutral and expenditure is normally progressive, we can concludethat higher taxation and expenditure can generally be expected to improve the distribution ofwelfare. This is an important conclusion and counters the widespread image that elites monopolizegovernment expenditures, and that, therefore, less government taxation and expenditure is moreprogressive than more. It follows that downward pressure on government taxation andexpenditure – associated with globalization and the liberalizing agenda – is likely to worsen post-tax, post-benefit income distribution. 10
(e) The distribution of non-monetary indicators of well-being
Although there has been considerable progress in widening the definition and measure ofprogress beyond monetary income at a national level, notably with the UNDP HumanDevelopment Index, much less attention has been paid to the distribution of non-monetary aspectsof well-being. Piecemeal evidence shows considerable inequalities in health and education. For
- 21 -
example, the poorest electoral wards in northern England had death rates four times as high asthe richest ones, while a study of civil servants in the United Kingdom found that death rates werethree times as high among the lowest grades compared with the highest grades (Wilkinson, 1996).In the United States, age-adjusted mortality rates were found to be over 80 per 10,000 in thebottom decile of the white male population, compared with under 40 in the top decile (DaveySmith, Neaton and Stamler, 1996). In Brazil, infant mortality rates range from 90 per 1,000 to 12per 1,000 in different areas of the same city. Similar differences are found for schooling, with, forexample, nearly 60 per cent of the bottom quintile never having attended school in Nepal,compared with 13 per cent of the top quintile. In Brazil all the top 30 per cent of the incomedistribution have attended school, while a fifth of the bottom 10 per cent have never attendedschool. Although the extent of inequalities in non-monetary indicators tends to be smaller thanmonetary income dispersion, their importance for well-being, as well as a precondition ofimproving future incomes, is likely to be greater.
There is strong two-way causation between the distribution of monetary income and thedistribution of human development achievements. Societies with more unequal income distributionhave higher death rates than those with similar incomes and more equal distribution. Indeed,among developed countries it is the equality of income distribution, not income levels, which areassociated with longevity (Wilkinson, 1996). A positive relationship between income equality andlongevity has also been found in developing countries (Flegg, 1982). Indeed, some research showsthat infant mortality rates increase with rising incomes if the level of income among the lowestfifth of the population is kept constant (Waldmann, 1992). Inequality as such worsens health.Conversely, more inequality in health and education is likely to lead to more unequal incomedistribution in monetary incomes.
VII. HORIZONTAL INEQUALITY: THE NEGLECTED DIMENSION
So far we have considered only vertical inequality, i.e. the inequality among individualsor households in a society. Horizontal inequality, or inequality among groups is also of hugeimportance to societal well-being. Groups may be defined culturally and/or geographically, e.g.by ethnicity, race, religion, or location. The extent of inequality among such groups is a keydeterminant of social cohesion. There are many relevant aspects of such inequality, includinginequality in income, assets, employment, access to social income and resources.
Horizontal inequalities are a major factor contributing to social instability and ultimatelycivil war. A graphic example was the Rwanda situation, where the Belgian colonialists had dividedTutsi and Hutu and given them unequal access to most types of resources. Similar horizontalinequalities are to be found in many other conflict-prone places, such as between Protestants andCatholics in Northern Ireland, Tamils and Singhalese in Sri Lanka and Muslims and Christians inSerbia. Horizontal inequalities are more likely to lead to conflict where they occur systematicallyalong a number of dimensions, and where they are growing (see Stewart, forthcoming, 2000). Foreconomies vulnerable to conflict (which includes most low-income economies), monitoring andaddressing horizontal inequalities is essential to prevent violent group conflict. Yet in practice,
- 22 -
horizontal inequality is rarely identified or measured systematically. It should be noted that therecan be a high degree of vertical inequality without substantial horizontal inequality if within agroup inequality is high; however, generally, if a society has high horizontal inequality, verticalinequality is likely to be substantial. Given the heavy human costs of conflict, as well as theeconomic costs, tackling horizontal inequalities may be at least as important as reducing verticalinequality.
VIII. GLOBAL INCOME DISTRIBUTION
So far we have focused entirely on income distribution within countries, which is ofinterest to national policy makers, and which determines the cohesion of a particular society.Global income distribution is of relevance to international policy makers concerned with matterssuch as aid distribution, the terms of trade and debt relief. As other papers in this Round Tablefocus on this area (for example, see Maizels and Nayyar), here we review developments brieflyfor the sake of getting a more complete picture.
World income distribution is substantially more unequal than that of particular countries,since it encompasses the big differences in income between countries as well as within them.According to an UNCTAD estimate, the top 20 per cent of the world population received 83 percent of world income in 1990, and the world Gini coefficient was 0.74 (UNCTAD, 1997). Trendsin the distribution of world income depend on the evolution of both inter-country incomedifferences (i.e. between-country inequality) and the distribution of income within countries. Mostanalyses suggest that inter-country income differences are the main contributor to the inequalitywhich exists among the people of the world (Berry et al., 1991), while changes in worlddistribution are likely to be much more influenced by changes in inter-country income gaps thanchanges in intra-country inequality, because the former are so large and because they appear tochange more quickly than do the intra-country gaps.
Berry, Bourguignon and Morrisson concluded that there was little change in the standardindicators of income inequality over the period 1950–1977. An important aspect of the evolutionof world distribution over this period was the fast growth of the largest low-income country,China. Estimates of distribution of income within the non-socialist world showed increases ininequality, with the bottom deciles losing together with the middle ones. In the period 1980 todate, the evidence suggests worsening world inequality with inter-country differences increasing.According to UNDP (1999), while 33 countries had growth rates in GNP per capita of over 3 percent per annum for 1980–1997, 59 countries had negative growth. For the decade of the 1980s,UNCTAD estimates that the world Gini coefficient rose from 0.68 in 1980 to 0.74 in 1990. Thisin fact underestimates the level and change in inequality because it includes only changes indistribution between countries, and does not include estimates of the increasing within-countryinequality, documented above.
Thus the impact of globalization seems to have been unequalizing between nations as wellas within them. To some extent other influences were also responsible, such as the increase in the
- 23 -
technology-intensity of production, and the rise in the rate of return to capital. Yet otherinfluences, such as worsening commodity terms of trade, were more relevant to explaining risinginter-country inequalities than intra-country.
IX. CONCLUSIONS
There is broad empirical and theoretical support for the view that greater equality ofincome distribution is good for economic growth, for social cohesion, for poverty elimination andfor health; in other words, that in general, more equality promotes development. It seems,therefore, that greater equality of income distribution is to be recommended on all counts. Yet thecurrent situation is one of rising inequality in the majority of countries, both among developed anddeveloping countries, which associated with globalization and liberalization.
The evidence also suggests that Governments can influence income distribution by theirpolicies towards asset distribution, by the growth strategy chosen and by tax and expenditurepolicies. In general, higher levels of taxation and expenditure improve the distribution comparedwith the pre-tax system, even where the tax system is not notably progressive. Well designed, tax,expenditure and transfer policies can greatly improve the distribution of welfare. Within limits,also, empirical evidence suggests that higher taxes do not impede economic growth. Yetglobalization is restricting Governments’ ability to counter the rise in inequality of primarymonetary incomes by redistributive taxation and expenditure because of the feared impact oncompetitiveness, trade and capital movements. There is a sad irony in the situation because therise in inequality and downward pressure on government expenditure is likely to reduce politicalstability, and also diminish essential expenditure on social and economic infrastructure, essentialfor sustained growth and social stability. A major policy challenge for the twenty-first century willbe to tackle this dilemma.
One general conclusion from this is that coordinated regional, or better international,action would help promote equality without weakening the ability to compete. For example,regional coordination of domestic tax and benefit strategies would permit improved distributionwithout undermining competitiveness, as would regional coordination of minimum wages at anappropriate level. At an international level, coordinated taxation of international capital flows(including taxation of short-term capital and of multinational companies) and support for universalhuman rights to minimal standards of living would also contribute to improving incomedistribution, and countering the immiserizing impact which globalization can have. A globaleconomic environment requires a global social response. In general, the liberalizing andglobalizing era of the late twentieth century has tilted the balance of power and benefits towardsthose with capital (physical, human and financial) against those without. This needs to becorrected.
However, while a regional and global response is needed, much can be done at the nationallevel. Countries which have put human development and improved income distribution high onthe agenda, have not lost out in the global economy because the build up of human resources
- 24 -
enhances their productivity. The types of policies likely to improve income distribution wereidentified above. They include agrarian-focused and employment-intensive growth strategies; highand widely spread expenditure on education; redistribution of assets; a structured market to directeducation, training, and asset accumulation towards deprived groups; and strong policies towardssocial protection and social income. Gender balance in each aspect is necessary to improve intra-household income distribution. It is essential to consider not just vertical income distribution butintra-household and horizontal inequalities as well.
Nonetheless, although it is fairly easy to identify the appropriate set of policies whichwould increase equality and improve social cohesion and economic growth, the prevalence ofpowerful global forces responsible for the general rise in inequality makes it difficult to beoptimistic about the possibilities of countries switching to a more egalitarian pattern ofdevelopment.
- 25 -
REFERENCES
Abowd J, Kramarz F and Margolis D (1999). Minimum wages and employment in France and the United States. NBERWorking Paper 6996. Cambridge, Massachusetts, National Bureau of Economic Research.
Adelman I and Morris CT (1973). Economic growth and social equity in developing countries. Stanford, California,Stanford University Press.
Ahluwalia M (1976). Inequality, poverty and development. Journal of Development Economics 6: 307–42.
Ahmed R and Goletti F (1998). Food policy and market reform in Vietnam and Bangladesh. In: International FoodPolicy Research Institute (IFPRI) Annual Report. Washington DC, IFPRI.
Alesina A and Perotti. R (1994a). The political economy of growth: A critical survey of the recent literature. The WorldBank Economic Review 8.
Alesina A and Perotti R (1994b). Income Distribution, Political Instability and Investment. Cambridge, NationalBureau of Economic Research (NBER), Working Paper 4486.
Alesina A and Rodrik D (1994). Distributive politics and economic growth. Quarterly Journal of Economics 109(2):465–90.
Ali, Ali Abdel Gadir (1998). Dealing with poverty and income distribution issues in developing countries: Cross-regional experiences. Journal of African Economies 7:2 (AERC Supplement): 77–115.
Anand and Kanbur R (1993a). Inequality and Development: A Critique. Journal of Development Economics 41(1):19–43, June.
Anand and Kanbur SMR (1993b). The Kuznets process and the inequality-development relationship. Journal ofDevelopment Economics 40(1): 25–52, February.
Anderson D (1982). Small industry in developing countries: A discussion of issues. World Development 10(11):913–948.
Atkinson T (1999). Increased income inequality and the redistributive impact of the government budget. Paper preparedfor WIDER project meeting on Rising Income Inequality and Poverty Reduction: Are they compatible?,WIDER, Helsinki, 16–18 July.
Behrman J (1993). Investing in human resources. In: Inter-American Development Bank. Economic and SocialProgress in Latin America. Washington DC, Inter-American Development Bank.
Benabou R (1996). Inequality and growth. In: Bernanke BS and Rotemberg J, eds. National Bureau of EconomicResearch, MacroEconomics Annual 11, Cambridge, MIT Press.
Berman E, Bound J and Machin S (1997). Implications of skill-biased technological change: International evidence.IED Discussion Paper Series 78. Boston, IED Boston University.
Berry A, Bourguignon F and Morrisson C (1991). Global economic inequality and its trends since 1950. In: Osberg L,ed. Economic Inequality and Poverty: International Perspectives. Sharpe.
Berry A (1997). The income distribution threat in Latin America. Latin American Research Review, 32(2): 3–40.
Bertola (1993). Factor shares and savings in endogenous growth. National Bureau of Economic Research WorkingPapers 3851. Cambridge MA, NBER.
Besley T and Burgess R (1998). Land reform, poverty reduction and growth: Evidence from India. The DevelopmentEconomics Discussion Paper Series, 13. London, London School of Economics, STICERD.
Beyer H, Rojas P and Rodrigo V (1999). Trade liberalization and wage inequality. Journal of Development Economics59: 103–123.
Bird RM and de Wulf L (1973). Taxation and income distribution in Latin America: A critical review of empiricalstudies. Staff Papers 20(3): 639–682.
Birdsall N and Sabot R (1994). Inequality as a constraint on growth in Latin America (mimeographed). WashingtonDC, Inter-American Development Bank.
- 26 -
Birdsall N, Ross D and Sabot R (1995). Inequality and growth reconsidered: Lessons from East Asia. World BankEconomic Review, 9.
Bloom DE, Canning D and Malaney P (1998). Population Dynamics and Economic Growth. Cambridge MA, HIID.
Bourguignon F and Morrisson C (1990). Income distribution, development and foreign trade: A cross-sectional analysis.European Economic Review 34: 1113–1132.
Bourguignon F (1995). Comment on ‘Inequality, Poverty and Growth: Where do We Stand?’, Annual World BankConference on Development Economics. Washington DC, World Bank.
Bruno M, Ravallion M and Squire L (1995). Equity and Growth in Developing Countries: Old and New Perspectiveson the Policy Issues. Prepared for the IMF Conference on Income Distribution and Sustainable Growth, WorldBank, Washington DC, 1–2 June.
Burmeister L, Ranis G and Wang M (1999). Group behaviour and development: A comparison of farmers associationsin South Korea and Taiwan. Paper prepared for WIDER Project Meeting on Group Behaviour andDevelopment, WIDER, Helsinki, 10–11 September.
Card D, Katz L and Krueger AB (1994). An evaluation of recent evidence on the employment effects of minimum andsubminimum wages. Industrial and Labor Relations Review, 47(3): 487–496.
Card D and Krueger AB (1994). Minimum wages and employment: A case study of the fast food industry in New Jerseyand Pennsylvania. American Economic Review, 84(4): 772–793.
Chou E and Lau L (1987). Farmer ability and farm productivity: A study of farm households in the Changmai Valley,Thailand, 1972–8. Working Paper. Washington DC, World Bank.
Chu K, Davoodi H and Gupta S (1999). Income distribution and tax and government spending policies in developingcountries. Paper prepared for WIDER project meeting on Rising Income Inequality and Poverty Reduction:Are they Compatible?, WIDER, Helsinki, 16–18 July.
Cornia GA (1996). Transition and income distribution: Theory, evidence and initial interpretation. Research in Progress1. Helsinki, WIDER.
Cornia GA (1999). Liberalization, globalization and income distribution. Working Paper 157. Helsinki, WIDER.
Davey SG, Neaton J and Stamler J (1996). Socioeconomic differentials in mortality risk among men screened for themultiple risk factor intervention trial. White men. American Journal of Public Health, 86: 486–96.
Davis D-R (1996). Trade Liberalization and Income Distribution. Cambridge MA, Massachusetts Harvard Instituteof Economic Research.
Deininger K and Squire L (1996). A new data set measuring income inequality. World Bank Economic Review 10(3):565–91.
Deininger K and Squire L (1997). Economic growth and income inequality: Re-examining the links. Finance andDevelopment 34(1): 38–41, March.
Deininger K and Squire L (1998). New ways of looking at old issues: Inequality and growth. Journal of DevelopmentEconomics 57(2): 259–287.
Demery L, Sen B and Vishwanath T (1995). Poverty, inequality and growth. ESP Discussion Paper Series 70.Washington DC, World Bank.
Dickens R, Machin S, et al (1994). The effect of minimum wages on UK agriculture Discussion Paper 204. London,Centre for Economic Performance.
DiNardo J, Fortin N and Lemieux T (1996). Labor market institutions and the distribution of wages, 1973–1992: Asemiparametric approach. Econometrica 64(5): 1001–1044.
Dobb M (1956–57). Second thoughts on capital intensity of investment. Review of Economic Studies XXIV.
Dorosh P and Valdes A (1990). Effects of exchange rate and trade policies in agriculture in Pakistan. IFPRI ResearchReport 82, Washington DC.
Dreze J and Sen AK (1991). Public action for social security: Foundations and strategy. In: Ahmad Drèze J and Sen AK,eds. Social Security in Developing Countries. Oxford, Oxford University Press.
- 27 -
Dreze J and Chen M (1995). Widows and wellbeing in rural north India. In: Das Gupta M, Krishnan TN and Chen L,eds. Women and Health in India. Oxford, Oxford University Press.
ECLAC (1992). Social Equity and Changing Production Patterns: An Integrated Approach. Santiago, ECLAC.
El-Ghonemy R (1990). The Political Economy of Rural Poverty. London, Routledge
Fei J, Ranis G and Kuo S (1979). Growth with Equity: The Taiwan Case. Oxford, Oxford University Press.
Fishlow, A (1995). Inequality, poverty and growth: Where do we stand? Annual World Bank Conference onDevelopment Economics. Washington DC, World Bank.
Flegg A (1982). Inequality of income, illiteracy, and medical care as determinants of infant mortality in developingcountries. Population Studies, 36: 441–58.
Freeman RB and Katz LF, eds. (1995). Differences and Changes in Wage Structure. Chicago, The University ofChicago Press.
Galenson W and Leibenstein H (1955). Investment criteria, productivity, and economic development. Quarterly Journalof Economics 69: 343–370.
Galor O and Zeria J (1993). Income distribution and macroeconomics. Review of Economic Studies 60: 35–52.
Ghiara R (1999). Impact of trade liberalization on female wages in Mexico: An econometric analysis. DevelopmentPolicy Review 17: 171–190.
Glyn A (1992). Stability, inegalitarianism and stagnation: An overview of the advanced capitalist countries in the 1980s.Working Paper. Helsinki, WIDER.
Gottschalk P and Smeeding TM (1997). Cross-national comparisons of earnings and income inequality. Journal ofEconomic Literature 35: 633–687.
Grunberg I (1998). Perspectives on International financial liberalisation. Discussion Paper Series 15. New York, UnitedNations, UNDP, Office of Development Studies.
Guhan S (1992). Social Security for the unorganised poor: A feasible blueprint for India. Discussion Paper, UNDP andIndira Gandhi Institute of Development Research. Bombay.
Haddad L and Kanbur R (1990). How serious is the neglect of intra-household inequality. Economic Journal 100:866–881.
Inter-American Development Bank (1999). Facing up to Inequality in Latin America. Economic and Social Progressin Latin America, 1998–99 Report. Washington DC, Inter-American Development Bank.
Jones O (1998). The impact of minimum wage legislation in developing countries where coverage is incomplete.Working Paper 2. Oxford, Centre for the Study of African Economies.
Kaldor N (1955–6). Alternative theories of distribution. Review of Economic Studies XXIII: 2.
Kanbur R (1998). Income distribution and development. World Bank Working Paper 98–13, and forthcoming inAtkinson and Bourguignon, eds. Handbook of Income Distribution.
Kanbur R and Lustig N (1999). Why is inequality back on the agenda. Paper prepared for the Annual World BankConference on Development Economics, World Bank, Washington DC, 28–30 April.
Khan A and Muqtada M, eds. (1997). Employment Expansion and Macroeconomic Stability Under IncreasingGlobalisation. London, Macmillan.
Khoo L and Dennis B (1999). Inequality, fertility choice, and economic growth: Theory and evidence. DevelopmentDiscussion Paper 687. Cambridge MA, Harvard Institute for International Development.
Kuznets S (1955). Economic growth and income inequality American Economic Review XLV: 1–28.
Láchler U (1997). Education and earnings inequality in Mexico. World Bank Working Paper, Washington DC, WorldBank, Mexico Country Dept.
Larraín FB and Vergara MR (1997). Income distribution, investment and growth. Development Discussion Paper 596.Cambridge MA, Harvard Institute for International Development.
- 28 -
Leamer EE (1995). A trade economists view of US wages and ‘globalization’. In: Collins S, ed. Imports, Exports andthe American Worker. Washington DC, Brookings Institution.
Lewis WA (1954). Economic development with unlimited supplies of labour. Manchester School of Economic andSocial Studies, 22: 139–181.
Lipton M (1977). Why Poor People Stay Poor. London, Croom Helm.
Lipton M (1993). Land reform as commenced business: The evidence against stopping. World Development, 21(4):641–657.
Litwin C (1998). Trade and income distribution in developing countries. Working Papers in Economics, 9. Göteberg,Göteberg University, Dept. of Economics.
Lustig N and Mcleod D (1996). Minimum wages and poverty in developing countries: some empirical evidence.Brookings Institution Working Paper 125. Washington DC, Brookings.
Mehrotra S, Vandemoortele J and Delamonica E (1999). Public Spending on Basic Social Services. Manuscriptprepared for UNICEF, New York.
Mesa-Largo C (1983). Social security and extreme poverty in Latin America. Journal of Development Economics, 28:138–150.
Milanovic B (1994). Determinants of cross-country income inequality: An ‘augmented’ Kuznets hypothesis, PolicyResearch Working Paper 1246. Washington DC, World Bank.
Milonavic B (1998). Explaining the increase in inequality during the transition. World Bank Working Paper 1935.Washington DC, World Bank.
Morley S (1995). Poverty and Inequality in Latin America: The Impact of Adjustment and Recovery in the 1980s.Baltimore, John Hopkins.
Murphy D, Shleifer A and Vishny RW (1989). Income distribution, market size and industrialization. Quarterly Journalof Economics, 104(3): 537–64.
Neumark D and Wascher W (1991). Evidence on employment effects of minimum wages and subminimum wageprovisions for panel data on state minimum wage laws. Industrial and Labor Relations Review, 44: 55–81.
Oswang T (1994). Economic development and income inequality: A nonparametric investigation of Kuznets U-curveHypothesis. Journal of Quantitative Economics, 10: 139–153.
Panizza U (1999). Income inequality and economic growth: Evidence from American data. IADB Working Paper.Washington DC, Inter-American Development Bank.
Paukert F (1973). Income distribution at different levels of development: A survey of the evidence. InternationalLabour Review 108: 97–125.
Perotti R (1993). Political equilibrium, income distribution, and growth. Review of Economic Studies, 60.
Persson T and Tabellini G (1994). Is inequality harmful for growth? American Economic Review, 84: 600–621.
Powelson JP (1984). International public and private agencies. In Montgomery JD, ed. International Dimensions ofLand Reform. Boulder, Westview.
Psacharopoulos G et al (1996). Poverty and income distribution in Latin America: The story of the 1980s. LatinAmerica and the Caribbean Technical Department. Regional Studies Programme Report NE 27. WashingtonDC, World Bank.
Rama M (1996). The consequences of doubling the minimum wage: the case of Indonesia. World Bank Working Paper1643. Washington DC, World Bank.
Ranis G and Stewart F (1987). Rural linkages in the Philippines and Taiwan. In: Stewart, ed. Macro-Policies forAppropriate Technology. Boulder, Westview.
Ranis G and Stewart F (1993). Rural non-agricultural activities in development: Theory and application. Journal ofDevelopment Economics 40(1): 75–102.
Ranis G and Stewart F (1999). V-goods and the role of the urban informal sector in development. EconomicDevelopment and Cultural Change, 47(2) 259–288.
- 29 -
Ranis G, Stewart F and Ramirez A (forthcoming 2000). Economic growth and human development. WorldDevelopment, 28: 2.
Robbins D (1995). Earnings dispersion in Chile after trade liberalization. Processed. Cambridge MA, HarvardUniversity.
Robbins D (1996). HOS hits hard facts: Evidence on trade and wage in the developing world. Processed. CambridgeMA, Harvard University.
Roemer M and Guherty MK (1997). Does economic growth reduce poverty? Technical Paper. Cambridge MA, HarvardInstitute for International Development.
Sarel M (1997). How macroeconomic factors affect income distribution: The cross-country evidence. IMF WorkingPaper, 97/152, Washington DC, International Monetary Fund.
Schiff M and Valdes A (1992). The Political Economy of Agricultural Pricing Policy Volume Four. A Synthesis of theEconomics in Developing Countries. Washington DC, World Bank.
Sen AK (1968). Choice of Techniques. Oxford, Blackwell.
Sen B (1995). Growth and poverty reduction: macroeconomic experience. In: World Bank, Social Impact of AdjustmentOperation. Washington DC: World Bank, Operations and Evaluation Department.
Shah A and Whalley J (1990). Tax incidence analysis of developing countries: An alternative view. World BankEconomic Review, 5(3): 535–552.
Shah A and Whalley J (1991). The redistributive impact of taxation in developing countries In: Khalilzadeh J and ShahA, ed. Tax Policy in Developing Countries: A World Bank Symposium. Washington DC, World Bank.
Spilimbergo A, Londono JL and Székely M (1999). Income distribution, factor endowments, and trade openness.Journal of Development Economics, 59: 77–101.
Stewart F, ed. (1987). Macro-Policies for Appropriate Technology. Boulder CO, Westview.
Stewart F, Thomas H and de Wilde T (1990). The Other Policy: The Influence of Policies on Technology Choice andSmall Enterprise Development. London, Intermediate Technology Publications.
Stewart F (forthcoming 2000). The root causes of conflict: some conclusions. In: Nafziger EW, Stewart F andVayryenen R, eds. War and displacement: The Origins of Humanitarian Emergencies. Oxford, OxfordUniversity Press.
Stolper W and Samuelson P (1941). Protection and real wages. Review of Economic Studies.
Taylor L and Krugman P (1978). Contractionary effects of devaluation. Journal of International Economics, 8: 445–56.
Tanzi V (1995). Macroeconomic adjustment with major structural reforms: Implications for employment and incomedistribution. Paper prepared for the Conference on Income Distribution and Sustainable Growth, World Bank,Washington DC, 1–2 June.
Teulings CN (1998). The contribution of minimum wages to increasing wage inequality. Working Paper. Rotterdam,Tinbergen Institute.
Thompson Robert L (1998). Public policy for sustainable agriculture and rural equity. Food Policy, 23(1): 1–7.
UNCTAD (1997). Trade and Development Report 1997. United Nations publication, sales no. E.97.II.D.8, New Yorkand Geneva.
UNDP (1999). Human Development Report. New York, United Nations.
Van der Hoeven R (1999). Economic reform under the Washington Consensus: Income inequality and labour marketinstitutions. Paper prepared for WIDER project meeting on Rising Income Inequality and Poverty Reduction:Are they Compatible?, WIDER, Helsinki, 16–18 July.
Waldmann RJ (1992). Income distribution and infant mortality. Quarterly Journal of Economics, 107: 1283–1302.
Wilkinson R (1996). Unhealthy Societies: The Afflictions of Inequality. London, Routledge.
Wood A (1994). North-South Trade, Employment and Inequality. Oxford, Clarendon Press.
- 30 -
Wood A (1995). Does trade reduce wage inequality in developing countries? (mimeograph). Brighton, UK, Instituteof Development Studies.
World Bank (1990). World Development Report: Poverty. Washington DC, World Bank.
World Bank (1993). Poverty and income distribution in Latin America: The story of the 1980s Report. WashingtonDC, World Bank, Technical Department, Latin America and the Caribbean.
World Bank (1995). Distribution and growth: complements, not compromises. World Bank Policy Bulletin, 6(3).