Income, housing wealth, and private school access in Britain Golo Henseke # , Jake Anders # , Francis Green # , Morag Henderson # # UCL Institute of Education 20 Bedford Way, London WC1H 0AL Abstract Access to Britain’s highly-resourced private schools matters because of concerns surrounding social mobility. Using the UK Family Resources Survey, we document a high and mostly stable income concentration of private school access since 1997. Nevertheless, some low-income participation persists. Bursaries are income-progressive but cannot account for this participation. Housing wealth is, however, found to be greater for private school participants. We estimate that a 10 per cent rise of family income and home value raises private school participation by 0.9 points, respectively. Neither effect changes over time. The income effect, however, falls sharply outside the top income decile. Keywords: income, housing wealth, private education, pseudo panel, educational inequality JEL Classification: I22, I24 Acknowledgements: The research for this paper was supported by the UKRI Economic and Social Research Council under its Secondary Data Analysis Initiative (ES/R003335/1). This is an Accepted Manuscript of an article published by Taylor & Francis in Education Economics on 18 Jan 2021, available online: http://www.tandfonline.com/10.1080/09645292.2021.1874878 . Contact details: Golo Henseke ([email protected]), UCL Institute of Education, LLAKES, 20 Bedford Way, London WC1H 0AL, UK.
Transcript
Income, housing wealth, and private school access in Britain
Golo Henseke# , Jake Anders#, Francis Green#, Morag Henderson#
# UCL Institute of Education 20 Bedford Way, London WC1H 0AL
Abstract
Access to Britain’s highly-resourced private schools matters because of concerns surrounding social mobility. Using the UK Family Resources Survey, we document a high and mostly stable income concentration of private school access since 1997. Nevertheless, some low-income participation persists. Bursaries are income-progressive but cannot account for this participation. Housing wealth is, however, found to be greater for private school participants. We estimate that a 10 per cent rise of family income and home value raises private school participation by 0.9 points, respectively. Neither effect changes over time. The income effect, however, falls sharply outside the top income decile. Keywords: income, housing wealth, private education, pseudo panel, educational inequality
JEL Classification: I22, I24
Acknowledgements: The research for this paper was supported by the UKRI Economic and Social
Research Council under its Secondary Data Analysis Initiative (ES/R003335/1).
This is an Accepted Manuscript of an article published by Taylor & Francis in Education Economics on
18 Jan 2021, available online: http://www.tandfonline.com/10.1080/09645292.2021.1874878 .
Contact details: Golo Henseke ([email protected]), UCL Institute of Education, LLAKES, 20 Bedford
This paper studies access to Britain's private schools over recent decades. This issue's relevance lies in
its potential implications for educational inequality and, hence, social mobility. In Britain, private
schools1 propel a narrow sector of the population towards successful careers in elite positions (Elliot
Major and Machin, 2018).
In some countries, private schools have little or no resource advantage over state-run schools – an
example is Germany (DESTATIS, 2016). Moreover, in many countries, private schooling has little effect
on student academic outcomes (e.g. Elder and Jepsen, 2014, Pianta and Asari, 2018, for the US;
Nghiem et al., 2015 for primary schooling in Australia). However, Britain is distinctive: the socio-
economic divide between private and state school children is among the highest in the developed
world (OECD, 2012, Table B2.3); and its private schools, funded by exceptionally high fees, have a very
substantial resource advantage over state schools (Green and Kynaston, 2019). Significant effects on
educational attainments at both primary and secondary levels have been found over the past 50 years
(e.g. Halsey et al., 1980; Feinstein and Symons, 1999; Dearden et al., 2002; Sullivan and Heath, 2003;
Malacova, 2007; Parsons et al., 2017; Henderson et al., 2020), consistent with the evidence of the
effects of large resource gaps and peer effects on academic achievement (e.g., Sacerdote, 2011).
There are considerable labour market advantages associated with Britain's private schooling
(Macmillan et al., 2015; Green et al., 2017; Belfield et al., 2018). Recruitment to the upper echelons
of power in British business, politics, administration and media continues to be tied to private schools
(Reeves et al., 2017; Sutton Trust and Social Mobility Commission, 2019). The labour market premium
for private schooling increased for generations growing up in the 1960s to 1980s (Green et al., 2012).
Considering the persistent ability of private school alumni to access high-ranking universities (Jerrim
et al., 2016) and that the higher education premium has grown more dispersed (Lindley and McIntosh,
2015; Lindley and Machin, 2016), there is little reason to expect a break in the trend. Many private
schools have become more internationalist in their orientation, both admitting more international
students and channelling more British pupils towards a global upper echelon of universities. Such a
global outlook has the potential to open up worldwide job market opportunities with high earnings
expectations (e.g. Weenink, 2008; Kenway and Fahey, 2014).
Even though only about 9 per cent of adults have ever been to a private school, the British private
school sector is, therefore, a significant pathway through which some families obtain long-term
1 Throughout this paper ‘private schools’ are fee-paying schools; elsewhere these are also variously termed ‘independent schools’, ‘prep schools’ at primary level, and confusingly ‘public schools’ in the case of the more prestigious secondary schools.
3
advantages for their children. An appreciation of the, possibly changing, extent to which participation
in Britain's private education is unequal and exclusive to those with higher income and wealth should
thus provide a highly relevant contribution to the understanding of educational and economic
inequality. While high fees make it self-evident that Britain's private schools are more accessible by
high-income families, we know little about the income concentration of private school access, how
that concentration might be changing, the extent and distribution of bursary provision, or how family
income and wealth may affect access.
This paper contributes to the small literature on private school participation in several ways. First, we
document the concentration of private school participation in family income and how it has changed
since the 1990s. We find that attendance is highly income-concentrated, but not so much that there
are not some in the low-income deciles attending private school. We also find that the concentration
ratio is quite stable over time, though there is a modest drop in the last period analysed (2011-2018).
Second, we also document that, for many, average private school fees have become unaffordable out
of family income; the change is starker for those on lower incomes. Despite the lack of affordability,
the presence of low-income families at private schools point to either bursaries or family wealth. Third,
therefore, we also document the distribution of bursaries. We find that the distribution of bursaries
is overall progressive, their value linked to financial needs, though with no evidence of substantive
change; yet most low-income private school families do not receive bursaries.
The low frequency of bursaries and declining affordability suggest an essential role of longer-term
financial family resources. In aggregate, the private wealth-income ratio in 21st century Britain is
substantially higher than in the 1980s and 1990s despite the losses following the 2008 financial crisis
(Atkison, 2018). Therefore, our fourth contribution is to estimate the marginal effects of family income
using a pseudo-panel with cells defined by the region of residence and by grouped income deciles.
Our models find a substantive, non-linear income effect. It is substantial for those in the top income
decile and smaller for those below. Fifth, we estimate the relationship of housing wealth (a large
fraction of total wealth) with private school access among owner-occupier families. We find a
significant positive association of home value with private school access, which is, unlike the income
effect, similar across the income distribution.
In Section 2 we describe the British system of private schooling and consider potential expectations
about trends in the income concentration of participation, the role of family resources in private
school choice and the distribution of fee-assistance through bursaries and scholarships. Sections 3
describes our empirical model and the primary data source, the Family Resources Survey. Our findings
are presented in Sections 4 and 5. In our conclusion, Section 6, we note the implications of our findings
for the schools' policies on bursaries and for the government's policies on social mobility.
4
2 Access to Private Schooling in Britain
2.1 The British private school sector
One in eleven schools in Britain is private. Notwithstanding some heterogeneity, private schools are
generally considered elite institutions, reflecting both the social composition of their pupil intake, their
resources and their alumni's destinations (Maxwell and Aggleton, 2015; Reeves et al., 2017). On
average, the fee income from families with children in private day schools exceeds the government
expenditure on state schools by a factor of around 2.5 or more, depending on the education stage.
When supplemented by private schools' physical and financial wealth, the per-pupil resource gap
becomes at least three (Green and Kynaston, 2019).
With these resources, British private schools can specialise in small class sizes, with a pupil-teacher
ratio of less than half that of state-maintained schools in 2016 (ISC, 2019, p. 25). Although there is
some heterogeneity across private schools, the private-state resource gap is typically much higher
than in many other countries, though data are scarce. In Germany, for example, where schools have
a legal obligation to accommodate families regardless of income, there is a financial resource gap of -
5.3 per cent at upper-secondary level (DESTATIS, 2016). In Australia, the resource advantage is 30 per
cent for non-sectarian private schools and -5 per cent for private religious schools (ACARA, 2019).
However, there is considerable fee variation linked to their pupils' social background (Lye and
Hirschberg, 2017). The United States has in recent years become another exception where non-
sectarian private schools, though relatively small in number, deploy a teacher-pupil ratio twice that in
public schools. In contrast, Catholic private schools have a slight resource advantage (Broughman et
al., 2019).
Private schools are managed and governed autonomously. Three-quarters of are charities, which
them for a small amount of public subsidy through tax relief. Since the start of the 1980s, private
schools' resources have transformed. With the cessation of the Assisted Places Scheme that ran from
1981 till 1997 (Whitty et al., 1998), neither schools nor potential pupils receive direct public subsidies
except for small government programmes targeted at vulnerable children in foster care or those
qualifying for the UK's Music & Dance Scheme in specialist schools.
There are notable regional variations in the availability of private schools. For example, in England's
North East, there were 1.2 private schools per 10,000 pupils whereas, in the South East and Greater
London, the figures were 3.6 and 3.8 private schools, respectively (DfE, 2018). In Wales and Scotland,
the figures were 1.5 and 1.4 private schools per 10,000 pupils (Scottish Government, 2018; Welsh
Government, 2018). Although boarding is an option for the very affluent, region-specific differences
in private school provision will likely correlate with participation.
5
Since the 1980s, the average participation rate in private education has remained stable at around 7
per cent of all school pupils in England (DfE, 2018). Yet private schools now operate in a different
environment from the one they faced in 1980. The external economic and social context has changed
substantially through wider access to higher education, rising 'value' of education credentials,
increased income and wealth inequality, and the emergence of a global elite in a connected world.
Approximately 5 per cent of the pupils in Britain's private schools have non-British parents living
abroad (Ryan and Sibieta, 2011).
2.2 Inequality of access and the determinants of private school participation
Broader economic developments will have affected the extent and distribution of private school
participation in contrasting ways since the 1990s: the pull of the earlier discussed potentially
increasing benefits; the increasing costs; changes in the provision of means-tested bursaries; changes
in income and wealth inequality and in the relationship between family income and wealth – especially
given increases in housing wealth and potential wealth transfers within the extended family.
The costs of private schooling have risen considerably. By 2018 the average annual fee before any
extras had reached £14,280 for day school and £33,684 for boarding school: in real terms about 60
per cent above the figures for 2000, and three times the 1980 fees. Meanwhile, while income
inequality has fallen a little since its peak in 20012, the rising wealth-income ratio may have enabled
some lower-income families to gain better access to private school than before.
Fee reductions for some students are also potentially important. In Britain, the Assisted Places
Scheme– through which the state had funded, at its height in 1998, 8.5 per cent of places at private
schools – was ended in 1997 and fully phased out by 2004 (Whitty et al., 1998). Spurred by the
requirements of the Charities Act 2006, provision of means-tested bursaries expanded. The
Independent Schools Council (ISC), the umbrella association of UK private school groups, reported in
2019 that around 28 per cent of pupils received some financial assistance from the schools, up from
19 per cent in 1998. Fee discounts, typically small reductions for siblings or for teachers' children, were
the most common form of financial support (13.2 per cent of students), followed by scholarships (10.8
per cent) and means-tested bursaries (7.8 per cent) (ISC, 2019). Only one per cent of pupils attended
for free. While scholarships are allocated based on academic or cultural/sporting abilities, the award
of means-tested bursaries often also entails academic or other ability selection. In total, the bursaries
amount to about four per cent of private school turnover.
With these developments pulling in different directions, it is impossible to state whether access to
private school has become more or less dependent on family finances over time. Earlier studies of
private school choice in Britain have found that current and permanent income enters non-linearly;
that other socio-economic background indicators and school location are also important; and that
demand is sensitive to price with an estimated elasticity of -0.26 for private school choice at age 7
(Anders et al., 2020; Blundell et al., 2010; Dearden et al., 2011). Furthermore, sociological research
has found a mix of motivations and some ambivalence among parents choosing private schooling;
emphasising roles both for traditional values and allegiances and for an instrumental approach to
choosing private education as a way to gain access to high-ranking universities and rewarding careers
(Anders et al., 2020; Fox, 1985; Ball, 1997; West et al., 1998; Foskett and Hemsley-Brown, 2003).
Educational choices are likely to be taken for a long horizon, given the costs of switching between
sectors. In Britain, school choices generally happen at key ages: seven, eleven (sometimes 13) and 16.
Given the magnitude of the investments, the choice of school sector will be affected by long-term
financial family resources (Carneiro and Ginja, 2016). Wealth gains may influence school choice either
through life-cycle wealth effects or by relaxing credit constraints through additional collateral (Cooper,
2013). There is a positive association of household net worth with total educational achievement in
Britain (McKnight and Karagiannaki, 2013). Private households hold about two-thirds of their wealth
(except pensions) in property (ONS, 2018). Home value gains may thus have the potential to influence
household decisions, including educational choices. In general, housing wealth has been found to
correlate with outcomes such as household consumption, individual health, fertility, and labour supply
(Dettling and Kearney, 2014; Fichera and Gathergood, 2016; Burrows, 2018; Disney and Gathergood,
2018). Lovenheim and Reynolds (2013) found that housing wealth gains changed students' chances to
access flagship universities in the US. Although with notable regional heterogeneity, residential real
estate prices have more than doubled in real terms since 2000 across England (HM Land Registry,
2018b). At the same time, equity withdrawal expanded (Reinold, 2011). Therefore, it appears
appropriate to consider the role of family wealth either in property or financial assets in addition to
income to study private school access.
In light of the above, our empirical description and analysis address these questions: How has the
family income concentration of private school attendance been changing in Britain? Who receives
bursaries: how large are they and are they progressive in their distribution? What are the effects of
family income? What is the correlation of housing wealth with private school access?
3 Data and Variables
3.1 Data
Our primary data comes from the Family Resources Survey (FRS) and the Households Below Average
Income (HBAI) programme. The FRS is a series of annual cross-sectional random probability surveys of
7
private households in the UK. Since its launch in 1994, it has collected information on household
composition, economic activity, income and broader financial resources from all adults in around
25,000 households (20,000 after 2010) (DWP, 2018a, 2018b). We use data from 1997 onward for
families in Great Britain with dependent children aged 5-15 years (the years of compulsory primary
and secondary schooling). We further restrict the sample to families with family heads aged 25-64
years to avoid confounding from transitions into and out of the labour market.
FRS queries survey participants "What type of school or college does [name] attend?" From the
responses, we derive private school attendance as a dummy that distinguishes children in private
schools (defined as any school where at least some pupils pay fees) from children in state-maintained
schools. Because the focus is on mainstream primary and secondary schools, we remove observations
on special schools and on those few who have moved on to non-advanced further education.3 In all,
the analytical sample includes information about 157,618 children in 99,118 families.
3.2 Measuring income and home value
FRS includes detailed questions about families' current income from all sources. As part of HBAI, the
Department for Work and Pensions re-weights and imputes very high incomes to compensate for
under-representation and under-reporting in the raw data at the top of the income distributions. This
is unique among income surveys. Although not without issues, the procedure goes some way towards
reconciling the survey data with data from income tax records (Burkhauser et al., 2018). All monetary
variables are in 2018/19 prices. Under the assumption that all family members benefit equally from
total disposable income, we equivalise total net income by dividing it by the square root of family size,
i.e. the combined number of adults and dependent children in the family.
FRS asks a set of questions about households' housing tenure, the type of accommodation (detached,
semi-detached, terraced, flat, others), the number of bedrooms, the council tax band, and, for
mortgaged home-owners (86% of all owner-occupiers in the survey), the purchase price and the year
of purchase. However, the survey does not collect information on the current value of the property.
Thus, to examine the role of housing wealth changes for private school access, we treat it as a missing
data problem and impute plausible values of the current home value for all owner-occupier families
from the information in the survey using a multiple imputation approach. Multiple imputations can
3 While the school type question has remained unchanged throughout, the wording of the response option underwent a minor change, from “Any PRIVATE school (prep or secondary)” before the 2002/2003 wave to “Any PRIVATE/Independent school (prep, primary, secondary, City Technology Colleges)” thereafter. This coincided with a significant increase in the estimated private school participation rate from 3.4 percent in 2001 to 4.4 percent between in 2002. Yet a simple pooled OLS regression of private school participation on income decile interacted with period dummies in the pooled 2001/2002 data revealed no significant period-income rank interaction effects (F=0.71, p=0.70). We judge that this change is unlikely to seriously bias the trend analysis of private school access.
8
lead to consistent and asymptotically efficient estimates whilst allowing for greater flexibility than a
system of equations (Allison, 2002).
In the imputation stage, we estimate a log-linear regression model of the of the initial purchase price
of the accommodation in 2018/19 prices on the number of bedrooms, type of accommodation, council
tax band, and purchase year in addition to the covariates of the analytical model in the sample of
mortgagors with children aged 5-15 years over the survey waves 1997/98-2018/19. Year of purchase
enters as a linear and quadratic time trend which can vary by family income rank and region. The
estimated coefficients together with random draws form the residual distribution are used to predict
multiple plausible values of the log property value at 2018/19 prices for each owner-occupier
household with children aged 5-15 years in FRS from 1997 onward. Table A1 in the appendix
summarises the imputation model. Because current home value is missing for all but 2.2 per cent of
owner-occupiers who purchased their accommodation in the survey year, we generate 50 imputation,
which is a relatively large number of imputations (Graham et al., 2007). Averaged over the different
imputations by survey year, government region, and property type, there is a strong correlation
(r=0.87) of the imputed home value with average property prices published by the HM Land Registry
(HM Land Registry, 2018a). See table A2 in the appendix for details. In subsequent analyses, estimation
results from the 50 imputations are pooled to obtain consistent home value effects with appropriate
standard errors.
Furthermore, FRS also includes information on financial awards (scholarship, bursary, grant or similar
award) for education for children in secondary education or above. From this information, we
construct an indicator variable whether a child in lower secondary education receives any bursary/
scholarship and if so, the total annual value deflated to 2018/19 prices.
Besides these variables, we also use information about the region of residence, the number of adults
in the family, the age of the family head, housing tenure, the parents' socio-economic class and their
age when leaving full-time education in the imputation and analytical model.
4 Analytical Model
To test the relationship of financial family resources with private school access, we draw on a set of
common assumptions which imply a structural relationship between both (e.g. Acemoglu and Pischke,
2001; Solon, 2004).
Parents care about their children's future life chances and decide whether to enrol their children at a
private school. The decision is assumed to be non-separable over time, reflecting typical school
choices at the beginning of primary and secondary school, respectively. Because credit markets are
9
imperfect, parents cannot borrow against their children's future human capital returns. Since there is
no public loan scheme that could help to secure credit, private school access will depend on families'
access to financial resources through income and capital markets. For wealthy, high-income families
who are not credit constrained in their decision to send their children to private school, additional
financial resources may not affect the private education decision; except if private education has
characteristics of a consumption good. However, for families who are credit constrained a rise in
lifetime income or wealth is predicted to increase the likelihood of investing in private education.
Moreover, we assume a third group of lower-income parents who face an affordability constraint,
namely that lifetime consumption is constrained to be above an absolute minimum. For all in this
group, the decision is the corner solution of non-participation; even in response to marginal increases
in income or wealth. Additional wealth can raise private school access by relaxing credit constraints
through a collateral effect or by easing the lifetime budget constraints.
Our econometric model builds on these assumptions:
𝑆𝑖𝑡∗ = 𝛽1 ln 𝑌𝑖𝑡 + 𝛽2Xit + ∑ 𝛿𝑟𝑡
r
+ αit + 휀𝑖𝑡 (1)
Demand for private school education for children of family i, 𝑆𝑖𝑡∗ , is a function of the natural log of
permanent family resources, 𝑌𝑖𝑡 (income or home value), a set of control variables with an influence
on financial family resources and private school access, region-by-year effects, 𝛿𝑟𝑡, and a family-
specific taste shifter for private education, 𝛼𝑖𝑡, which can include expected returns from private school
education. The region-by-year effects control for common factors that influence all families within
regions and years and will be modelled by region-specific linear time trends. The effect of financial
family resources on private school access is given by 𝛽1. The term 𝛼𝑖𝑡 is unobserved and possibly
correlated with financial family resources 𝑌𝑖𝑡 and school choice. Thus, a cross-sectional analysis will
potentially lead to biased estimates.
Moreover, while private school choice will depend on longer-term resources such as permanent
income, survey data measures current income. The gap between measured current and family
permanent income can be either transitory shocks to family income or measurement error. If ignored,
this gap will attenuate the estimated income effect.
To solve both issues, we construct cohorts that we track through repeated cross-sections to estimate
a fixed-effects model (Deaton, 1985). By aggregating the family decision to the cohort level, we derive
the following model:
𝑆c̅t = 𝛽1 ln 𝑌̅̅ ̅̅c̅t + 𝛽2�̅�𝑐𝑡 + ∑ 𝛿𝑟𝑡
r
+ �̅�ct + 휀�̅�𝑡 (2)
10
where 𝑆c̅t = ∑𝑆𝑖𝑡
𝑛𝑐𝑡∀𝑖 ∈ 𝑐 𝑖 is the proportion of privately educated children for all 𝑛𝑐𝑡 children in family
cohort 𝑐 at time 𝑡. Similarly, �̅�𝑐𝑡 are the average permanent family resources of cohort 𝑐 at time 𝑡,
respectively. Because region and period effects are assumed to be the same for all cohorts who live in
region 𝑟 at time 𝑡, 𝛿𝑟𝑡 remains unchanged.
Since the families who form the cohorts in the sample will differ for each year, �̅�ct is time-variant.
Following the literature around pseudo-panels, we can treat �̅�ct as an unknown fixed parameter with
�̅�ct = 𝛼𝑐 if sample sizes for each cohort are sufficiently large (Deaton 1985; Verbeek 2008).
Thus, the pseudo-panel allows assessing the effect of family financial resources for private school
access whilst holding unobserved heterogeneity constant. Similarly, in a pseudo-panel with sufficiently
large cohorts, the average measurement error in family resources should approach zero and eliminate
classic attenuation bias from switching to a fixed effect strategy (Antman and McKenzie, 2007). For
income, �̅�𝑐𝑡 is, therefore, closer to the concept of permanent income, 𝛿𝑟𝑡 will pick up common trends
that affect all families within a region. However, if measurement error occurs at the cohort level, the
resulting pseudo-panel estimates may remain biased. Therefore in robustness analyses, we use an
alternative cohort definition.
Families are grouped into mutually exclusive cohorts, c, based on family income decile and region of
residence. There is a trade-off between cohort size and the number of observations in the panel. We
distinguish between families with incomes in the tenth decile, in the seventh to the ninth decile, in
the fourth to the sixth decile, and families with incomes at or below the third decile across eight British
regions (North East and Yorkshire, North-West, the Midlands, East of England, Greater London, South
East, South West, and the combined devolved nations of Scotland and Wales). Income deciles were
calculated for each survey sample of all non-pensioner families with children in the age bracket 5-15
years in Great Britain. The 32 family cohorts are tracked over the 22 cross-sections of the FRS 1997-
2018. Table A3 in the online appendix gives mean cohort sizes. Alternatively, in robustness analyses,
we also look at cohorts-based on region and socio-economic class instead of income rank.
We arrive at the following baseline estimation model:
𝑆c̅t = 𝛽1𝐼,𝐻 ln Y𝑐𝑡
𝐼,𝐻̅̅ ̅̅ ̅̅ ̅̅ + 𝛽2�̅�𝑐𝑡 + ∑ 𝛿𝑟𝑡
r
+ αc + 휀�̅�𝑡 (3)
The model identifies family resource effects, 𝛽𝐼for income and 𝛽𝐻for home value, on school access
through variations in ln 𝑌𝑐𝑡⋅̅̅ ̅̅ ̅̅ ̅ conditional on income rank, region and region-period effects. The family
income effect, 𝛽1𝐼, is identified from differential income growth over the income distribution within
regions. Likewise, the home value effect 𝛽2𝐻 is identified from the differential growth of home values
across family income ranks within regions. As in Acemoglu and Pischke (2001), families' rank in the
11
income distribution is thought to control for their unobservable characteristics. Because private school
fees are high and credit markets are imperfect, we will also test if 𝛽𝐼 or 𝛽𝐻 differ across grouped
income deciles.
Like with any other method, there are some caveats. First, the fixed effects estimator can be imprecise
without enough time variation in the dependent and independent variables. Although there is within
variation in cell-average income, home values, and private school participation, it is conceivable that
with finite samples, some cohorts contribute little information to the parameter estimates. To assess
the importance of sources of variation, we also estimate more restrictive models with αc = 𝛼 and
pooled period effects δrt = δt . Second, while the fixed effects estimator conditions out time-
invariant unobserved characteristics, omitted time-variant factors might lead to biased estimates. For
example, the analysis of home values on private school participation is limited to the self-selected
group of home-owners. If the percentage of home-owning families with children remained the same
within cohorts, the fixed effects would condition out the unknown selection mechanism. However,
homeownership has started to slip after 2007 from 68 per cent to 57 per cent of families in 2018,
which suggests possible changes in the selection mechanism. Ideally, we would instrument for self-
selection. In the absence of a convincingly exogenous time-varying instrument, the set of time-variant
control variables, �̅�𝑐𝑡 , can account for some of the changes. But even if the parameter estimate for
𝛽2𝐻 is biased upward, it can still document how changing access to permanent private financial
resources may facilitate private school access.
5 Documenting the Income Concentration of Private School Participation and Bursary Provision.
The main aim of this section is to document, for the first time, the extent to which private school
participation is family income concentrated, and whether this concentration is changing. In addition,
we describe the extent of bursary provision and its correlates; if large enough and income-progressive,
bursaries might be expected to modify the link between family resources and private school
participation.
5.1 Income Concentration
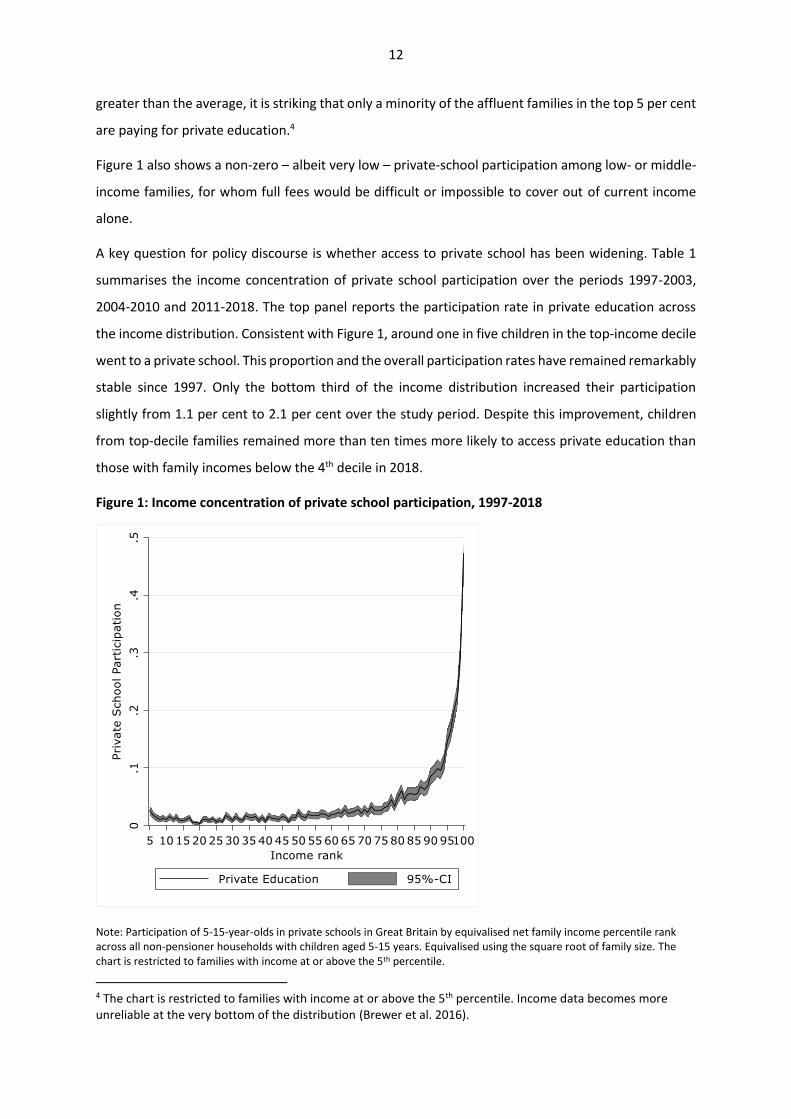
Figure 1 plots participation in private schooling after 1997 against the percentile rank of net
equivalised weekly family income for families with children in the 5-15 age range. It shows the extent
to which participation is especially skewed at the very top of the income distribution. At the 100th
percentile, about half of the children go to private school. At the 95th percentile, however, this
proportion is much lower, with only 15 per cent of children in the private sector. While still much
12
greater than the average, it is striking that only a minority of the affluent families in the top 5 per cent
are paying for private education.4
Figure 1 also shows a non-zero – albeit very low – private-school participation among low- or middle-
income families, for whom full fees would be difficult or impossible to cover out of current income
alone.
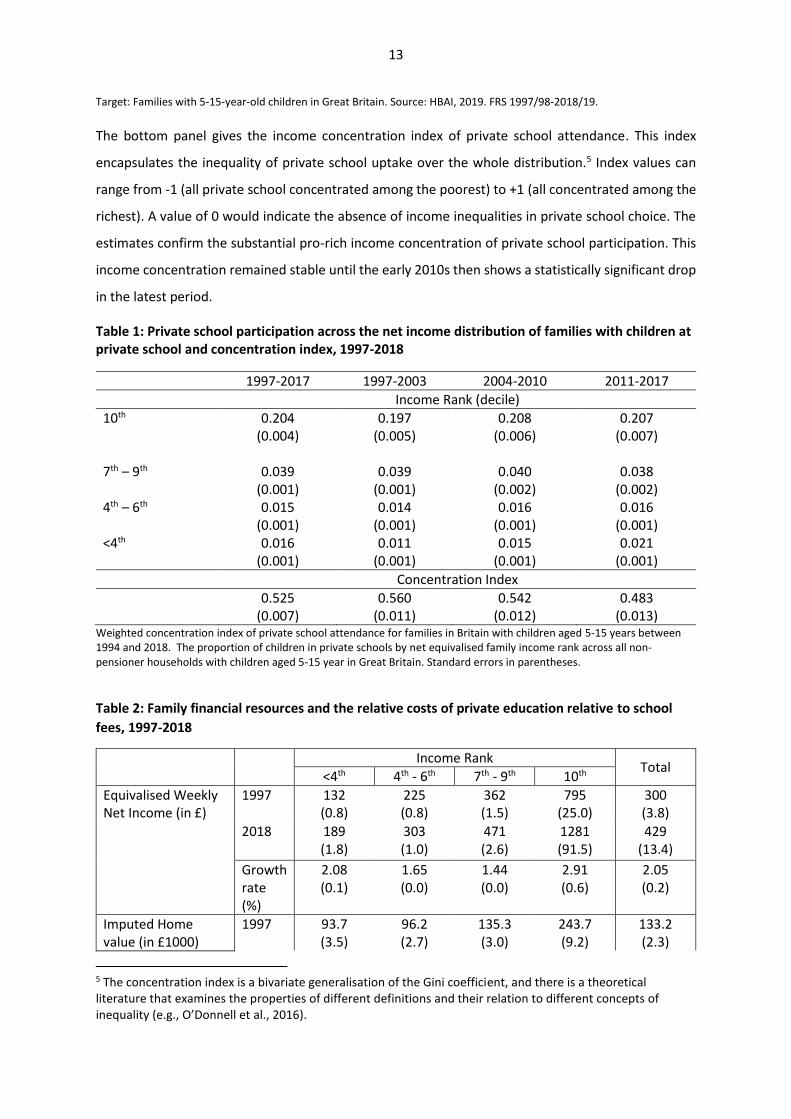
A key question for policy discourse is whether access to private school has been widening. Table 1
summarises the income concentration of private school participation over the periods 1997-2003,
2004-2010 and 2011-2018. The top panel reports the participation rate in private education across
the income distribution. Consistent with Figure 1, around one in five children in the top-income decile
went to a private school. This proportion and the overall participation rates have remained remarkably
stable since 1997. Only the bottom third of the income distribution increased their participation
slightly from 1.1 per cent to 2.1 per cent over the study period. Despite this improvement, children
from top-decile families remained more than ten times more likely to access private education than
those with family incomes below the 4th decile in 2018.
Figure 1: Income concentration of private school participation, 1997-2018
Note: Participation of 5-15-year-olds in private schools in Great Britain by equivalised net family income percentile rank across all non-pensioner households with children aged 5-15 years. Equivalised using the square root of family size. The chart is restricted to families with income at or above the 5th percentile.
4 The chart is restricted to families with income at or above the 5th percentile. Income data becomes more unreliable at the very bottom of the distribution (Brewer et al. 2016).
13
Target: Families with 5-15-year-old children in Great Britain. Source: HBAI, 2019. FRS 1997/98-2018/19.
The bottom panel gives the income concentration index of private school attendance. This index
encapsulates the inequality of private school uptake over the whole distribution.5 Index values can
range from -1 (all private school concentrated among the poorest) to +1 (all concentrated among the
richest). A value of 0 would indicate the absence of income inequalities in private school choice. The
estimates confirm the substantial pro-rich income concentration of private school participation. This
income concentration remained stable until the early 2010s then shows a statistically significant drop
in the latest period.
Table 1: Private school participation across the net income distribution of families with children at private school and concentration index, 1997-2018
1997-2017 1997-2003 2004-2010 2011-2017
Income Rank (decile)
10th 0.204 (0.004)
0.197 (0.005)
0.208 (0.006)
0.207 (0.007)
7th – 9th 0.039
(0.001) 0.039
(0.001) 0.040
(0.002) 0.038
(0.002) 4th – 6th 0.015
(0.001) 0.014
(0.001) 0.016
(0.001) 0.016
(0.001) <4th 0.016
(0.001) 0.011
(0.001) 0.015
(0.001) 0.021
(0.001)
Concentration Index
0.525 (0.007)
0.560 (0.011)
0.542 (0.012)
0.483 (0.013)
Weighted concentration index of private school attendance for families in Britain with children aged 5-15 years between 1994 and 2018. The proportion of children in private schools by net equivalised family income rank across all non-pensioner households with children aged 5-15 year in Great Britain. Standard errors in parentheses.
Table 2: Family financial resources and the relative costs of private education relative to school
fees, 1997-2018
Income Rank Total
<4th 4th - 6th 7th - 9th 10th
Equivalised Weekly Net Income (in £)
1997 132 (0.8)
225 (0.8)
362 (1.5)
795 (25.0)
300 (3.8)
2018 189 (1.8)
303 (1.0)
471 (2.6)
1281 (91.5)
429 (13.4)
Growth rate (%)
2.08 (0.1)
1.65 (0.0)
1.44 (0.0)
2.91 (0.6)
2.05 (0.2)
Imputed Home value (in £1000)
1997 93.7 (3.5)
96.2 (2.7)
135.3 (3.0)
243.7 (9.2)
133.2 (2.3)
5 The concentration index is a bivariate generalisation of the Gini coefficient, and there is a theoretical literature that examines the properties of different definitions and their relation to different concepts of inequality (e.g., O’Donnell et al., 2016).
14
2018 277.0 (17.4)
266.3 (14.5)
343.8 (13.2)
636.5 (44.5)
366.1 (11.2)
Growth rate (%)
9.32 (1.0)
8.42 (0.8)
7.34 (0.6)
7.67 (1.0)
8.32 (0.5)
The ratio of annual average regional day school fees to mean equivalised net family income (in %)
1997 106.2 (0.69)
62.8 (0.27)
39.3 (0.19)
17.9 (0.61)
47.3 (0.59)
2018 133.1 (1.31)
84.7 (0.49)
55.2 (0.39)
25.7 (1.01)
61.6 (1.91)
Δ 26.9 (1.48)
21.9 (0.56)
15.9 (0.43)
7.8 (1.18)
14.3 (2.00)
The ratio of annual average regional day school fees to imputed home value (in %)
1997 7.8 (0.3)
7.6 (0.2)
5.5 (0.1)
3.1 (0.1)
5.5 (0.1)
2018 4.8 (0.3)
5.0 (0.3)
4.0 (0.1)
2.3 (0.2)
3.7 (0.1)
Δ -3.0 (0.4)
-2.6 (0.3)
-1.5 (0.2)
-0.8 (0.2)
-1.8 (0.1)
Base population comprises domiciled pupils aged 5-15 years. Mean equivalised weekly net family income in 2017/2018 prices. Mean imputed home value for owner-occupiers from 50 plausible values (for details see Table A1). Regional average day school fees from annual ICS census 1997/2018. Standard errors in parentheses.
The comparative stability in both the rate and the distribution of private school participation contrasts
with trends in the 'affordability' of private education out of family income. The first panel of Table 2
shows the rises of incomes between 1997 and 2018, while the second panel shows the rises in home
value, at each income decile. Overall, income grew at about two per cent per year. Within income
groups, family income rose fastest at the top and the bottom of the income distribution. Home value
increased substantially more than family incomes. Average home value expanded 2.7-fold from
£133,200 in 1997 to £366,100 in 2018, an increase of about eight per cent per year. Top-income
families saw the largest absolute rise in projected home value, but the relative gains were larger for
the lower 60 per cent of the family income distribution. Given this strong growth, housing wealth gains
may have contributed to family resources for private education among home-owners.
The third panel then shows the substantively declining affordability of school fees relative to net family
income: from 18 per cent to 26 per cent at the top decile, and from 106 per cent to 133 per cent for
those in the bottom third. Indeed, by 2018, only those in the top decile could send children to private
school without spending more than half their income per equivalised family member. The last panel
shows, however, that affordability in relation to home value, for owner-occupiers, improved
significantly.
15
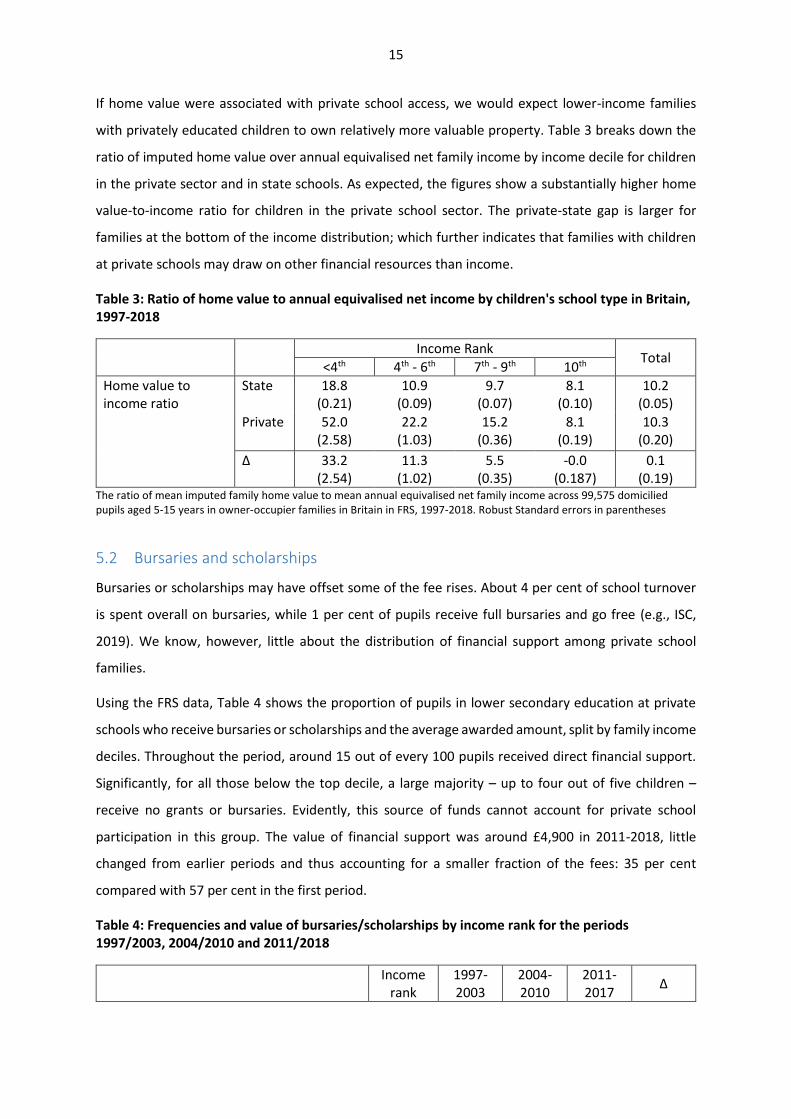
If home value were associated with private school access, we would expect lower-income families
with privately educated children to own relatively more valuable property. Table 3 breaks down the
ratio of imputed home value over annual equivalised net family income by income decile for children
in the private sector and in state schools. As expected, the figures show a substantially higher home
value-to-income ratio for children in the private school sector. The private-state gap is larger for
families at the bottom of the income distribution; which further indicates that families with children
at private schools may draw on other financial resources than income.
Table 3: Ratio of home value to annual equivalised net income by children's school type in Britain, 1997-2018
Income Rank Total
<4th 4th - 6th 7th - 9th 10th
Home value to income ratio
State 18.8 (0.21)
10.9 (0.09)
9.7 (0.07)
8.1 (0.10)
10.2 (0.05)
Private 52.0 (2.58)
22.2 (1.03)
15.2 (0.36)
8.1 (0.19)
10.3 (0.20)
Δ 33.2 (2.54)
11.3 (1.02)
5.5 (0.35)
-0.0 (0.187)
0.1 (0.19)
The ratio of mean imputed family home value to mean annual equivalised net family income across 99,575 domicilied pupils aged 5-15 years in owner-occupier families in Britain in FRS, 1997-2018. Robust Standard errors in parentheses
5.2 Bursaries and scholarships
Bursaries or scholarships may have offset some of the fee rises. About 4 per cent of school turnover
is spent overall on bursaries, while 1 per cent of pupils receive full bursaries and go free (e.g., ISC,
2019). We know, however, little about the distribution of financial support among private school
families.
Using the FRS data, Table 4 shows the proportion of pupils in lower secondary education at private
schools who receive bursaries or scholarships and the average awarded amount, split by family income
deciles. Throughout the period, around 15 out of every 100 pupils received direct financial support.
Significantly, for all those below the top decile, a large majority – up to four out of five children –
receive no grants or bursaries. Evidently, this source of funds cannot account for private school
participation in this group. The value of financial support was around £4,900 in 2011-2018, little
changed from earlier periods and thus accounting for a smaller fraction of the fees: 35 per cent
compared with 57 per cent in the first period.
Table 4: Frequencies and value of bursaries/scholarships by income rank for the periods 1997/2003, 2004/2010 and 2011/2018
Income rank
1997-2003
2004-2010
2011-2017
Δ
16
Private secondary schools in receipt of grants/ bursaries (%)
10th 9.7 (1.3)
14.0 (1.6)
10.0 (1.7)
0.3 (2.2)
7th – 9th 14.9 (1.9)
14.1 (1.9)
20.8 (2.7)
5.9 (3.3)
≤6th 25.1 (2.6)
17.2 (2.4)
25.8 (3.2)
0.7 (4.2)
Total 14.8 (1.0)
14.8 (1.1)
16.1 (1.4)
1.3 (1.7)
The average annual value of grants/ bursaries per supported student (in £ at 2018/2019 prices)
10th 4,104 (494.0)
3,670 (463.0)
3,033 (494.1)
-1,072 (698.7)
7th – 9th 5,239 (844.0)
5,140 (655.9)
5,339 (713.5)
100 (1105.2)
≤6th 5,466 (536.2)
6,399 (966.1)
6,300 (920.9)
834 (1065.7)
Total 4,981 (367.9)
4,801 (388.5)
4,907 (456.7)
-73 (586.4)
The average annual value of grants as fraction of average day school fees per supported student (%)
Total 56.9 (4.2)
39.1 (3.2)
35.4 (3.3)
-21.5 (1.0)
Note: Base population comprises pupils aged 11-15 years; standard errors in parentheses.
Both the allocation and the value of bursaries are, as expected, progressive with respect to parents'
incomes. Nonetheless, even at the 10th decile, around ten per cent of students received financial aid.
It is conceivable that these are scholarships, that eligibility is not only tested against income, or that
schools are not fully informed about parent's financial circumstances. Relatively large standard errors
make it difficult to draw confident conclusions about the changing degree of progressiveness.
Nevertheless, there is a suggestion of a decline in the allocation of bursaries to lower-income families
in the middle period (following the cessation of the Assisted Places Scheme) and recovery thereafter,
and an increasingly progressive redistribution of the awarded amount to lower-income families.
To analyse who received bursaries or grants we ran separate multivariate analyses (see Table A4 in
the online appendix). These show that economic needs matter for the amount awarded and the
likelihood of receiving an award. Higher levels of material deprivation, a family head who is not in
work, and family income below the top-10 per cent are jointly associated with the likelihood and the
annual value of bursaries. Overall, however, the data could not conclusively support claims that the
private school sector has widened access for students from low-income families through more
generous financial support.
6 Analysis of Income and Wealth Effects
Given that the affordability of fees out of income seems in question for all but the top-income decile,
and that bursaries are far too small to explain much of the participation, we now turn to analyse the
effects of family resources in the pseudo-panel described above. If private school access remained
17
tied to family financial resources, we would expect to find substantive and time-constant income and
home value effects.
6.1 Family income
First, we consider family income effects. Table 5 reports our main findings. In column (1), we condition
only on a linear time trend and a set of socio-demographic control variables. The coefficient of family
income is 0.119. However, this estimate does not account for unobserved heterogeneity in the family
background across income ranks and regions. In column (2), we thus add panel fixed effects (income
rank-region dummies). The estimated income effect drops to 0.088.
Column (3) give the headline estimate based on equation (3). Despite panel fixed effects, control
variables and regional time trends, the coefficient of mean log family income remains substantial at
0.088. In other words, a 10 per cent increase in family income is associated with a 0.9 point rise of
private school participation. Out of the 19-point participation gap between children from the top
decile and the bottom third of the income distribution, income alone can roughly explain 17 points
(0.088×LN(1,279/189)).
The descriptive analysis points to largely stable private school access across the income distribution.
Column (4) confirms this conclusion. An interaction term between log income and the linear time
trend is indistinguishable from zero. The importance of income for private school access has thus
changed very little over the last two decades.
Our conceptual framework allows for heterogeneous income effects across the income distribution.
Therefore, column (5) estimates income effects for each income bracket. According to the estimates,
marginal income effects on private school participation are largest for families in the top decile, where
the estimate is 0.135. For families below the top income decile, increases in cell-average income might
raise private school access by less. An F-test of equal income effects across the income distribution is
rejected (F(3,31)=4.16, p=0.014). Overall, there is no evidence of a very affluent group unaffected by
income – a finding similar to that of Acemoglu and Pischke (2001) regarding college attendance in the
US.
Robustness tests with the pseudo-panel based on socio-economic class instead of income deciles lead
to similar conclusions: Income affects private school access, the effect does not change with time, and
the point estimates are larger for families at the top of the socio-economic hierarchy. Table A5 in the
appendix summarises.
Table 5: Income effects on the probability of attending private school from pseudo-panel fixed effects regressions (N=704), 1997-2018
(1) (2) (3) (4) (5)
18
Mean log family income 0.119*** (0.025)
0.088** (0.027)
0.088** (0.027)
0.088** (0.027)
Mean log family income # (Linear time trend)
-0.000 (0.000)
Mean log family income # (10th income decile)
0.135*** (0.031)
(7th – 9th income decile)
0.035 (0.025)
(4th – 6th income decile)
0.045* (0.021)
(<4th income decile)
0.047** (0.017)
FE NO YES YES YES YES Linear time trend YES YES YES YES YES Region # trend NO NO YES YES YES Control variables YES YES YES YES YES
Estimates from a pseudo-panel of 704 cells of eight aggregate regions, four grouped income decile of pupils' family income, and 22 survey years. The dependent variable is the proportion of students aged 5-15 years in private schools within cells derived from the FRS, 1997/1998-2018/2019. Control variables comprise the cell proportions of family heads in the age groups 35-54 and 55-64 years, the share of two-parent families, average number of dependent children, and the average age of leaving full-time education among parents. Cells weighted by the square root of the number of families. Heteroscedasticity and autocorrelation robust standard errors with clusters at region-income ranks level in parentheses. * p < 0.05, ** p < 0.01, *** p < 0.001.
6.2 Housing wealth
We next assess how housing wealth, through home value changes, correlate with private school
participation. This is done for owner-occupier families, for whom we imputed current home value
deflated to 2018/19 prices as described earlier.
Table 6 presents estimates for the effect of home value on private school attendance. Column (3) has
the key finding from an estimation of equation (3): a 10 per cent appreciation of projected home value
for owner-occupier families raised private school participation by 0.9 points; unchanged over the last
two decades (column 4). The addition of panel fixed effects and region-period effects slightly
increased the estimated coefficient of home value compared with column (1).
Columns (5) estimates separate home value effects by family income band. As before, income deciles
are based on the family income distribution across all non-pensioner households with children aged
5-15 in Great Britain in each survey wave. Unlike for family income, the home value effect does not
seem to vary across the income distribution.
Although owner-occupiers are a self-selected sub-sample the family income effect on private school
access in columns (6) is similar to the estimate in column (3) of Table 5. With the addition of home
value (column 7), the income effect drops to 0.041, whereas the estimated impact of home value
19
remains substantial at 0.078. It appears that it is the access to permanent wealth, measured by home
value, rather than family income that influences private school access among owner-occupier families.
Robustness tests in the alternative pseudo panels confirm the substantial and stable (over time and
across income ranks) effect of home value on private school access for owner-occupier (Table A6 in
the online appendix).
Table 6: The effects of home value on the probability of attending private school from pseudo-panel fixed effects regressions, 1997-2018
(1) (2) (3) (4) (5) (6) (7)
Mean log home value 0.072** (0.020)
0.085*** (0.023)
0.093*** (0.023)
0.095*** (0.024)
0.078** (0.023)
Mean log family income 0.071** (0.021)
0.041 (0.020)
Mean log home value # (Linear time trend)
0.000 (0.001)
Mean log home value # (10th income decile)
0.103** (0.029)
(8th – 9th income decile)
0.087** (0.026)
(6th -7th income decile)
0.083** (0.024)
(≤5th income decile)
0.099*** (0.024)
FE NO YES YES YES YES YES YES Linear time trend YES YES YES YES YES YES YES Region # trend NO NO YES YES YES YES YES Control variables YES YES YES YES YES YES YES
F(constant home value effect) – p-value
0.246
Results from a pseudo-panel of 704 cells from 8 regions, four grouped income decile of pupils' family income and 22 survey years. The dependent variable is the proportion of students aged 5-15 years in private schools within cells derived from the FRS, 1997/1998-2018/2019. The population are children aged 5-15 in owner-occupier families. Controls comprise the proportion of family heads aged 35-54 and 55-64 years, the share of two-parent families, the average number of dependent children, and the average age of leaving full-time education. Cells weighted by the square root of the number of families in the cell. Heteroscedasticity and autocorrelation robust standard errors in parentheses with clusters at region-income ranks level. * p < 0.05, ** p < 0.01, *** p < 0.001.
7 Conclusions
Access to private schools in Britain matters, given the success these schools have in incubating future
elites, and the important discourse surrounding social mobility. The fees have risen much more than
income, to the extent that the costs for just one child have become more than half of net family
income per family member for all but the highest income decile, while the ratio of housing wealth to
fees has changed little. The degree of income concentration is high, despite a small fall in the recent
20
period: the income concentration index is 0.48 over 2011-2018. For comparison, access to after school
activities such as sports clubs is associated with an income concentration index of 0.08. A small
proportion of non-income-rich households do attend private school. Though income progressive and
related to need, bursaries and grants are relatively low in value and distributed to only one in five of
families outside the top decile; they cannot, therefore, account for more than a minor share of the
participation of these non-income-rich families. However, among home-owners, non-rich families
with privately educated children have much greater housing wealth than families with children in state
schools. Other factors, including parental values and location (distance from good quality state
schooling), are also significant determinants of private school choice. Being steady over time, these
factors affect choices specifically of those able to afford the fees through either income or wealth
(Anders et al., 2020).
Following these descriptive findings, we have deployed pseudo-panel methods to estimate that the
income effect of a 10 per cent income rise on private school access is a 1.35 percentage point rise in
participation for top-income families; and substantially smaller outside the top-income decile. The
impact of a 10 per cent rise in housing wealth is for a 0.9 percentage point rise in participation for
home-owner families. These effects are substantial.
These results contribute further understanding to debates about Britain's social mobility trends (Elliot
Major and Machin, 2018). The exclusiveness of access, and its stability over more than two decades
of social and economic change, is arguably one reason for the lack of progress over social mobility.
The data on bursaries and scholarships have shown how little they can have contributed to any
change. Our finding of the stable and robust link between wealth and private schooling underpins
other recent research showing how family wealth affects success in adult life (Fagereng et al., 2018).
While these results are the first to show the importance of family wealth for access to high-quality
education in Britain, they may understate the role of family resources. With our data, we can only
examine one, albeit substantial, component of family wealth. Other elements, such as the wealth of
family relatives, especially grandparents, are likely to be very important. In the case, resources within
the extended family have gained in importance; the here estimated home value effect is expected to
proxy some of it.
The estimates imply that the future demand for private schooling will be linked to trends in wealth, as
well as the growth of top incomes. The trend will be exacerbated if, in particular, homeownership
continues its downward trend while home values continue to rise. In that light, we can conclude that
policies to improve social mobility should include the opening up of private school access to wider
sections of the population. Externally-imposed reforms such as removing the schools' charitable
21
status, taxing school fees, focusing 'contextual admissions' to universities on school-type, or
integrating private schools either partially or entirely with the state sector aim to reduce demand.6
Internally driven reform focuses mainly on an expansion of means-tested bursaries. Our analysis
supports that hitherto bursaries have been income progressive, though too small and scarce to affect
overall exclusivity substantially. Means-tested bursaries would need to expand considerably in reach
and scale, and the selection criteria should include a strong focus on family wealth, not just income.
Whether such internal-driven change is feasible remains uncertain.
ACARA (2019) National Report on Schooling in Australia 2017. Sydney. Available at: www.acara.edu.au.
Acemoglu, D. and Pischke, J.-S. (2001)' Changes in the wage structure, family income, and children's education', European Economic Review, 45(4–6), pp. 890–904.
Allison, P. D. (2002). Missing data. London: SAGE Publications, Inc.
Anders J., Green, F., Henderson, M., and Henseke, G. (2020) Determinants of Private School Participation: all about the money? British Educational Reserach Journal. Online.
Antman, F. and McKenzie, D. J. (2007) 'Earnings Mobility and Measurement Error: A Pseudo-Panel Approach', Economic Development and Cultural Change, 56(1), pp. 125–161.
Atkinson, A. B. (2018). Wealth and inheritance in Britain from 1896 to the present. The Journal of Economic Inequality, 16(2), 137-169.
Ball, S. J. (1997) 'On the cusp: Parents choosing between state and private schools in the UK: Action within an economy of symbolic goods', International Journal of Inclusive Education, 1(1), pp. 1–17.
Belfield, C., Britton, J., Buscha, F., Dearden, L., Dickson, M., Van Der Erve, L., Sibieta, L., Vignoles, A., Walker, I. and Zhu, Y. (2018). The relative labour market returns to different degrees. IfS Research report: June 2018.
Blundell, R., Dearden, L. and Sibieta, L. (2010) 'The demand for private schooling in England: The impact of price and quality', IFS working papers, 10(21).
Brewer, M., Etheridge, B. and O'Dea, C. (2017) 'Why are Households that Report the Lowest Incomes So Well-off?', Economic Journal, 127(605), pp. F24–F49.
Broughman, S.P., Kincel, B., and Peterson, J. (2019) Characteristics of Private Schools in the United States: Results From the 2017–18 Private School Universe Survey First Look (NCES 2019-071). US Department of Education. Washington, DC: National Center for Education Statistics.
Burkhauser, R.V., Hérault, N., Jenkins, S.P. and Wilkins, R. (2018) 'Survey Under‐Coverage of Top Incomes and Estimation of Inequality: What is the Role of the UK's SPI Adjustment?', Fiscal Studies, 39(2), pp.213-240.
Burrows, V. (2018) 'The Impact of House Prices on Consumption in the UK: a New Perspective', Economica, 85(337), pp. 92–123.
Carneiro, P. and Ginja, R. (2016) 'Partial insurance and investments in children'. The Economic Journal, 126(596), pp.F66-F95.
Cooper, D. (2013)' House price fluctuations: The role of housing wealth as borrowing collateral', Review of Economics and Statistics, 95(4), pp. 1183–1197.
Dearden, L., Ferri, J. and Meghir, C. (2002) 'The Effect of School Quality on Educational Attainment and Wages', Review of Economics and Statistics, 84(1), pp. 1–20.
Dearden, L., Ryan, C. and Sibieta, L. (2011) 'What Determines Private School Choice? A Comparison between the United Kingdom and Australia', Australian Economic Review, 44(3), pp. 308–320.
Deaton, A. (1985) 'Panel data from time series of cross-sections', Journal of Econometrics. North-Holland, 30(1–2), pp. 109–126.
DESTATIS (2016) Finanzen der Schulen. Schulen in freier Trägerschaft und Schulen des Gesundheitswesens 2013. Wiesbaden: Statistisches Bundesamt. Available at: www.destatis.de.
23
Dettling, L. J. and Kearney, M. S. (2014) 'House prices and birth rates: The impact of the real estate market on the decision to have a baby', Journal of Public Economics. North-Holland, 110, pp. 82–100.
DfE (2018) Schools, Pupils, and their Characteristics: January 2018. London. Available at: https://www.gov.uk/government/statistics/schools-pupils-and-their-characteristics-january-2018.
Disney, R. and Gathergood, J. (2018) 'House Prices, Wealth Effects and Labour Supply', Economica, 85(339), pp. 449–478.
DWP (2018a) Family Resources Survey: Background note and methodology. Available at: https://assets.publishing.service.gov.uk/government/uploads/system/uploads/attachment_data/file/692141/family-resources-survey-2016-17-background-note-and-methodology.pdf.
DWP (2018b) Households Below Average Income (HBAI) Quality and Methodology Information Report. Available at: https://assets.publishing.service.gov.uk/government/uploads/system/uploads/attachment_data/file/691919/households-below-average-income-quality-methodology-2016-2017.pdf.
Elder, T. and Jepsen, C. (2014) 'Are Catholic primary schools more effective than public primary schools?', Journal of Urban Economics, 80, pp. 28–38.
Elliot Major, L. and Machin, S. (2018) Social mobility and its enemies. London: Penguin Random House.
Fagereng, A. Mogstad, M. and Rønning, M. (2018) 'Why Do Wealthy Parents Have Wealthy Children?', CESifo Working Paper, No. 6955.
Feinstein, L., and Symons, J. (1999). Attainment in Secondary School. Oxford Economic Papers, 55(2), 300-321.
Fichera, E. and Gathergood, J. (2016) 'Do wealth shocks affect health? New evidence from the housing boom', Health Economics, 25(Suppl 2), pp. 57–69.
Foskett, N. and Hemsley-Brown, J. (2003) 'Economic aspirations, cultural replication and social dilemmas–interpreting parental choice of British private schools', in Walford, G. (ed.) British Private Schools: Research on Policy and Practice. London: Routledge, pp. 188–201.
Fox, I. (1985) Private Schools and Public Issues: The Parents' View. London: Macmillan Press.
Graham, J. W., Olchowski, A. E., and Gilreath, T. D. (2007). How many imputations are really needed? Some practical clarifications of multiple imputation theory. Prevention science, 8(3), 206-213.
Green, F. and Kynaston, D. (2019) Engines of Privilege: Britain's Private School Problem. London: Bloomsbury.
Green, F. Machin, S., Murphy, R. and Zhu, Y. (2012) 'The Changing Economic Advantage from Private Schools', Economica, 79(316), pp. 658–679.
Green, F., Henseke, G. and Vignoles, A. (2017) 'Private schooling and labour market outcomes', British Educational Research Journal, 43(1).
Halsey, A. H., Heath, A. F. and Ridge, J. M. (1980) Origins and destinations : family, class, and education in modern Britain. Clarendon Press.
Henderson, M., Anders J., Green, F. and Henseke G. (2020). "Private Schooling, Subject Choice, Upper Secondary Attainment and Progression to University." Oxford Review of Education 46(295-312).
HM Land Registry (2018a) 'About the UK House Price Index', pp. 1–19. Available at: https://www.gov.uk/government/publications/about-the-uk-house-price-index/about-the-uk-house-price-index.
24
HM Land Registry (2018b) UK House Price Index England: May 2018, UK House Price Index. Available at: https://www.gov.uk/government/publications/uk-house-price-index-england-may-2018/uk-house-price-index-england-may-2018.
ISC (2019) ISC Census and Annual Report 2019. Available at: https://www.isc.co.uk/media/5479/isc_census_2019_report.pdf.
Jerrim, J., Parker, P., Chmielewski, A. and Anders, J. (2016) 'Private schooling, educational transitions, and early labour market outcomes: Evidence from three Anglophone countries', European Sociological Review, 32(2), pp. 280–294.
Kenway, J. and Fahey, J. (2014) 'Staying ahead of the game: the globalising practices of elite schools', Globalisation, Societies and Education. Taylor & Francis, 12(2), pp. 177–195.
Lindley, J. and Machin, S. (2016) 'The Rising Postgraduate Wage Premium', Economica, 83(330), pp. 281–306.
Lindley, J. and McIntosh, S. (2015) 'Growth in within graduate wage inequality: The role of subjects, cognitive skill dispersion and occupational concentration', Labour Economics. Elsevier BV, 37, pp. 101–111.
Lovenheim, M. F. and Reynolds, C. L. (2013) 'The Effect of Housing Wealth on College Choice: Evidence from the Housing Boom', Journal of Human Resources, 48(1), pp. 1–35.
Lye, J., & Hirschberg, J. (2017). Secondary school fee inflation: an analysis of private high schools in Victoria, Australia. Education Economics, 25(5), 482-500.
Macmillan, L., Tyler, C. and Vignoles, A. (2015) 'Who gets the top jobs? the role of family background and networks in recent graduates' access to high-status professions', Journal of Social Policy, 44(3), pp. 487–515.
Malacova, E. (2007) 'Effect of single‐sex education on progress in GCSE', Oxford Review of Education. Routledge , 33(2), pp. 233–259.
Maxwell, C. and Aggleton, P. (eds) (2015) Elite Education: Inernational Perspectives. London: Routledge.
McKnight, A. and Karagiannaki, E. (2013) 'The wealth effect: how parental wealth and own asset-holdings predict future advantage.' in Wealth in the UK: Distribution, Accumulation, and Policy, Oxford: Oxford University Press, p.119.
Nghiem, H., Nguyen, H., Khanam, R. and Connelly, L. (2015) 'Does school type affect cognitive and non-cognitive development in children? Evidence from Australian primary schools', Labour Economics, 33, pp. 55–65.
O'Donnell, O., O'Neill, S., Van Ourti, T. and Walsh, B. (2016) 'conindex: Estimation of concentration indices', The Stata journal, 16(1), pp. 112-138.
OECD (2012) Public and Private Schools: How Management and Funding Relate to their Socio-economic Profile, Paris: OECD Publishing.
ONS (2018) Wealth in Great Britain Wave 5: 2014 to 2016. Available at: https://www.ons.gov.uk/peoplepopulationandcommunity/personalandhouseholdfinances/incomeandwealth/bulletins/wealthingreatbritainwave5/2014to2016/previous/v2.
Parsons, S., Green, F. , Ploubidis, G., Sullivan, A. and Wiggins, D. (2017) 'The influence of private primary schooling on children's learning: Evidence from three generations of children living in the UK', British Educational Research Journal, 43(5), pp. 823–847.
Pianta, R. C., and Ansari, A (2018) 'Does Attendance in Private Schools Predict Student Outcomes at Age 15? Evidence From a Longitudinal Study'. Educational Researcher 2018, 47(7):419-434.
25
Reeves, A., Friedman, S., Rahal, C. and Flemmen, M. (2017) 'The Decline and Persistence of the Old Boy: Private Schools and Elite Recruitment 1897 to 2016', American Sociological Review, 82(6), pp. 1139–1166.
Reinold, K. (2011). Housing equity withdrawal since the financial crisis. Bank of England Quarterly Bulletin, Q2.
Ryan C. and Sibieta L. (2011) A Comparison of Private Schooling in the United Kingdom and Australia. The Australian Economic Review, 44(3): 295-307.
Sacerdote, B. (2011) Peer Effects in Education: How might they work, how big are they and how much do we know Thus Far?, Handbook of the Economics of Education. Elsevier.
Scottish Government (2018) Summary statistics for schools in Scotland. Available at: https://www2.gov.scot/Topics/Statistics/Browse/School-Education/Summarystatsforschools.
Solon, G. (2004) 'A model of intergenerational mobility variation over time and place', in Corak, M. (ed.) Generational income mobility in North America and Europe. Cambridge, New York: Cambridge University Press, pp. 38–47.
Sullivan, A. and Heath, A. F. (2003) 'Intakes and Examination Results at State and Private schools', in Walford, G. (ed.) British Private Schools: Research on policy and practice. London: Woburn Press, pp. 77–104.
Sutton Trust and Social Mobility Commission (2019) Elitist Britain 2019: The educational backgrounds of Britain's leading people. London. Available at: https://www.gov.uk/government/publications/elitist-britain-2019.
Verbeek, M. (2008) 'Pseudo-Panels and Repeated Cross-Sections', in Mátyás, L. and Sevestre, P. (eds) The Econometrics of Panel Data. Springer, Berlin, Heidelberg, pp. 369–383.
Weenink, D. (2008) 'Cosmopolitanism as a form of capital: Parents preparing their children for a globalising world', Sociology, 42(6), pp. 1089–1106.
Welsh Government (2018) School Census Results, 2018. https://gov.wales/schools-census-results-january-2018
West, A., Noden, P., Edge, A., David M. and Davies J. (1998) 'Choices and Expectations at Primary and Secondary Stages in the State and Private Sectors', Educational Studies, 24(1), pp. 45–60
Whitty, G., Power, S. and Edwards, T. (1998) 'The assisted places scheme: Its impact and its role in privatisation and marketisation', Journal of Education Policy, 13(2), pp. 237–250.
Appendix 8 Imputing current home value for owner-occupiers
Using a the Gaussian normal regression imputation method, we generate 50 plausible values of the
current log home value in 2018/19 prices from a regression of the log purchase price of the
accommodation on socio-demographic controls, family income, characteristics of the property,
family income rank, region, and time trends.
Table A1: Imputation Model. (1) Variables Log Real Purchase Price of the Property
Age family head (35-50) -0.002 (0.006)
Age family head (50-64) -0.040*** (0.008)
Two-parent family -0.012* (0.006)
Number of children in family 0.021*** (0.003)
Highest age of leaving education (BU) 0.016*** (0.001)
Log equivalized real net family income 0.003 (0.007)
Semi-detached -0.052*** (0.005)
Terrace -0.087*** (0.007)
Flat -0.218*** (0.017)
Other 0.116 (0.073)
2 Bedrooms -0.044 (0.051)
3 Bedrooms -0.008 (0.051)
4 Bedrooms 0.026 (0.051)
5+ Bedrooms 0.099 (0.052)
Council tax band – B 0.332*** (0.008)
Council tax band – C 0.569*** (0.009)
Council tax band – D 0.794*** (0.010)
Council tax band – E 1.019*** (0.011)
Council tax band – F 1.248*** (0.013)
Council tax band – G 1.563*** (0.015)
Council tax band – H 1.953*** (0.038)
Council tax band – I 1.077*** (0.243)
Council tax band – Not valued 0.793
27
27
(0.471) Year bought accommodation (1997=0) 0.060***
(0.001) Year bought accommodation (1997=0, squared) -0.001***
(0.000) Family income rank (7th-9th decile) -0.099***
(0.008) Family income rank (4th-6th decile) -0.166***
(0.010) Family income rank (<4th decile) -0.186***
(0.014) Year bought accommodation # Family income rank (7th-9th decile)
-0.004*** (0.001)
Year bought accommodation # Family income rank (4th-6th decile)
-0.004*** (0.001)
Year bought accommodation # Family income rank (<4th decile)
-0.005*** (0.001)
Year bought accommodation (sq) # Family income rank (7th-9th decile)
0.000*** (0.000)
Year bought accommodation (sq) # Family income rank (4th-6th decile)
0.000*** (0.000)
Year bought accommodation (sq) # Family income rank (<4th decile)
0.000*** (0.000)
North-West 0.027** (0.008)
Midlands 0.070*** (0.008)
East of England 0.169*** (0.010)
Greater London 0.286*** (0.011)
South East 0.230*** (0.009)
South West 0.150*** (0.010)
Scotland & Wales -0.269*** (0.009)
Year bought accommodation # North-West 0.000 (0.001)
Year bought accommodation # Midlands 0.001 (0.001)
Year bought accommodation # East of England 0.001 (0.001)
Year bought accommodation # Greater London 0.007*** (0.001)
Year bought accommodation # South East 0.004*** (0.001)
Year bought accommodation # South West 0.004*** (0.001)
Year bought accommodation # Scotland & Wales -0.003*** (0.001)
Year bought accommodation (sq) # North-West -0.000 (0.000)
Year bought accommodation (sq) # Midlands -0.000 (0.000)
Year bought accommodation (sq) # East of England 0.000 (0.000)
Year bought accommodation (sq) # Greater London
0.000 (0.000)
Year bought accommodation (sq) # South East -0.000 (0.000)
Year bought accommodation (sq) # South West 0.000 (0.000)
28
28
Year bought accommodation (sq) # Scotland & Wales
0.000 (0.000)
Constant 10.631*** (0.069)
Observations 54938 R2 0.801
Robust standard errors in parentheses. * p < 0.05, ** p < 0.01, *** p < 0.001
Table A2: Correlation of the imputed log home value with the log mean property prices from the UK House Price Index across property type and region (1997-2018).
(1) (2) (3)
HPI 0.874*** (0.025)
0.923*** (0.038)
0.712*** (0.032)
Period NO YES NO Property Type-Region FE
NO NO YES
N 880 880 880 Linear regression of the z-standardized imputed log home value on the z-standardized log mean property prices taken from UK House Price Index in a panel of property type (detached, semi-detached, terrace, flat)-region cells by year. Robust standard errors in parentheses clustered at type-region cells. * p < 0.05, ** p < 0.01, *** p < 0.001
9 Size distribution of Cohorts
Table A3: Average number of families within cohorts over FRS waves.
Region 10th income decile
7th-9th income decile
4th-6th income decile
<4th income decile
Average Average Average Average
North-East & Yorkshire
37 152 183 205
North West 42 153 167 188
Midlands 55 211 224 234
East of England 53 133 121 96
London 66 130 131 157
South East 101 210 160 121
South West 28 111 112 89
Scotland & Wales 71 254 252 259
10 Bursaries
This section presents multivariate evidence on bursary receipt and the awarded amount.
Table A4: Relationship of bursary receipt with family resources and socio-demographic characteristics, 2004-2018.
(1) (2) Bursary receipt (AME) Log awarded amount
Child gender (female) -0.02 (0.017)
-0.15 (0.135)
Income decile (7th – 9th) 0.05* 0.25
29
29
(0.021) (0.156) Income decile (≤6th) 0.05*
(0.024) 0.02
(0.189) Material wellbeing (z-score)
0.04** (0.013)
0.31** (0.103)
Not in work 0.12# (0.064)
0.70* (0.280)
Ethnic group of HRP (Black)
-0.02 (0.049)
-0.94 (0.833)
Ethnic group of HRP (Asian)
0.04 (0.041)
0.04 (0.267)
Ethnic group of HRP (Other)
-0.01 (0.043)
-0.37 (0.264)
Scotland -0.03 (0.027)
0.17 (0.283)
Wales 0.09 (0.111)
-1.09 (0.861)
2011-2017 0.01 (0.017)
-0.10 (0.135)
F(income decile, material deprivation, not in work) – p-value
0.02 0.00
N 1,986 300 Analysis of bursary receipt in private schools using FRS and HBAI 1997/98-2018/2019. Average marginal effects from a probit regression of bursary receipt among pupils in private schools (1) and coefficient from a regression of log awarded amount on family resources and socio-demographic characteristics. Covariates include child gender (male omitted), income rank based on equivalized net weekly family income (10th decile = ref., 7th-9th decile, 6th decile or below), material wellbeing score, a not in work dummy for the family head (unemployed, retired, permanently disabled, temporarily sick), ethnic group of the household (white omitted), nation of residence (England omitted), and period (2004-2010 omitted). Weighted estimations using the provided survey weights. Robust standard errors in parentheses. # p < .1, * p < 0.05, ** p < 0.01, *** p < 0.001
11 Income and Housing Wealth effects on private school access
across socio-economic classes
To assess the robustness of the estimated effects, this section summarizes income and home value
coefficients from a pseudo panel structured into socio-economic class and region rather than income
rank. FRS has included information on individual’s socio-economic class since 1997. Socio-economic
class is defined by the National Statistics Socio-economic Classification (NS-SEC), which is an
occupation-based class schema. Families’ socio-economic class is measured as the highest NS-SEC
status of the parents. We distinguish between seven groups:
• 1 Higher managerial, administrative and professional occupations,
• 2 Lower managerial, administrative and professional occupations,
• 3 Intermediate occupations,
• 4 Small employers and own account workers,
• 5 Lower supervisory and technical occupations,
• 6 semi-routine and routine occupations,
• 7 not-in-work.
30
30
Survey waves before 2001 used the SEG Socio-economic Group classification which is another
occupation-based classification of socio-economic status. We map SEG groups into the NS-SEC class
schema following crosswalks by ONS (2005).7 The resulting panel consists of 1,232 cells from 56
cohorts (7 NS-SEC classes over 8 regions) in 22 waves of FRS with an average cohort size of 80
observations for income and 52 for home value effect estimates.
Table A5: Income effects on the probability of attending private school for children aged 5-15 years, 1997-2018, pseudo-panel based on families’ highest NS-SEC class and region of residence.
(1) (2) (3) (4) (5)
Mean Log family income 0.073*** (0.019)
0.054*** (0.013)
0.054*** (0.013)
0.051*** (0.013)
Mean Log family income # Time trend 0.000 (0.000)
Mean Log family income # (Higher managerial and professional)
0.123*** (0.022)
(Lower managerial and professional)
0.050** (0.017)
(Intermediate)
0.014 (0.011)
(Small employers and own account)
0.051* (0.020)
(Lower supervisory and technical)
0.021* (0.008)
(Semi-routine and routine)
0.020* (0.009)
(Not in work)
0.033*** (0.009)
FE NO YES YES YES YES Time trend YES YES YES YES YES Region # trend NO NO YES YES YES Control variables YES YES YES YES YES
N 1,232 1,232 1,232 1,232 1,232 F(constant income effect) – p-value 0.000
Pseudo-Panel estimates for owner-occupier families with children aged 5-15 years. Cells weighted by the square root of the number of families in each cell. Heteroscedasticity and autocorrelation robust standard errors in parentheses.* p < 0.05, ** p < 0.01, *** p < 0.001
Table A6: Home value effects on the probability of attending private school for children aged 5-15 years, 1997-2017, pseudo-panel based on families’ highest NS-SEC class and region of residence.
(1) (2) (3) (4) (5) (6) (7)
Mean Log home value 0.055*** (0.010)
0.058*** (0.013)
0.061*** (0.014)
0.061*** (0.014)
0.054*** (0.015)
Mean Log family income 0.033* (0.013)
0.022 (0.014)
7 Office for National Statistics, 2005. The national statistics socio-economic classification. User manual / Office for National Statistics. 2005th ed., Basingstoke: Palgrave Macmillan.
31
31
Mean Log home value # Time trend
0.000 (0.000)
Mean Log home value # (Higher managerial and
professional)
0.067*** (0.015)
(Lower managerial and professional)
0.059*** (0.015)
(Intermediate)
0.052** (0.015)
(Small employers and own account)
0.075*** (0.016)
(Lower supervisory and technical)
0.047*** (0.013)
(Semi-routine and routine)
0.048** (0.014)
(Not in work)
0.069*** (0.015)
FE NO YES YES YES YES YES YES Time trend YES YES YES YES YES YES YES Region # trend NO NO YES YES YES YES YES Control variables YES YES YES YES YES YES YES
N 1,231 1,231 1,231 1,231 1,231 1,231 1,231 Panel estimates for owner-occupier families with children aged 5-15 years. Cells weighted by the square root of the number of families in each cell. Heteroscedasticity and autocorrelation robust standard errors in parentheses. Standard errors in parentheses.* p < 0.05, ** p < 0.01, *** p < 0.001