Global Thematic Research Income Inequality: Market Mechanism or Market Failure? Tools to assess corporate performance and enhance investment decisions Executive summary Income inequality is a normal feature of a free market economy. However, in recent years, it has been on the rise in most developed countries and has reached relatively high levels, especially in the US. Extreme income inequality affects economic growth prospects and societal stability. It also impacts business models, corporate profitability and value creation. Our report provides insight into the investment implications of this socio-economic phenomenon. It offers a comprehensive review of the facts, data and economic analysis related to income inequality, and establishes the relationship between the macroeconomic perspective and individual investment decisions. We have identified two simple tools that can help investors estimate the consequences of their investments regarding income inequality. The first is a check-list of indicators and questions to help assess companies’ human capital strategies in the perspective of high inequality. The second, related to the external socio- economic impacts of business activities, opens the debate regarding companies’ awareness of their influence on the local economy. Flagship Report November 13, 2014 Margarita Pirovska Policy and Sustainability Analyst +1 212 874 7400 Reprinted with permission from Cornerstone Capital Group. Contents are only current as of publication date.
Transcript
Global Thematic Research
Income Inequality: Market Mechanism or Market Failure?
Tools to assess corporate performance and enhance investment decisions
Executive summary
Income inequality is a normal feature of a free market economy. However, in recent
years, it has been on the rise in most developed countries and has reached relatively
high levels, especially in the US. Extreme income inequality affects economic growth
prospects and societal stability. It also impacts business models, corporate
profitability and value creation.
Our report provides insight into the investment implications of this socio-economic
phenomenon. It offers a comprehensive review of the facts, data and economic analysis
related to income inequality, and
establishes the relationship
between the macroeconomic
perspective and individual
investment decisions.
We have identified two simple
tools that can help investors
estimate the consequences of
their investments regarding
income inequality. The first is a
check-list of indicators and
questions to help assess
companies’ human capital
strategies in the perspective of
high inequality. The second,
related to the external socio-
economic impacts of business
activities, opens the debate regarding companies’ awareness of their influence on the
2 This material is a conceptual framework and should not be construed as
investment advice.
CORNERSTONE FOCUS REPORT
Income Inequality: Market Mechanism or Market Failure?
Tools to assess corporate performance and investment decisions
Contents
I. Defining income inequality ............................................................................................................................. 3
1. The broad concept: economic inequality .......................................................................................................................... 3
2. The origins of inequality .................................................................................................................................................... 3
3. The income distribution gap in numbers ......................................................................................................................... 4
4. Why it matters today .......................................................................................................................................................... 9
II. Economic analysis ........................................................................................................................................ 10
1. Inequality, capitalism and economic growth ................................................................................................................ 10
2. Market signals: income vs. productivity ....................................................................................................................... 10
3. The principal-agent problem: CEO pay ......................................................................................................................... 12
4. The issue of rent-seeking ............................................................................................................................................... 13
5. Inequality and long-term sustainability ........................................................................................................................ 14
6. Can inequality affect companies’ performance and investment outcomes? .............................................................. 14
III. Investment implications ............................................................................................................................... 15
1. A pledge towards more transparency ........................................................................................................................... 15
2. Empowering and educating ........................................................................................................................................... 16
3. Better social performance is linked with better financial performance ..................................................................... 17
4. Understanding the negative effects of high inequality from an investor’s perspective ............................................ 20
5. A practical tool to assess companies’ performance ..................................................................................................... 20
6. Measuring impact and the role of inclusive business .................................................................................................. 22
Starbucks (ticker: SBUX), BMW (BMW.GR), Intel (INTC), SAP (SAP.GR), Costco (COST), Chipotle (CMG), Unilever (UN)
3 This material is a conceptual framework and should not be construed as
investment advice.
CORNERSTONE FOCUS REPORT
I. Defining income inequality
Income distribution trends have become a mainstream discussion topic since the global financial crisis of
2008-2009. For the third year in a row, in 2014, 700 world leaders at The World Economic Forum in Davos,
Switzerland identified the increasing income gap as one of the biggest risks facing the world economy. This
same year, the International Monetary Fund, Standard & Poor’s and the Organization for Economic Co-
operation and Development (OECD) also issued warnings about this increasing disparity. But what exactly is
income inequality – and how does it affect investors and markets?
1. The broad concept: economic inequality
Economic inequality is the uneven distribution of financial and material assets and income among
individuals or households within a country, or between countries. Wealth inequality illustrates the variation
between the net worth of different groups of individuals or households, while income inequality refers to the
disparity in real disposable incomes. This report focuses primarily on the latter. We will attempt to describe
and analyze the socio-economic phenomenon of high and rising inequality of real disposable incomes within
the US population, and its impacts on financial markets and investment decisions.
Although related to the issue of poverty, and often referred to as the “difference of income between the rich
and the poor”, income inequality is a different topic, illustrating the dispersion of all incomes within a given
population. This does not imply that the lowest earners are actually living in poverty (which may be
understood in absolute or relative terms). However, in some situations, extreme inequality can lead to an
increase in poverty, and threaten future economic growth1.
Income inequality is closely related to wealth inequality. As incomes constitute one of the main sources of
wealth accumulation, persistent income inequality may fuel wealth inequality over time, and can be
exacerbated by inequality of opportunity and other social inequalities. Income inequality is therefore an
important short-term driver of wealth inequality.
Economic inequality has always been embedded in free market economies, and is not a problem per se. But
the return of pre-war levels of income inequality in the US, especially after the economic and financial
crisis, saw renewed interest in the subject. The biggest issue is that while the spread in income distribution is
increasing, economic growth is slow, and unemployment and underemployment of young graduates are
rising. In addition, over the long term, real growth of incomes at the lower end of the spectrum has been
stagnant.
2. The origins of inequality
The origins of the word “equal” stem from the Latin aequalis – meaning “uniform, identical, equal" but also
from aequus or "level, even, just". Equality can refer to what is the same, but also to what is fair and just.
Therefore, is inequality also unfair? Unjust? Or only “different”, and “not equal”?
1 These issues will be further developed in the second part of this report.
4 This material is a conceptual framework and should not be construed as
investment advice.
CORNERSTONE FOCUS REPORT
All developed, post-industrial societies share a commitment to principles of political equality2. However,
economic inequality, as a natural result of market forces, has withstood most attempts at reform. Some
political philosophers have argued that the mere existence of equality of opportunity justifies economic
inequalities 3 . Inequality of income could therefore be a natural characteristic of the capitalist system.
However, as inequalities in developed countries have widened over the past three decades, it becomes useful
to ask whether these trends are socially or economically sustainable.
3. The income distribution gap in numbers
Over the past three decades, income inequality in the developed world increased along with sustained
economic and employment growth4. This contradicts widely accepted post-war economic analysis of income
inequality and economic growth, such as the one proposed in 1955 by Nobel laureate and Harvard professor
of economics, Simon Kuznets5. As an economy develops and undergoes industrialization, Kuznets argued,
income inequality grows at first and then starts to recede, as human capital develops and wages increase.
According to this analysis, in developed post-industrial markets, inequality should be low. This theory
was true in practice until the 1970s, when inequality began to rise again.
Income distribution within a given population can be assessed using data on real disposable household
income. Additional variables, such as consumption, or other monetary attributes can also be used as proxies.
However, data on real disposable income provides the most accurate and widely used source of information
to assess income inequality6.
The variance in income distribution can be expressed with different ratios and coefficients. Among the most
common measures are:
The Gini coefficient, measuring the extent to which the distribution of income or consumption
expenditure among individuals or households within an economy deviates from a perfectly equal
distribution. A Gini index of 0 represents perfect equality, while an index of 1, with completely unequal
distribution, implies full inequality.
The share of total income earned by the top 1% or the top 0.1% richest people in the population.
2 The Declaration of the Rights of Man and of the Citizen of 1789, the Declaration of Independence and the Declaration of Rights of 1776 were inspired by the philosophers of the Enlightenment, such as Rousseau (Discourse on the Origin and Basis of Inequality Among Men, Jean-Jacques Rousseau, 1754), who defined inequality as a social convention, an artificial construction stemmed from the social contract which guarantees peace in exchange of limited individual freedoms. Based on the theories of a pre-existing natural, original equality among human beings, they state that beyond the social contract and the organization of human societies, human beings are, in essence, equal. This political and legal equality, implying equal dignity and respect for all human beings, has been adopted as a founding principle of Western societies. 3 Understanding and explaining why societies, composed of legally and morally equal individuals, are characterized by persisting material inequalities has been a continuous endeavor of moral philosophers (see John Rawls, A theory of Justice, 1971). Overall, the past two centuries have seen a progress towards equality not only in political and legal terms, but also socially and economically. Both the maturing welfare states of Western societies, and the exponential globalization of nations, have contributed to expose, understand and address, fully or partially, many social inequalities, such as racial, gender or social group based discriminations. 4 Divided We Stand: Why Inequality Keeps Rising, OECD (2011), http://www.oecd.org/social/soc/dividedwestandwhyinequalitykeepsrising.htm 5 Simon Kuznets, "Economic Growth and Income Inequality". American Economic Review 45 (March): 1–28. (1955) http://www.aeaweb.org/aer/top20/45.1.1-28.pdf 6 See also the OECD Guidelines for Micro Statistics on Household Wealth (2013) http://www.oecd.org/statistics/OECD-Guidelines-for-Micro-Statistics-on-Household-Wealth-Chapter7.pdf
6 This material is a conceptual framework and should not be construed as
investment advice.
CORNERSTONE FOCUS REPORT
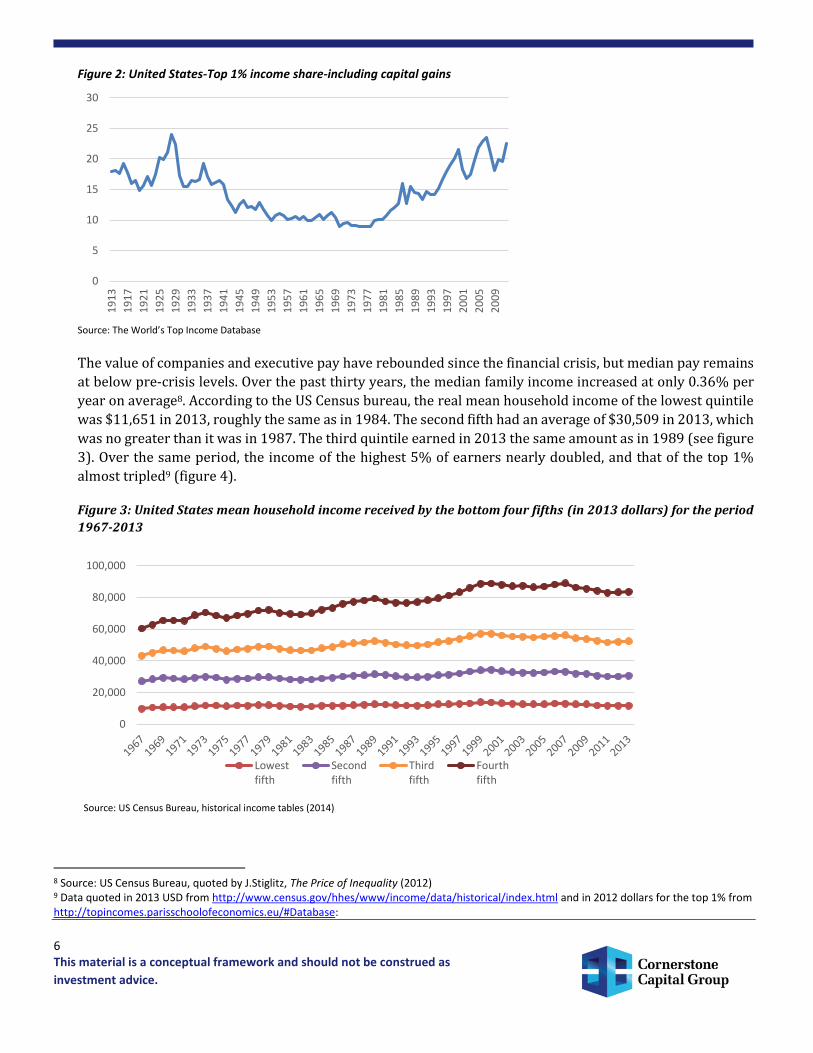
Figure 2: United States-Top 1% income share-including capital gains
Source: The World’s Top Income Database
The value of companies and executive pay have rebounded since the financial crisis, but median pay remains
at below pre-crisis levels. Over the past thirty years, the median family income increased at only 0.36% per
year on average8. According to the US Census bureau, the real mean household income of the lowest quintile
was $11,651 in 2013, roughly the same as in 1984. The second fifth had an average of $30,509 in 2013, which
was no greater than it was in 1987. The third quintile earned in 2013 the same amount as in 1989 (see figure
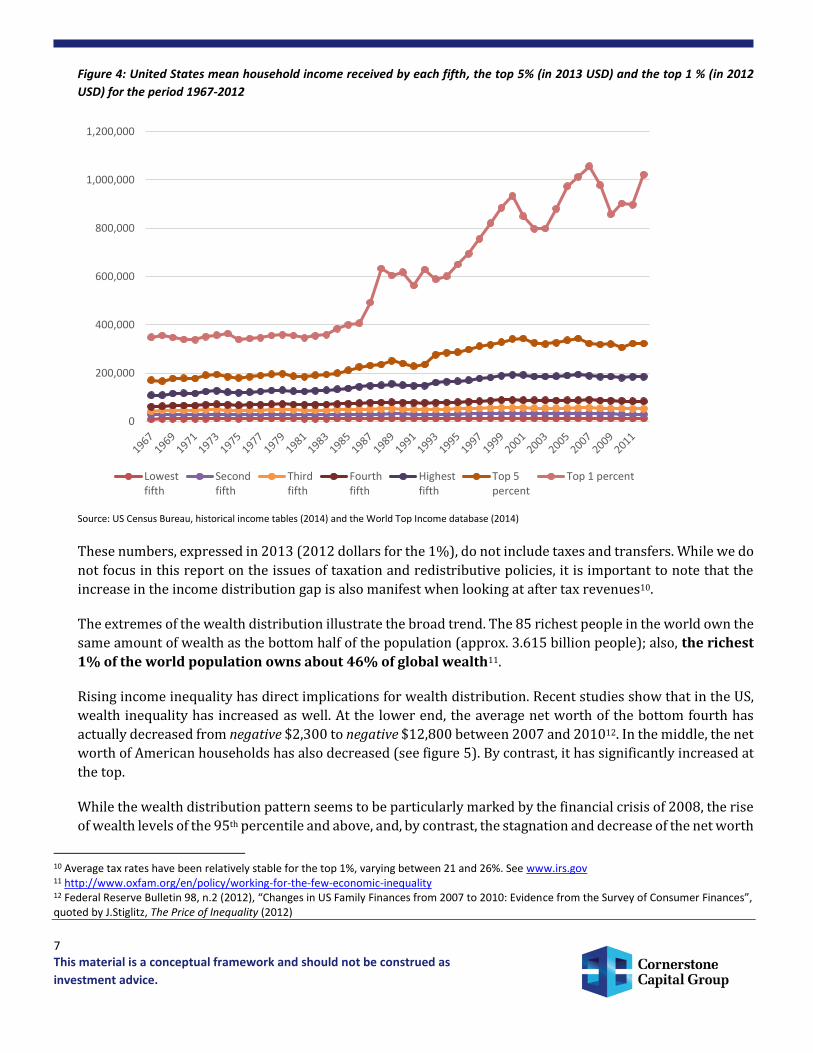
3). Over the same period, the income of the highest 5% of earners nearly doubled, and that of the top 1%
almost tripled9 (figure 4).
Figure 3: United States mean household income received by the bottom four fifths (in 2013 dollars) for the period
1967-2013
Source: US Census Bureau, historical income tables (2014)
8 Source: US Census Bureau, quoted by J.Stiglitz, The Price of Inequality (2012) 9 Data quoted in 2013 USD from http://www.census.gov/hhes/www/income/data/historical/index.html and in 2012 dollars for the top 1% from http://topincomes.parisschoolofeconomics.eu/#Database:
7 This material is a conceptual framework and should not be construed as
investment advice.
CORNERSTONE FOCUS REPORT
Figure 4: United States mean household income received by each fifth, the top 5% (in 2013 USD) and the top 1 % (in 2012
USD) for the period 1967-2012
Source: US Census Bureau, historical income tables (2014) and the World Top Income database (2014)
These numbers, expressed in 2013 (2012 dollars for the 1%), do not include taxes and transfers. While we do
not focus in this report on the issues of taxation and redistributive policies, it is important to note that the
increase in the income distribution gap is also manifest when looking at after tax revenues10.
The extremes of the wealth distribution illustrate the broad trend. The 85 richest people in the world own the
same amount of wealth as the bottom half of the population (approx. 3.615 billion people); also, the richest
1% of the world population owns about 46% of global wealth11.
Rising income inequality has direct implications for wealth distribution. Recent studies show that in the US,
wealth inequality has increased as well. At the lower end, the average net worth of the bottom fourth has
actually decreased from negative $2,300 to negative $12,800 between 2007 and 201012. In the middle, the net
worth of American households has also decreased (see figure 5). By contrast, it has significantly increased at
the top.
While the wealth distribution pattern seems to be particularly marked by the financial crisis of 2008, the rise
of wealth levels of the 95th percentile and above, and, by contrast, the stagnation and decrease of the net worth
10 Average tax rates have been relatively stable for the top 1%, varying between 21 and 26%. See www.irs.gov 11 http://www.oxfam.org/en/policy/working-for-the-few-economic-inequality 12 Federal Reserve Bulletin 98, n.2 (2012), “Changes in US Family Finances from 2007 to 2010: Evidence from the Survey of Consumer Finances”, quoted by J.Stiglitz, The Price of Inequality (2012)
8 This material is a conceptual framework and should not be construed as
investment advice.
CORNERSTONE FOCUS REPORT
of the 25th percentile and below began 30 years ago. In other words, wealth inequality was already increasing
before the crisis, and the present day levels of the wealth distribution gap are the result of a long-term trend
in the US economy13.
Figure 5 – Change in wealth since 1984 for various percentiles and current net worth of American households by different
percentiles (in % and in 2013 US Dollars)
Source: Adapted from Wealth levels, wealth inequality and the great recession, Russell Sage Foundation, June 2014
The decrease in the net worth of the lowest 5th percentile cannot be represented in figure 5, as it plummets
by 181%, from negative $9,749 in 2003 to negative $27,416 in 2013.
This trend is closely associated with falling household incomes at the lowest socioeconomic levels. At the
bottom, in 1966, nearly 20% of US population lived with an income of up to 125% of their poverty threshold
(meaning in or near poverty); in 2012, this number was roughly the same14. Therefore, nearly a fifth of the
US population still has an income at or near the poverty level.
13 It would be interesting to further analyze how these trends are related to the dynamics of household debt, and what role debt played in maintaining consumption levels despite the stagnating incomes and decreasing wealth levels. 14 https://www.census.gov/prod/2014pubs/p60-248.pdf – these numbers do not take into account various social programmes intended to help such individuals. They simply illustrate the fact that their economic income alone would position them in such a situation.
9 This material is a conceptual framework and should not be construed as
investment advice.
CORNERSTONE FOCUS REPORT
4. Why it matters today
Although technical debates continue, most evidence indicates that the spread in income distribution is
increasing in most developed economies, even if inequality worldwide (the difference between rich and poor
countries) has fallen 15 . In some developed countries, especially in the USA, economic growth has not
benefitted the lower half of the income distribution curve, evident in stagnant mean incomes.
Some have argued that Gini coefficients and other “snapshot” ratios present a static image of inequality of
income, without considering social mobility16, purchasing power, or life cycle issues (difference of income
between the young and the old). Do these variables mitigate concerns about income inequality? In the US, the
level of social mobility has remained stable but is relatively low compared to most other developed
countries17. Because social mobility is low, there is a risk that inequality of income fuels inequality of
opportunity, and becomes further entrenched in future generations. Social mobility still characterizes
market economies, but in many developed countries, and especially in the US, it does not seem to play the
necessary balancing role to mitigate income and wealth disparities over time.
Another debate is whether economic inequality should be measured in terms of purchasing power
capabilities. While in the past, availability of credit sustained purchasing power of low-income populations,
the recent financial crisis neutralized this mitigating tool. Stagnating incomes and the negative wealth levels
of the lowest earners also show that credit has not played a positive role in increasing their net economic
worth.
Economic inequality can also be exacerbated by a growing inequality towards financial risk exposure. The
transition of pension systems from “defined benefit” to “defined contribution” can for example amplify the
volatility and the uncertainty of future retirement incomes18. This can potentially have devastating effects
over middle and lower incomes, as they are often associated with limited knowledge of the market and its
inherent risks.
We are therefore witnessing the rise of multiple inequalities within the economic sphere – income,
opportunity, and risk-related. All the prerequisites for economic inequality to keep rising are here, and the
market or policy-based mechanisms aiming to moderate such an outcome do not seem to address efficiently
this trend. For the purpose of this report, we are focusing on income inequality and its related market
mechanisms, as the component most relevant to companies and financial markets. We aim to demonstrate
that the issue of income inequality is no longer only an academic or a political economy subject, as it can have
profound consequences on markets with implications for both investment decisions and outcomes.
15 The spread between rich and poor countries has been reduced; but inequalities within developed countries have increased. See The Economist, “True Progressivism”, http://www.economist.com/printedition/2012-10-13 16 Social mobility refers to the possibility for individuals to move up or down in terms of income or education the social ladder (for example, from the bottom quintile to the top one) compared to their parents. See http://www.oecd.org/tax/public-finance/chapter%205%20gfg%202010.pdf 17 See http://www.nber.org/papers/w19844 and http://www.oecd.org/unitedstates/Tackling-high-inequalities.pdf 18 See for example http://www.ncpers.org/files/2011_ncpers_research_series_top_ten(1).pdf or http://www.calpers.ca.gov/eip-docs/closing-impact.pdf
10 This material is a conceptual framework and should not be construed as
investment advice.
CORNERSTONE FOCUS REPORT
II. Economic analysis
1. Inequality, capitalism and economic growth
The French economist Thomas Piketty discusses the complex relationship between inequality and the
structure of economic growth. In his recently published book “Capital in the 21st century”, Piketty argues that
capitalism leads naturally to growing inequality19. While debate on his findings and proposals is ongoing, the
exceptional attention it has attracted is a sign that inequality and its links to the current economic system аre
important topics for the general public, liberal and conservative economists, and policy makers alike.
After the Second World War, the economist Nicolas Kaldor argued that inequality of income can lead to high
economic growth, assuming that higher savings led to higher investment which spurred growth. But most
economic literature and underlying studies demonstrate that there is very little evidence that inequality is
actually good for economic growth20. Studies also show that there is no necessary trade-off between reducing
inequality and promoting economic growth21.
The tentative consensus among economists, articulated for example in reports published by the IMF and
Standard & Poor’s in 201422, is that high inequality and its effects on the economy actually tend to reduce
the pace and durability of growth. Extreme inequality can also have negative long-term consequences on
political stability and investment23 . Therefore, while a “normal” feature of market economies, high and
persistent income inequality can become a market failure, reduce market performance and affect the
welfare of society as a whole. There is not necessarily a trade-off between a more equal and a more efficient
economy; moderating inequality can actually lead to stronger economic growth. How can the levels of
economic inequality observed currently in the US market be explained or justified?
2. Market signals: income vs. productivity
One possible explanation for unequal incomes is unequal productivity. If lower incomes are related to a
reduced or stagnant productivity, then rising income inequality would simply reflect accurate market
signaling.
In the US, productivity and incomes grew at a similar pace following the Second World War, but decoupled
from the 1980s onwards. Ever since, the gap between a typical worker’s compensation and productivity has
widened. While there is debate on the accuracy of the measurement of these variables, the trends observed
in economic growth and income distribution sustain the decoupling hypothesis, as illustrated in figure 6.
19 T.Piketty, Capital in the 21st century (2014). The underlying idea appeared already with Adam Smith, and possibly before. 20 http://siteresources.worldbank.org/INTPOVERTY/Resources/WDR/Background/rodriguez.pdf 21 http://www.econ.nyu.edu/user/benhabib/IneqGrow.pdf 22 Redistribution, Inequality and Growth, IMF staff discussion note (2014); and How Increasing Income Inequality Is Dampening U.S. Economic Growth, And Possible Ways To Change The Tide, Standard & Poor’s (2014) 23 See for example http://econweb.arts.cornell.edu/et17/Erik%20Thorbecke%20files/Socioeconomic%20impact.pdf
11 This material is a conceptual framework and should not be construed as
investment advice.
CORNERSTONE FOCUS REPORT
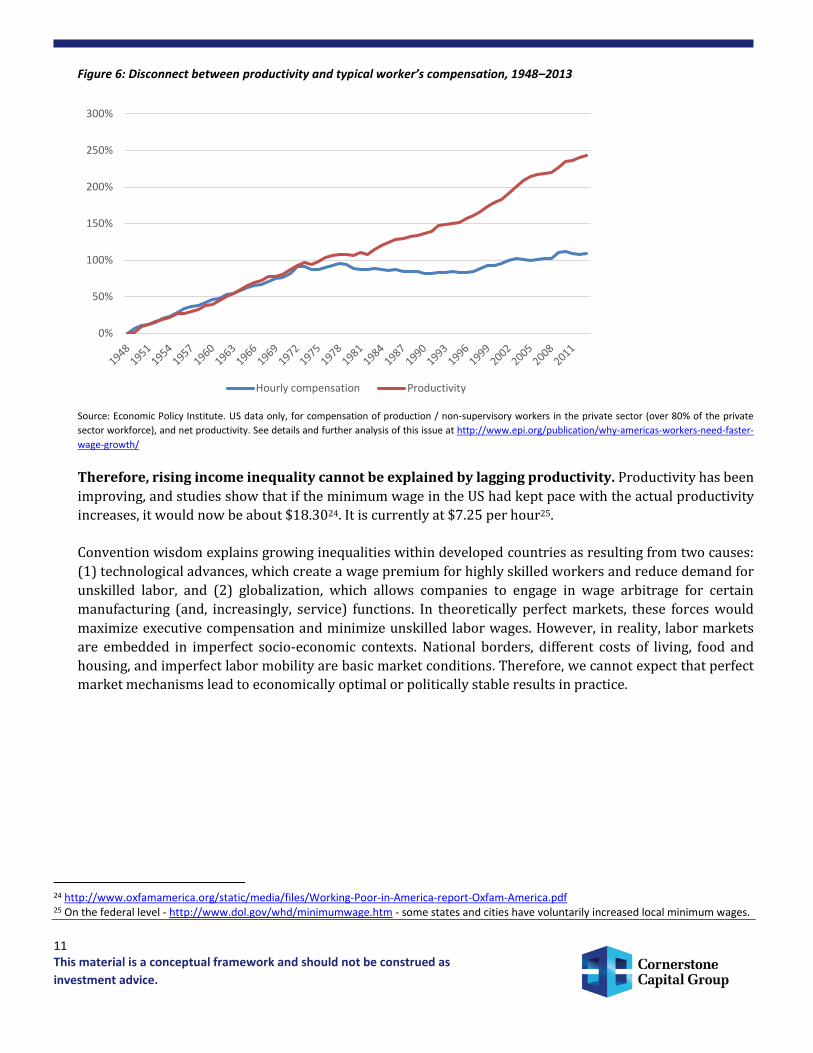
Figure 6: Disconnect between productivity and typical worker’s compensation, 1948–2013
Source: Economic Policy Institute. US data only, for compensation of production / non-supervisory workers in the private sector (over 80% of the private
sector workforce), and net productivity. See details and further analysis of this issue at http://www.epi.org/publication/why-americas-workers-need-faster-
wage-growth/
Therefore, rising income inequality cannot be explained by lagging productivity. Productivity has been
improving, and studies show that if the minimum wage in the US had kept pace with the actual productivity
increases, it would now be about $18.3024. It is currently at $7.25 per hour25.
Convention wisdom explains growing inequalities within developed countries as resulting from two causes:
(1) technological advances, which create a wage premium for highly skilled workers and reduce demand for
unskilled labor, and (2) globalization, which allows companies to engage in wage arbitrage for certain
manufacturing (and, increasingly, service) functions. In theoretically perfect markets, these forces would
maximize executive compensation and minimize unskilled labor wages. However, in reality, labor markets
are embedded in imperfect socio-economic contexts. National borders, different costs of living, food and
housing, and imperfect labor mobility are basic market conditions. Therefore, we cannot expect that perfect
market mechanisms lead to economically optimal or politically stable results in practice.
24 http://www.oxfamamerica.org/static/media/files/Working-Poor-in-America-report-Oxfam-America.pdf 25 On the federal level - http://www.dol.gov/whd/minimumwage.htm - some states and cities have voluntarily increased local minimum wages.
14 This material is a conceptual framework and should not be construed as
investment advice.
CORNERSTONE FOCUS REPORT
5. Inequality and long-term sustainability
Over the long term, persistently high inequality may be an existential threat to societies. In a recent study of human population long-term dynamics, Motesharrei, Rivas and Kalnay have analyzed human society evolution with a “predator-prey” model of humans and nature, where humans have a tendency to deplete available natural resources33. An additional variable to the model – the accumulation of a wealth surplus – delays the natural process of population decline when resource use reaches its environment carrying capacity. The results of this study show that the uneven distribution of this surplus, and strong economic stratification, can lead to societal collapse as much as the over-exploitation of natural resources. Therefore, unequal societies are less stable, and are more at risk of collapse. The authors also apply their analysis to concrete examples of civilizational collapses in human history where high inequality and over-exploitation of natural resources have played a major role. This study and its findings confirm the prevalent intuition that it is a risk for our markets, and explains why income inequality has been identified for three years in a row as the biggest global risk in terms of likelihood for the world’s economies by the World Economic Forum34.
High economic inequality leads not only to reduced economic opportunities, but also to lower life-expectancy, more crime and worse health standards, according to a study on the outcomes on different social and economic issues in unequal rich countries35. Social and political stability are investment risk factors for companies operating in highly unequal societies.
6. Can inequality affect companies’ performance and investment outcomes?
Inequality is not only a political economy or fiscal policy issue. It is also embedded in companies’ social strategies. The choices made in managing human capital, internally, and in creating positive social impact, externally, can lead to reducing inequalities. Increasing employees’ living standards (wages), social mobility (professional training) or simply their quality of life (benefits) can reinforce the company’s engagement towards corporate excellence.
In the last part of our report, we will discuss how investors can assess companies’ efforts to address income inequality, and individual strategies that have succeeded in reducing inequalities and also produced outstanding financial results.
33 http://www.sciencedirect.com/science/article/pii/S0921800914000615 34 http://www.weforum.org/reports/global-risks-2014-report 35 R.Wilkinson, K.Pickett, The Spirit Level: Why More Equal Societies Almost Always Do Better (2009)
15 This material is a conceptual framework and should not be construed as
investment advice.
CORNERSTONE FOCUS REPORT
III. Investment implications
It is not our role to take part in the ongoing public policy debate on rising inequalities. But improving
transparency, investing in human capital, and increasing social standards can make sense for market players.
Mitigating high inequality at the corporate level is not just possible. Empowering people, and taking into
account social impacts in investment decision making, can be win-win strategies for long term firm
performance, employees and communities.
1. A pledge towards more transparency
Lack of transparency allows for anti-competitive practices, including rent-seeking, to distort market
functioning, reduce efficiency and increase inequality. Higher accountability standards can help avoid such
behavior, and the recent Dodd-Frank regulations aim to contribute to this objective. Better disclosure of
performance metrics is an indicator of better management quality, and therefore increased profitability
potential36.
Improved transparency and accountability are cornerstones of good corporate governance. Properly
implemented, measures such as the pay ratio, and the say-on-pay rule can improve corporate governance
standards and the relationship between shareholders and companies. The implementation costs of such
additional disclosure are not yet clear, and there is still significant uncertainty over the feasibility and actual
implementation of CEO pay ratio disclosures. But data providers are beginning to compile data, and some
companies have been proactive in explaining the existing spreads37. Companies who take ownership of
such measures and adopt voluntary disclosure are likely to improve the relationship with their
stakeholders, achieve potentially higher governance scores and better manage their reputational risk.
For investors, this provides a new tool to assess corporate performance and initiate constructive dialogue
with companies, and can contribute to making more informed decisions.
Such data, if widely published and appropriately analyzed and explained, will also allow for intra-sector
comparisons, and raise awareness about companies that are more “unequal” than their peers. The CEO pay
ratio could then become the equivalent of a “Gini coefficient” for companies. While it is understood that perfect
equality cannot exist, it will allow for relative comparisons in the same way Gini coefficients do for countries.
Therefore, transparency over the income distribution spreads within companies in a given sector
could raise awareness and even influence investment decisions. Indeed, some investors can choose not
to invest in a company where extreme income discrepancies are not justified by the sector specifics or the
company’s performance, or that pays much lower wages to its employees than its peers.
36 See on this general topic for example Ioannis and Serafeim, The growing power of non-financial reports, http://bsr.london.edu/lbs-article/611/index.html, and Kim, Li and Li, CSR and stock price crash risk, http://papers.ssrn.com/sol3/papers.cfm?abstract_id=2397629 37 See http://go.bloomberg.com/multimedia/ceo-pay-ratio/. After Bloomberg published estimates of the CEO pay ratios of 250 companies of the S&P 500 index, approximately 1 out of every 4 companies commented on their score.
16 This material is a conceptual framework and should not be construed as
investment advice.
CORNERSTONE FOCUS REPORT
2. Empowering and educating
The OECD has identified jobs and education as the most important policy area where action can help
reduce extreme inequality38. Empowering and educating people can have long-term beneficial effects not
only by reducing high inequalities but also by strengthening the economy.
For companies, such strategies seem to be equally relevant. Starbucks is an interesting example. During the
financial crisis, Starbucks’ share price fell by 50% in one year, and business outlook was negative. The
company then chose to focus its strategy on its customers, and started investing in its people39. As a result,
Starbucks has managed to accumulate several years of strong financial performance while increasing
employee benefits. In 2014, Starbucks decided to address one of the main barriers to social mobility, and a
major driver of higher inequality: unequal access to education. The company announced that it will finance
college degrees for its employees, 70% of whom are students or aspiring students40. Behind such a decision
stands also a business rationale: it improves the company’s reputation, attracts better candidates and may
reduce staff turnover. Ultimately, this reduces costs and increases opportunities, and is a good example of the
added value of sustainable business, both in terms of profitability and of positive social impact.
Investing in human capital can be linked to better corporate performance. On a national level,
professional training, dual education and apprenticeship, popular in Germany and Austria, have helped job
markets weather the financial crisis better than other countries. Germany has one of the highest employment
rates among OECD countries, and a relatively low Gini coefficient (0.29 compared to 0.39 for the USA in 2011),
despite a recent slowdown in wage levels. Over the past 10 years, labor market reforms, combining job
protection with wage flexibility and vocational training, have pulled employment and income back to pre-
crisis levels. Although such solutions may not be optimal, they illustrate the existence of alternatives where
human capital development has been a central piece of economic policy.
BMW and Intel, for example, have made investing in training and education a core element of their corporate
strategy. Since 2009 BMW’s investment in further education and training of employees has doubled, to $288
million in 2013, and 3.5 days per employee on average. The company sees targeted employee training as an
investment in their future. This strategy has produced positive results: in 2013, the attrition rate was
particularly low (3.5%), while absenteeism due to sickness decreased for the third successive year (4.4%),
and overall employee satisfaction was high (89%)41. In an extremely competitive industry like automobiles,
investing in people’s expertise and talents is an important driver for success, according to sustainability
investment specialist RobecoSAM of Zurich 42.
Another example is Intel, which invested $300 million in employee training and development in 2013, and
encourages flexibility (change of assignments, sabbaticals, geographical mobility) for both professional and
personal objectives. As a result, Intel has one of the lowest turnover rates in the US market, 3.8% in 2013.
In addition, Intel is proactively addressing the global challenge of youth unemployment, by providing tools
and resources to help graduates integrate into the job market.43 For the semiconductor industry, RobecoSAM
38 http://www.oecd.org/unitedstates/Tackling-high-inequalities.pdf 39 See the story at https://hbr.org/2010/07/the-hbr-interview-we-had-to-own-the-mistakes/ar/1 40 http://www.starbucks.com/careers/college-plan 41 http://www.bmwgroup.com/com/en/_common/_pdf/BMW_Group_SVR2013_EN.pdf 42 http://yearbook.robecosam.com/industry/automobiles.html 43 http://www.intel.com/content/www/us/en/corporate-responsibility/intel-cag-education-employment.html
17 This material is a conceptual framework and should not be construed as
investment advice.
CORNERSTONE FOCUS REPORT
points out the crucial role of the capacity to innovate, and to attract and retain skilled workforce. Intel and
BMW alike placed human capital attraction, development and retention at the core of their business
strategies, and both have outperformed their respective benchmarks over the past year (see figure 7 p.19).
The role of corporations in contributing to education and continuous training is crucial, as the widening
income distribution gap is due in part to a widening education gap. According to Standard & Poor’s,
“income imbalances tend to dampen social mobility and produce a less-educated workforce that can't compete
in a changing global economy”44. Therefore, companies investing in education and in professional training not
only create value, but also contribute to strengthening the economy. From an investor’s perspective,
companies who focus on empowering and educating their employees are potentially increasing their
opportunities for value creation; they also contribute indirectly to a better market environment and long-
term economic outlook.
3. Better social performance is linked with better financial performance
Evidence demonstrates that better business models integrate human capital development and
empower employees as a means of creating value. Higher wages and benefits tend to reduce turnover,
which lowers human resource costs; they also increase motivation, loyalty and productivity, and reduce
absenteeism, increasing revenues and ultimately, profitability. On a macroeconomic level, higher wages
increase purchasing power and therefore demand.
This equation has been discovered quite early in the history of modern capitalism. Henry Ford’s decision in
1914 to almost double the average autoworker’s wage to 5 dollars a day was aimed at reducing employee
attrition45. A more recent example is the San Francisco Airport (SFO) experiment46, where the airport
increased wages for over 9,700 low wage workers to reduce human resource costs in the form of high
turnover while increasing security at the airport. The total cost of the wage increase was equivalent to 0.7
percent of the airport’s annual fare revenue, distributed among the airline companies and airport users. As a
result, staff turnover was reduced by 34%, equivalent to savings of $6.6 million per year for SFO employers.
What’s more, employees’ morale increased, grievances and absenteeism decreased, and service levels and
security indicators improved.
This example shows that a carefully designed human capital strategy that considers workers an investment
rather than a mere cost, can lead to cost reductions and improved business performance. For a company, the
benefits of paying “living” wages can outweigh the costs, and many companies are voluntarily implementing
this strategy. For an investor, human capital management can be an indicator of the quality of
management and the resilience of the overall business strategy. A company that focuses on reducing
human capital costs as a way of improving profitability, may have a poor overall strategy or insufficient insight
into the its value creation potential.
44 How Increasing Income Inequality is Dampening U.S. Economic Growth, and Possible Ways to Change the Tide, Standard & Poor’s (2014). The authors point out for example that “if we added another year of education to the American workforce from 2014 to 2019, in line with education levels increasing at the rate of educational achievement seen from 1960 to 1965, U.S. potential GDP would likely be $525 billion, or 2.4% higher in five years, than in the baseline.” 45 http://corporate.ford.com/news-center/press-releases-detail/677-5-dollar-a-day 46 http://www.irle.berkeley.edu/research/livingwage/sfo_mar03.pdf
18 This material is a conceptual framework and should not be construed as
investment advice.
CORNERSTONE FOCUS REPORT
SAP, the enterprise software company, has identified in its integrated report that employee retention is
correlated with company revenue, customer loyalty and margin47. SAP monitors its integrated human capital
/ financial performance indicators, such as revenue per employee, EBITDA per employee, and human capital
ROI, which have been growing over the past five years. These indicators, and the systematic inclusion of social
impacts (alongside environmental and governance issues) into the company’s performance evaluation, help
the company understand the connections between ESG and financial performance. SAP has for example
estimated that for every percentage point the employee retention rate goes up or down, the impact on the
operating profit is approximately €62 million (approx. $77.6 million). Such tools can help both the company
and its investors gain a better understanding of how human capital can drive sustainable performance over
the long term.
In the consumer staples sector, companies like Costco and Trader Joe’s are deploying strategies that are quite
different from their competitors48. Focusing on social capital by making employees more motivated,
loyal, and paying higher wages is a main element of their corporate strategy. This includes more
centered product strategy and cost discipline, and a reliance on the virtuous circle of well treated employees,
who in turn provide superior customer service, and are ultimately more loyal to the company. Such ventures
seem to be also very successful in economic and financial terms. As an example, since 2009, Costco has
experienced a steady growth rate in the number of stores, in net sales and in net income, while also increasing
the number of its employees and paying store workers at least $11.50 per hour49, significantly above the
minimum wage or industry averages. It is important to note that Costco has also been systematically
outperforming its competitors, such as Target and Walmart.
An example in the fast-food sector is Chipotle, which recently announced that raising the federal minimum
wage would not have a significant impacts on its business50 (Chipotle pays its employees above the minimum
wage, and has recorded a continuously strong financial performance – see figure 7). This strategy, especially
in the fast-food industry, reveals that reducing inequality and making profits do not appear to be
contradictory. A similar stance towards this issue by Starbucks indicates a deeper trend: that companies
which claim to be truly engaged in sustainable business are also expected to be “sustainable”
employers, as the social aspect of sustainability is an integral part of corporate excellence.
Such a strategy is also relevant in other sectors: in automobiles, BMW reckons on paying wages in the upper
third of the industry wage spectrum in its respective labor market. For BMW, this corresponds to rewarding
the “outstanding” performance of its employees, and consolidating its position as a top employer.
47 http://www.sapintegratedreport.com/2013/index.php?id=354&L=1 48 See the analysis of the “good jobs strategy” by Z.Ton at http://hbr.org/2012/01/why-good-jobs-are-good-for-retailers 49 Source: Costco Annual report 2013 50 http://blogs.marketwatch.com/behindthestorefront/2014/01/31/chipotle-says-it-could-afford-a-minimum-wage-hike-as-it-signals-possible-price-rise/
19 This material is a conceptual framework and should not be construed as
investment advice.
CORNERSTONE FOCUS REPORT
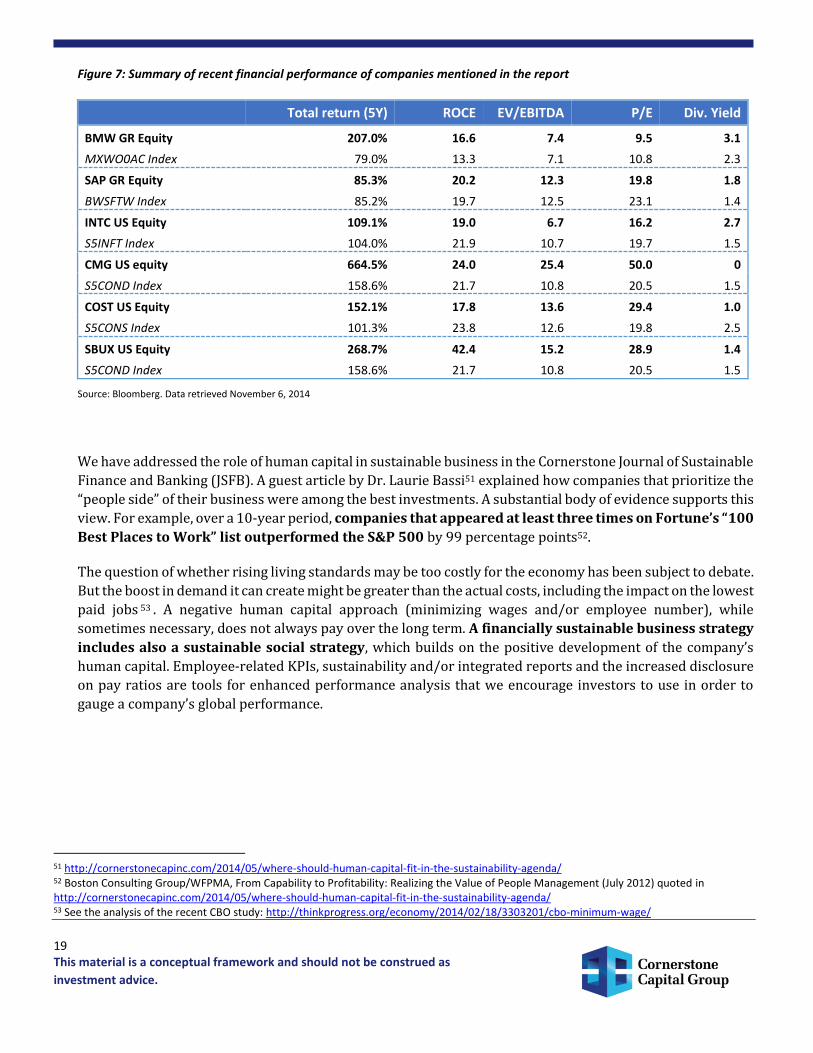
Figure 7: Summary of recent financial performance of companies mentioned in the report
Total return (5Y) ROCE EV/EBITDA P/E Div. Yield
BMW GR Equity 207.0% 16.6 7.4 9.5 3.1
MXWO0AC Index 79.0% 13.3 7.1 10.8 2.3
SAP GR Equity 85.3% 20.2 12.3 19.8 1.8
BWSFTW Index 85.2% 19.7 12.5 23.1 1.4
INTC US Equity 109.1% 19.0 6.7 16.2 2.7
S5INFT Index 104.0% 21.9 10.7 19.7 1.5
CMG US equity 664.5% 24.0 25.4 50.0 0
S5COND Index 158.6% 21.7 10.8 20.5 1.5
COST US Equity 152.1% 17.8 13.6 29.4 1.0
S5CONS Index 101.3% 23.8 12.6 19.8 2.5
SBUX US Equity 268.7% 42.4 15.2 28.9 1.4
S5COND Index 158.6% 21.7 10.8 20.5 1.5
Source: Bloomberg. Data retrieved November 6, 2014
We have addressed the role of human capital in sustainable business in the Cornerstone Journal of Sustainable
Finance and Banking (JSFB). A guest article by Dr. Laurie Bassi51 explained how companies that prioritize the
“people side” of their business were among the best investments. A substantial body of evidence supports this
view. For example, over a 10-year period, companies that appeared at least three times on Fortune’s “100
Best Places to Work” list outperformed the S&P 500 by 99 percentage points52.
The question of whether rising living standards may be too costly for the economy has been subject to debate.
But the boost in demand it can create might be greater than the actual costs, including the impact on the lowest
paid jobs 53 . A negative human capital approach (minimizing wages and/or employee number), while
sometimes necessary, does not always pay over the long term. A financially sustainable business strategy
includes also a sustainable social strategy, which builds on the positive development of the company’s
human capital. Employee-related KPIs, sustainability and/or integrated reports and the increased disclosure
on pay ratios are tools for enhanced performance analysis that we encourage investors to use in order to
gauge a company’s global performance.
51 http://cornerstonecapinc.com/2014/05/where-should-human-capital-fit-in-the-sustainability-agenda/ 52 Boston Consulting Group/WFPMA, From Capability to Profitability: Realizing the Value of People Management (July 2012) quoted in http://cornerstonecapinc.com/2014/05/where-should-human-capital-fit-in-the-sustainability-agenda/ 53 See the analysis of the recent CBO study: http://thinkprogress.org/economy/2014/02/18/3303201/cbo-minimum-wage/
21 This material is a conceptual framework and should not be construed as
investment advice.
CORNERSTONE FOCUS REPORT
Check-list of indicators and questions to assess a company’s human capital strategy related to the topic of high inequality
Human capital and profitability: relationship between the company’s financial profitability (ROI for example) and the evolution
of the number of employees (this standard number is reported either in annual reports, or if the company publishes a
sustainability report, as the GR4-LA1a indicator55)
→ Depending on the sector and the role of technology, observe if financial performance increases while the number of
employees decreases
→ Ask the company to explain how it intends to grow over the longer term while reducing its human capital: What is the rationale
for employee layoffs? What is the strategy for maintaining employee morale and productivity? How does the reduction in
headcount hinder or help the company’s long term growth prospects?
Human capital efficiency: level of turnover and absenteeism (corresponding GRI indicators: G4-LA1b and LA6a)
→ Are those indicators higher than the sector average, or increasing?
→ Ask the company to explain its level of absenteeism and its strategy to reduce it
Human capital valuation: assess the level of average wages and employee benefits against the sector average and the country’s
minimum and “living” wage standards56 (GRI indicators G4-EC5 and G4-LA2)
→ Are wages and benefits substantially lower, especially for hourly workers?
→ Ask the company about its strategy for the attraction and retention of talent, and management of turnover and absenteeism-
related costs, and how do wage levels play into this
Human capital development: training and education opportunities provided to the work force (GRI indicators G4-LA9, LA10
and LA11)
→ Are average hours of training below the sector’s average? Are they in line with the policy for human capital development?
→ Ask the company to explain its strategy for training and growth opportunities and explain deviations from industry averages
and industry leaders
55 GRI is the Global Reporting Initiative, an extra-financial reporting organization working with companies to standardize governance, social and environmental data reporting (www.gri.org). The nomenclature of key performance indicators of the GRI allows for easier comparison between companies. For instance, G4-LA1a is the indicator corresponding to the total number of employees. The correspondence with GRI indicators is usually found in annual and sustainability reports of companies who use the GRI standards. In the US, SASB (the Sustainability Accounting Standards Board) will also provide relevant and material indicators by sector, gauging the human capital management by companies (see www.sasb.org) 56 To be noted, there is no single definition of a living wage, however, there can be indicative thresholds agreed upon by social stakeholders.
22 This material is a conceptual framework and should not be construed as
investment advice.
CORNERSTONE FOCUS REPORT
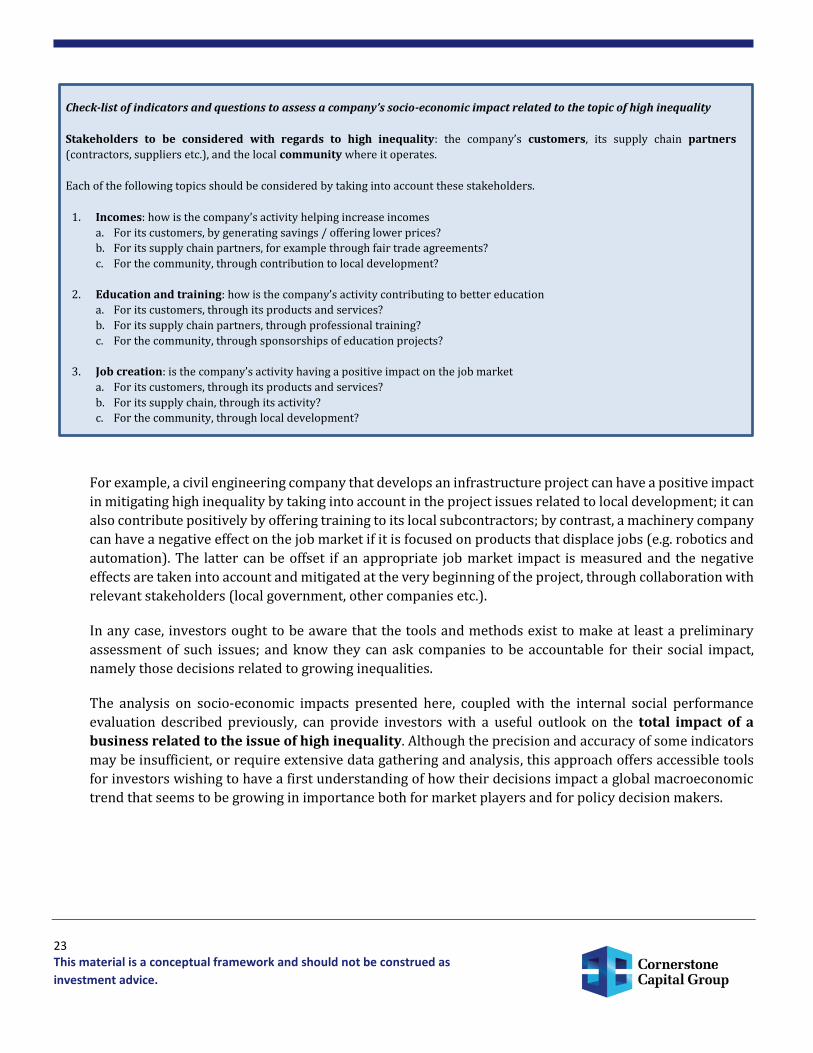
6. Measuring impact and the role of inclusive business
For some investors, the socio-economic impact of their investment decisions are at least as important as the
financial returns of their portfolios. Reducing inequality can for example be part of a global sustainable
investing strategy. But measuring how a business contributes to reducing inequality and poverty, and
enhancing living standards in a given community, is much more complex than assessing what a company does
for its own employees.
Measuring impact refers to understanding a business’ contribution to society. While there are several
tools for measuring impact, there is not yet a standard or an internationally agreed upon framework serving
this purpose. Indeed, assessing a business’ role in society can be a very broad enterprise. For example, in 2008,
Unilever endeavored to measure the full economic impact of its activities on the South African market.
Beyond the direct outcomes of the company’s operations in terms of sales and employees, the authors found
that the economic value added to the economy by Unilever amounted to R12.5 billion in 2005, around 0.9%
of the country's GDP57. Such a study, relatively costly and taking a long time to complete, is a very complex
task and has only been deployed at an ad hoc level.
A more recent example of such analysis is the impact of Intel on the US economy for the period of 2008-2012.
The findings show that the role of the company in the national economy is much broader than what is visible
from its direct financial results. For instance, the total impact on labor income of Intel’s activity was estimated
at $214.6 billion, and the total impact on U.S. GDP, at $408.5 billion. In terms of employment, a broad estimate
was that a total of 774,600 jobs were supported in 2012 by the company through its business activities and
53,200 US employees58.
While this is a powerful argument to back a license to operate, the point in measuring impact is to also assess
to what degree is a business really “inclusive”59 – to what extent it does share the value created with its
stakeholders. International organizations such as the World Business Council for Sustainable Development
(WBCSD) or the Business Call to Action initiative (BCtA) have built monitoring and evaluation tools that allow
companies to pick key reporting indicators adapted to their activity, to assess their external impact60.
Other tools, developed specifically for investors, such as the Impact Reporting and Investment Standards
(IRIS) of the Global Impact Investing network (GIIN), offer a broad range of ready-to-use indicators (for
example, “Jobs Created at Directly Supported/Financed Enterprises: Low Income Areas”). The Global Impact
Investing Ratings System (GIIRS), which offers a rating system assessing companies’ social and environmental
impact, uses the IRIS database of indicators.
The topic of high income inequality, and how business contributes, either positively or negatively, to this
phenomenon, can be tackled, at least partially, by assessing some of the socio-economic impacts of business
activities. Here we would like to offer some insight into how this can be effectively deployed in investment
decisions. This framework is only intended to illustrate one possible way of approaching this issue, and does
not aspire to be an actual tool to measure socio-economic impact.
57 http://www.unilever.com/sustainable-living-2014/enhancing-livelihoods/understanding-our-economic-impacts/unilever-in-south-africa/ 58 http://www.intel.com/content/www/us/en/company-overview/us-economic-impact-study-overview.html 59 See on inclusive business http://www.ids.ac.uk/files/dmfile/Pp9.pdf 60 http://www.wbcsd.org/work-program/development/measuring-impact.aspx and http://www.businesscalltoaction.org/wp-content/uploads/2010/07/BCtA-Reporting-Results-FINAL.pdf
Cornerstone Capital Inc. doing business as Cornerstone Capital Group (“Cornerstone”) is a Delaware corporation with headquarters in New York, NY. The Cornerstone Flagship Report (“Report”) is a service mark of Cornerstone Capital Inc. All other marks referenced are the property of their respective owners. The Report is licensed for use by named individual Authorized Users, and may not be reproduced, distributed, forwarded, posted, published, transmitted, uploaded or otherwise made available to others for commercial purposes, including to individuals within an Institutional Subscriber without written authorization from Cornerstone. The views expressed herein are the views of the individual authors and may not reflect the views of Cornerstone or any institution with which an author is affiliated. Such authors do not have any actual, implied or apparent authority to act on behalf of any issuer mentioned in this publication. This publication does not take into account the investment objectives, financial situation, restrictions, particular needs or financial, legal or tax situation of any particular person and should not be viewed as addressing the recipients’ particular investment needs. Recipients should consider the information contained in this publication as only a single factor in making an investment decision and should not rely solely on investment recommendations contained herein, if any, as a substitution for the exercise of independent judgment of the merits and risks of investments. This is not an offer or solicitation for the purchase or sale of any security, investment, or other product and should not be construed as such. References to specific securities and issuers are for illustrative purposes only and are not intended to be, and should not be interpreted as recommendations to purchase or sell such securities. Investing in securities and other financial products entails certain risks, including the possible loss of the entire principal amount invested. You should obtain advice from your tax, financial, legal, and other advisors and only make investment decisions on the basis of your own objectives, experience, and resources. Information contained herein is current as of the date appearing herein and has been obtained from sources believed to be reliable, but accuracy and completeness are not guaranteed and should not be relied upon as such. Cornerstone has no duty to update the information contained herein, and the opinions, estimates, projections, assessments and other views expressed in this publication (collectively “Statements”) may change without notice due to many factors including but not limited to fluctuating market conditions and economic factors. The Statements contained herein are based on a number of assumptions. Cornerstone makes no representations as to the reasonableness of such assumptions or the likelihood that such assumptions will coincide with actual events and this information should not be relied upon for that purpose. Changes in such assumptions could produce materially different results. Past performance is not a guarantee or indication of future results, and no representation or warranty, express or implied, is made regarding future performance of any security mentioned in this publication. Cornerstone accepts no liability for any loss (whether direct, indirect or consequential) occasioned to any person acting or refraining from action as a result of any material contained in or derived from this publication, except to the extent (but only to the extent) that such liability may not be waived, modified or limited under applicable law. This publication may provide addresses of, or contain hyperlinks to, Internet websites. Cornerstone has not reviewed the linked Internet website of any third party and takes no responsibility for the contents thereof. Each such address or hyperlink is provided solely for your convenience and information, and the content of linked third party websites is not in any way incorporated herein. Recipients who choose to access such third-party websites or follow such hyperlinks do so at their own risk.