November 2004 INCOME INEQUALITY IN THE UNITED STATES, 1913-2002* THOMAS PIKETTY, EHESS, Paris EMMANUEL SAEZ, UC Berkeley and NBER This paper presents new homogeneous series on top shares of income and wages from 1913 to 2002 in the United States using individual tax returns data. Top income and wages shares display a U-shaped pattern over the century. Our series suggest that the large shocks that capital owners experienced during the Great Depression and World War II have had a permanent effect on top capital incomes. We argue that steep progressive income and estate taxation may have prevented large fortunes from fully recovering from these shocks. Top wage shares were flat before World War II, dropped precipitously during the war, and did not start to recover before the late 1960s but are now higher than before World War II. As a result, the working rich have replaced the rentiers at the top of the income distribution. We emphasize the role of social norms as a potential explanation for the pattern of wage shares. *This paper is a longer and updated version of Piketty and Saez (2003). We thank Tony Atkinson for very helpful and detailed comments. We thankfully acknowledge financial support from the McArthur Foundation, the Alfred P. Sloan Foundation, and NSF Grant SES-0134946.
Transcript
November 2004
INCOME INEQUALITY IN THE UNITED STATES, 1913-2002*
THOMAS PIKETTY, EHESS, Paris
EMMANUEL SAEZ, UC Berkeley and NBER
This paper presents new homogeneous series on top shares of income and
wages from 1913 to 2002 in the United States using individual tax returns data.
Top income and wages shares display a U-shaped pattern over the century. Our
series suggest that the large shocks that capital owners experienced during the
Great Depression and World War II have had a permanent effect on top capital
incomes. We argue that steep progressive income and estate taxation may have
prevented large fortunes from fully recovering from these shocks. Top wage
shares were flat before World War II, dropped precipitously during the war, and
did not start to recover before the late 1960s but are now higher than before
World War II. As a result, the working rich have replaced the rentiers at the top of
the income distribution. We emphasize the role of social norms as a potential
explanation for the pattern of wage shares.
*This paper is a longer and updated version of Piketty and Saez (2003).
We thank Tony Atkinson for very helpful and detailed comments. We thankfully
acknowledge financial support from the McArthur Foundation, the Alfred P. Sloan
Foundation, and NSF Grant SES-0134946.
1
1. INTRODUCTION
According to Kuznets’ influential hypothesis, income inequality should
follow an inverse-U shape along the development process, first rising with
industrialization and then declining, as more and more workers join the high-
productivity sectors of the economy [Kuznets 1955]. Today, the Kuznets curve is
widely held to have doubled back on itself, especially in the United States, with
the period of falling inequality observed during the first half of the 20th century
being succeeded by a very sharp reversal of the trend since the 1970s. This
does not imply however that Kuznets’ hypothesis is no longer of interest. One
could indeed argue that what has been happening since the 1970s is just a
remake of the previous inverse-U curve: a new industrial revolution has taken
place, thereby leading to increasing inequality, and inequality will decline again at
some point, as more and more workers benefit from the new innovations.
To cast light on this central issue, we build new homogeneous series on
top shares of pre-tax income and wages in the United States covering the 1913
to 2002 period. These new series are based primarily on tax returns data
published annually by the Internal Revenue Service (IRS) since the income tax
was instituted in 1913, as well as on the large micro-files of tax returns released
by the IRS since 1960.
First, we have constructed annual series of shares of total income
accruing to various upper income groups fractiles within the top decile of the
income distribution. For each of these fractiles, we also present the shares of
each source of income such as wages, business income, and capital income.
Kuznets [1953] did produce a number of top income shares series covering the
1913 to 1948 period, but tended to underestimate top income shares, and the
highest group analyzed by Kuznets is the top percentile.1 Most importantly,
nobody has attempted to estimate, as we do here, homogeneous series covering
1Analyzing smaller groups within the top percentile is critical because capital income is extremely concentrated.
2
the entire century.2 Second, we have constructed annual 1927 to 2002 series of
top shares of salaries for the top fractiles of the wage income distribution, based
on tax returns tabulations by size of salaries compiled by the IRS since 1927. To
our knowledge, this is the first time that a homogeneous annual series of top
wage shares starting before the 1950s for the United States has been produced.3
Our estimated top shares series display a U-shaped over the century and
suggest that a pure Kuznets mechanism cannot account fully for the facts. We
find that top capital incomes were severely hit by major shocks in the first part of
the century. The post World War I depression and the Great Depression
destroyed many businesses and thus reduced significantly top capital incomes.
The wars generated large fiscal shocks, especially in the corporate sector that
mechanically reduced distributions to stockholders. We argue that top capital
incomes were never able to fully recover from these shocks, probably because of
the dynamic effects of progressive taxation on capital accumulation and wealth
inequality. We also show that top wage shares were flat from the 1920s until
1940 and dropped precipitously during the war. Top wage shares have started to
recover from the World War II shock in the late 1960s, and they are now higher
than before World War II. Thus the increase in top income shares in the last
three decades is the direct consequence of the surge in top wages. As a result,
the composition of income in the top income groups has shifted dramatically over
the century: the working rich have now replaced the coupon-clipping rentiers. We
argue that both the downturn and the upturn of top wage shares seem too
sudden to be accounted for by technical change alone. Our series suggest that
other factors, such as changes in labor market institutions, fiscal policy, or more
generally social norms regarding pay inequality may have played important roles
in the determination of the wage structure. Although our proposed interpretation
for the observed trends seems plausible to us, we stress that we cannot prove
2 Feenberg and Poterba [1993, 2000] have constructed top income share series covering the 1951-1995 period, but their series are not homogeneous with those of Kuznets. Moreover, they provide income shares series only for the top 0.5 percent, and not for other fractiles. 3 Previous studies on wage inequality before 1945 in the United States rely mostly on occupational pay ratios [Williamson and Lindert 1980, Goldin and Margo 1992, and Goldin and Katz 1999].
3
that progressive taxation and social norms have indeed played the role we
attribute to them. In our view, the primary contribution of this paper is to provide
new series on income and wage inequality.
One additional motivation for constructing long series is to be able to
separate the trends in inequality that are the consequence of real economic
change from those that are due to fiscal manipulation. The issue of fiscal
manipulation has recently received much attention. Studies analyzing the effects
of the Tax Reform Act of 1986 (TRA86) have emphasized that a large part of the
response observable in tax returns was due to income shifting between the
corporate sector and the individual sector [Slemrod 1996, Gordon and Slemrod
2000]. We do not deny that fiscal manipulation can have substantial short-run
effects, but we argue that most long-run inequality trends are the consequence of
real economic change, and that a short-run perspective might lead to attribute
improperly some of these trends to fiscal manipulation.
The paper is organized as follows. Section II describes our data sources
and outlines our estimation methods. In Section III, we present and analyze the
trends in top income shares, with particular attention to the issue of top capital
incomes. Section IV focuses on trends in top wages shares. Section V offers
concluding comments and proposes an international comparison. All series and
complete technical details about our methodology are gathered in the
appendices of the paper.
2. DATA AND METHODOLOGY Our estimations rely on tax returns statistics compiled annually by the Internal
Revenue Service since the beginning of the modern U.S. income tax in 1913.
Before 1944, because of large exemptions levels, only a small fraction of
individuals had to file tax returns and therefore, by necessity, we must restrict our
analysis to the top decile of the income distribution.4 Because our data are based
on tax returns, they do not provide information on the distribution of individual
4
incomes within a tax unit. As a result, all our series are for tax units and not
individuals.5 A tax unit is defined as a married couple living together (with
dependents) or a single adult (with dependents), as in the current tax law. The
average number of individuals per tax unit decreased over the century but this
decrease was roughly uniform across income groups. Therefore, if income were
evenly allocated to individuals within tax units,6 the time series pattern of top
shares based on individuals should be very similar to that based on tax units.
Tax units within the top decile form a very heterogeneous group, from the
high middle class families deriving most of their income from wages to the super-
rich living off large fortunes. More precisely, we will see that the composition of
income varies substantially by income level within the top decile. Therefore, it is
critical to divide the top decile into smaller fractiles. Following Piketty [2001a,
2001b], in addition to the top decile (denoted by P90-100), we have constructed
series for a number of higher fractiles within the top decile: the top 5 percent
(P95-100), the top 1 percent (P99-100), the top 0.5 percent (P99.5-100), the top
0.1 percent (P99.9-100), and the top 0.01 percent (P99.99-100). This also allows
us to analyze the five intermediate fractiles within the top decile: P90-95, P95-99,
P99-99.5, P99.5-99.9, P99.9-99.99. Each fractile is defined relative to the total
number of potential tax units in the entire U.S. population. This number is
computed using population and family census statistics [U.S. Department of
Commerce, Bureau of Census 1975 and Bureau of Census 1999] and should not
be confused with the actual number of tax returns filed. In order to get a more
concrete sense of size of income by fractiles, Table I displays the thresholds, the
average income level in each fractile, along with the number of tax units in each
fractile all for 2000.
4 From 1913 to 1916, because of higher exemption levels, we can only provide estimates within the top percentile. 5 Kuznets [1953] decided nevertheless to estimate series based on individuals not tax units. We explain in Piketty and Saez [2001] why his method produced a downward bias in the levels (though not in the pattern) of top shares. 6 Obviously, income is not earned evenly across individuals within tax units, and, because of increasing female labor force participation, the share of income earned by the primary earner has certainly declined over the century. Therefore, inequality series based on income earned at the individual level would be different. Our tax returns statistics are mute on this issue. We come back to that point when we present our wage estimates.
5
We use a gross income definition including all income items reported on
tax returns and before all deductions: salaries and wages, small business and
farm income, partnership and fiduciary income, dividends, interest, rents,
royalties, and other small items reported as other income. Realized capital gains
are not an annual flow of income (in general, capital gains are realized by
individuals in a lumpy way) and form a very volatile component of income with
large aggregate variations from year to year depending on stock price variations.
Therefore, we focus mainly on series that exclude capital gains.7 Income,
according to our definition, is computed before individual income taxes and
individual payroll taxes but after employers’ payroll taxes and corporate income
taxes.8
The sources from which we obtained our data consist in tables displaying
the number of tax returns, the amounts reported, and the income composition, for
a large number of income brackets [U.S. Treasury Department, Internal Revenue
Service, 1916-2002]. As the top tail of the income distribution is very well
approximated by a Pareto distribution, we use simple parametric interpolation
methods to estimate the thresholds and average income levels for each of our
fractiles. We then estimate shares of income by dividing the income amounts
accruing to each fractiles by total personal income computed from National
Income Accounts [Kuznets, 1941, 1945, and U.S. Department of Commerce,
2000].9 Using the published information on composition of income by brackets
and a simple linear interpolation method, we decompose the amount of income
for each fractile into five components: salaries and wages, dividends, interest
income, rents and royalties, and business income.
7In order to assess the sensitivity of our results to the treatment of capital gains, we present additional series including capital gains (see below). Details on the methodology and complete series are presented in appendix of Piketty and Saez [2001]. 8 Computing series after individual income taxes is beyond the scope of the present paper but is a necessary step to analyze the redistributive power of the income tax over time, as well as behavioral responses to individual income taxation. 9 This methodology using tax returns to compute the level of top incomes, and using national accounts to compute the total income denominator is standard in historical studies of income inequality. Kuznets [1953], for instance, adopted this method.
6
We use the same methodology to compute top wage shares using
published tables classifying tax returns by size of salaries and wages. In this
case, fractiles are defined relative to the total number of tax units with positive
wages and salaries estimated as the number of part-time and full workers from
National Income Accounts [U.S. Department of Commerce, 2000] less the
number of wives who are employees [estimated from U.S. Department of
Commerce, Bureau of Census 1975 and Bureau of Census 1999]. The sum of
total wages in the economy used to compute shares is also obtained from
National Income Accounts [U.S. Department of Commerce, 2000].
The published IRS data vary from year to year and there are numerous
changes in tax law between 1913 and 2002.10 To construct homogeneous series,
we make a number of adjustments and corrections. Individual tax returns micro-
files are available since 1960.11 They allow us to do exact computations of all our
statistics for that period and to check the validity of our adjustments. Kuznets
[1953] was not able to use micro-files to assess possible biases in his estimates
due to his methodological assumptions.12
Our method differs from the recent important studies by Feenberg and
Poterba [1993, 2000] who derive series of the income share of the top 0.5
percent13 for 1951 to 1995. They use total income reported on tax returns as their
denominator and the total adult population as their base to obtain the number of
tax units corresponding to the top fractiles.14 Their method is simpler than ours
but cannot be used for years before 1945 when a small fraction of the population
filed tax returns.
10 The most important example is the treatment of capital gains and the percentage of these gains that are included in the statistics tables. 11 These data are known as the Individual Tax Model files. They contain about 100,000 returns per year and largely oversample high incomes, providing a very precise picture of top reported incomes. 12 In particular Kuznets treatment of capital gains produces a downward bias in the level of his top shares. 13 They also present incomplete series for the top 1percent. 14 This method is not fully satisfying for a long-run study as the average number of adults per tax unit has decreased significantly since World War II.
7
3. TOP INCOME SHARES AND COMPOSITION
A. Trends in Top Income Shares
The basic series of top income shares are presented in Table A1. Figure I
shows that the income share of the top decile of tax units from 1917 to 2002 is U-
shaped. The share of the top decile fluctuated around 40 to 45 percent during the
interwar period. It declined substantially to about 30 percent during World War II,
and then remained stable at 31 to 32 percent until the 1970s when it increased
again. By the mid-1990s, the share had crossed the 40 percent level and is now
at a level close to the prewar level, although a bit lower. Therefore, the evidence
suggests that the twentieth century decline in inequality took place in a very
specific and brief time interval. Such an abrupt decline cannot easily be
reconciled with a Kuznets type process. The smooth increase in inequality in the
last three decades is more consistent with slow underlying changes in the
demand and supply of factors, even though it should be noted that a significant
part of the gain is concentrated in 1987 and 1988 just after the Tax Reform Act of
1986 which sharply cut the top marginal income tax rates (we will return to this
issue).
Looking at the bottom fractiles within the top decile (P90-95 and P95-99)
in Figure II reveals new evidence. These fractiles account for a relatively small
fraction of the total fluctuation of the top decile income share. The drop in the
shares of fractiles P90-95 and P95-99 during World War II is less extreme than
for the top decile as a whole, and they start recovering from the World War II
shock directly after the war. These shares do not increase much during the
1980s and 1990s (the P90-95 share was fairly stable, and the P95-99 share
increased by about 2 percentage points while the top decile share increased by
about 10 percentage points).
In contrast to P90-95 and P95-99, the top percentile (P99-100 in Figure II)
underwent enormous fluctuations over the twentieth century. The share of total
income received by the top 1 percent was about 18 percent before World War I,
8
but only about 8 percent from the late 1950s to the 1970s. The top percentile
share declined during World War I and the post war depression (1916 to 1920),
recovered during the 1920s boom, and declined again during the Great
Depression (1929 to 1932, and 1936 to 1938) and World War II. This highly
specific timing for the pattern of top incomes, composed primarily of capital
income (see below), strongly suggests that shocks to capital owners between
1914 and 1945 (depression and wars) played a key role. The depressions of the
inter-war period were far more profound in their effects than the post-World War
II recessions. As a result, it is not surprising that the fluctuations in top shares
were far wider during the inter-war period than in the decades after the war.15
Figure II shows that the fluctuation of shares for P90-95 and P95-99 is
exactly opposite to the fluctuation for P99-100 over the business cycle from 1917
to 1939. As shown below, the P90-95 and P95-99 incomes are mostly composed
of wage income while the P99-100 incomes are mostly composed of capital
income. During the large downturns of the inter-war period, capital income
sharply fell while wages (especially for those near the top), which are generally
rigid nominally, improved in relative terms. On the other hand, during the booms
(1923-1929) and the recovery (1933-1936), capital income increased quickly, but
as prices rose, top wages lost in relative terms.16
The negative effect of the wars on top incomes is due in part to the large
tax increases enacted to finance them. During both wars, the corporate income
tax (as well as the individual income tax) was drastically increased and this
reduced mechanically the distributions to stockholders.17 National Income
Accounts show that during World War II, corporate profits surged, but dividend
distributions stagnated mostly because of the increase in the corporate tax (who
15 The fact that top shares are very smooth after 1945 and bumpy before is therefore not an artifact of an increase in the accuracy of the data (in fact, the data is more detailed before World War II than after), but reflects real changes in the economic conditions. 16 Piketty [2001a, 2003] shows that exactly the same phenomenon is taking place in France at the same period. 17 During World War I, top income tax rates reached “modern” levels above 60 percent in less than two years. As was forcefully argued at that time by Mellon [1924], it is conceivable that large incomes found temporary ways to avoid taxation at a time where the administration of the Internal Revenue Service was still in its infancy.
9
increased from less than 20 percent to over 50 percent) but also because
retained earnings increased sharply.18
The decline in top incomes during the first part of the century is even more
pronounced for higher fractiles within the top percentile, groups that could be
expected to rely more heavily on capital income. As depicted in Figure III, the
income share of the top 0.01 percent underwent huge fluctuations during the
century. In 1915, the top 0.01 percent earned 400 times more than the average;
in 1970, the average top 0.01 percent income was “only” 50 times the average; in
2002, they earned about 300 times the average income.
Our long-term series place the TRA 1986 episode in a longer term
perspective. Feenberg and Poterba [1993, 2000], looking at the top 0.5 percent
income shares series ending in 1992 (and 1995 respectively), argued that the
surge after TRA86 appeared permanent. However, completing the series up to
2002 shows that the significant increase in the top marginal tax rate, from 31 to
39.6 percent, enacted in 1993 on did not prevent top shares from increasing
sharply up to year 2000.19 From that perspective, looking at Figures II and III, the
average increase in top shares from 1985 to 1994 is not significantly higher than
the increase from 1994 to 2000 or from 1978 to 1984. As a result, it is possible to
argue that TRA86 produced no permanent surge in top income shares, but only a
transitory blip. The analysis of top wage shares in Section IV will reinforce this
interpretation. In any case, the pattern of top income shares cannot be explained
fully by the pattern of top income tax rates. Saez (2004) analyses in much more
detail the links between top income shares and marginal tax rates for the period
1960-2000.
The drop in top incomes shares from 2000 to 2002, concentrated
exclusively among the top 1% is also remarkable. This later phenomenon is likely
due to the stock-market crash which reduced dramatically the value of stock-
18 Computing top shares for incomes before corporate taxes by imputing corporate profits corresponding to dividends received is an important task left for future research (see Goldsmith et al. [1954] and Cartter [1954] for such an attempt around the World War II period). 19 Slemrod and Bakija [2000] pointed out that top incomes have surged in recent years. They note that tax payments by taxpayers with AGI above $200,000 increased significantly from 1995 to 1997.
10
options and hence depressed top reported wages and salaries.20 The series
including realized capital gains display an even larger fall (see Figure A2 in
appendix).
B. The secular decline of top capital incomes
To demonstrate more conclusively that shocks to capital income were
responsible for the large decline of top shares in the first part of the century, we
look at the composition of income within the top fractiles. Table A7 reports the
composition of income in top groups for various years from 1916 and 1999.
Figure V displays the composition of income for each fractile in 1929 (Panel A)
and 1999 (Panel B). As expected, Panel A shows the share of wage income is a
declining function of income and that the share of capital income (dividends,
interest, rents and royalties) is an increasing function of income. The share of
entrepreneurial income (self-employment, small businesses, and partnerships) is
fairly flat. Thus, individuals in fractiles P90-95 and P95-99 rely mostly on labor
income (capital income is less than 25 percent for these groups) while individuals
in the top percentile derive most of their income in the form of capital income.
Complete series in Piketty and Saez [2001] show that the sharply increasing
pattern of capital income is entirely due to dividends. This evidence confirms that
the very large decrease of top incomes observed during the 1914 to 1945 period
was to a large extent a capital income phenomenon.
One might also be tempted to interpret the large upturn in top income
shares observed since the 1970s as a revival of very high capital incomes, but
this is not the case. As shown in Panel B, the income composition pattern has
changed drastically between 1929 and 1999. In 1999, the share of wage income
has increased significantly for all top groups. Even at the very top, wage income
and entrepreneurial income form the vast majority of income. The share of capital
20 Because stock-options are reported as wage income only when exercised, our income measure (even excluding capital gains) is contaminated by stock-market fluctuations in the recent decades. Ideally, one would want to include in wage income only the Black-Scholes value of stock-options at the moment they are granted. The difference between the exercise profit and the Black-Scholes value (which is zero in expectation) should be conceptually considered as a capital gain.
11
income remains small (less than 25%) even for the highest incomes. Therefore,
the composition of high incomes at the end of the century is very different from
those earlier in the century. Before World War II, the richest americans were
overwhelmingly rentiers deriving most of their income from wealth holdings
(mainly in the form of dividends).
Occupation data by income bracket were published by the IRS in 1916
only. Those statistics classified tax returns into 36 different occupations by
brackets of income. We have combined these 36 occupations into four groups:
salaried professions; independent professions; business owners; and capitalists
and rentiers. The salaried professions are those who receive salaries such as
teachers, civil servants, engineers, corporation managers and officials. These
individuals presumably derive an important part of their income in the form of
wages and salaries. Independent professions are self-employed individuals or
individuals working in partnerships such as lawyers, doctors, etc. Business
owners are merchants, hotel proprietors, manufacturers, etc. These two groups
presumably derive most of their incomes in the form of business income. Finally
capitalists and rentiers are bankers, brokers, and those who classify themselves
as “capitalists: investors and speculators”,21 and presumably derive most of their
income in the form of capital income. It is possible, especially at the very top, for
some individuals to be classified in more than one group. We present in Table 2
the distribution of these four occupation groups by fractiles within the top
percentile.22 This table confirms our previous results: the share of the salaried
occupation declines steadily within the top percentile from 28% to less than 10%
at the very top. The share of independent professions also declines from 20% to
5%. The share of business owners is first increasing (from 30% to 40%) and
declining slightly at the very top. The share of capitalists increases sharply
especially at the very top where 95% of the top 400 taxpayers fall into this
category. This table shows clearly that top corporate executives at the beginning
21 At the very top, “capitalists: investors and speculators” form the overwhelming majority of our capitalists and rentiers group. 22 We have added a fractile for the top 0.001% (top 400 taxpayers in 1916) to emphasize how the very top is composed overwhelmingly of “capitalists”.
12
of the century were only a tiny minority within the top taxpayers. In contrast, in
1999, more than half of the very top taxpayers derive the major part of their
income in the form of wages and salaries. Thus, today, the “working rich”
celebrated by Forbes magazine have overtaken the “coupon-clipping rentiers”.
The dramatic evolution of the composition of top incomes appears robust
and independent from the erratic evolution of capital gains excluded in Figures I
to IV. Tables A2 and A3 display the top income shares including realized capital
gains. In Table A2, in order to get around the lumpiness of realizations,
individuals are ranked by income excluding capital gains but capital gains are
added back to income to compute shares. In Table A3, individuals are ranked by
income including capital gains and capital gains are added back to income to
compute shares. As depicted for the top 1% on Figure A2, these additional series
show that including capital gains does not modify our main conclusion that very
top income shares dropped enormously during the 1914-1945 period before
increasing steadily in the last three decades.23
The decline of the capital income share is a very long-term phenomenon
and is not limited to a few years and a few thousands tax units. Figure V shows a
gradual secular decline of the share of capital income (excluding again capital
gains realizations) and dividends in the top 0.5 percent fractile from the 1920s to
the 1990s: capital income made about 55 percent of total income in the 1920s,
35 percent in the 1950s-1960s, and 15 percent in the 1990s. Sharp declines
occurred during World War I, the Great Depression, and World War II. Capital
income recovered only partially from these shocks in the late 1940s and started a
steady decline in the mid-1960s. This secular decline is entirely due to dividends:
the share of interest, rent and royalties has been roughly flat while the dividend
23 It is interesting to note, however, that during the 1960s, when dividends were strongly tax disadvantaged relative to capital gains, capital gains do seem to represent a larger share in top incomes than during other periods such as the 1920s or late 1990s that also witnessed large increases in stock prices.
13
share has dropped from about 40 percent in the 1920s, to about 25 percent in
the 1950s and 1960s, to less than 10 percent in the 1990s.24
Most importantly, the secular decline of top capital incomes is due to a
decreased concentration of capital income rather than a decline in the share of
capital income in the economy as a whole. As displayed on Figure VI, the
National Income Accounts series show that the aggregate capital income share
has not declined over the century. As is well known, factor shares in the
corporate sector have been fairly flat in the long-run with the labor share around
70-75 percent, and the capital share around 25-30 percent (Panel A). The share
of capital income in aggregate personal income is about 20 percent both in the
1920s and in the 1990s (Panel B). Similarly, the share of dividends was around 5
percent in the late 1990s and only slightly higher (about 6-7 percent) before the
Great Depression. This secular decline is very small compared to the enormous
fall of top capital incomes.25 Contrarily to a widely held view, dividends as a
whole are still well and alive.26
It should be noted, however, that the ratio of total dividends reported on
individual tax returns to personal dividends in National Accounts has declined
continuously over the period 1927 to 1995, starting from a level close to 90
percent in 1927, declining slowly to 60 percent in 1988, and dropping
precipitously to less than 40 percent in 1995. This decline is due mostly to the
growth of funded pension plans and retirement saving accounts through which
individuals receive dividends that are never reported as dividends on income tax
returns. For the highest income earners, this additional source of dividends is
likely to be very small relative to dividends directly reported on tax returns.
24 Tax statistics by size of dividends analyzed in Piketty and Saez [2001] confirm a drastic decline of top dividend incomes over the century. In 1998 dollars, top 0.1 percent dividends earners reported on average about $500,000 of dividends in 1927 but less than $240,000 in 1995. 25 The share of dividends in personal income starts declining in 1940 because the corporate income tax increases sharply and permanently, reducing mechanically profits that can be distributed to stockholders. 26 As documented by Fama and French (2000), a growing fraction of firms never pay dividends (especially in the new technology industries, where firms often make no profit at all), but the point is that total dividend payments continue to grow at the same rate as aggregate corporate profits.
14
Estate tax returns statistics (available since the beginning on the estate
tax in 1916) are an alternative important source of data to analyze the evolution
of large fortunes.27 Kopczuk and Saez (2004) used those data, recently compiled
in electronic format by the IRS for most of the period, to construct top wealth
shares for the period 1916-2000 using the estate multiplier method. Figure VII
displays the top 0.1% share series from Kopczuk and Saez (2004). It shows that
the top 0.1% has indeed dropped drastically from over 20% in the early part of
the century to around 7.5% in the 1970s. In contrast to top income shares, the
increase in wealth concentration has been modest since the 1970s: the top 0.1%
wealth share has increased modestly to around 9-10% by 2000. This evidence is
consistent with our previous results on the decline in top capital incomes over the
century. There is a concern that estate tax avoidance and evasion might bias
downward wealth concentration estimated using the estate multiplier technique.
The most popular forms of estate tax avoidance involve setting up trusts whereby
wealthy individuals can pass substantial wealth to the next generations with
modest gift tax liability and while keeping some control over assets. Tax statistics
on trusts, analyzed in Kopczuk and Saez (2004), show, however, that capital
income earned through all trusts is relatively modest and has actually declined in
relative terms over the century. Thus, adding back all trust wealth to top wealth
holders would not affect the pattern of top wealth shares constructed in Kopczuk
and Saez (2004).
C. Proposed interpretation: the role of progressive taxation
How can we explain the steep secular decline in capital income
concentration? It is easy to understand how the macro-economic shocks of the
Great Depression and the fiscal shocks of World War I and World War II have
had a negative impact on capital concentration. The difficult question to answer is
why large fortunes did not recover from these shocks. The most natural and
realistic candidate for an explanation seems to be the creation and the
27 In particular, capital gains not realized before death are never reported on income tax returns, but are included in the value of assessed estates.
15
development of the progressive income tax (and of the progressive estate tax
and corporate income tax). The very large fortunes that generated the top 0.01
percent incomes observed at the beginning of the century were accumulated
during the nineteenth century, at a time where progressive taxes hardly existed
and capitalists could dispose of almost all their income to consume and to
accumulate.28 The fiscal situation faced by capitalists in the twentieth century to
recover from the shocks incurred during the 1914 to 1945 period has been
substantially different. Top tax rates were very high from the end of World War I
to the early 1920s, and then continuously from 1932 to the mid-1980s. Moreover,
the United States has imposed a sharply progressive estate tax since 1916, and
a substantial corporate income tax ever since World War II.29 These very high
marginal rates applied to only a very small fraction of taxpayers, but created a
substantial burden on the very top income groups (such as the top 0.1 percent
and 0.01 percent) composed primarily of capital income. In contrast to
progressive labor income taxation, which simply produces a level effect on
earnings through labor supply responses, progressive taxation of capital income
has cumulative or dynamic effects because it reduces the net-return on wealth
which generates tomorrow’s wealth.
It is difficult to prove in a rigorous way that the dynamic effects of
progressive taxation on capital accumulation and pre-tax income inequality have
the right quantitative magnitude and account for the observed facts. One would
need to know more about the savings rates of capitalists, how their accumulation
strategies have changed since 1945. The orders of magnitude do not seem
unrealistic, especially if one assumes that the owners of large fortunes, whose
pre-tax incomes were already severely hit by the prewar shocks, were not willing
to reduce their consumption to very low levels. Piketty [2001, 2003] provides
simple numerical simulations showing that for a fixed saving rate, introducing
substantial capital income taxation has a tremendous effect on the time needed
28 During the nineteenth century, the only progressive tax was the property tax, but its level was low (see Brownlee [2000] for a detailed description). 29 From 1909 (first year the corporate tax was imposed) to the beginning of World War II, the corporate tax rate was low, except during World War I.
16
to reconstitute large wealth holdings after negative shocks. Moreover, reduced
savings in response to a reduction in the after-tax rate of return on wealth would
accelerate the decrease in wealth inequality. Piketty [2003] shows that in the
classic dynastic model with infinite horizon, any positive capital income tax rate
above a given high threshold of wealth will eventually eliminate all large wealth
holdings without affecting, however, the total capital stock in the economy.
We are not the first to propose progressive taxation as an explanation for
the decrease in top shares of income and wealth. Lampman [1962] did as well
and Kuznets [1955] explicitly mentioned this mechanism as well as the shocks
incurred by capital owners during the 1913 to 1948 period, before presenting his
inverted U-shaped curve theory based on technological change. Explanations
pointing out that periods of technological revolutions such as the last part of the
nineteenth century (industrial revolutions) or the end of the twentieth century
(computer revolution) are more favorable to the making of fortunes than other
periods might also be relevant.30 Our results suggest that the decline in income
tax progressivity since the 1980s, the reduction in the tax rate for dividend
income in 2003, and the projected repeal of the estate tax by 2011 might produce
again in a few decades levels of wealth concentration similar to those of the
beginning of the twentieth century.31
4. TOP WAGE SHARES
Table B2 displays top wage shares from 1927 to 2002 constructed using
IRS tabulations by size of wages. There are three caveats to note about these
long-term wage inequality series. First, self-employment income is not included in
wages and therefore our series focus only on wage income inequality. As self-
30 DeLong [1998] also points out the potential role of anti-trust law. According to DeLong, anti-trust law was enforced more loosely before 1929 and since 1980 than between 1929 and 1980. 31 The tax cut on dividend income of 2003 generated a surge in dividend initiations among publicly traded companies (Chetty and Saez, 2004). Microsoft, for example, started paying dividends in 2003 and made a huge special dividend distribution in 2004. William Gates, founder of the company and richest American person, will earn $3,600 million of dollars from Microsoft dividends in 2004, by far the largest income ever earned in any single year in the United States. It
17
employment income has been a decreasing share of labor income over the
century, it is conceivable that the pool of wage and salary earners has
substantially evolved overtime, and that total labor income inequality series
would differ from our wage inequality series. Second and related, large changes
in the wage force due to the business cycle and wars might affect our series
through compositional effects because we define the top fractiles relative to the
total number of tax units with positive wage income. As can be seen in column
(1) of Table B1, the number of tax units with wages declined during the Great
Depression due to high levels of unemployment, increased sharply during World
War II because of the increase in military personnel, and decreased just after the
war. We show in appendix B3 that these entry effects do not affect top shares
when the average wage of the new entrants is equal to about 50 percent of the
average wage. This condition is approximately satisfied for military personnel in
World War II and thus top wage shares including or excluding military personnel
during World War II are almost identical. Third, our wage income series are
based on the tax unit and not the individual. As a result, an increase in the
correlation of earnings across spouses, as documented in Karoly [1993], with no
change in individual wage inequality, would generate an increase in tax unit
wage inequality.32
Figure VIII displays the wage share of the top decile and Figure IX
displays the wage shares of the P90-95, P95-99, and P99-100 groups from 1927
to 2002. As for overall income, the pattern of top decile wage share over the
century is also U-shaped. There are, however, important differences that we
describe below. It is useful to divide the period from 1927 to 2002 into three sub-
periods: the pre-World War II period (1927 to 1940), the war and post-war period
remains to be seen whether this reform will affect significantly the composition of top reported incomes. It will certainly be a useful test of the magnitude of fiscal manipulation effects. 32 This point can be analyzed using the Current Population Surveys available since 1962 which allow the estimation of wage inequality series both at the individual and tax unit level. In Canada, it is possible to construct top income shares both at the family and individual level since 1982. Those series, presented in Saez and Veall (2004) show that the upward trend in top income shares is almost identical at the individual and family suggesting that the secondary earner effect cannot explain the surge in top income shares.
18
(1941 to 1969), and the last three decades (1970 to 2002). We analyse each of
these periods in turn.
A. Wage inequality stability before World War II
Top wage shares display a striking stability from 1927 to 1940. This is
especially true for the top percentile. In contrast to capital income, the Great
Depression did not produce a reduction in top wage shares. On the contrary, the
high middle class fractiles benefited in relative terms from the Great Depression.
Even though the IRS has not published tables on wage income over the period
1913 to 1926, we can use an indirect source of evidence to document trends in
top wage shares. Corporation tax returns require each corporation to report
separately the sum of salaries paid to its officers. This statistic, compensation of
officers, is reported quasi-annually by the IRS starting in 1917. We report in
Figure X the total compensation of officers reported on corporate tax returns
divided by the total wage bill in the economy from 1917 to 1960 along with the
shares of the P99.5-100 and P99-99.9 wage groups which are close in level to
the share of officer compensation. From 1927 to 1960, officer compensation
share and these fractiles shares track each other relatively closely. Therefore,
the share of officer compensation from 1917 to 1927 should be a good proxy as
well for these top wage shares. This indirect evidence suggests that the top
share of wages was also roughly constant, or even slightly increasing from 1917
to 1926.
Previous studies have suggested that wage inequality has been gradually
decreasing during the first half of the twentieth century (and in particular during
the inter-war period) using series of wage ratios between skilled and unskilled
occupations (see e.g., Keat [1960], Williamson and Lindert [1980]). However, it is
important to recognize that a decrease in the ratio of skilled over unskilled wages
does not necessarily imply an overall compression of wage income inequality, let
alone a reduction in the top wage shares. Given the continuous rise in the
numerical importance of white collar jobs, it is natural to expect that the ratios of
19
high-skill wages to low-skill wages would decline over time, even if wage
inequality measured in terms of shares of top fractiles of the complete wage
distribution does not change.33 Goldin and Katz [1999] have recently presented
new series of white-collar to blue-collar earnings ratios from the beginning of the
twentieth century to 1960, and they find that the decrease in pay ratio is
concentrated only in the short periods of the two World Wars. Whether or not the
compression of wages that occurred during World War I was fully reversed
during the 1920s in the United States is still an open question.34
B. Sharp drop in inequality during World War II with no recovery
In all of our wage shares series, there is a sharp drop during World War II from
1941 to 1945.35 The higher the fractile, the greater is the decrease. The share of
P90-95 declines by 16 percent between 1940 and 1945, but the share of the top
1 percent declines by more than 30 percent, and the top 0.1 percent by almost
35 percent during the same period (Table B2). This sharp compression of high
wages can fairly easily be explained by the wage controls of the war economy.
The National War Labor Board, established in January 1942 and dissolved in
1945, was responsible for approving all wage changes and made any wage
increase illegal without its approval. Exceptions to controls were more frequently
granted to employees receiving low wages.36 Lewellen [1968] has studied the
evolution of executive compensation from 1940 to 1963 and his results show
33 For instance, Piketty [2001] reports a long-run compression (both from 1900 to 1950 and from 1950 to 1998) of the ratio of the average wage of managers over the average wage of production workers in France, even though wage inequality (measured both in terms of top fractiles wage shares and in terms of P90/P10-type ratios) was constant in the long run. 34 Tax return data available for France make it possible to compute wage inequality series starting in 1913 (as opposed to 1927 in the United States). By using these data, Piketty [2001, 2003] found that wage inequality in France (measured both in terms of top wage shares and in terms of P90/P10 ratios) declined during World War I but fully recovered during the 1920s, so that overall wage inequality in 1930 or 1940 was the same as in 1913. Another advantage of the French wage data is that it always based upon individual wages (as opposed to total tax unit wages in the United States). 35 Note that for fractiles below the top percentile, the drop starts from 1940 to 1941. 36 See Goldin and Margo [1992] for a more detailed description.
20
strikingly that executive salaries were frozen in nominal terms from 1941 to 1945
consistent with the sharp drop in top wage shares that we find.
The surprising fact, however, is that top wage shares did not recover after
the war. A partial and short-lived recovery can be seen for all groups, except the
very top. But the shares never recover more than one third of the loss incurred
during World War II. Moreover, after a short period of stability in the late 1940s, a
second phase of compression takes place in the top percentile. This
compression phase is longer and most pronounced the higher the fractile. While
the fractiles P90-95 and P95-99 hardly suffer from a second compression phase
and start recovering just after the war, the top groups shares experience a
substantial loss from 1950 to the mid-1960s. The top 0.1 percent share for
example declines from 1.6 percent in 1950 to 1.1 percent in 1964 (Table B2).
The overall drop in top wage shares, although important, is significantly
lower than the overall drop in top income shares. The top 1 percent income share
dropped from about 18-19 percent before World War I and in the late 1920s to
about 8 percent in the late 1950s (Figure II), while the top 1 percent wage share
dropped from about 8.5 percent in the 1920s to about 5 percent in the late 1950s
(Figure IX). This confirms that capital income played a key role in the decline of
top income shares during the first half of the century.
C. The increase in top shares since the 1970s
Many studies have documented the increase in inequality in the United
States since the 1970s (see e.g., Katz and Murphy [1992]). Our evidence on top
shares is consistent with this evidence. After the World War II compression, the
fractiles P90-95 and P95-99 recovered slowly and continuously from the 1950s to
the 1990s, and reached the pre-World War II level in the beginning of the 1980s.
As described above, the recovery process for groups within the top percentile did
not begin until the 1970s and was much faster. In accordance with results
obtained from the March Current Population Surveys [Katz and Murphy, 1992,
Katz and Autor, 1999], we find that wage inequality, measured by top fractile
wage shares, starts to increase in the early 1970s. This is in contrast with results
21
from the May Current Population Surveys [DiNardo et al. 1996] suggesting that
the surge in wage inequality is limited to the 1980s.
From 1970 to 1984, the top 1 percent share increased steadily from 5
percent to 7.5 percent (Figure IX). From 1986 to 1988, the top shares of wage
earners increased sharply, especially at the very top (for example, the top 1
percent share jumps from 7.5 percent to 9.5 percent). This sharp increase was
documented by Feenberg and Poterba [1993] and is certainly attributable at least
in part to fiscal manipulation following the large top marginal tax rate cuts of the
Tax Reform Act of 1986 (see the discussion in Section III above). However, from
1988 to 1994, top wage shares stay on average constant,37 but increase very
sharply from 1994 to 2000 (the top 1 percent wage share increases from 8.7
percent to 12.6 percent). While everybody acknowledges that tax reforms can
have large short-term effects on reported incomes due to retiming, there is a
controversial debate on whether changing tax rates can have permanent effects
on the level of reported incomes. Looking at long-time series up to 2001 casts
doubts on the supply-side interpretation that tax cuts can have lasting effects on
reported wages.
Part of the recent increase in top wages is due to the development of
stock-options that are reported as wages and salaries on tax returns when they
are exercised. Stock-options are compensation for labor services but the fact that
they are exercised in a lumpy way may introduce some upward bias in our
annual shares at the very top (top 0.1 percent and above). To cast additional light
on this issue and on the timing of the top wage surge, we look at CEO
compensation from 1970 to 2003 using the annual surveys published by Forbes
magazine since 1971. These data provide the levels and composition of
compensation for CEOs in the 800 largest publicly traded US corporations.
Figure XI displays the average real compensation level (including stock-option
exercised) for the top 100 CEOs from the Forbes list, along with the
compensation of the CEO ranked 100 in the list, and the salary plus bonus level
37 One can note the surge in high wages in 1992 and the dip in 1993 and 1994 due to retiming of labor compensation in order to escape the higher rates enacted in 1993 (see Goolsbee [2000]).
22
of the CEO ranked 10 (in terms of the size of salary plus bonus). As a
comparison, we also report the average wage of a full-time worker in the
economy from National Income Accounts. Consistent with the evolution of top
wage shares, average CEO compensation has increased much faster than
average wage since the early 1970s. Therefore, the increase in pay gap between
top executives and the average worker cannot be attributed solely to the tax
episodes of the 1980s.
Thus, by the end of the century, top wage shares are much higher than in
the inter-war period. These results confirm that the rise in top income shares and
the dramatic shift of income composition at the top documented in Section IV are
mainly driven by the surge in top wages during the last three decades.
D. Proposed interpretation
The pattern of top shares over the century is striking: most of the decline
from 1927 to 1960 took place during the four years of World War II. The extent of
that decline is large, especially for very high wages. More surprisingly, there is no
recovery after the war. We are of course not the first ones to document
compression in wages during the 1940s. The Social Security Administration [U.S.
Bureau of Old-Age, 1952] showed that a Lorenz curve of wages for 1949
displays much more equality than one for 1938. In a widely cited paper, Goldin
and Margo [1992], using Census micro data for 1940 and 1950, have also noted
that the ratios P90/P10 and P50/P10 declined sharply during that decade. Our
annual series allow us to conclude that most of the decline in top wage shares
took place during the key years of the war with no previous decline in inequality
before and no recovery afterwards.
The compression of wages during the war can be explained by the wage
controls of the war economy, but how can we explain the fact that high wage
earners did not recover after the wage controls were removed? This evidence
cannot be immediately reconciled with explanations of the reduction of inequality
based solely on technical change as in the famous Kuznets’ process. We think
that this pattern of evolution of inequality is additional indirect evidence that non-
23
market mechanisms such as labor market institutions and social norms regarding
inequality may play a role in the setting of compensation at the top. The Great
Depression and World War II have without doubt had a profound effect on labor
market institutions and more generally on social norms regarding inequality.
During this period, the income tax acquired its modern form, and its top marginal
tax rates were set very high, in excess of 80 percent. It is conceivable that such
large income tax rates discouraged corporations from increasing top salaries.
During that period, large redistributive programs such as Social Security, and Aid
for Families with Dependent Children were initiated. These strongly redistributive
policy reforms show that American society’s views on income inequality and
redistribution greatly shifted from 1930 to 1945. It is also important to note that
unionization increased substantially from 1929 to 1950 and that unions have
been traditionally in favor of wage compression. In that context, it is perhaps not
surprising that the high wages earners who were the most severely hit by the war
wage controls were simply not able, because of social, fiscal, and union
pressure, to increase their salaries back to the pre-war levels in relative terms.38
Similarly, the huge increase in top wage shares since the 1970s cannot be
the sole consequence of technical change. First, the increase is very large, and
concentrated among the highest income earners. The fractiles P90-95 and P95-
99 experienced a much smaller increase than the very top shares since the
1970s. Second, such a large change in top wage shares has not taken place in
most European countries and Japan which experienced the same technical
change as the United States. For example, Piketty [2001, 2003] documents no
change in top wage shares in the last decades in France. DiNardo et al. [1996]
argue that changes in institutions such as the minimum wage and unionization
account for a large part of the increase in U.S. wage inequality from 1973 to
1992. As emphasized by Acemoglu et al. [2001], it is possible that these changes
38 Emphasizing the role of social norms and unionization is of course not new and has been pointed out as important elements explaining the wage compression of the 1940s and 1950s by several studies [Brownlee 1977, Goldin and Margo 1992, and Goldin and Katz 1999]. Moreover, as emphasized by Goldin and Margo [1992] and Goldin and Katz [1999], it is possible that the large increase in the supply of college graduates contributed to make the drop in top wage shares persistent.
24
in institutions have been triggered by previous technological changes making it
impossible to sustain previous labor market arrangements.39 It seems unlikely,
however, that changes in unionization or the minimum wage can explain the
surge in very top wages. The marginal product of top executives in large
corporations is notoriously difficult to estimate, and executive pay is probably
determined to a significant extent by herd behavior. Changing social norms
regarding inequality and the acceptability of very high wages might partly explain
the rise in U.S. top wage shares observed since the 1970s.40
V. CONCLUSION This paper has presented new homogeneous series on top shares of
income and wages from 1913 to 2002. Perhaps surprisingly, nobody had tried to
extend the pioneering work of Kuznets [1953] to more recent years. Moreover,
important wage income statistics from tax returns had never been exploited
before. The large shocks that capital owners experienced during the Great
Depression and World War II seem to have had a permanent effect: top capital
incomes are still lower in the late 1990s than before World War I. We have
tentatively suggested that steep progressive taxation, by reducing the rate of
wealth accumulation, has prevented the large fortunes to recover fully yet from
these shocks. The evidence for wage series shows that top wage shares were
flat before World War II and dropped precipitously during the war. Top wage
shares have started recovering from this shock only since the 1970s but are now
higher than before World War II.
To what extent is the U.S. experience representative of other developed
countries’ long run inequality dynamics? Existing inequality series are
unfortunately very scarce and incomplete for most countries,41 and it is therefore
very difficult to provide a fully satisfactory answer to this question. However, it is
39 See also Acemoglu [2002]. 40 It is quite telling to read in the recent survey of Hall and Murphy (2004), two prominent and conservative researchers in this field, that their best explanation for the surge in stock-option compensation was that “boards and managers falsely perceive stock options to be inexpensive because of accounting and cash-flow considerations”. 41 See Lindert [2000] and Morrisson [2000] for recent surveys.
25
interesting to compare the U.S. top income share series with comparable series
recently constructed for France by Piketty [2001a, 2001b], and for the United
Kingdom by Atkinson [2001]. There are important similarities between the
American, French, and British pattern of the top 0.1 percent income share
displayed on Figure XII.42 In all three countries, top income shares fell
considerably during the 1914 to 1945 period, and they were never able to come
back to the very high levels observed at the eve of World War I. It is plausible to
think that in all three countries, top capital incomes have been hit by the
depression and wars shocks of the first part of the century and could not recover
because of the dynamic effects of progressive taxation on capital. Piketty [2001a]
also shows that in France, there was no spontaneous decline of top wage shares
before World War II. In France, top wage shares declined during World War I, but
they quickly recovered during the 1920s and were stable until World War II.
Some important differences need however to be emphasized. First, the
shock of World War II was more pronounced in France and in the United
Kingdom than in the United States. This is consistent with the fact that capital
owners suffered from physical capital losses during the war in Europe, while
there was no destruction on U.S. soil.43 Second, the World War II wage
compression was very short-lived in France, while it had long lasting effects in
the United States. In France, wage inequality, measured both in terms of top
wage shares and in terms of inter-decile ratios appears to have been extremely
stable over the course of the twentieth century. The U.S. history of wage
inequality looks very different: the war compression had long-lasting effects, and
then wage inequality increased considerably since the 1970s, which explains the
U.S. upturn of top income shares since the 1970s.44 The fact that France and the
United States display such diverging trends is consistent with our interpretation
that technical change alone cannot account for the U.S. increase in inequality.
42 Due to very high exemption thresholds in the United Kingdom prior to World War II, Atkinson was not able to compute top decile or even top percentile series covering the entire century (only the top 0.1% and higher fractiles series are available for the entire century for all three countries). 43 Estate tax data also show that the fall in top estates was substantially larger in France (see Piketty [2001a, 2001b]).
26
These diverging trends in top wages over the past 30 years explain why
the income composition patterns of top incomes look so different in France and in
the United States at the end of the century. In France, top incomes are still
composed primarily of dividend income, although wealth concentration is much
lower than what it was one century ago. In the United States, due to the very
large rise of top wages since the 1970s, the coupon-clipping rentiers have been
overtaken by the working rich. Such a pattern might not last for very long
because our proposed interpretation also suggests that the decline of
progressive taxation observed since the early 1980s in the United could very well
spur a revival of high wealth concentration and top capital incomes during the
next few decades.
44 The United Kingdom also experienced an increase in top shares in the last two decades but much more modest than in the United States.
27
APPENDIX Appendix A: Income Inequality Series
This appendix describes the series of shares of top income fractiles that we have constructed using tax return data. The U.S. income tax started in 1913 and 2002 is the most recent year for which data is available. Starting in 1916, the Internal Revenue Service (IRS) has published detailed statistical tables on tax returns in Statistics of Income: Individual Income Tax Returns (the tables for 1913-1915 were published in the Annual Reports of the Commissioner of Internal Revenue). These annual 1913-2002 tables provide information on the number of tax returns, and the amounts reported for each source of income, for a large number of income brackets.45 Starting in 1960, the IRS has constructed large micro-files of tax returns oversampling high incomes. These micro-files were constructed annually since 1966,46 and they are publicly available until 1999. These annual 1966-1999 micro-files allow us to check that our methods using published tables provide accurate results.
A1. Computing total number of tax units and total income
The total number of tax units in the U.S. population (had everybody been
required to file a tax return), displayed in col. (1) of table A0, has been computed using census data on the marital structure of the population: it is defined as the sum of the total number of married men; the total number of widowed and divorced men and women; and the total number of single men and women aged 20 or over.47 Income fractiles are defined with respect to this total number of tax units. For instance, in 2002, with a total number of tax units equal to 139.703 million, there are 13.9703 million tax units in the top decile, 1.39703 million tax units in the top percentile, etc. Our theoretical definition of tax units implicitly assumes that married women never file separate returns (in practice, the number of married women filing separate returns is positive but fairly small (about 1% of all returns in 1998)). Before 1948, however, married couples with two earners
45 For 1913-1915, the tables only provide information on the number of tax returns for a large number of income brackets. 46 No micro-file is available for 1961, 1963 and 1965, and the micro-files for 1960, 1962 and 1964 do not include as many tax return variables as the files for the following years (this applies in particular to the 1960 file). Therefore we have mostly relied on published tables for the 1960-1965 period (the 1960, 1962 and 1964 have been used for consistency checks only). 47 The marital structure data for pre-1970 censuses was taken from Historical Statistics of the U.S. – Colonial Times to 1970 (1975); the marital structure data for 1980, 1990, 2000, estimated from Census data is reported in Statistical Abstract of the U.S. Intercensal years were interpolated by assuming that the average size of tax units follows linear intercensal trends. We checked the accuracy of our procedure by computing the total number of individuals represented on tax returns and by dividing this number by total U.S. population, and we found virtually the same pattern for this ratio as for the (total number of tax returns)/(total number of tax units) ratio.
28
had interest in filing separately because there was a single schedule that applied to all tax units (married filing jointly, married filing separately, or singles). As a result, the number of returns for married women filing separately was higher (around 5-6%). We did correct for this in our income series so as to make sure that there is no discontinuity between 1947 to 1948.48
Table A0 also indicates the total number of tax returns actually filed (col. (2)), as well as the fraction of tax units filing a tax return (col. (3)). Since 1944, the vast majority of tax units have been filing tax returns, and the fraction of tax units actually filing has generally been around 90-95%. But before WWII, due to large exemption levels, this fraction was usually around 10-15%. The top decile is therefore the biggest fraction for which we can construct homogeneous estimates for the entire period, and this is why we limit our analysis to the top decile of the income distribution. In the early years of the income tax, from 1913 to 1916, the exemptions were even higher and we have to restrict the estimates to the top percentile.
Total income for the entire population has been computed by using national accounts. We call tax return gross income the gross income definition reported on tax returns less capital gains realizations. Tax return gross income is defined as Adjusted Gross Income (AGI) plus adjustments less capital gains included in AGI. During the post-WWII period, the ratio between total tax return gross income reported on tax returns and total personal income estimated in national accounts has been trending downward (from about 75-80% in the late 1940s to about 65-70% in the 1990s). This trend is due for the most part to the growth of non-taxable government transfers (non-taxable health care benefits, non-taxable and partially non-taxable social security benefits, etc.) because the ratio between total tax return gross income reported on tax returns and total personal income minus transfers estimated in national accounts has been fairly stable since the late 1940s (around 75-80%).49 The total income series (excluding capital gains) reported on table A0 (col. (4)) was constructed as follows. For the 1944-2002 period, we have adjusted upwards the total tax return gross income series so as to take into account the fact that a small fraction of tax units did not file tax returns. We have imputed to non-filers a fixed fraction of filers’ average income (50% in 1944-1945, and 20% thereafter). The resulting series fluctuates between 77% and 83% of total personal income (minus transfers), and is about 2-3% higher than total tax return gross income.50 51 For
48 The magnitude of the correction was computed by using IRS tables by filling status. In effect, our 1913-1947 top income levels and top shares series were adjusted upwards by about 2.5% in order to correct for this “married women” bias. We made a similar correction for our wage series. 49 In addition to non-taxable government transfers, non-taxable personal income includes imputed rent; interest and dividends received by pension plans, life insurance carriers and non-profit institutions; non-taxable employer and employee contributions to pension plans, health insurance, day care, etc.; capital and inventory adjustments (NIPA capital consumption is generally smaller than IRS capital consumption, so that NIPA entrepreneurial income is generally larger than IRS entrepreneurial income); etc. See Park (2000) for a detailed description of the differences between NIPA personal income and individual tax return income. 50 Except in 1944-1945, where it is about 11-13% higher (because of the lower fraction of tax units actually filing).
29
the 1913-1943 period, our total income series (excluding capital gains) is equal to exactly 80% of total personal income (minus transfers).52
Average income per tax unit (table A0, col. (5)) was computed by dividing our total income series (table A0, col. (4)) by the total number of tax units (table A0, col. (1)). We have also computed a total income series (including capital gains) (table A0, col.(6)) by adding to col. (4) the total, pre-exclusion amount of all capital gains reported on tax returns by the top 10% taxpayers.53 The corresponding average income series is reported on col. (7). Note that all money amounts in current dollars were converted in 2000 dollars by using the CPI series reported on col. (8) of table A0 (this series was used to convert all current dollars series computed in this paper into 2000 dollars series, so that interested readers can easily compute current dollars series).54 Insert Table A0
We have made no adjustment for changes in the size of tax units. This is unlikely to affect our results in a significant way. The average size of tax units was much larger in the 1910s (nearly 2.6) than in the 1990s (less than 2.1),55 but published IRS tables and IRS micro-files show that this secular decline had approximately the same magnitude for all income brackets. Note that Kuznets (1953) did attempt to make adjustments for tax unit size: Kuznets’ 1913-1948 top income shares series are based on individuals and not tax units. As the published IRS tables are based on tax units and not individuals, Kuznets divided the total income reported in each income bracket by the total number of 51 We chose not to take a fixed fraction of 1944-2002 personal income (minus transfers) for the following reason: although our resulting series is about 80% of personal income (minus transfers) all along the 1944-2002 period (with no trend), there exists a number of short-run fluctuations that cannot be fully accounted for by changes in the fraction of tax units actually filing (for instance, tax return gross income grows less than personal income in the mid-1980s, and catches up in the late 1980s). 52Official NIPA personal income series start in 1929 (we have used the latest NIPA series released on www.bea.doc.gov), and we have completed the NIPA series by linking it to the 1913-1929 personal income series published by Kuznets (1941, 1945). Note that the total income series used by Kuznets (1953) to compute top income shares over the 1913-1948 period is higher than ours: his only adjustment to personal income is imputed rent (see Kuznets (1953, pp. 570-577)), which seems insufficient to us. For instance, in 1948, Kuznets’ total income denominator is equal to 202 billions current dollars, although total 1948 tax return gross income is equal to 161 billions current dollars (about 80% of 202 billions), which seems implausible: this would imply that non-filers have higher average incomes than filers. 53We use capital gains reported by the top 10% because only about 10% of tax units file income tax returns in the pre-WWII period and we do not have information on capital gains of non filers. Capital gains are extremely concentrated, even today. For example, in 2000, the top 10% taxpayers reported almost 90% of all capital gains. Note also that we have no capital gains estimates for 1913-1915. 54 This CPI series was constructed by linking the 1913-1970 CPI series (all items) published in Historical Statistics of the U.S. – Colonial Times to 1970 (1976) and the 1970-2002 CPI series (all items) published in the Economic Report of the President (2004). 55 Average tax unit size declined between the 1910s and the 1940s (from 2.6 to 2.3), increased between the 1940s and the 1960s (from 2.3 to 2.6), and declined between the 1960s and the 1990s (from 2.6 to 2.1).
30
individuals represented by all tax returns in that bracket. This process would generate substantial re-ranking, as a tax return of a widow with no dependents reporting $10,000 would be replaced by an individual with $10,000 of income while a family of four with $10,000 of income would be replaced by four identical individuals with $2,500 of income each. However, Kuznets did not correct for the re-ranking and thus misclassified in the top shares large families with high total income but moderate income per capita. As a result, the shares estimated by Kuznets are lower than ours in levels.56 Note however that the pattern over years is reassuringly almost identical.57
Finally, it is important to keep in mind that tax units are smaller than households. In 1998, there were approximately 1.3 tax units per household (on average), i.e. 131 millions tax units vs. 101 millions households.58 This means that incomes per household are in 1998 about 30% larger than incomes per tax units (on average). For instance, average income per tax unit was less than $39,000 in 1998 (see table A0, col.(5)), while average household income was about $51,000.59 Note however that this is unlikely to affect top shares in a significant way (assuming that the average number of households per tax units is approximately the same for all income brackets). A2. Computing top fractiles income shares
We have constructed 3 sets of top income shares series that treat
differently realized capital gains. In variant 1 (Table A1), we exclude completely capital gains: tax returns
are ranked by income excluding capital gains, and top fractiles incomes exclude capital gains. Income shares were computed by using the total income (excluding capital gains series) series (table A0, col. (4) and (5)).
In variant 2 (Table A2), tax returns are ranked by income excluding capital gains, but we add back the average capital gains accruing to each fractile when we compute top fractiles incomes. Income shares were computed by using the total income (including capital gains series) series (table A0, col. (6) and (7)).
56This is amplified by the fact that Kuznets’ total income denominator is slightly higher than ours (see above), and by the way Kuznets treated capital gains (see below). 57 Our methodology also differs from that used by Feenberg and Poterba (1993, 2000) to compute their 1951-1995 top income shares series: Feenberg and Poterba choose as base year 1989, and then compute the number of tax returns who are in the top 0.5% of the tax return distribution for that year, and use the U.S. adult population series to compute the number of “top income recipients” tax returns for other years. This methodology is innocuous in the short run, but can produce important biases in the long run because the average tax unit size declines over time, and this is also true if one looks at the average number of adults per tax unit. Note also that Feenberg and Poterba simply use total AGI as their total income denominator. 58 The average number of tax units per household declined from about 1.7 in the 1910s to about 1.2-1.3 in the early 1980s, and increased somewhat since then. 59 Average household income was about $52,000 in 1998 according to the Current Population Survey (CPS) (cf. “Money Income in the United States 1999”, Current Population Report P60-209 (September 2000)). Note that total CPS income is virtually identical to our total income denominator (CPS income does include a number of cash transfers that are excluded by our tax income concept, but CPS income probably suffers from under-reporting at the top).
31
Finally, in variant 3 (Table A3), we include capital gains both when we rank tax returns and when we compute top fractiles incomes. Income shares were computed by using the total income (including capital gains series) series (table A0, col. (6) and (7)).
The concept of capital gains used to compute top fractiles incomes in variants 2 and 3 and to rank tax returns in variant 3 is always “full capital gains”, i.e. total pre-exclusion capital gains (see below).
Whether one should use variants 1, 2 or 3 is a matter of perspective. In the text of this paper, we have focused on variant 1 series, so as to get rid of the very strong short-term volatility induced by capital gains. If one wants to include capital gains, then variant 2 series are probably the most meaningful series from an economic viewpoint: capital gains are typically very lumpy (they are realized once every few years), so that ranking tax returns by income including capital gains leads to artificially overestimate very top income levels. Note that variant 1 top income shares are always below variant 2 top income shares, and that variant 2 top income shares are always below variant 3 top income (see Figure A2).
Insert Tables A1, A2, A3, A4, A5 and A6
The top fractiles incomes series reported on tables A4, A5 and A6 were
constructed as follows. For the 1966-1999 period, the series were computed directly from the IRS micro-files. The micro-files easily allow us to rank tax returns by income excluding capital gains (variants 1 and 2) or by income including full capital gains (variant 3) and to compute top fractiles incomes without capital gains (variant 1) or with full capital gains (variants 2 and 3). For the 1913-1965 and 2000-2002 periods, the series were estimated from the published IRS tables, according to the following methodology (all computations are available from the authors upon request):
(i) Published IRS tables rank tax returns by net income (1913-1943) or by
AGI (1944-2002). These tables use a large number of income brackets (the thresholds P90, P95, P99, P99.5, P99.9 and P99.99 are usually very close to one of the income bracket thresholds), and one can use standard Pareto interpolation techniques in order to estimate the top fractiles income thresholds and income levels of the tax unit distribution of net income (1913-1943) and AGI (1944-1965 and 2000-2002).60 We also did the same computations for the 1966-1995 period
60 We used the same Pareto interpolation technique as Piketty (2001a, 2001b). That is, in order to estimate a given fractile threshold (P90, P95,..,P99.99), we choose the income bracket threshold s such that the fraction p of tax units with income above s is as close as possible to the given fractile; we note b the ratio between the average income of all tax returns above s and s; we then compute a=b/(b-1) and k=s p(1/a), which allows us to compute the given threshold income by using the Pareto formula 1-F(y) = (k/y)a (where F(y) is the cumulative distribution function); top fractiles average incomes (P90-100, P95-100,…,P99.99-100) are then obtained by multiplying the corresponding fractile threshold by b (in practice, the result barely depends on the interpolation threshold s, as long as s is not too far from the given fractile); intermediate fractiles average
32
in order to compare the series estimated from Pareto interpolation with the series computed from micro-files, and we found that both series never differ by more than 1% (the gap is usually less than 0.1%).61
(ii) For a number of years before WWII, the filing threshold is so high that
less than 10% of tax units actually file returns (see table A0, col. (3)). However, the filing thresholds for singles is substantially lower than the filing threshold for married households. Thus from 1917 on, it is always the case than more than 10% of single tax units are actually filing returns, although for some years less than 10% of married tax units are filing returns. As a result, the number of married tax units in the bottom brackets is too low for some years and needs to be adjusted upward. This problem of missing returns is especially acute for years 1925 to 1931. We adjusted for missing married returns using a simple extrapolation method, based on the assumption that marital ratios (i.e. ratios of married tax units to single men not head of households tax units) across income brackets is constant over years.62 We have done some sensitivity analysis using both years 1924 and 1932 as the base year. The alternative multipliers we obtain with year 1924 instead of year 1932 are close and the final series estimates of shares and income levels for the bottom fractile P90-95 are almost identical. Our final estimates are obtained using a moving average of the multipliers based on years 1924, and 1932.63
incomes (P90-95, P95-99, etc.) are obtained by difference. This interpolation technique is slightly different from the one used by Feenberg and Poterba (1993) and delivers more precise results (Feenberg and Poterba only use the slope between two consecutives thresholds s, and do not use the information embodied in the b coefficients). 61 Atkinson (2001) recently pointed out that estimation errors induced by Pareto interpolation techniques are sometimes non-negligible. But this is the case only when the raw data does not include sufficiently many income brackets. The only non-negligible (more than 1%) estimation error that we noticed over the 1966-1995 period is related to fractile P99.99-100 during the 1990s: the top income bracket used in the IRS tables of the 1990s is not high enough (1 million dollars and more, i.e. more than 0.1% of all tax units in the late 1990s), and this interpolation threshold yields estimates of P99.99-100 that are overestimated by about 5% (in 1995). However, since 2000 (which is exactly the period for which micro-data are not yet available), the IRS has extended the top bracket to 10 million dollars and more. This top IRS bracket corresponds almost exactly to our top 0.01% group. 62 More precisely, we assume that the ratio of marital ratios over two adjacent brackets is constant from year to year. We can successfully test this assumption comparing these ratios for years with low filing thresholds and where missing returns is not an issue. Thus we use the closest years for which the filing threshold is low enough so that all the married tax units with income in that particular income bracket file a return to compute these marital ratios. We then extrapolate the marital ratio for a year with high filing threshold in a low bracket using the bracket just above for that year and the marital ratios for the year with complete returns. We compute then the expected number of married tax units in each bracket in high filing threshold years. We obtain thus the missing number of returns in each bracket or equivalently a multiplier factor by which we must adjust the actual number of returns to obtain the real number of tax units. We use the same multiplier factors to adjust the dollar amounts reported in each bracket. 63 For example, for year 1925, our multiplier is (6/7)*multiplier 1924 + (1/7)*multiplier 1932, etc.
33
(iii) The 1913-1965 and 2000-2002 raw series obtained from Pareto interpolation were corrected in various ways. First, the raw series were adjusted upwards in order to include net income deductions (1913-1943) and AGI adjustments (1944-1965 and 2000-2002) (AGI adjustments were also included in the 1966-1999 micro-files computations). In practice, AGI adjustments (IRA contributions, moving expenses adjustment, self-employment tax, etc.) are pretty small (about 1% of AGI, up to 4% in the mid-1980s), and their importance declines with income within the top decile. Net income deductions for the period 1913-1943 (charitable gifts, interest paid, local taxes, etc.) are higher (about 10% of net income), and their importance increases with income within the top decile (up to 15-20% for fractile P99.99-100). We adjust our raw series for threshold levels and average income in each fractile using multiplicative factors so that our new series correspond to the level of gross income (before adjustment or deductions) reported in the published tables for each fractile.64
(iv) Next, and most importantly, corrections need to be made to the 1913-
1965 and 2000-2002 raw series in order to ensure that capital gains are properly taken into account. The tax treatment of capital gains has changed many times since 1913: from 1913 to 1933, 100% of capital gains were included in net income (there was no capital gains exclusion); from 1934 to 1937, 70% of capital gains were included in net income (i.e. 30% of capital gains were excluded); from 1938 to 1941, 60% of capital gains were included in net income (i.e. 40% of capital gains were excluded); from 1942 to 1978, 50% of capital gains were included in net income (1942-1943) or in AGI (1944-1978) (i.e. 50% of capital gains were excluded); from 1979 to 1986, 40% of capital gains were included in AGI (i.e. 60% of capital gains were excluded); from 1987 on, 100% of capital gains were included in AGI (there was again no capital gains exclusion).65 In order to compute “variant 1” series from the raw series, one could simply deduct for each fractile the share of capital gains estimated from IRS composition tables. This is the method Kuznets (1953) adopted in order to compute
64 In principle, going from net income (or AGI) to gross income might induce reranking. However, using the micro-files for 1966-1999, we have checked that this reranking has small effects on our final results and thus we do not attempt any correction for that reranking effect. 65 These exclusion rates actually applied to long term capital gains only, and the definition of “long term” capital gains (6 months, 12 months or 18 months) has changed many times (from 1934 to 1941, there were several exclusion rates, and the 30% and 40% figures that we use for our estimation are the approximate average exclusion rates over all capital gains). We did use all the relevant information given in IRS tables and in the micro-files in order to compute the exact exclusion rates for each fractile. In practice however, the vast majority of capital gains always falls under the most favorable tax regime, so that the exclusion rates given above apply to most capital gains.
34
his 1913-1948 series.66 The problem is that IRS tables rank tax returns by net income or AGI (including the post-exclusion amount of capital gains), and that re-ranking can be substantial at the very top: in the extreme case where very top incomes of the net income or AGI distribution are only made of capital gains, then the deduction of capital gains would lead to the conclusion that the very top incomes of the distribution of income (excluding capital gains) are equal to 0. Kuznets did not try to correct for re-ranking, which means that his estimates of top income shares are biased downward.67 The micro-files allowed us to compute the magnitude of the corrections that one needs to apply in order to obtain unbiased “variant 1” series: the corrections are negligible for fractiles P90-95 and P95-99, but the income levels of fractiles P99-99.5 and P99.5-99.9 need to be increased by about 1%, the income level of fractiles P99.9-99.99 needs to be increased by about 2%. Most importantly, the top fractile P99.99-100 requires a more complicated correction method. We increase the income level of fractile P99.99-100 by about 40% of the capital gains share computed for that fractile.68 These corrections coefficients were obtained from comparing micro-file unbiased estimates from the period 1966-1999 to estimates obtained from published tables. For the period 1966-1999, the correction coefficients are extremely stable (in spite of the huge variations in capital gains share), and it seems reasonable to use them for the 1913-1965 and 2000-2002 periods. Finally, one can compute “variant 2” series from these unbiased “variant 1” series using our capital gains shares series by fractiles of income excluding capital gains (see section A3 and table A8 below; these capital gains series also illustrate the importance of re-ranking at the very top).
(v) The construction of “variant 3” series from raw series raises similar
issues. For the 1913-1933 and 2000-2002 period (when there was no capital gain exclusion), there is no re-ranking issue. But for the 1934-1965, one cannot simply add to the raw series the excluded amount of capital gains for each fractile: this addition alters the ranking of tax returns, and ignoring this re-ranking issue would lead to “variant 3” series that are downwardly biased. The micro-files allowed us to compute the magnitude of the corrections that one needs to apply in order to obtain unbiased “variant 3” series: the corrections are negligible for fractile P90-95, but the income levels of fractiles P95-99 and P99-99.5, need to be increased by about 1%, the income level of fractiles P99.5-99.9 and P99.9-99.99 need to be increased by about
66 Kuznets decided to exclude completely capital gains from his series, and he started by deducting capital gains from net income and AGI for each income bracket before applying Pareto interpolation techniques (Kuznets did not try to compute series including capital gains). 67 See above for other problems explaining why Kuznets’ estimates are biased downward. 68 For instance, in 1995, when the capital gains share is 38.4% for fractile P99.99-100 (see section A3 and table A8 below), the correction coefficient is about 15,4% (0.4x38.4=15.4).
35
2%, and the income level of fractile P99.99-100 need to be increased by about 4% (irrespective of the capital gains share). These corrections coefficients were again obtained from the analysis of micro-files over the period 1966-1999. This analysis showed that applying the simple correction rule described above gave excellent results for all years 1966-1999, and it seems reasonable to use the same rule for the 1913-1965 and 2000-2002 periods. Note that the corrections required are smaller than the corrections coefficients associated to “variant 1” series (especially at the very top): that is, re-ranking is more important when one goes from ranking by income including post-exclusion capital gains to ranking by income excluding completely capital gains than when one goes from ranking by income including the taxable fraction of capital gains to ranking by income including full capital gains.
A3. Computing top fractiles income composition
We have also constructed top fractiles income composition series (Table A7 and Table A8). The composition series reported on table A7 indicate for each income fractile the fraction of total income (excluding capital gains) that comes from the various types of income (excluding capital gains). We consider 5 types of income: wage income; entrepreneurial income; dividends; interest; and rents. Wage income includes wages and salaries as well as pensions and annuities.69 Entrepreneurial income includes business, farm, partnerships and small corporations (S corporations) income. Dividends include general dividends and dividends received through partnerships and fiduciaries.70 Interest includes taxable interest only.71 Rents include rents, royalties and fiduciary income. We have excluded from these composition series a number of small income categories such as alimony, taxable social security benefits, taxable unemployment insurance benefits, “other income”, etc. Taken all together, these small categories never make more 2% of the total income of the top decile (they usually make less than 1%), and even less at the level of the top percentile, and excluding them simplifies the reading of our composition series (these small income categories were taken into account when computing top income levels
69 The share of pensions and annuities in total AGI has increased continuously from less than 1% in the 1960s to more than 6% in the late 1990s, but it has always been less than for 4% for the top decile and less than 2% for the top percentile. 70 From 1936 to 1953, dividends from tax statistics do not include dividends distributed to partnerships and fiduciaries. This discontinuity was relatively easy to correct: dividends distributed to partnerships and fiduciaries display a very stable pattern (in particular, the 1936 downward jump in the pattern of dividend share by income fractile is virtually the same as the 1954 upward jump), and we simply added them back to the dividends total. Similarly, dividends and interest are lumped together by tax statistics in 1944-1945, but this was easy to correct for because the pattern of interest share by income fractile was very stable at that time. 71 Data on tax-exempt interest is scarce and incomplete, and we did not attempt to take tax-exempt interest into account.
36
and top income shares in total income).72 For the 1966-1999 period, the composition series were computed directly from the IRS micro-files. For the 1916-1965 period,73 the composition series were estimated from the published IRS tables indicating for each income bracket not only the number of taxpayers and the total amount of their taxable income but also the separate amounts for each type of income. The composition of income within each fractile was estimated from these tables using a simple linear interpolation method. Such a method is less satisfactory than the Pareto interpolation method used to estimate top income levels (no obvious law seems to fit composition patterns in a stable way), but micro-files show that the resulting estimates are still relatively precise: estimation errors are always less than 2 points, and they are usually much smaller (thanks to the fact that IRS tables are usually based on a very large number of income brackets).
The composition series reported on table A8 indicate for each income fractile the fraction of total income (including capital gains) that takes the form of capital gains. The concept of capital gains used to compute these series is again “full capital gains”, i.e. total pre-exclusion capital gains. We provide two sets of estimates on table A8: capital gains shares were computed both for fractiles of total income (excluding capital gains) (this corresponds to the “variant 1” and “variant 2” series described in section A2 above) and for fractiles of total income (including capital gains) (this corresponds to the “variant 3” series described in section A3 above). For the 1966-1999 period, both capital gains shares series were computed directly from the IRS micro-files. For the 1916-1965 and 2000-2002 period, linear extrapolation from published IRS tables yields capital gains shares series for fractiles of net income or AGI (including the post-exclusion amount of capital gains), and one needs to correct these raw estimates in order to take re-ranking into account (see section A2 above). That is, capital gains shares are smaller for fractiles of income excluding capital gains than for fractiles of income including post-exclusion capital gains, and capital gains shares are smaller for fractiles of income including post-exclusion capital gains than for fractiles of income including pre-exclusion capital gains. Micro-files allowed us to compute the magnitudes of these corrections coefficients.74 The capital gains shares series reported on table A8 demonstrate that re-ranking is substantial at the very top: in 1999, 53.8% of total income reported by the fractile P99.99-100 of the distribution of income including capital gains takes the form of capital gains, but the capital gains share falls to 21.8% when one looks at the fractile P99.99-100 of the distribution of income excluding capital gains. Finally, note that the composition series (excluding capital gains) reported on table A7 were
72 The fact that these small income categories almost do not matter for top incomes implies that changes in tax law regarding those items (e.g. changes in the definition of taxable social security benefits) have negligible consequences for our income levels and shares series. 73 We do not provide composition estimates for the 2000-2002 period because better estimates will be obtained when the IRS micro-data become publicly available for those years. We do however compute the share of capital gains for years 2000-2002 because this a necessary step to obtain variants 1 and 2 of the top income shares series presented earlier. 74 The corrections formulas for capital gains shares that we inferred from micro-files are more complex than those applied to correct income levels, and they are available upon request.
37
computed for fractiles of net income or AGI (including the post-exclusion amount of capital gains), but that the micro-files demonstrate that re-ranking has relatively small effects on non-capital gains income composition by fractile. For instance, in 1995, if one looks at the fractile P99.99-100 of the distribution of AGI (i.e. including 100% of capital gains), one can see that the wage share is 35.8%, the entrepreneurial income share is 38.8% and the dividend share is 10.2% (see table A7); with the fractile P99.99-100 of the distribution of income excluding capital gains, the wage share would be about 0.5 point higher, the entrepreneurial income share 1 point higher and the dividend share 1.5 points smaller. That is, shareholders are more likely than CEOs and entrepreneurs to have large capital gains, but the re-ranking is pretty small, and we therefore decided to compute all series reported on table A7 for fractiles of net income and AGI and to make no correction for re-ranking.
Insert Table A7 and Table A8 Appendix B: Wage Inequality Series
This appendix describes the series of shares of top fractiles salary earners that we have constructed using the tables published in Statistics of Income by size of salary since 1927.
B1. Computing total number of tax units with wages and total wages in the economy
The sum of total wages in the economy used to compute shares is obtained from National Accounts 1929-2002, wages and salaries, and does not include employers’ health insurance and employers’ social security contributions. Total wages for years before 1929 are obtained from Kuznets (1953) using a constant multiplier factor so that 1929 matches the NIPA figure. This total wage series includes both government employees and military personnel salaries. The total number of tax units with wage income in the full population is estimated as the number of part-time and full workers from National Accounts (which includes government and military employees) less the number of wives that are employees.75 Military wages and workers form a substantial part of total wages and workers from 1943 to 1945.76 However, excluding military wages and military personnel hardly changes the estimates of top shares, even during the war, because few military salaries are in the top fractiles and the average military salary is substantially smaller than average wage (see below). 75 The number of women employees is estimated as the number of women in the labor force (husband present) from the Historical Statistics of the US series D51 and D52 (before 1971) and Statistical Abstract of the U.S., No. 653 (after 1971) multiplied by the ratio of employees (from NIPA) over labor force for the full population (D29 and No. 646). The numbers of tax units with wages for years 1927 and 1928 are based on a simple extrapolation method using Lebergott (1964), Tables A3, A4, and A5. 76 Military pay is about 15% of total wages in the US economy and slightly more than 20% of US wage earners from 1943 to 1945.
38
Before 1948, as two wage earners had incentives to file separately (see
Appendix A), the tax return statistics on wages reflects individual wages rather than family wages. As a result, using the same definition of tax units as described above produces a downward bias for top wage shares before 1947 and thus an artificial positive jump in top shares between 1947 and 1948. We correct for this discontinuity as follows. First, for years 1927 to 1947, we temporarily redefine the total number of tax units with wages as the total number of part-time and full-time employees from National Accounts (that is, we add back the working wives). Second, we then compute top shares and levels using this alternative definition for the total number of tax units. The wage levels and thresholds that we obtain for 1927 to 1947 correspond to individual wages (and not family wages) and thus are smaller than the levels and thresholds after 1948. But fortunately, shares computed at the individual level before 1948 and at the tax unit level after 1948 do not produce a discernible jump in the series. Third, in order to correct the discontinuity in levels and thresholds, we multiply the levels and thresholds that we obtain before 1948 by the ratio of the total number of individual tax units (new definition) to the total number of family tax units (old definition). This procedure produces levels and thresholds that are both continuous in 1947-1948 and fully consistent with our share estimates. Insert Table B1 B2. Interpolations from IRS tables From 1927 to 1941, Statistics of Income provides tables by size of wages only for tax returns with net income above $5,000. The tables contain both the number of taxpayers and total wages reported by bracket from 1927 to 1935. The tables contain only the number of taxpayers (and not total wages reported) from 1936 to 1941. The number of returns and amounts of wage reported, even for brackets above $5,000, are underestimated because wages can be above $5,000 and net income below for some returns because of deductions (on average equal to 10% of gross income). Fortunately, the IRS publication for year 1928 provides the same table for returns filing Form 1040 with net income below $5,000. Taxpayers with relatively low income levels composed mostly of wages and salaries are allowed to file a shorter form called Form 1040A. In 1928 (as for most inter-war years), Form 1040A could only be used for returns with gross income less than $5,000. As a result, combining the Tables by size of wages for net income above $5,000 and net income below $5,000 provides a complete distribution of wages reported on Form 1040 and thus a complete distribution of wages above $5,000. Assuming that for each bracket the ratio of the number of returns with net income below $5,000 to the number of returns with net income above $5,000 is constant from 1927 to 194177, we can correct the Tables and obtain a complete 77 This assumption can be successfully tested using the micro-files for the period 1966-1995.
39
distribution of salaries above $5,000. These tables, however, allow only the estimation of series of top shares above $5,000. As $5,000 corresponds roughly to the threshold level P99, these truncated distributions allow the estimation of levels and shares only within the top percentile. After 1944, the IRS provides tables by size of wages for all returns (Forms 1040A and 1040) and thus covering the full tax return population. From 1927 and 1941, estimation of salary distributions below $5,000 is done using the composition tables classified by net income brackets described in Appendix A. In these tables, the number of returns reporting wages, along with the total amount of those wages is reported for each bracket of net-income.78 Average wage for wage earners and average net-income for each net-income bracket are computed. We then assume that each net-income bracket corresponds to a wage bracket with thresholds equal to the actual net-income thresholds multiplied by the ratio of average wage to average net-income in that bracket. In order to generate brackets fitting together, the final thresholds are taken as equal to the average of the corresponding top and bottom thresholds of two adjacent brackets. We therefore obtain a set of wage bracket thresholds where the number of returns and the wage amount reported for each bracket is the same as in the original composition table. This new distribution by size of wages is not perfectly accurate because ranking in terms of net-income is not identical to ranking in terms of wages. This method is therefore reliable only if wage income is close to net-income bracket by bracket. Fortunately, salaries constitute more than 90% of net-income reported in tax returns (with positive wage income) for brackets of net-income below $5,000. The ratio is above to 95% for brackets below $3,000. Shares and levels below the top percentile are obtained using these estimated wage distributions. This method can be tested using later years and is shown to give results extremely close to the direct method using tables distributed by wage size.79
Years 1942 and 1943 raise special problems because the IRS did not provide tables by size of wages for these two years. Fortunately, the IRS provided tables for returns reporting only salary income for each of the years 1942 to 1945. These tables are used to estimate wage distributions for 1942 and 1943 using a simple multiplier method. We take year 1944 as a benchmark and we assume that the ratios of returns with wages only to all returns with wages by wage brackets80 are constant. This method can be successfully tested using
78 Before 1937, the composition tables report only the amounts of wages and not the number of returns with positive wages in each bracket. We have estimated the number of returns in each bracket for these years assuming that the ratio of the number of returns with positive wages to the number of returns (with positive or zero wages) is the same as in 1937 for each bracket. We have checked that this assumption is reasonable by comparing these ratios for years 1937 to 1940. 79 As expected, this method provides estimates of levels and shares biased downward above the top percentile relative to the direct method using published tables by size of wages. We thus use the indirect estimates to compute thresholds, average levels, and shares for the fractiles P90-95 and P95-99 and then use the direct estimates for the fractiles within the top percentile. 80 In fact, the ratio is assumed to be constant by fractiles of the distribution corresponding to each of the brackets of 1944. The multipliers for each of the 1942 and 1943 brackets are then obtained by using interpolated 1944 multipliers.
40
1945, where we can compute shares using direct complete tabulations. This methodology is reliable because the number of returns reporting wage only is large, even in the very top fractiles of wage earners. Below the top percentile, the method described above using composition tables can be used to compute alternative estimates for 1942 and 1943. We have checked that this method gives very similar results.81 Finally, years 2000-2002 require a specific method as micro-files are not available for these years.82 We used the composition tables showing by brackets of Adjusted Gross Income (AGI), the number of returns with wage income and the total amount of wages reported. Using the same methodology we used for years 1927 to 1941, we obtain a distribution of wages. We then compute shares and income levels from this distribution. Obviously, the levels and shares are underestimated using this method because ranking in terms of AGI and wages is not identical. However, using previous years 1991 to 1999 where both the micro-files and the published composition tables are available, we can estimate by how much levels and shares estimated from published tables for each fractile should be adjusted to match estimates from the micro-files. Fortunately, these multiplier factors are extremely stable from 1991 to 1999 (the maximum variation between multipliers is always less than 5%). Therefore, we can use the multipliers from year 1999 to adjust the levels and shares for years 2000-2002.83 The actual interpolation method used to obtain thresholds and average wage levels by fractiles is the same Pareto method as the one described in Appendix A. In a number of years, however, the IRS only published the number of returns and not the amounts.84 For these years, before applying the Pareto interpolation method described above, we estimated amounts as follows.85 We assume that the distribution of income in each bracket [s,t] is Pareto distributed F(y)=1-(k/y)a. The Pareto parameters a and k are obtained by solving the two equations: k=s p(1/a) and k=t q(1/a) where p is the fraction of tax returns above s and q the fraction of tax returns above t.86 Note that the Pareto parameters k and a may vary from bracket to bracket. We then estimate the amount reported in 81 In 1941, 1942, and 1943, an additional complication appears because returns for Forms 1040, and 1040A are tabulated separately in the composition tables by size of net-income. Wage distributions for returns corresponding to each of these forms are first estimated using the method described above. The two wage distributions thus obtained are then merged into a single wage distribution as follows: the distribution of wages within each bracket of the form 1040A distribution is assumed to be Paretian. Then we split each bracket of the form 1040A distribution so that each portion can be attributed fully to a given bracket of the form 1040 distribution. For each bracket of the form 1040 distribution, we add back the pieces coming from the form 1040A distribution. 82 We do not report top wage shares for year 2002, because at the time this paper was written, the complete composition table by income brackets was not yet available. 83 Shares and levels are blown up by around 5% for fractiles P90-95 and P95-99, by around 10% for fractiles P99-99.5 and P99.5-99.9, and by around 20% for fractiles P99.9-99.99 and P99.99-100. 84 For years 1935 to 1941, and from 1944 to 1961, the published tables report only the number of tax units in each bracket. 85 We adopted the same method to compute top income shares in 1913-1915 where only the number of tax units was available. 86 This is the standard method of Pareto interpolation used by Kuznets (1953) and Feenberg and Poterba (1993).
41
bracket [s,t] simply as Y=N ∫st ydF(y), where N is the total number of tax units (with positive wages). For the top bracket, this method cannot be applied and we therefore assume that the top bracket is Pareto distributed with Pareto parameters a and k equal to those of the bracket just below the top estimated by the method just described. When data on amounts reported are available, we can check that our estimated amounts Y are very close to the true reported amounts.
All these steps involve a substantial number of computations that have not been described in full details. Our computer programs are available upon request for readers interested in getting the full details of the estimation. Insert Table B2 and B3 B3. Entry effects on top shares
The fractiles are defined relative to the total number of tax units with positive wages, and therefore our series measure inequality only among wage earners for each year. Entry or exit effects such as a rise of unemployment during depressions, or movements into the labor force such as military personnel during the wars, or a decline of self-employment and rise of wages workers, can affect our top shares measures through composition effects. Under one set of simple conditions that we now describe, shares of wages accruing to top fractiles are not affected by entry of exit effects. Suppose that the initial wage distribution density is f(w) and that we add (or subtract) a new distribution g(w) to the former distribution. The new distribution g(w) represents a flow of entrants such as military personnel during WWII. Let us assume that the fraction of new entrants within the top fractile is negligible (that is, the support of g(w) is below the threshold of the top fractile of f(w)). This assumption is likely to be satisfied for top fractiles and movements in and out of the labor force due to wars or business cycles. Adding workers with the distribution g(w) below the top increases the total wage income denominator which tends to reduce top shares but also increases the size of each fractile, which tends to increase top shares. Let us assume realistically that the top of the distribution f(w) is Paretian with parameter a. Let us introduce b=a/(a-1). Then, it is possible to show the following result:
If the average wage of the initial distribution f(w) is b times larger than the average wage of distribution g(w). Then, the two effects just described cancel out and adding g(w) to the initial distribution f(w) does not change top shares (up to a first degree of approximation). If the average wage of f(w) is more (less) than b times the average wage of g(w), then introducing g(w) increases (decreases) top shares.
If we take the case of military personnel during WWII, b is about 1.5 and the average non-military salary during WWII is also about 1.5 times larger than the average military salary (see National Accounts). This explains why excluding military workers and wages hardly affects our top share estimates.
Let us consider the case of the very large increase in wage earners from a low level in 1938 (due to a very high unemployment rate) to 1948 (full
42
employment). If we assume that the average wage of new entrants is 66% of the current average wage (which is perhaps a reasonable number), then excluding new entrants would not affect our top share estimates. If the average wage of new entrants is less that 66% of the average wage, then the entry effect biases our top shares upward, implying that the decline in top shares would be larger when eliminating the entry effect. B4. CEO data The CEO data is from Forbes magazine survey of 800 CEOs from the largest US corporations from 1970 to 2003. Total pay includes salary and bonus, stock options exercised during the year, the value of restricted stock awarded, and the value contingent pay. Average wage is the line wages and salaries from NIPA divided by the number of full-time equivalent employees from NIPA. Insert Table B4.
43
REFERENCES
Acemoglu, Daron, “Technical Change, Inequality, and the Labor Market,” Journal of Economic Literature, XL (2002), 7-72. Acemoglu, Daron, Philippe Aghion, and Giovanni Violante, “Deunionization, Technical Change, and Inequality”, Working paper, Harvard University, 2001. Atkinson, Anthony B., “Top Incomes in the United Kingdom over the Twentieth Century.”, mimeo Nuffied College, Oxford, August 2001. Brownlee, W. Elliot, “Historical Perspective on U.S. Tax Policy Toward the Rich,” in Slemrod, Joel ed. Does Atlas Shrug? The Economic Consequences of Taxing the Rich, (Cambridge University Press, 2000). Bureau of Census, Statistical Abstract of the United States. Hoover’s Business Press, 1999. Brown, Henry P., The Inequality of Pay. (New-York: Oxford University Press, 1977). Cartter, Allan M., “Income Shares of Upper Income Groups in Great Britain and the United States,” American Economic Review, XLIV (1954), 875-883. Chetty, Raj and Emmanuel Saez, “Dividend payments and Corporate Behavior: Evidence from the 2003 Dividend Tax Cut”, NBER Working Paper, 2004. Cooper, George, A Voluntary Tax? New Perspectives on Sophisticated Estate Tax Avoidance. (Washington: The Brookings Institution, 1979). DeLong, J. Bradford, “Robber Barons”, mimeo, Berkeley, 1998. DiNardo, John, Nicole Fortin, and Thomas Lemieux, “Labor Market Institutions and the Distribution of Wages, 1973-1992: A Semiparametric Approach.” Econometrica, LXIV (1996), 1001-1044. Fama Eugene and Kenneth French, “Disappearing Dividends: Changing Firm Characteristics or Lower Propensity to Pay?”, Working Paper No. 509, Center for Research in Security Prices, 2000. Feenberg, Daniel and James Poterba, “Income Inequality and the Incomes of Very High Income Taxpayers: Evidence from Tax Returns”, Tax Policy and the Economy ed. J. Poterba, (MIT Press: Cambridge, 1993), 7, 145-177.
44
Feenberg, Daniel and James Poterba, “The Income and Tax Share of Very High Income Households, 1960-1995”, American Economic Review, XC (2000), 264-270. Goldin, Claudia and Robert Margo, “The Great Compression: The Wage Structure in the United States at Mid-Century”, Quarterly Journal of Economics, CVII (1992), 1-34. Goldin, Claudia and Lawrence Katz, “The Returns to Skill across the Twentieth Century United States”, NBER Working Paper No. 7126, 1999. Goldsmith, Selma, George Jaszi, Hyman Kaitz, and Maurice Liebenberg, “Size Distribution of Income Since the Mid-Thirties.”, Review of Economics and Statistics, XXXVI (1954), 1-32. Goolsbee, Austan, “What Happens When You Tax the Rich? Evidence from Executive Compensation,” Journal of Political Economy, CVIII (2000), 352-378. Gordon, Roger and Joel Slemrod, “Are ‘Real’ Responses to Taxes Simply Income Shifting Between Corporate and Personal Tax Bases.”, in Slemrod, Joel ed. Does Atlas Shrug? The Economic Consequences of Taxing the Rich, (Cambridge University Press, 2000). Hall, Brian, and Kevin J. Murphy, “The Trouble with Stock Options”, Journal of Economic Perspectives, 17(3), 2004, 49-70. Karoly, Lynn A., “The Trend in Inequality among Families, Individuals, and Workers in the United States: A Twenty-five Year Perspective.”, in S. Danziger and P. Gottschalk, eds. Uneven Tides: Rising Inequality in America, (Russell Sage Foundation: New-York, 1993), 99-164. Katz, Lawrence and David Autor, “Changes in the Wage Structure and Earnings Inequality”, in Handbook of Labor Economics, eds. O. Ashenfelter and D. Card, (North-Holland, 1999), Volume 3A. Katz, Lawrence and Kevin Murphy, “Changes in Relative Wages, 1963-1987: Supply and Demand Factors.” Quarterly Journal of Economics, CVII (1992), 35-78. Keat, Paul, “Longrun Changes in Occupational Wage Structure, 1900-1956.”, Journal of Political Economy, LXVIII (1960), 584-600. Kopczuk, Wojciech and Emmanuel Saez (2004) “Top Wealth Shares in the United States, 1916-2000: Evidence from Estate Tax Returns'', National Tax Journal, 57(2), Part 2, 445-487.
45
Kuznets, Simon, National Income and Its Composition, 1919-1938, (National Bureau of Economic Research, 1941) Kuznets, Simon, National Product in Wartime, (National Bureau of Economic Research, 1945). Kuznets, Simon, Shares of Upper Income Groups in Income and Savings, (National Bureau of Economic Research 1953) Kuznets, Simon, “Economic Growth and Economic Inequality”, American Economic Review XLV (1955), 1-28. Lampman, R. J., The Share of Top Wealth-Holders in National Wealth, 1922-1956, (NBER and Princeton University Press, 1962). Lewellen, Wilbur G., Executive Compensation in Large Industrial Corporations, (NBER: New-York, 1968). Lindert, Peter, “Three Centuries of Inequality in Britain and America”, in Atkinson, Anthony and François Bourguignon ed. Handbook of Income Distribution, (North-Holland, 2000), 167-216 Mellon, Andrew, Taxation: the People’s Business, (New-York, 1924). Morrisson, Christian, “Historical Perspectives on Income Distribution: the Case of Europe”, in Atkinson, Anthony and François Bourguignon ed. Handbook of Income Distribution, (North-Holland, 2000), 217-260 Park, Thae S., “Comparison of BEA Estimates of Personal Income and IRS Estimates of Adjusted Gross Income”, Survey of Current Business (November), 2000, 7-13. Piketty, Thomas, Les hauts revenus en France au 20eme siecle – Inegalites et redistributions, 1901-1998, (Paris : Editions Grasset 2001a) Piketty, Thomas, “Income Inequality in France, 1901-1998”, Journal of Political Economy, 111(5), 1004-1042. Piketty Thomas, and Emmanuel Saez, “Income Inequality in the United States, 1913-1998”, Quarterly Journal of Economics, 118(1), 1-39. Poterba, James, “The Estate Tax and After-Tax Investment Returns.”, in Slemrod, Joel ed. Does Atlas Shrug? The Economic Consequences of Taxing the Rich, (Cambridge University Press, 2000).
46
Saez, Emmanuel, “Reported Incomes and Marginal Tax Rates, 1960-2000: Evidence and Policy Implications.” in ed. J. Poterba, Tax Policy and the Economy (MIT Press: Cambridge), 18, 2004. Saez, Emmanuel and Michael Veall (2004), “The Evolution of High Incomes in Northern America: Lessons from Canadian Evidence”, forthcoming American Economic Review. Slemrod, Joel, “High Income Families and the Tax Changes of the 1980s: the Anatomy of Behavioral Response.”, in Empirical Foundations of Household Taxation, eds. M. Feldstein and J. Poterba, (University of Chicago Press, 1996). Slemrod, Joel and Jon Bakija, “Does Growing Inequality Reduce Tax Progressivity ? Should it ?” NBER Working Paper No. 7576, 2000. U.S. Bureau of Old-Age, Handbook of Old-Age and Survivors Insurance Statistics, 1949. (Washington D.C., 1952). U.S. Department of Commerce, Bureau of Census, Historical Statistics of the United States: Colonial Times to 1970. (Washington, D.C., 1975). U.S. Department of Commerce, Bureau of Economic Analysis. National Income and Product Accounts of the United States, 1929-97. (Washington D.C., 2000) (www.bea.doc.gov/bea/dn/nipaweb/) U.S. Government Printing Office (2000). Economic Report of the President, Washington, D.C. U.S. Office of the Commissioner of Internal Revenue (1899-1916) Annual Report of the Commissioner of Internal Revenue. Washington, D.C. (annual publication). U.S. Treasury Department, Internal Revenue Service, Statistics of Income: Individual Income Tax Returns. (Washington, D.C., annual 1916-2002). U.S. Treasury Department, Internal Revenue Service, Statistics of Income: Corporate Income Tax Returns. (Washington, D.C., annual 1916-2002). Williamson, Jeffrey and Peter Lindert, American Inequality–A Macroeconomic History, (Academic Press, 1980)
FIGURE 1The Top Decile Income Share, 1917-2002
Source: Table A1, col. P90-100. Income is defined as market income but excludes capital gains.
25%
30%
35%
40%
45%
50%
1917
1922
1927
1932
1937
1942
1947
1952
1957
1962
1967
1972
1977
1982
1987
1992
1997
2002
Shar
e (in
%),
excl
udin
g ca
pita
l gai
ns
FIGURE 2The Income Shares of P90-95, P95-99, and P99-100, 1913-2002
Source: Table A1, col. P90-95, P95-99, P99-100. Income is defined as market income but excludes capital gains.
5%6%7%8%9%
10%11%12%13%14%15%16%17%18%19%20%
1913
1918
1923
1928
1933
1938
1943
1948
1953
1958
1963
1968
1973
1978
1983
1988
1993
1998
Shar
e (in
%),
excl
udin
g ca
pita
l gai
ns
P90-95 P95-99 P99-100
FIGURE 3The Top 0.01% Income Share, 1913-2002
Source: Table A1, col. P99.99-100. Income is defined as market income but excludes capital gains.
0.0%
0.5%
1.0%
1.5%
2.0%
2.5%
3.0%
3.5%
4.0%
4.5%
1913
1918
1923
1928
1933
1938
1943
1948
1953
1958
1963
1968
1973
1978
1983
1988
1993
1998
Shar
e (in
%),
excl
udin
g ca
pita
l gai
ns
FIGURE 4Income Composition of Top Groups within the Top Decile in 1929 and 1999
Capital income does not include capital gains Source: Table A4, rows 1929 and 1999.
Panel A: 1929
0%
10%
20%
30%
40%
50%
60%
70%
80%
90%
100%P9
0-95
P95-
99
P99-
99.5
P99.
5-99
.9
P99.
9-99
.99
P99.
99-1
00Wage Income Capital Income Entrepreneurial Income
Panel B: 1999
0%
10%
20%
30%
40%
50%
60%
70%
80%
90%
100%
P90-
95
P95-
99
P99-
99.5
P99.
5-99
.9
P99.
9-99
.99
P99.
99-1
00
Wage Income Capital Income Entrepreneurial Income
FIGURE 5The Capital Income Share in the Top 0.5%,1916-1999
Series display the share of capital income (excluding capital gains) and dividends in total income (excluding capital gains) for the top 0.5% income quantile.Source: Table A7, column P99.5-100
0%5%
10%15%20%25%30%35%40%45%50%55%60%65%
1916
1921
1926
1931
1936
1941
1946
1951
1956
1961
1966
1971
1976
1981
1986
1991
1996
Shar
e (in
%),
excl
udin
g ca
pita
l gai
ns Capital income Dividends
FIGURE 6Capital Income in the Corporate and Personal Sector, 1929-2003
Source: Authors' computations based on National Income and Product Accounts. Panel A from NIPA Table 1.14; consumption of fixed capital and net interest have been included in the capital share. Panel B from NIPA Table 2.1; capital income includes dividends, interest, and rents.
A. Factor shares in the corporate sector
0%
10%
20%
30%
40%
50%
60%
70%
80%
90%
100%19
29
1934
1939
1944
1949
1954
1959
1964
1969
1974
1979
1984
1989
1994
1999
Labor Capital
B. The capital income share in the personal income sector
0%
5%
10%
15%
20%
25%
1929
1934
1939
1944
1949
1954
1959
1964
1969
1974
1979
1984
1989
1994
1999
Capital income Dividends
FIGURE 7The Top 0.1% Wealth Share in the United States, 1916-2000
Source: Kopczuk and Saez (2004), Table 3, col. Top 0.1%. Top wealth shares are estimated from estate tax returns using the estate multiplier method.
0%
5%
10%
15%
20%
25%
1916
1921
1926
1931
1936
1941
1946
1951
1956
1961
1966
1971
1976
1981
1986
1991
1996
Wea
lth S
hare
FIGURE 8The Top Decile Wage Income Share, 1927-2002
Source: Table B2, col. P90-100. Wage income includes bonuses, and profits from exercised stockoptions.
20.0%
22.5%
25.0%
27.5%
30.0%
32.5%
35.0%
37.5%
1927
1932
1937
1942
1947
1952
1957
1962
1967
1972
1977
1982
1987
1992
1997
2002
Shar
e (in
%)
FIGURE 9Wage Income Shares for P90-95, P95-99, and P99-100, 1927-2002
Source: Table B2, col. P90-95, P95-99, P99-100. Wage income includes bonuses, and profits from exercised stockoptions.
4%
5%
6%
7%
8%
9%
10%
11%
12%
13%19
27
1932
1937
1942
1947
1952
1957
1962
1967
1972
1977
1982
1987
1992
1997
2002
Shar
e (in
%)
P90-95 P95-99 P99-100
FIGURE XShares of Officers Compensation and Wages Shares P99.5-100 and P99-99.9, 1917-1960
Source: Officers compensation from Authors' computations based on corporate income tax returns (Table B1, col. Officers compensation, and Table B2, col. P99.5-100, and P99-99.5+P99.5-99.9
0%
1%
2%
3%
4%
5%
6%
7%
8%
1917
1920
1923
1926
1929
1932
1935
1938
1941
1944
1947
1950
1953
1956
1959
Shar
e (in
%)
Officers Compensation P99.5-100 P99-99.9
FIGURE 11CEO Pay versus Average Wage Income, 1970-2003
Source: Table B4. Logarithmic scales.The average wage income (right scale) is estimated as the total wages and salaries from National Income andProducts Accounts divided by the total number of full-time equivalent employees.CEO pay includes salary, bonus, and profits from exercised stock-optionsAll estimates are expressed in 2000 dollars using the official CPI.
$1,000,000
$10,000,000
$100,000,00019
70
1974
1978
1982
1986
1990
1994
1998
2002
CEO
pay
(200
0 do
llars
)
$10,000
$100,000
$1,000,000
Ave
rage
Wag
e In
com
e (2
000
dolla
rs)
Rank 10 CEO pay
Rank 50 CEO pay
Rank 100 CEO pay
Top 100 CEOs average pay
Salary+Bonus rank 10
Average Salary (right scale)
FIGURE 12Top 0.1% Income Shares in the U.S., France, and the U.K.,1913-1998
Sources: United States: Table A1, column P99.9-100. France: Computations based on income tax returns by Piketty (2001b), Table A1, col. P99.9-100; United Kingdom: Computations based on income tax returns by Atkinson (2001), col. Top 0.1% in Tables 1 and 4.Years 1987-1992 and 1994-1998 are extrapolated from Atkinson top 0.5% series. Discontinuity from 1989 to 1990 due to switch from family to individual base corrected.NEED TO UPDATE UK SERIES WITH MOST RECENT ATKINSON ESTIMATESIn all three countries, income is defined before individual taxes and excludes capital gains. The unit is the family as in the current U.S. tax law.
0%
1%
2%
3%
4%
5%
6%
7%
8%
9%
10%
11%
12%
1913
1918
1923
1928
1933
1938
1943
1948
1953
1958
1963
1968
1973
1978
1983
1988
1993
1998
shar
e (in
%)
United States France United Kingdom
FIGURE A0Average Real Income and Consumer Price Index in the United States, 1913-2002
Source: Table A0, columns Average income (in real 2000 dollars) and CPI (base 100 in 2002)
$0
$5,000
$10,000
$15,000
$20,000
$25,000
$30,000
$35,000
$40,000
$45,00019
13
1918
1923
1928
1933
1938
1943
1948
1953
1958
1963
1968
1973
1978
1983
1988
1993
1998
Inco
me
in 2
000
Dol
lars
1
10
100
Con
sum
er P
rice
Inde
x (b
ase
100
in 2
000)
Average Income Price Index
FIGURE A1Average Real Income of bottom 99% and top 1% in the United States, 1917-2002
Source: Table A4, columns P0-90, P90-95, P95-99 and P99-100
Important points to keep in mind when interpreting this figure (in particular the fact that average real incomes for bottom 99% have stagnated from 1973 to 2000):1) Income is defined as market income (excluding realized capital gains) and excludes all transfers such as Social Security benefits, unemployment insurance, welfare assistance, etc. The importance of transfers has grown overtime. They represent in 2000 about 15% of personal income and around 10% in 1973, and only 1-2% before 1930.
2) The unit is the tax unit (such as couple and dependents, or a head of household with dependents, or a single person). The number of individuals per tax unit has declined overtime from 2.5 in the 1973 to 2.1 in 2000 but the number of adults (aged 20+) per tax unit has only declined from 1.6 to 1.5 from 1973 to 2000.A tax unit is smaller than a household (a household is defined as all individuals living in the same unit such as two roommates, etc.)In 2000, there were 134.5 million tax units but only 104.7 million households in the United States.Therefore, average household income is about 28% higher than average tax unit income.
3) All nominal incomes are deflated using the official Consumer Price Index (CPI-U). It has been recognized that the CPI-U understatesinflation and new CPI series (CPI-U-RS) have been created for the period 1967-2002 displaying 15% less inflation (and hence 15% more realincome growth) for the period 1967 to 2002 and about 13% more real growth from 1973 to 2000.
In sum, from 1973 to 2000, the average income of the bottom 99% would have grown by about 40% in real terms instead of stagnating (as displayed onthe figure above) if we had included all transfers (+7% effect), used the CPI-U-RS (+13% effect), and especially defined income per capita (+20% effect).Under those assumptions, the average income of the top 1% would have grown by a factor 3.3 instead of a mere 2.5 (as in figure above).
So the finding that top 1% incomes have done so much better than the bottom 99% since 1973 is largely independent of the assumptions discussedabove.
$0
$5,000
$10,000
$15,000
$20,000
$25,000
$30,000
$35,000
$40,00019
17
1922
1927
1932
1937
1942
1947
1952
1957
1962
1967
1972
1977
1982
1987
1992
1997
2002
Ave
rage
Inco
me
of P
0-99
(200
0 do
llars
)
$0
$100,000
$200,000
$300,000
$400,000
$500,000
$600,000
$700,000
$800,000
Ave
rage
Inco
me
of P
99-1
00 (2
000
dolla
rs)
P0-99 Average
P99-100 Average
FIGURE A2Top 1% Income Shares in the United States, the role of capital gains
Sources: Table A1, A2, and A3, column P99-100. The series K gains fully included are based on income including capital gains (both in ranking and for estimating top shares)The series K gains in shares only are based on ranking by income excluding capital gains but include capital gains in sharesThe series K gains fully excluded are based on income excluding capital gains (both in ranking and for estimating top shares)
0%
5%
10%
15%
20%
25%
1913
1918
1923
1928
1933
1938
1943
1948
1953
1958
1963
1968
1973
1978
1983
1988
1993
1998
shar
e (in
%)
K gains fully included
K gains in shares only
K gains fully excluded
TABLE 1.
Percentile threshold
Income threshold Income Groups
Number of tax units
Average income in
each group(1) (2) (3) (4) (5)
Full Population 133,589,000 $42,709
Median $25,076 Bottom 90% 120,230,100 $26,616
Top 10% $87,334 Top 10-5% 6,679,450 $100,480Top 5% $120,212 Top 5-1% 5,343,560 $162,366Top 1% $277,983 Top 1-0.5% 667,945 $327,970Top .5% $397,949 Top 0.5-0.1% 534,356 $611,848Top .1% $1,134,849 Top 0.1-0.01% 120,230 $2,047,801Top .01% $5,349,795 Top 0.01% 13,359 $13,055,242
Notes: Sources is Table A0 and Table A4, row 2000. Computations based on income tax return statistics.
Income defined as annual gross income reported on tax returns excluding capital gains and all government transfers
(such as Social Security, Unemployment Benefits, Welfare Payments, etc.) and before individual income taxes and
employees' payroll taxes. Amounts are expressed in current 2000 dollars.
Column (2) reports the income thresholds corresponding to each of the percentiles in column (1). For example,
an annual income of at least $87,334 is required to belong to the top 10% tax units, etc.
Thresholds and Average Incomes in Top Income Groups in 2000
Notes: Computations based on interpolations from Statistics of Income, 1916, Table 6c, pp. 126-137.
Salaried Professions defined as accounting profession (accountants, statisticians, actuaries, etc.), engineers,
clergymen, public service: civil and military, teachers, corporation officials, and all other employees.
Independent professions defined as architects, artists, authors, clergymen, lawyers and judges, medical profession,
theatrical profession, all other professions, profession not stated, commercial travelers, and sportsmen.
Business owners defined as farmers, hotel proprietors and restaurateurs, insurance agents, labor skilled and unskilled,
lumbermen, manufacturers, merchants and dealers, mine owners and operators, saloon keepers, theatrical business
owners, all other business, and business not stated.
Capitalists and Rentiers defined as bankers, real-estate brokers, stock and bond brokers, insurance brokers,
all other brokers, and capitalists: investors and speculators.
Table 2: Shares of each occupation within the top 1% in 1916
Inflation(1) (2) (3) (4) (5) (6) (7) (8)
Year N. tax units N. tax returns (2)/(1) Total income Average income Total income Average income CPI(thousands) (thousands) (%) (millions 2000 $) (2000 $) (millions 2000 $ (2000 $) ( p(2000)/p(n) )
Notes: Population and tax units estimates based on census and current population surveys (Historical Statistics of the United States, and Statistical Abstract of the United States)Tax units estimated as sum of married men, divorced and widowed men and women, and singles men and women aged 20 and over.Income defined as Adjusted Gross Income less realized capital gains, taxable SS and UI benefits and adding back all adjustments to gross income. Income of non-filers is imputed as 20% of average income. Income including capital gains is as above plus total net capital gains.Consumer Price Index (CPI-U) is the official CPI index from Economic Report of the President.
Table A1: Top fractiles income shares (excluding capital gains) in the U.S., 1913-2002(fractiles are defined by total income (excluding capital gains))
Notes: Computations by authors on tax return statistics. Taxpayers are ranked by gross income (excluding capital gains and government transfers).Income is defined as market income but excludes capital gains.The Table reports the percentage of total income accruing to each of the top groups. P90-100 denotes to top decile, P90-95 denotes the bottom half of the top decile, etc.
Table A2: Top fractiles income shares (including capital gains) in the U.S., 1913-2002(fractiles are defined by total income (excluding capital gains))
Notes: Computations by authors on tax return statistics. Taxpayers are ranked by gross income (excluding capital gains and government transfers).Income to compute shares is defined as market income and includes capital gains.The Table reports the percentage of total income accruing to each of the top groups. P90-100 denotes to top decile, P90-95 denotes the bottom half of the top decile, etc.
Table A3: Top fractiles income shares (including capital gains) in the U.S., 1913-2002(fractiles are defined by total income (including capital gains))
Notes: Computations by authors on tax return statistics. Taxpayers are ranked by gross income including capital gains (excluding government transfers).Income to compute shares is defined as market income and includes capital gains.The Table reports the percentage of total income accruing to each of the top groups. P90-100 denotes to top decile, P90-95 denotes the bottom half of the top decile, etc.
(fractiles are defined by total income (excluding capital gains)) (incomes are expressed in 2000 $)Table A4: Top fractiles income levels (excluding capital gains) in the United States, 1913-2002
(fractiles are defined by total income (excluding capital gains)) (incomes are expressed in 2000 $)Table A5: Top fractiles income levels (including capital gains) in the United States, 1913-2002
(fractiles are defined by total income (including capital gains)) (incomes are expressed in 2000 $)Table A6: Top fractiles income levels (including capital gains) in the United States, 1913-2002
Notes: Groups ranked by income (AGI + adjustments) excluding realized capital gains and SS and UI benefits.Wages is defined as wages and salaries and pensions (and includes bonuses, stock-option exercises, etc.). Entrep. is profits from S-Corporations (entities not subject to corporate taxes and taxed only at the individual level) plus profits from Partnerships plus profits from sole proprietorship businesses (Schedule C income) plus farm income. Divid. is dividends distributed. Interest is interest income. Rents is rental income. The sums of all sources add up to 100% (other forms of income are very small and excluded from the decomposition).
Notes: Groups ranked by income (AGI + adjustments) excluding realized capital gains and SS and UI benefits.Wages is defined as wages and salaries and pensions (and includes bonuses, stock-option exercises, etc.). Entrep. is profits from S-Corporations (entities not subject to corporate taxes and taxed only at the individual level) plus profits from Partnerships plus profits from sole proprietorship businesses (Schedule C income) plus farm income. Divid. is dividends distributed. Interest is interest income. Rents is rental income. The sums of all sources add up to 100% (other forms of income are very small and excluded from the decomposition).
Notes: Groups ranked by income (AGI + adjustments) excluding realized capital gains and SS and UI benefits.Wages is defined as wages and salaries and pensions (and includes bonuses, stock-option exercises, etc.). Entrep. is profits from S-Corporations (entities not subject to corporate taxes and taxed only at the individual level) plus profits from Partnerships plus profits from sole proprietorship businesses (Schedule C income) plus farm income. Divid. is dividends distributed. Interest is interest income. Rents is rental income. The sums of all sources add up to 100% (other forms of income are very small and excluded from the decomposition).
Notes: In Panel A, tax returns are ranked by total income excluding capital gains. Series report the additional income reported in the form of capital gains. The share of Capital gains reported are the share of total income including capital gains. For example, the top decile (defined by income excluding capital gains) in 1999 earned 12.9% of their total income (including capital gains) in the form of capital gains. In Panel B, average marginal tax rate on long-term capital gains (dollar weighted) are estimated from micro-files and using the TAXSIM calculator.Details on estimation are presented in Appendix Section C.
Notes: Total number of part-time and full time employees from NIPA 1929-2001 (includes military). From 1917 to 1929.extrapolated using Lebergott series on employees. Married women employees from Historical Statistics and Statistical Abstract.Total wage bill is from NIPA 1929-1999 (line 1). Wage bill 1917-1927 extrapolated from Kuznets (p. 570, (1))Average wage is column (5) over column (2).Officer compensation share from Corporate Tax returns statistics.
Notes: Shares computed from Tax returns statistics and total number of tax units and total wage bill from Table B1.Wage income is wages, salaries, and tips on individual income tax form. It includes bonuses, and profits from exercised stockoptions.
Notes: Levels computed from Tax returns statistics and total number of tax units and total wage bill from Table B1. Wage income is wages, salaries, and tips on individual income tax form. It includes bonuses, and profits from exercised stockoptions.
Notes: Average is the total wages and salaries divided by number of equivalent full-time employees (from National Income and Product Accounts)CEO pay statistics are computed from the top 100 CEOs (in term of total pay) from Forbes survey of 800 CEOs from 1970 to 2003.
13.9615.5520.0040.50
15.9314.0117.1512.87
CEO pay statistics (in thousands of 2000 dollars)
Table B4: CEO Pay versus Average Wage, 1970 to 2003


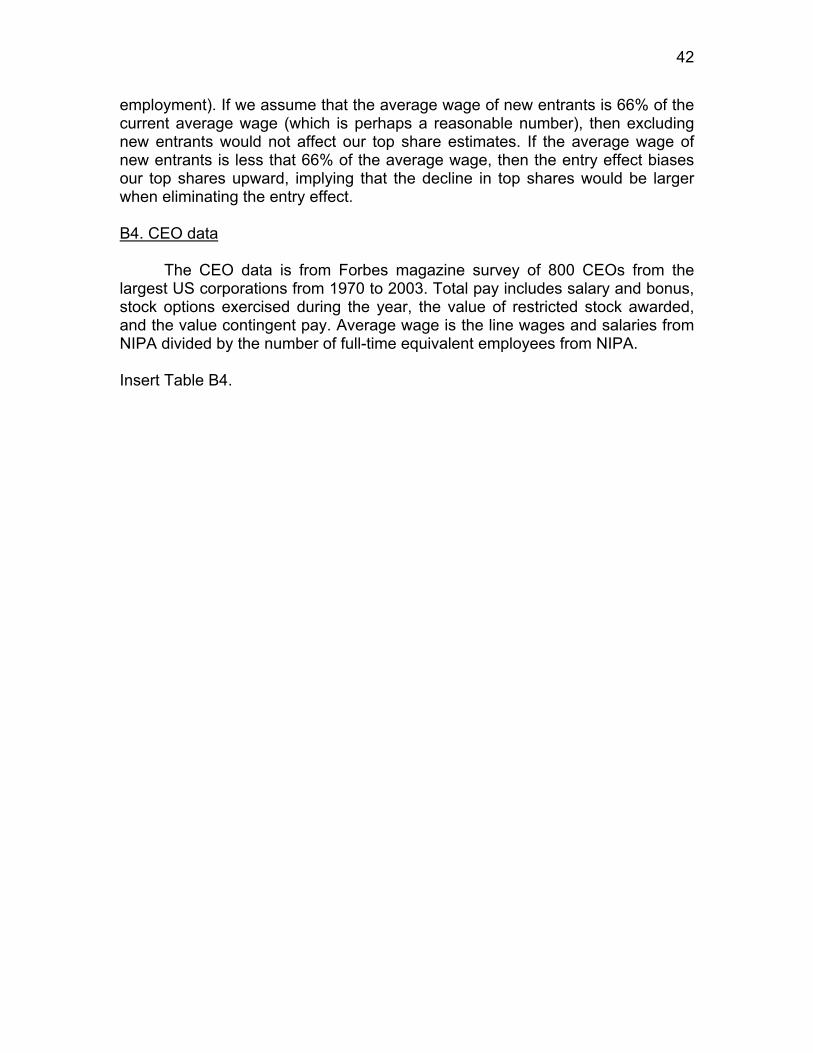
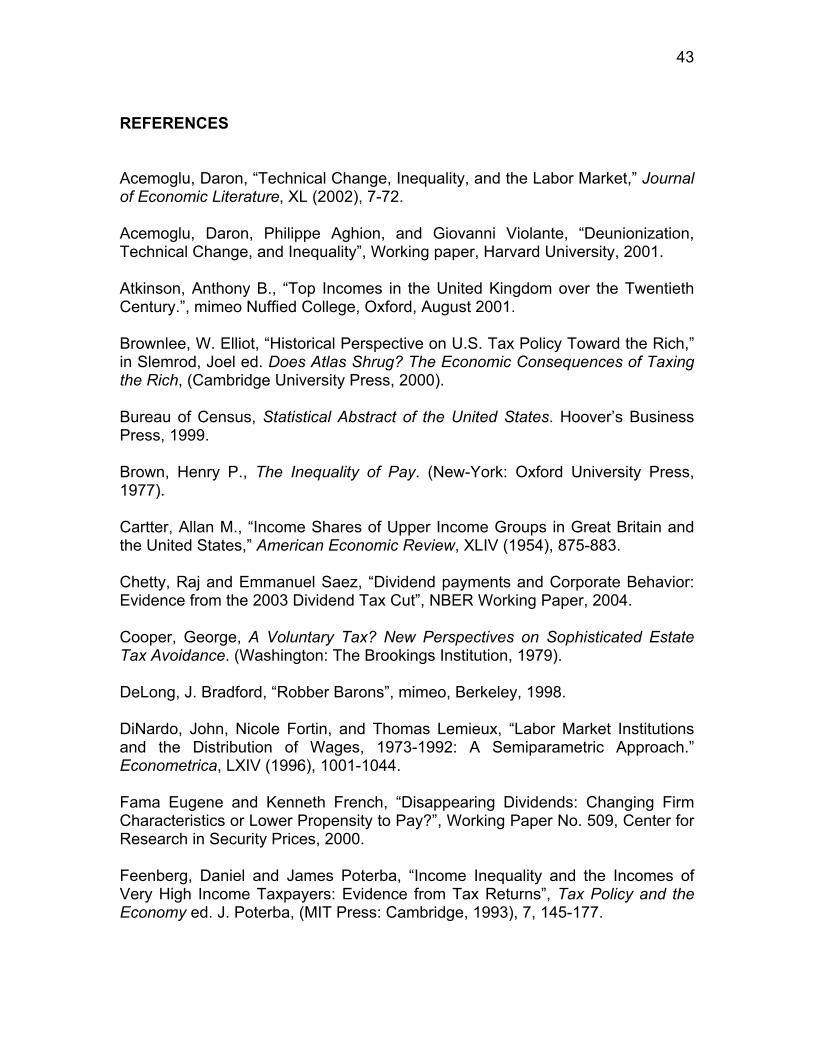


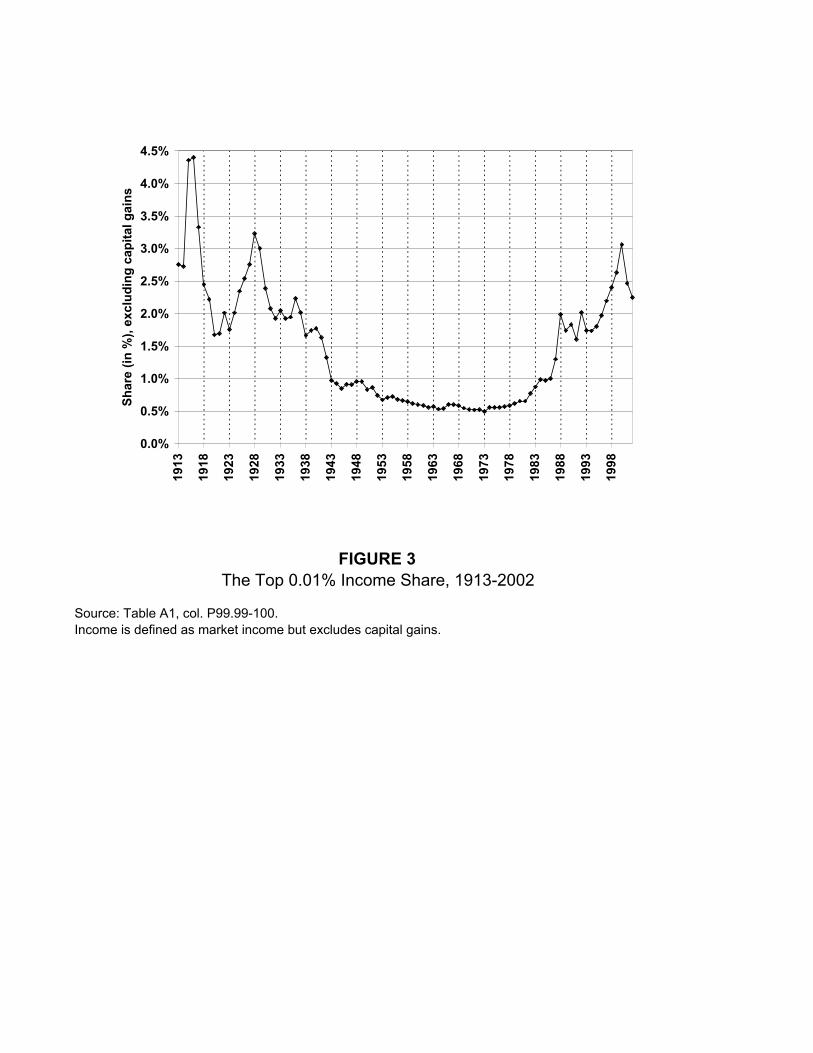
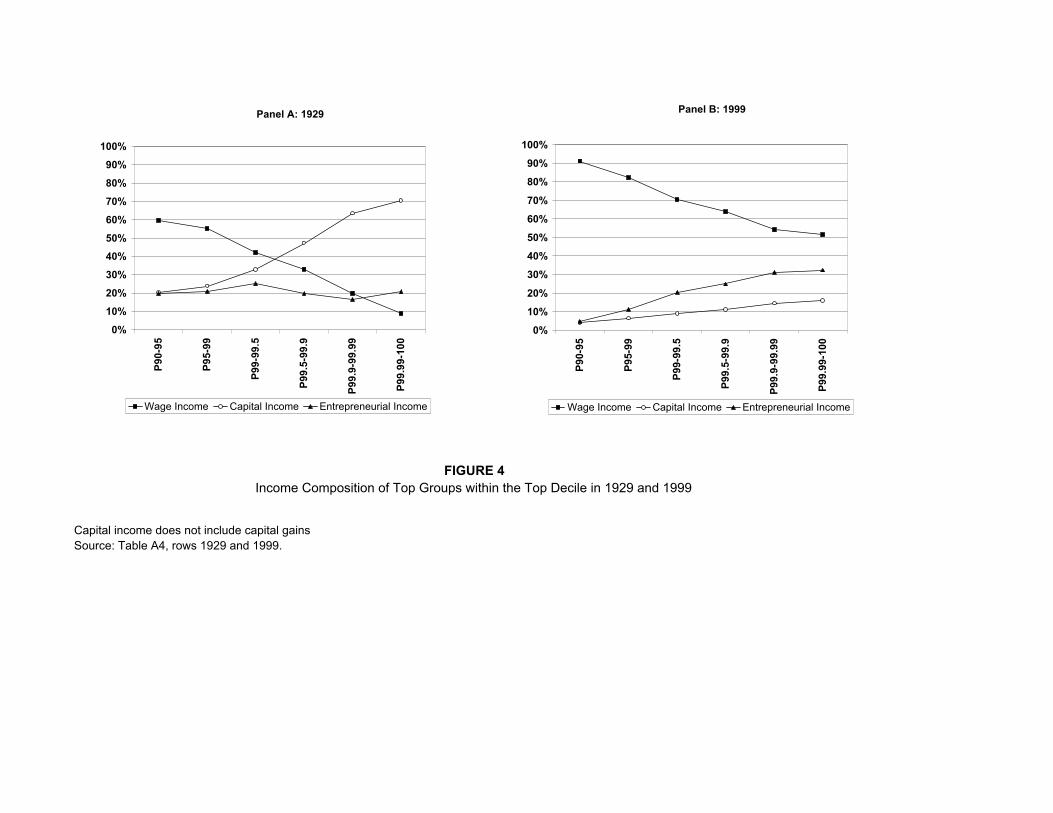
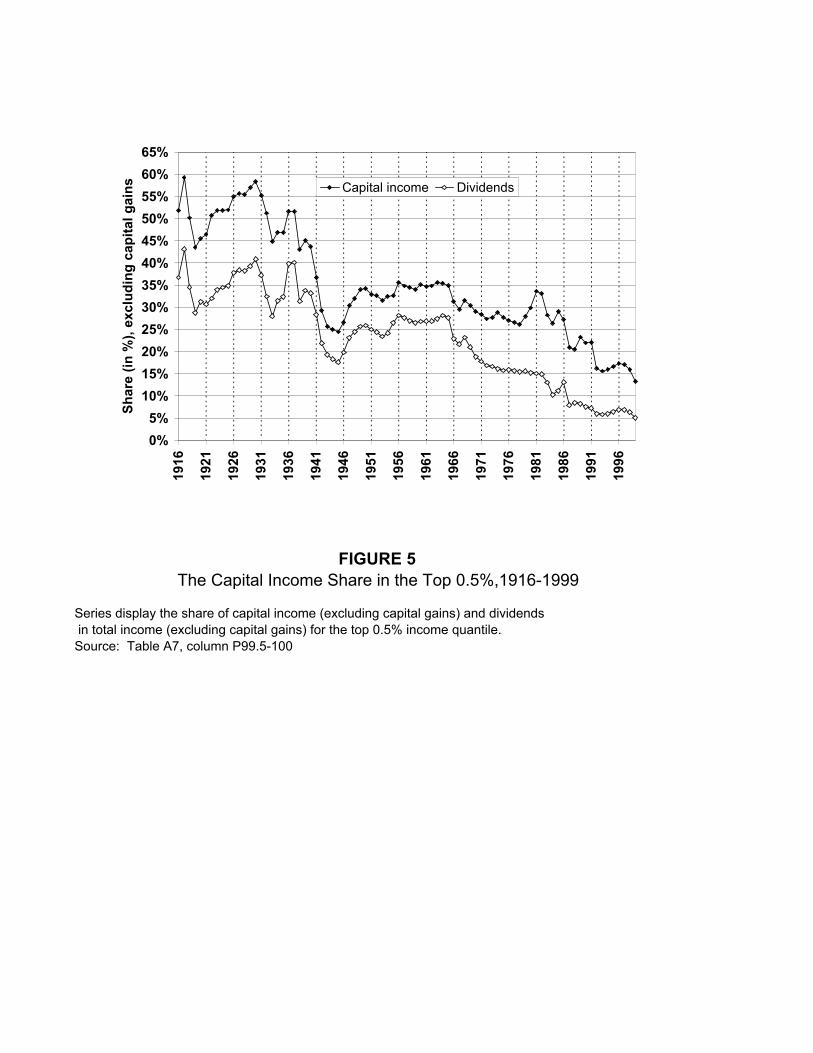
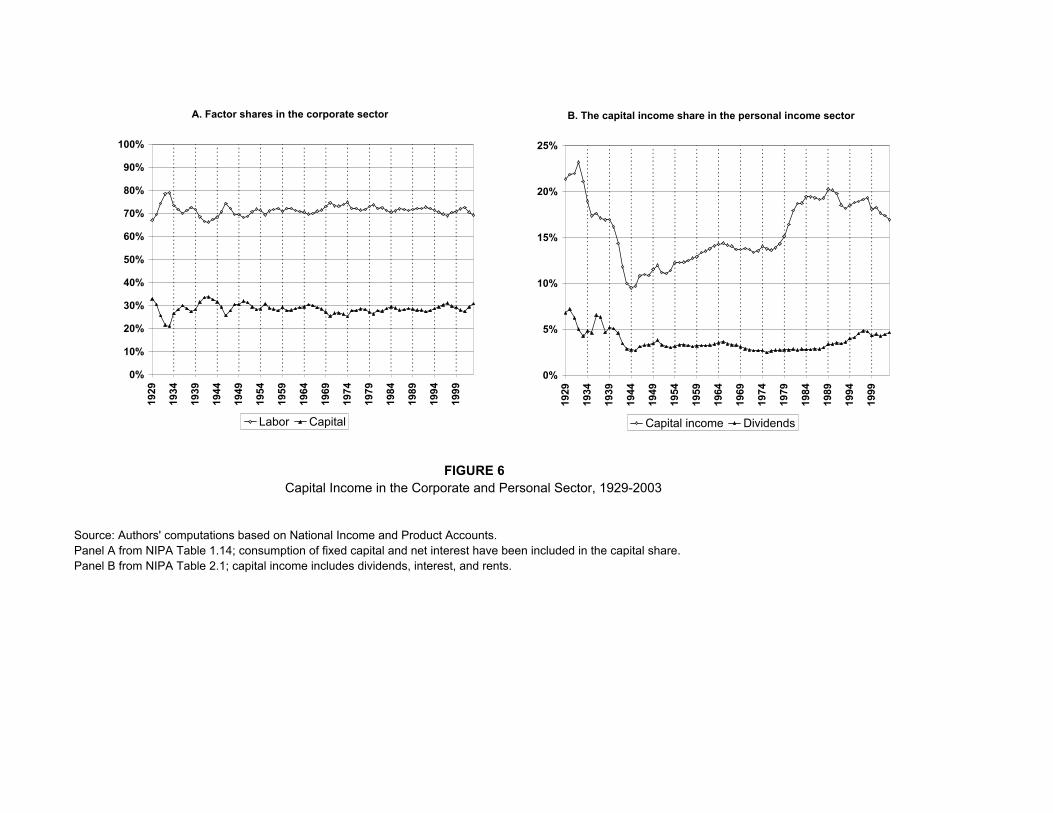

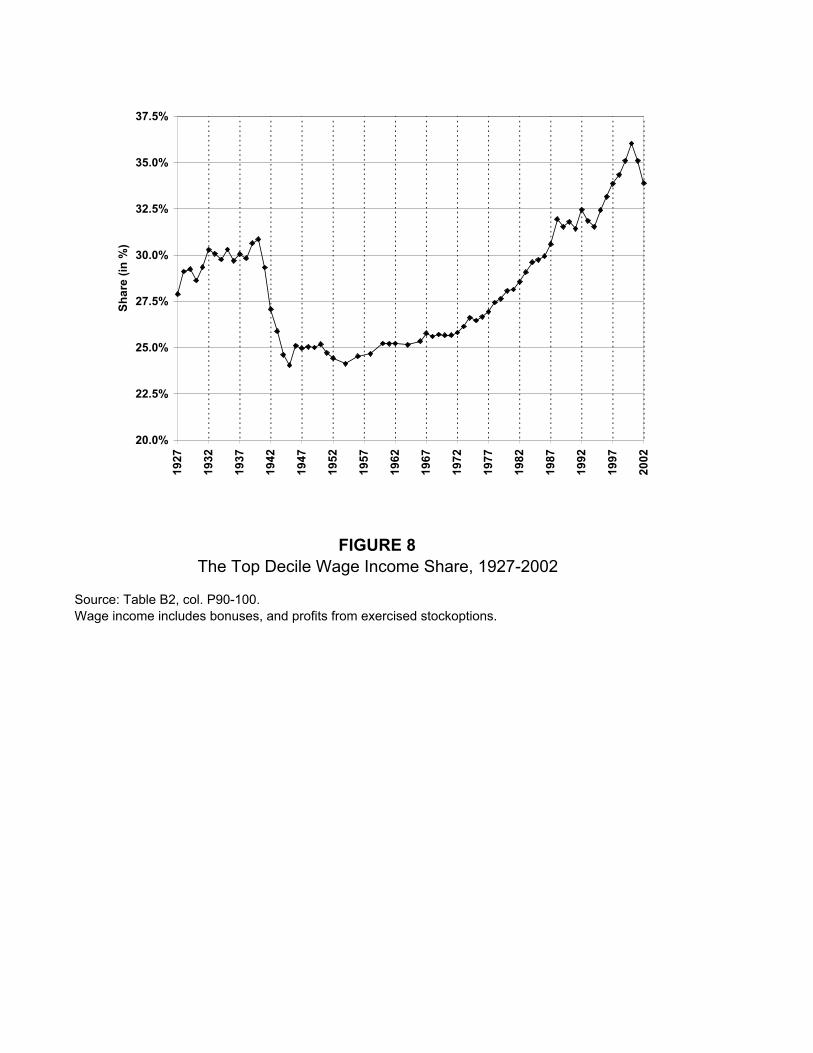
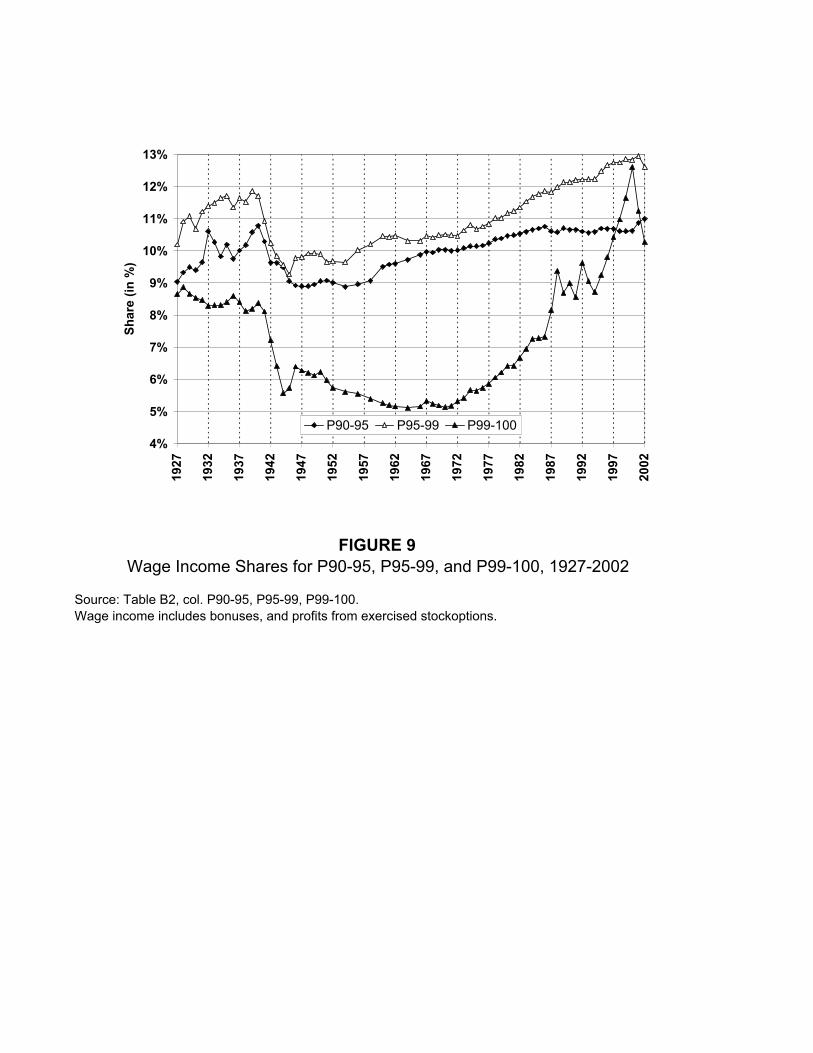
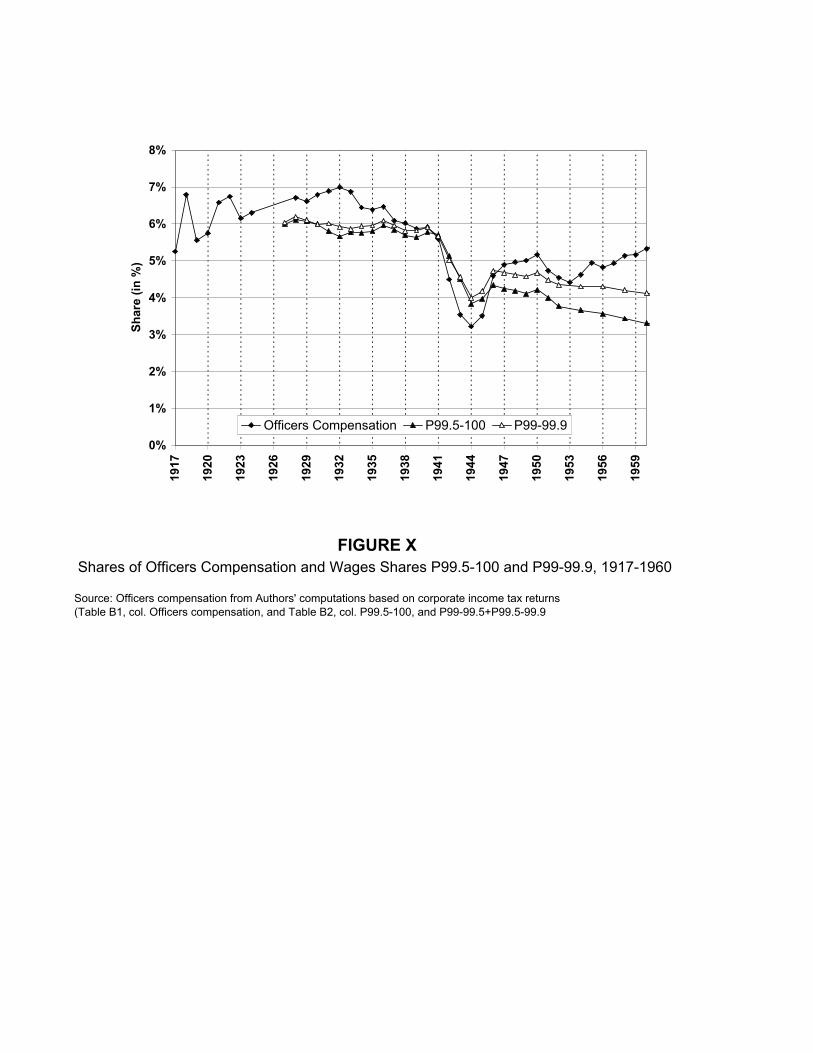
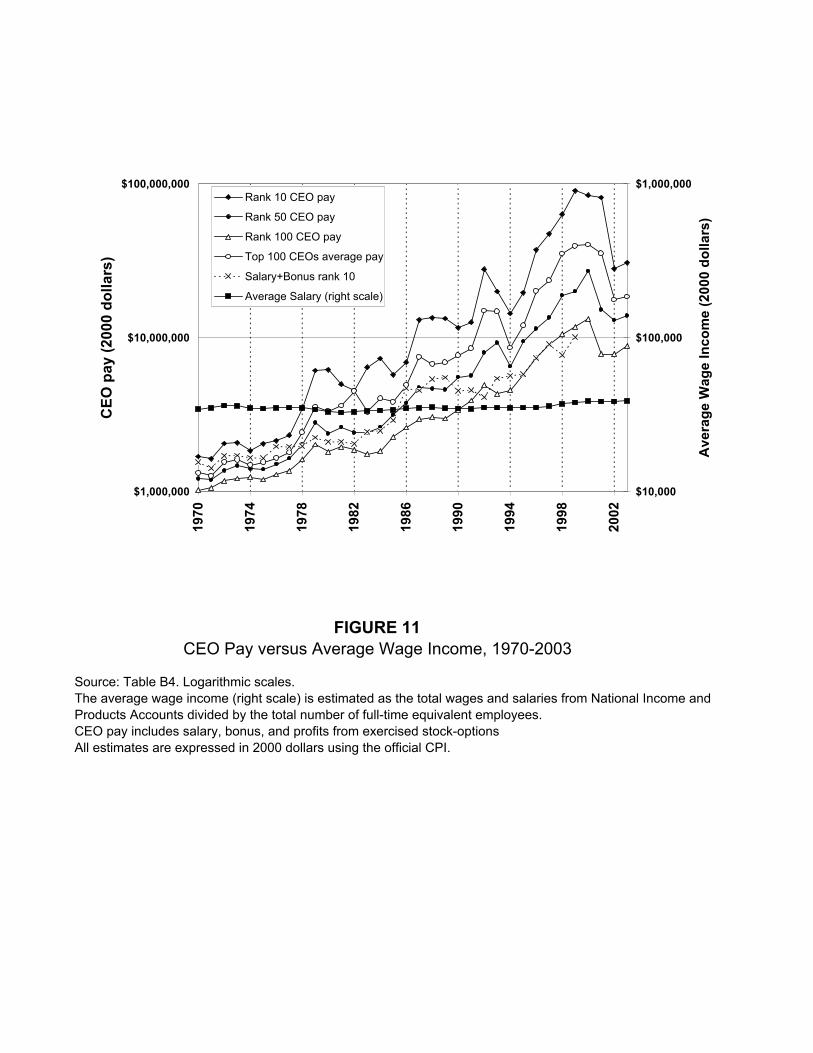

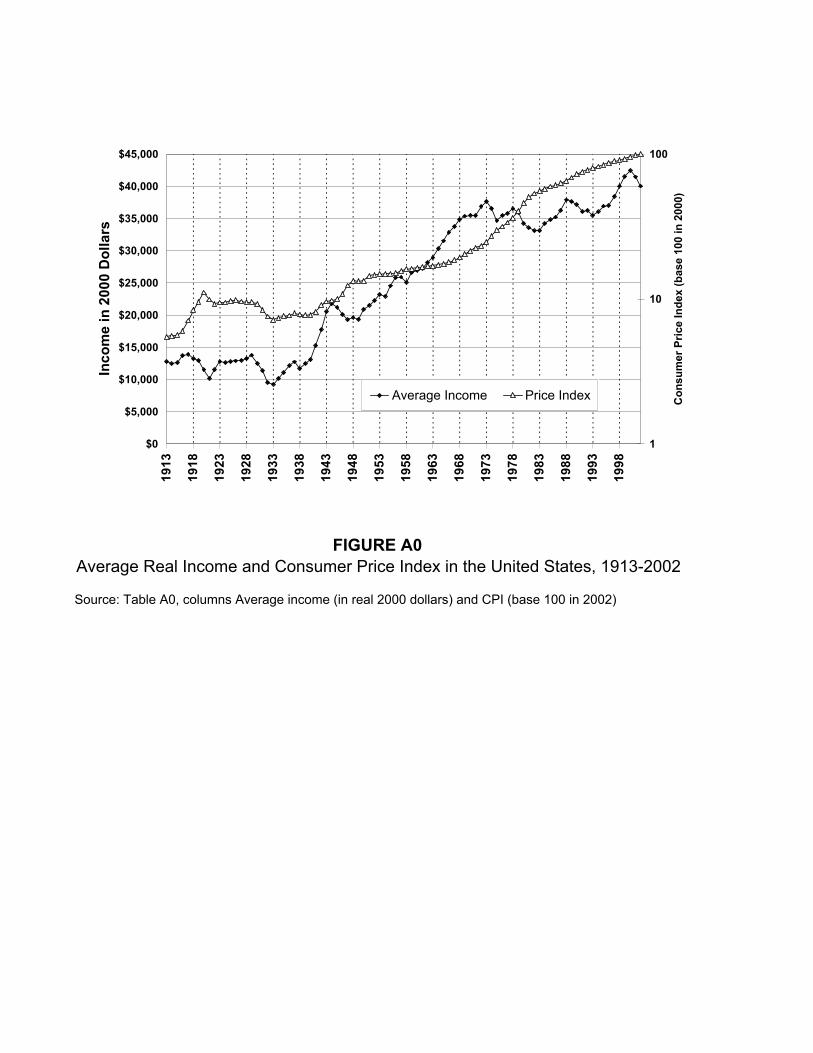
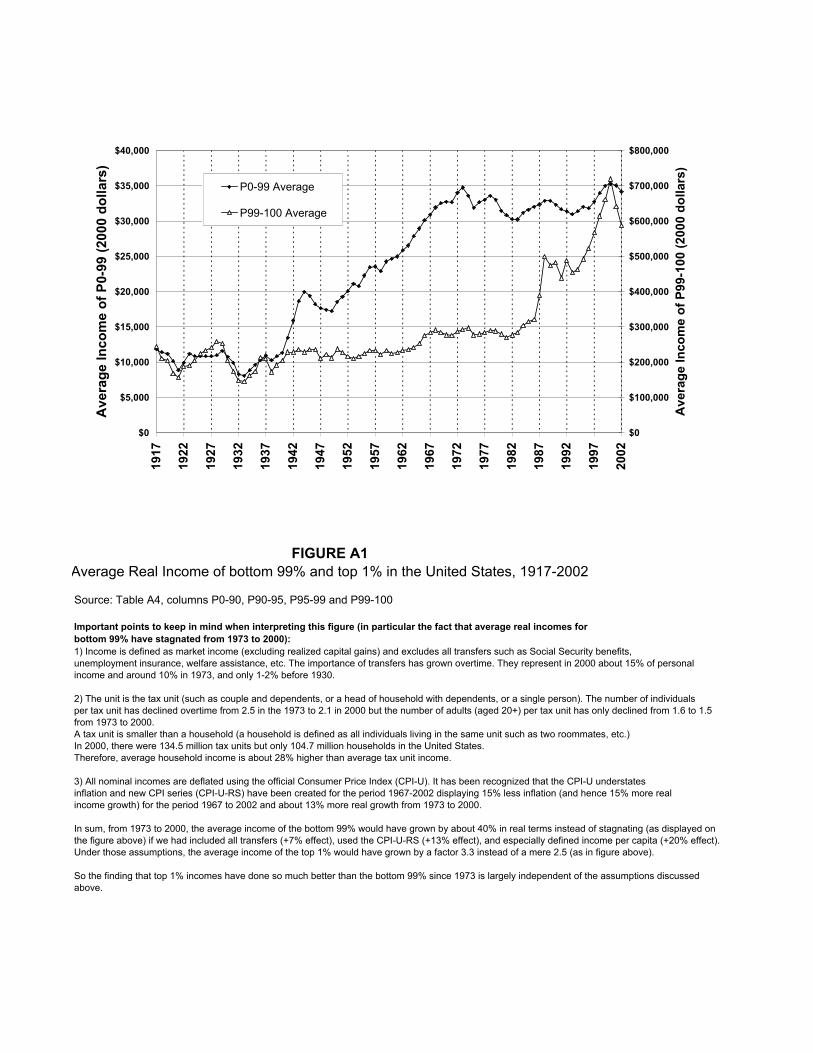
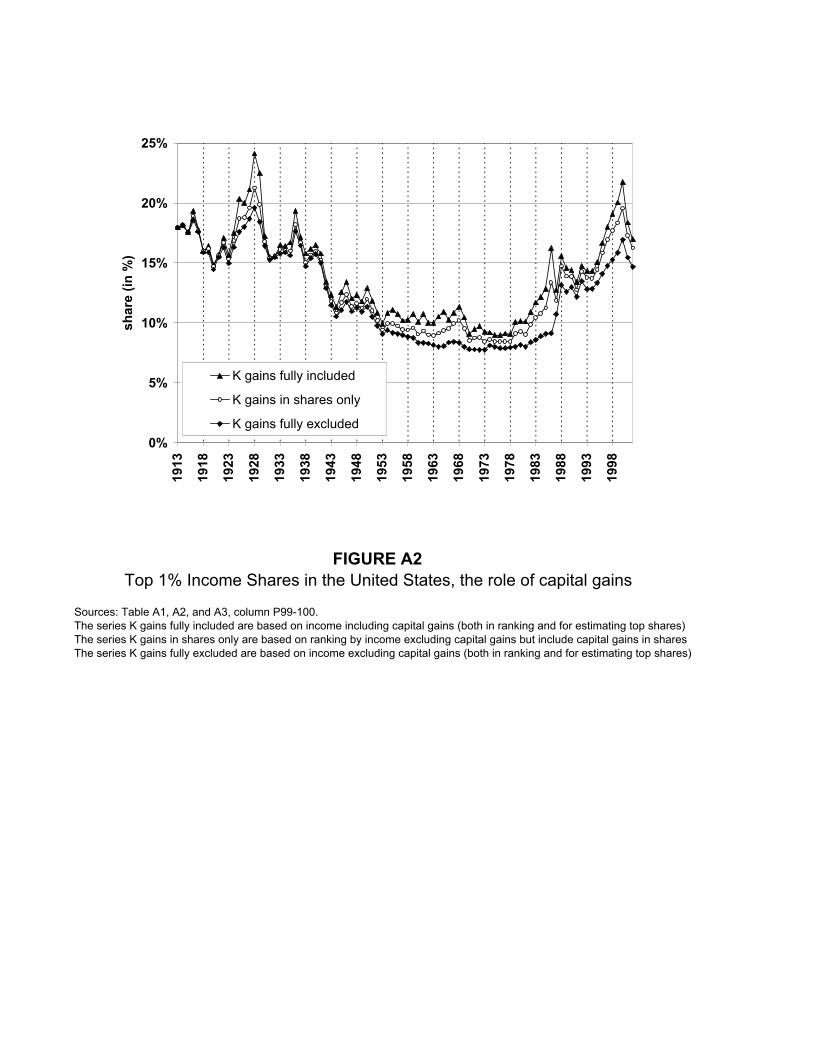
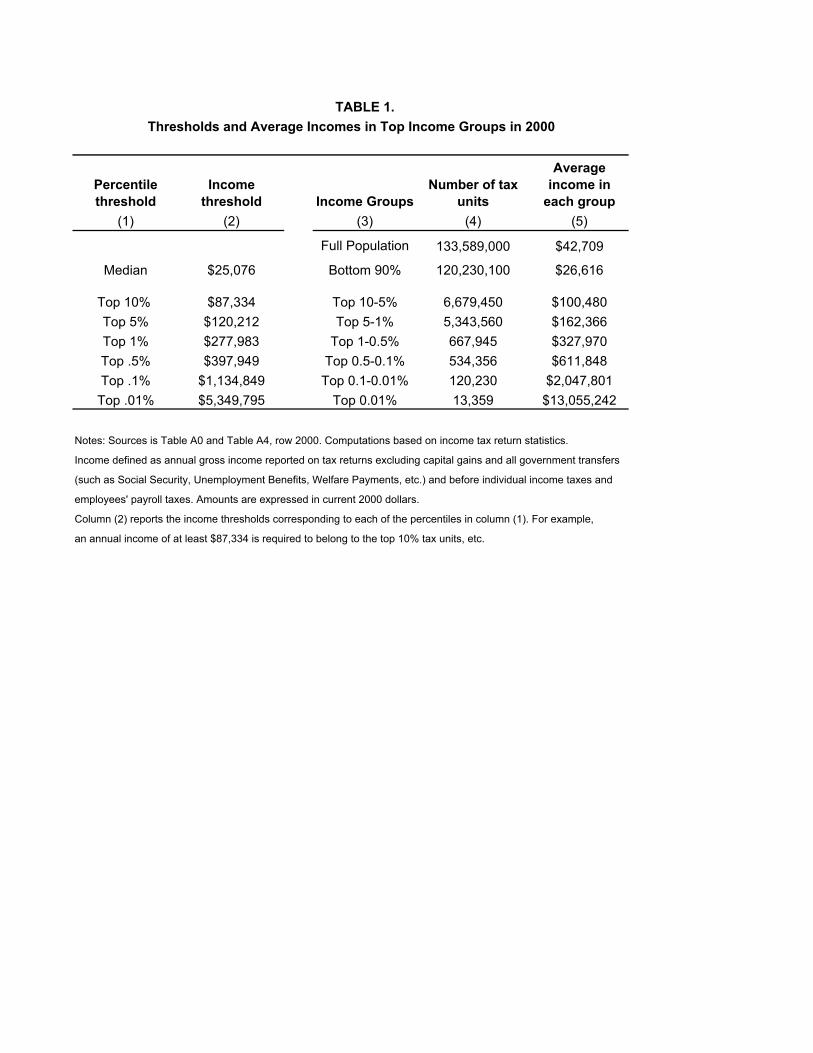
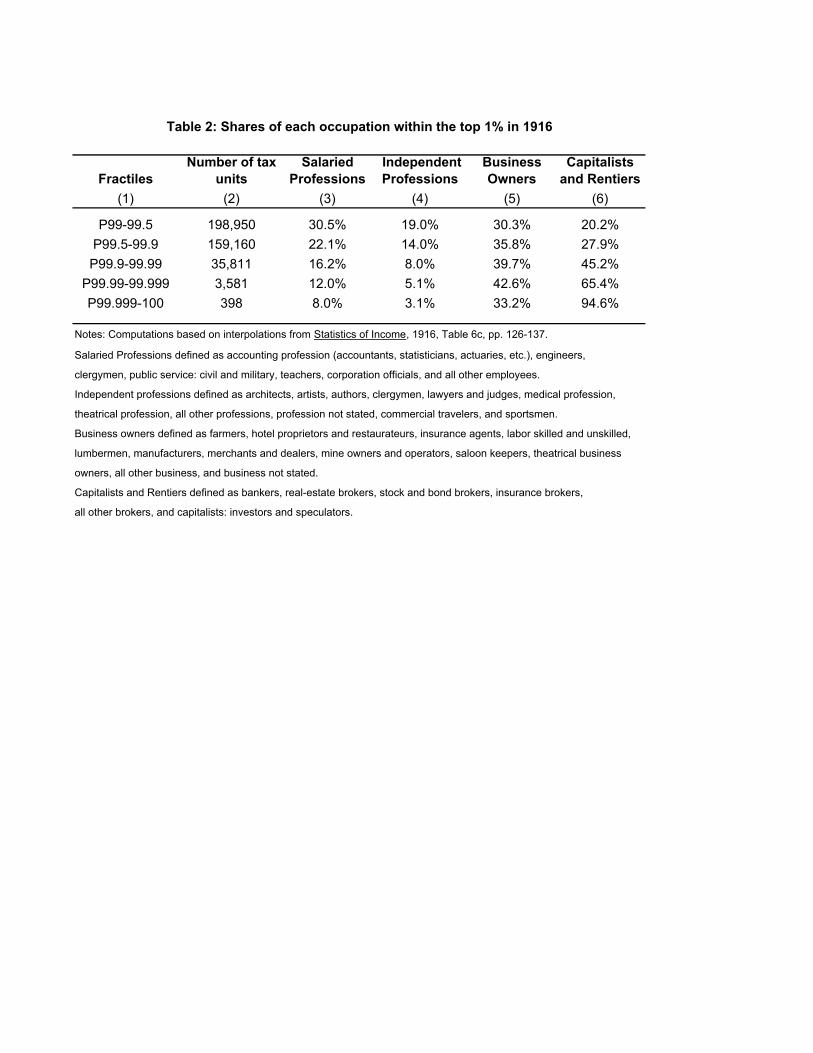
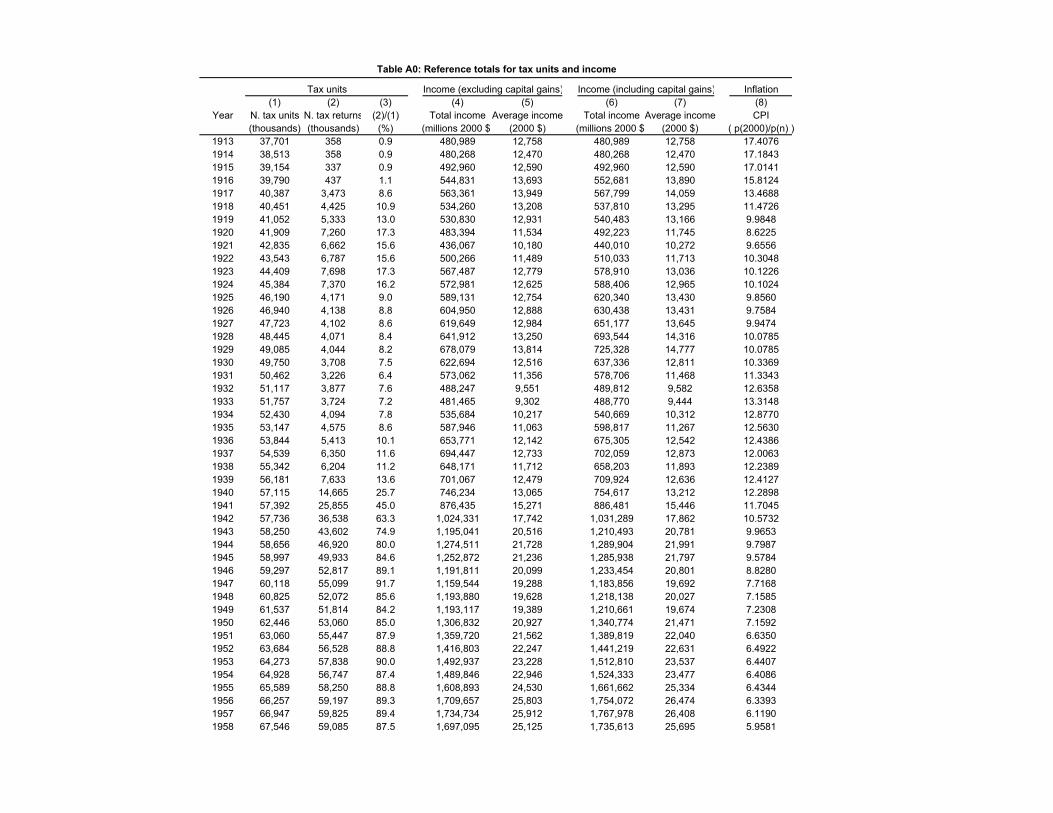
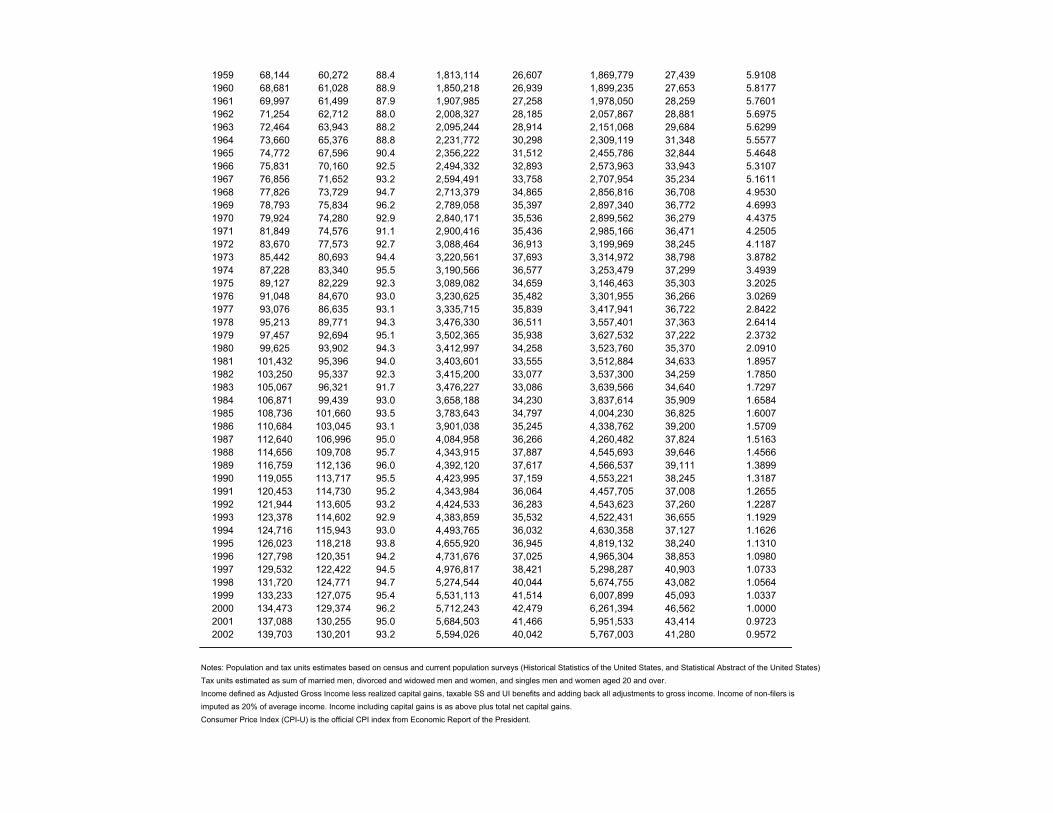
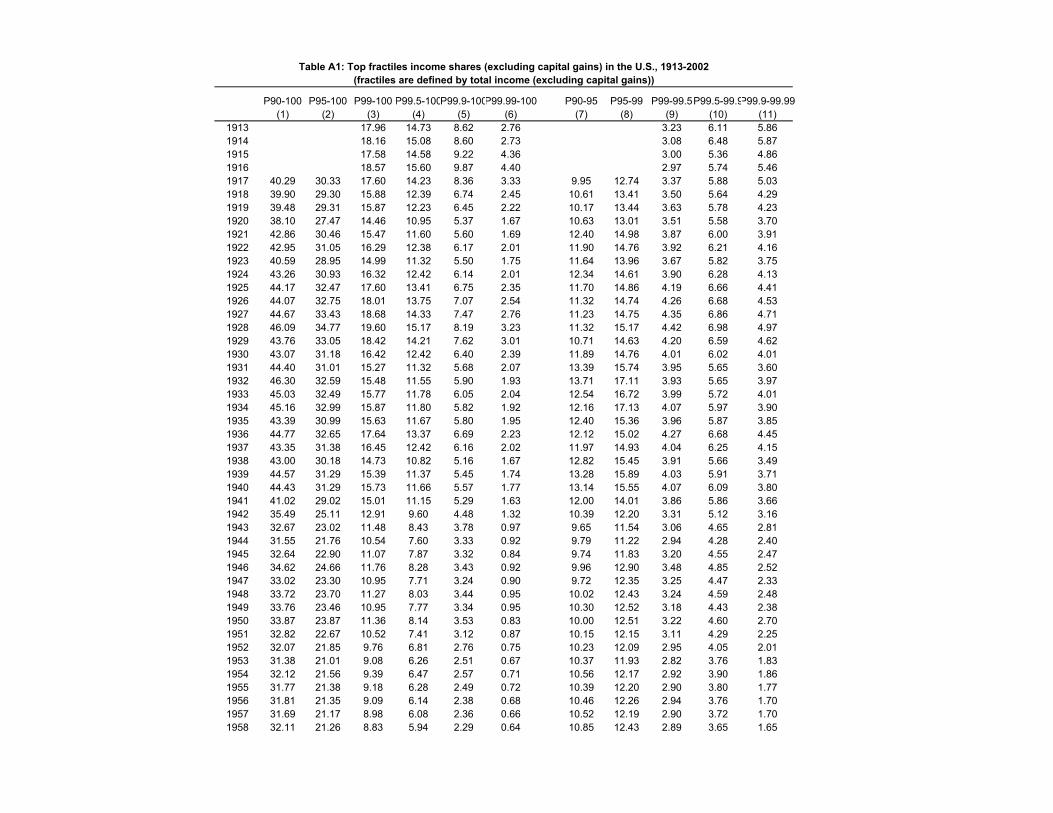
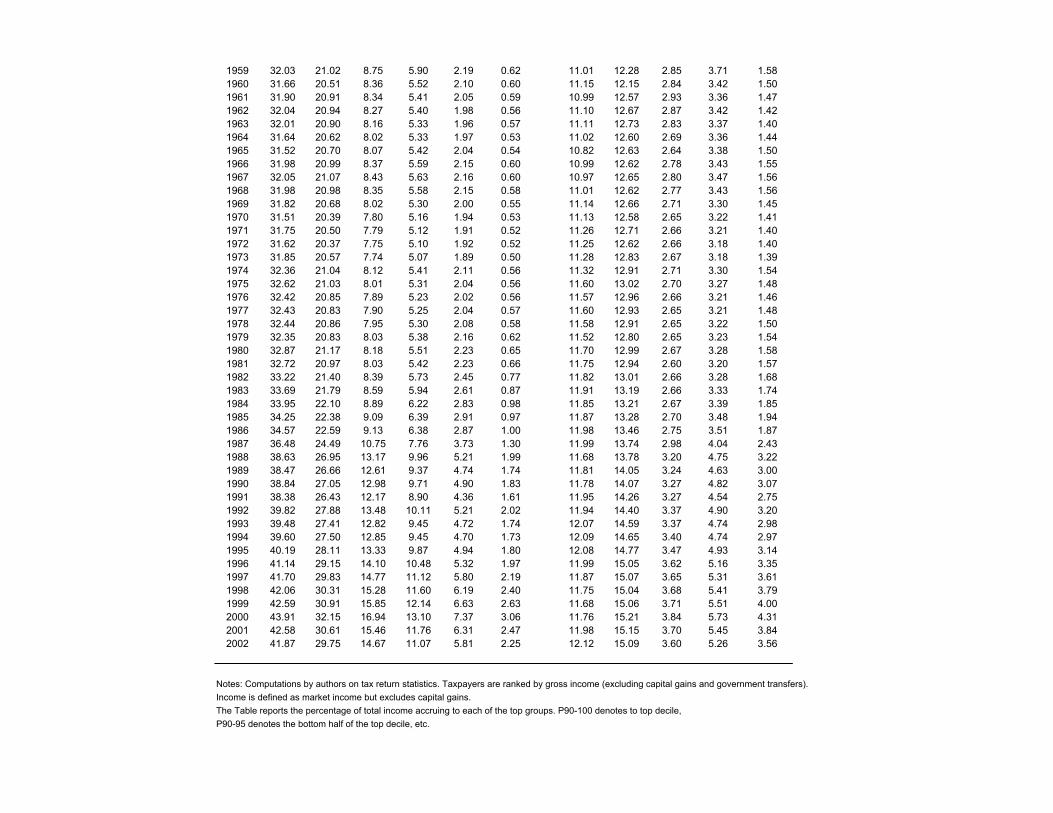
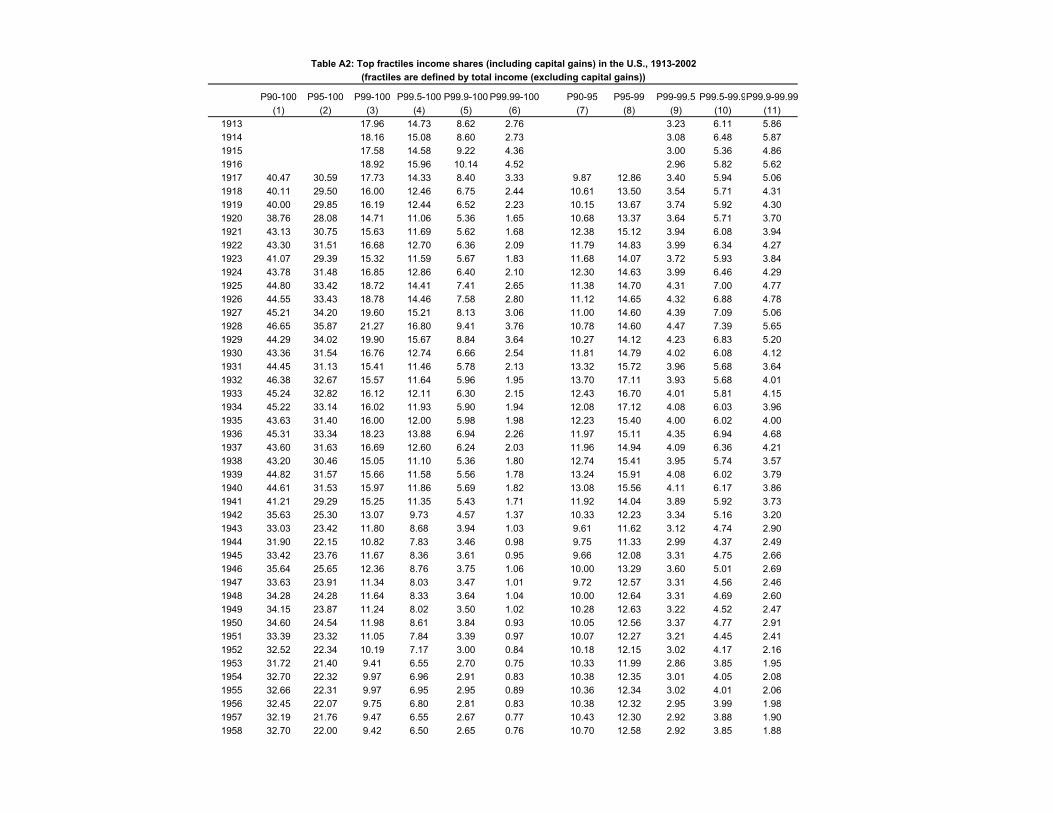
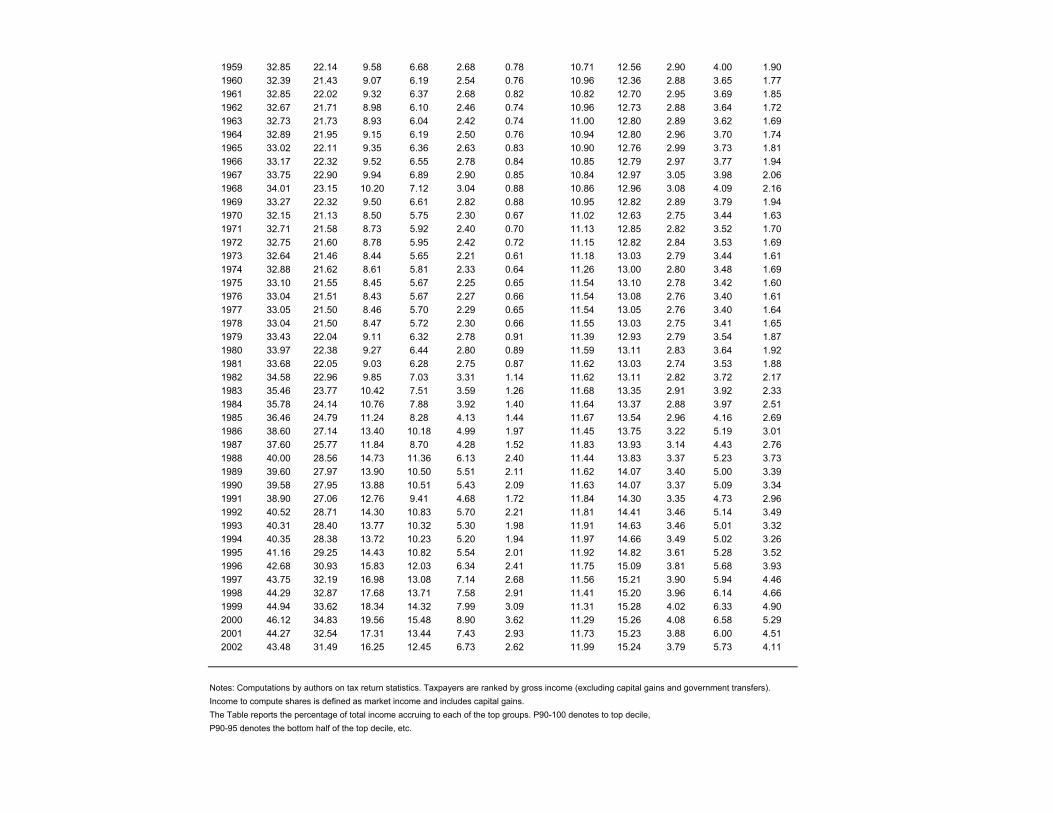
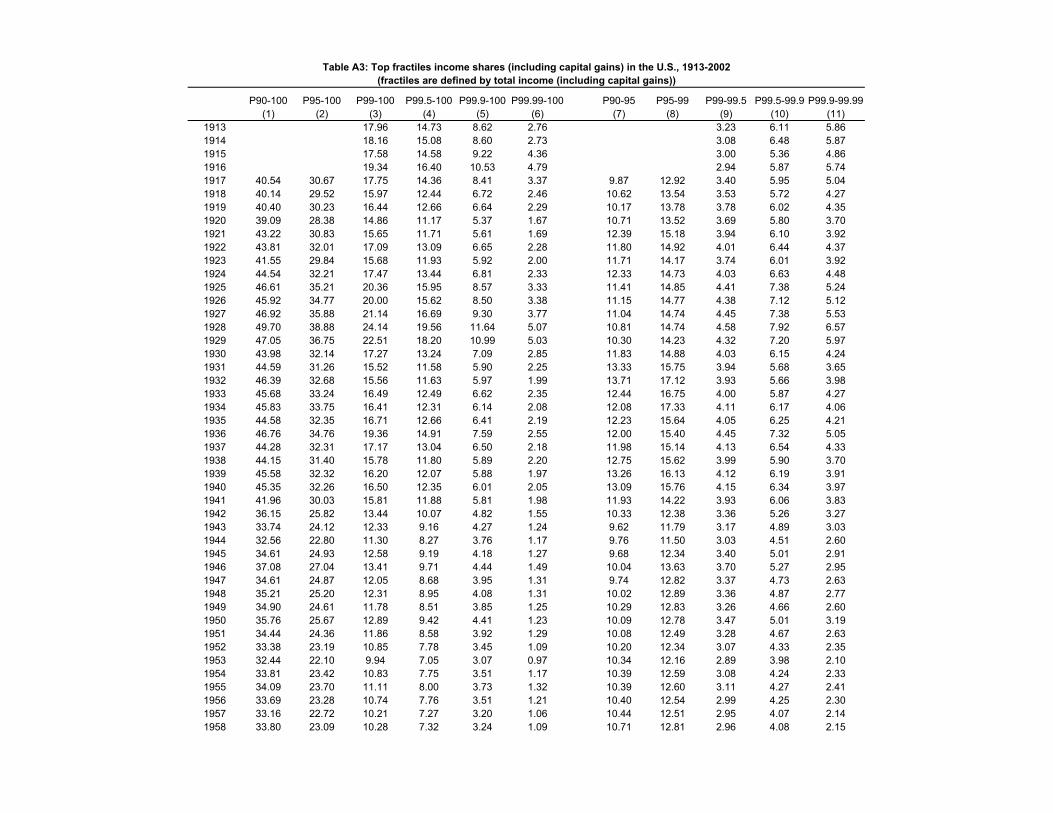
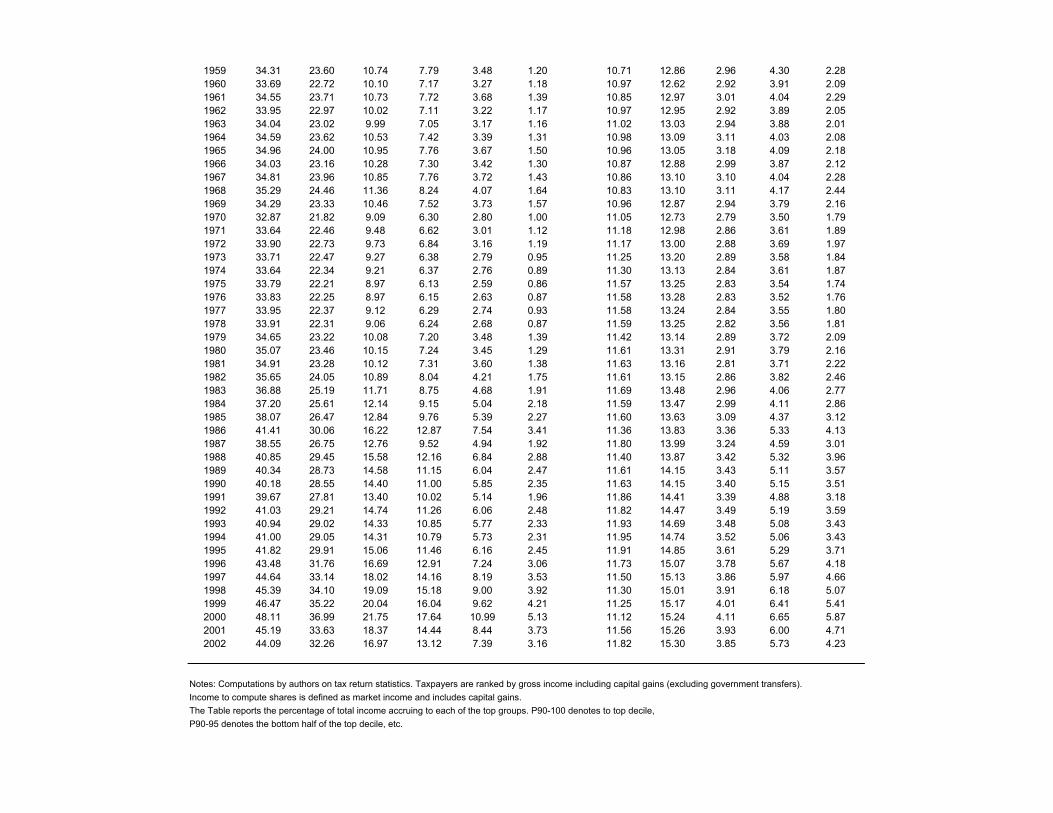
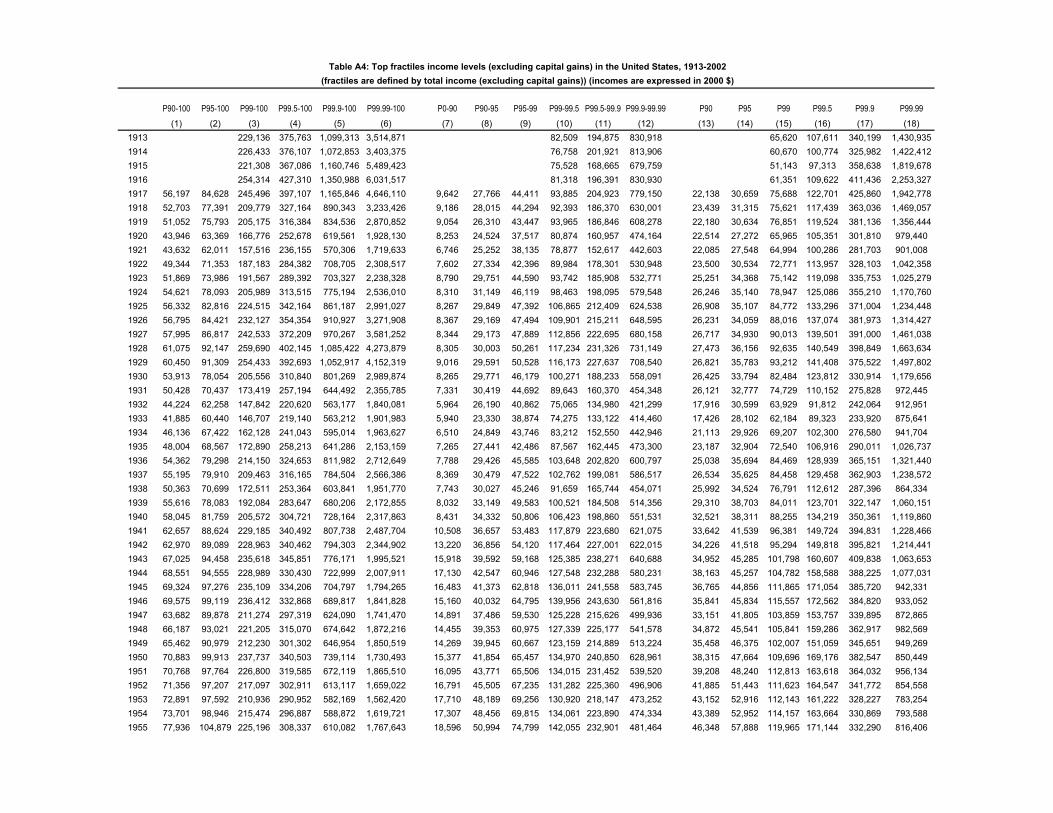
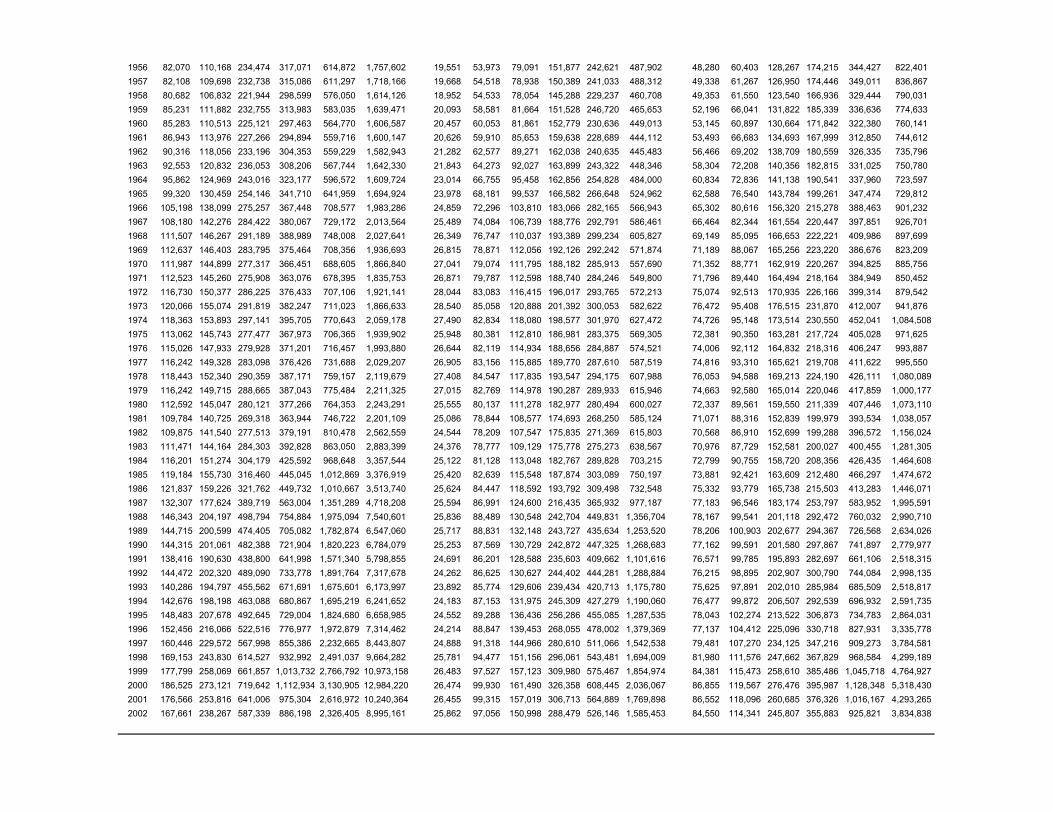
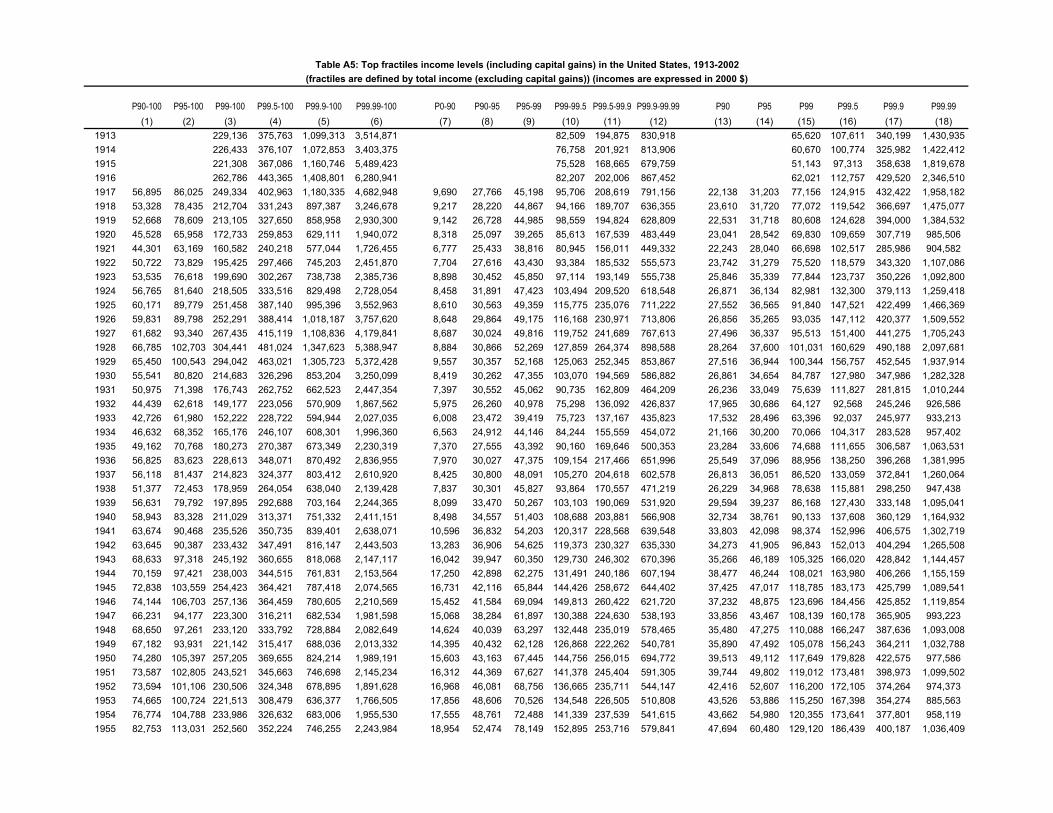
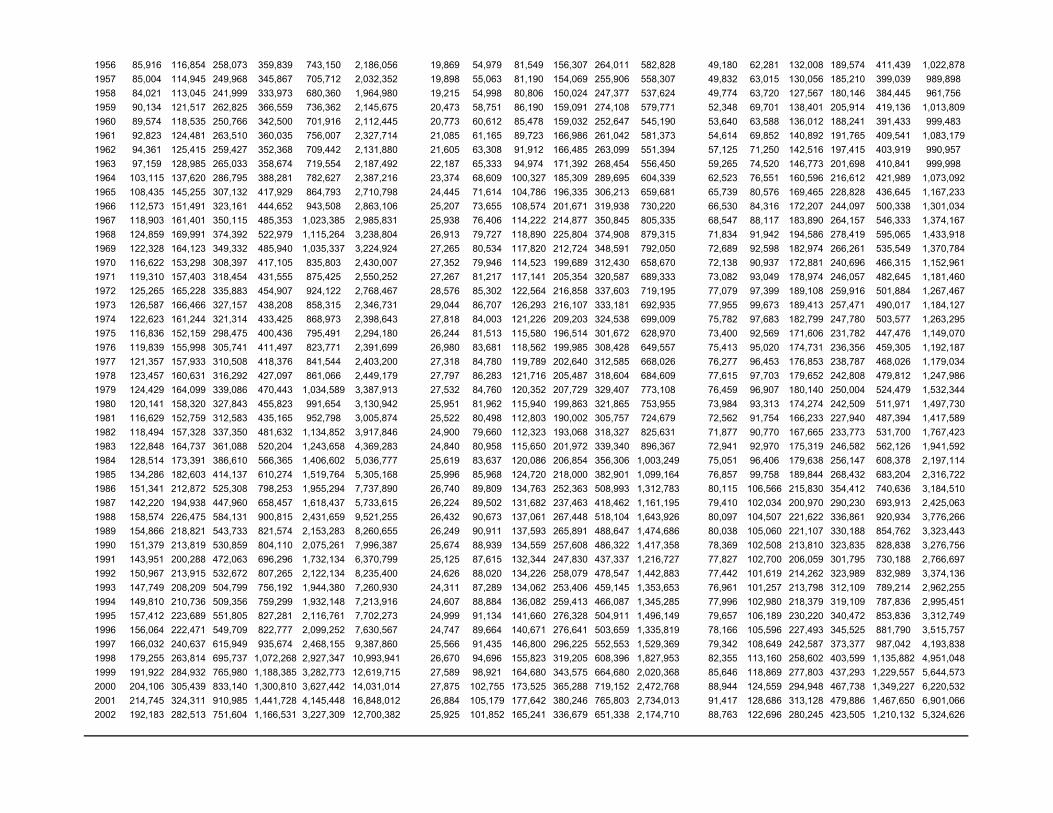
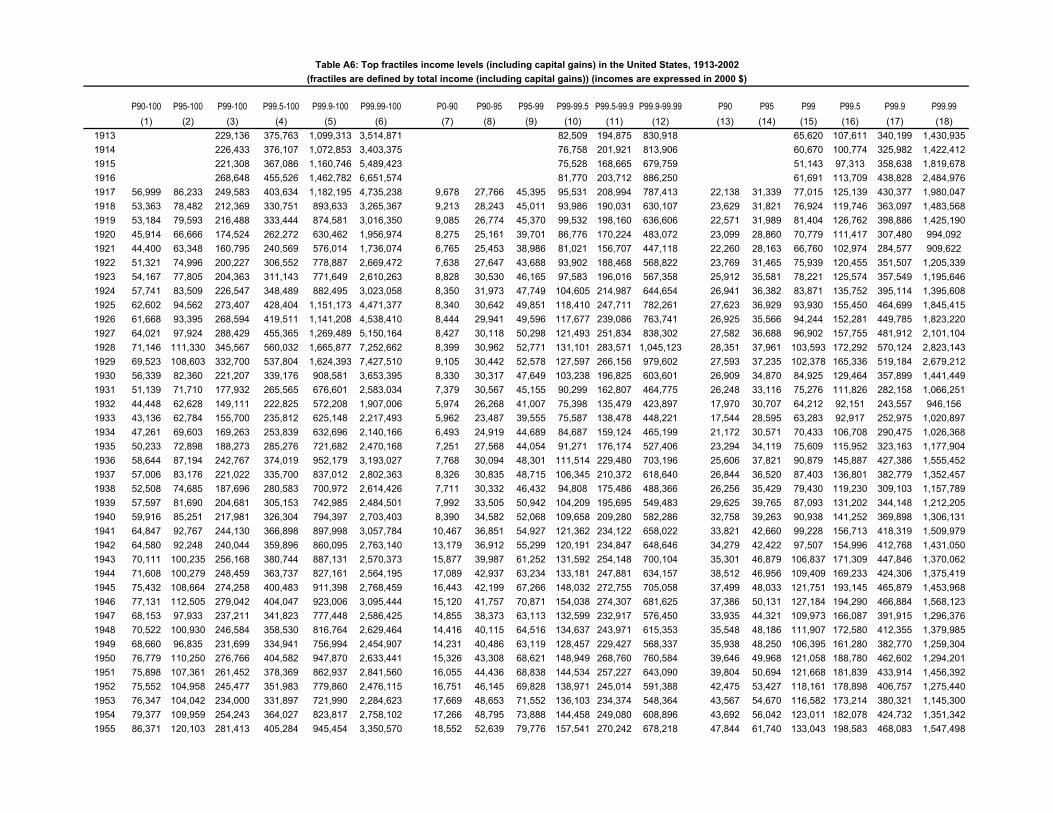
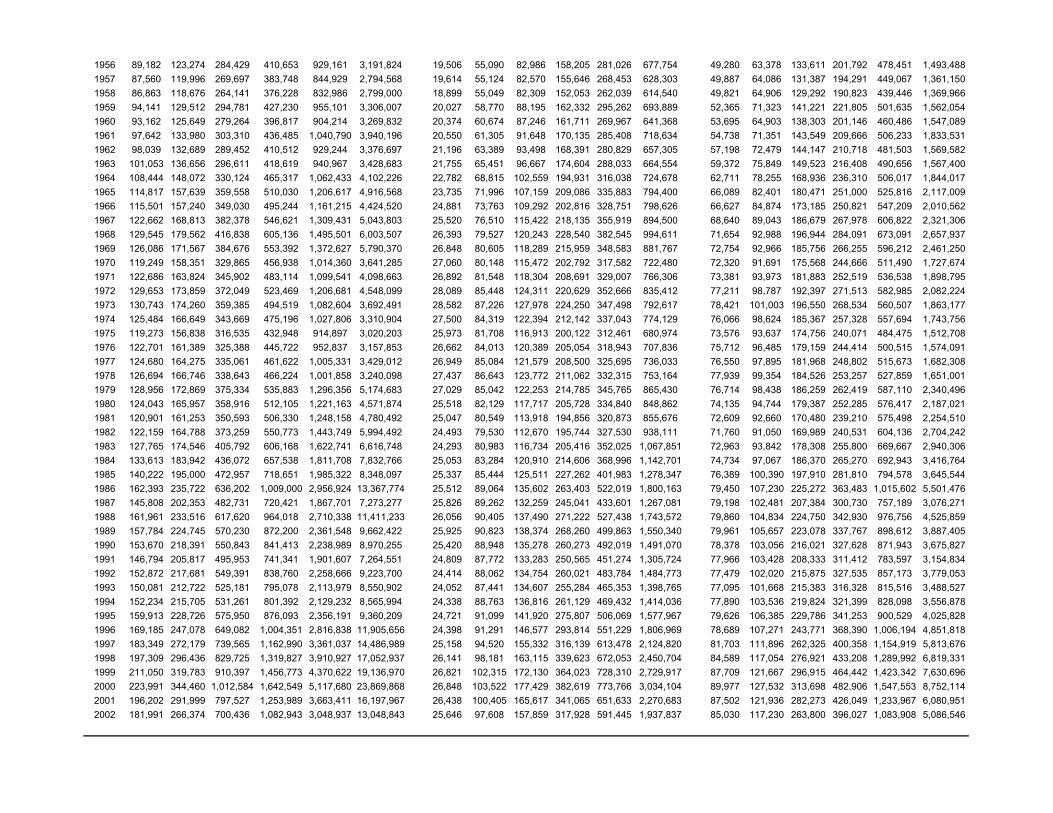
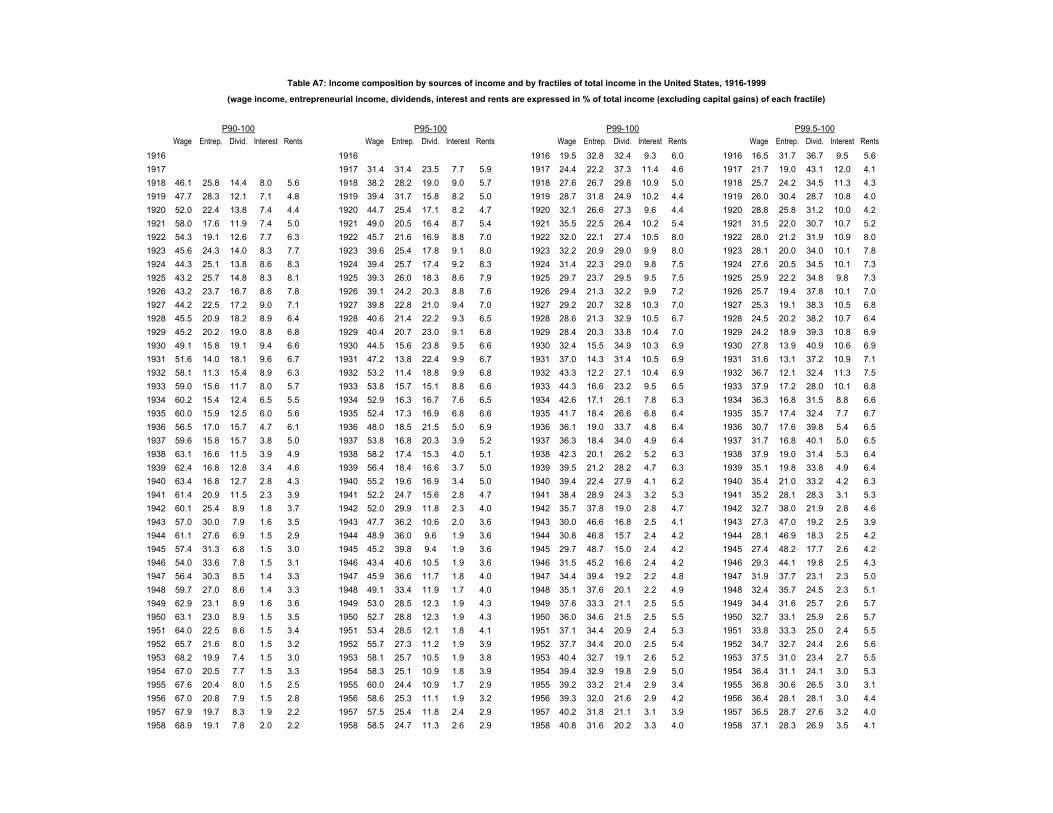
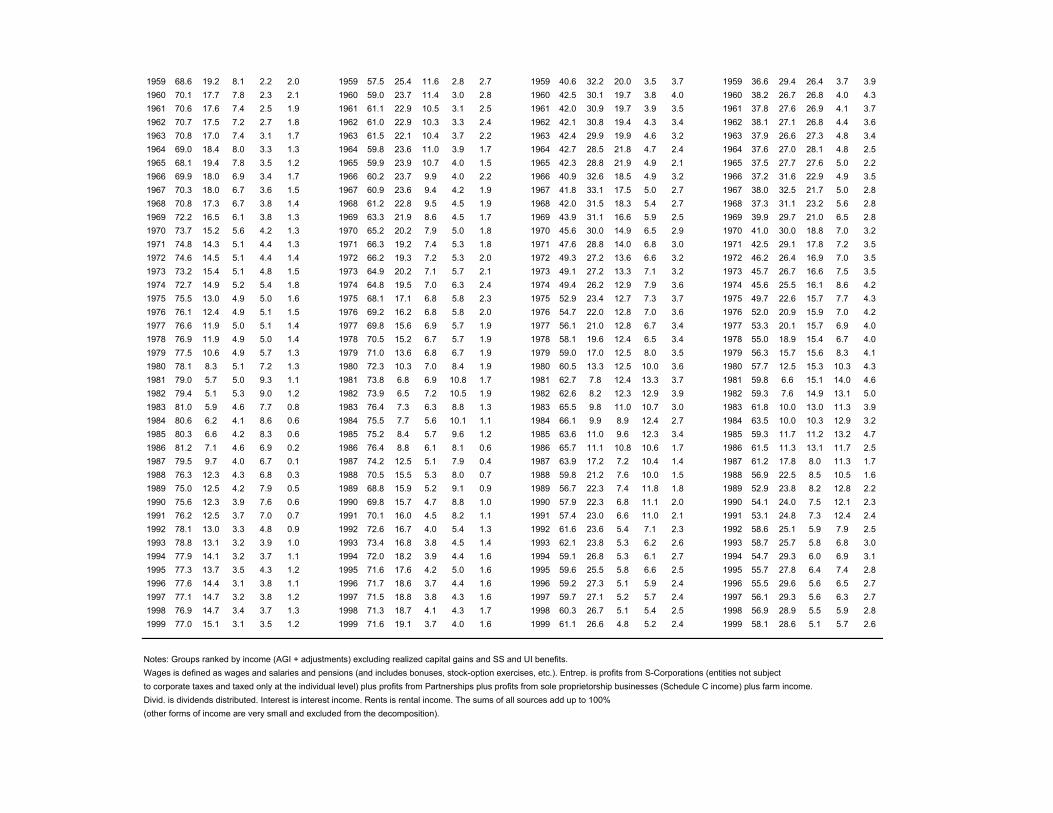
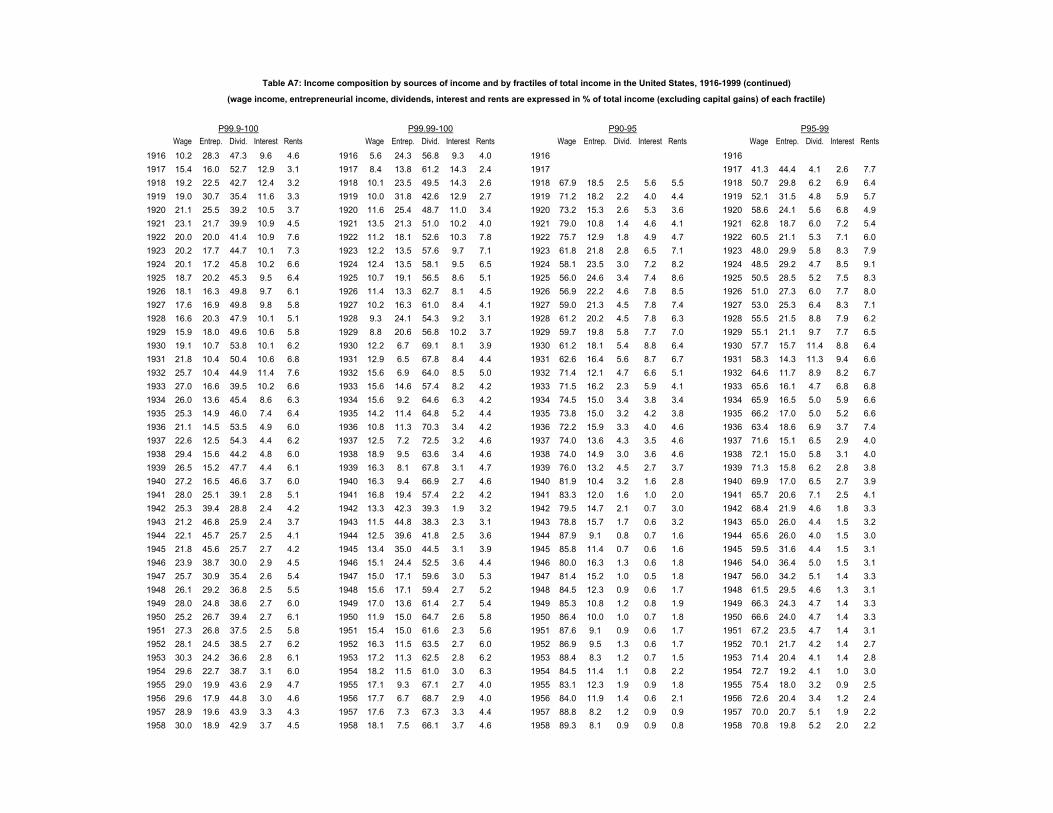
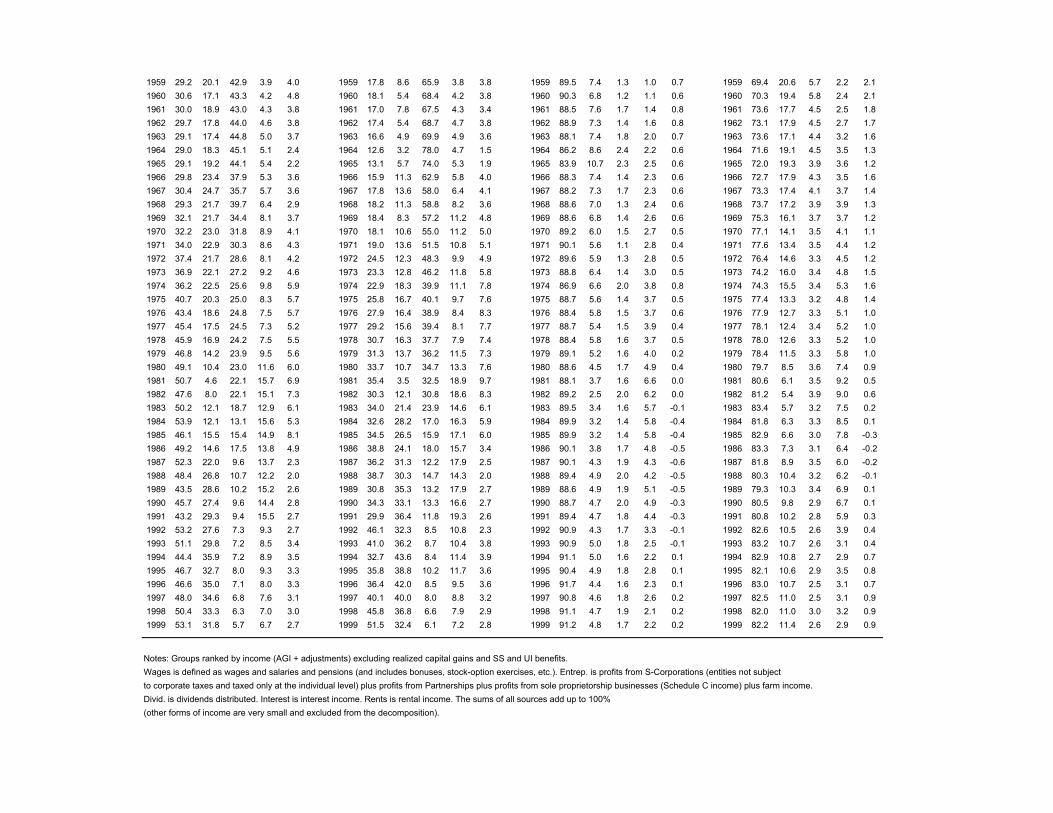
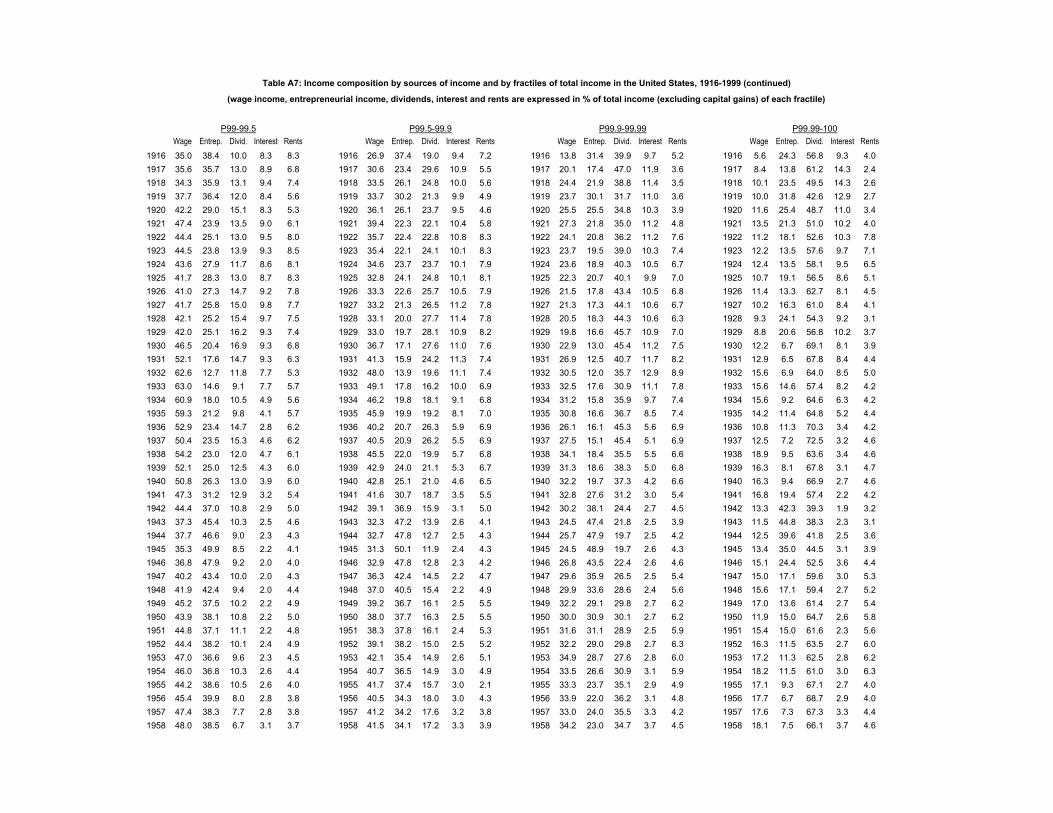

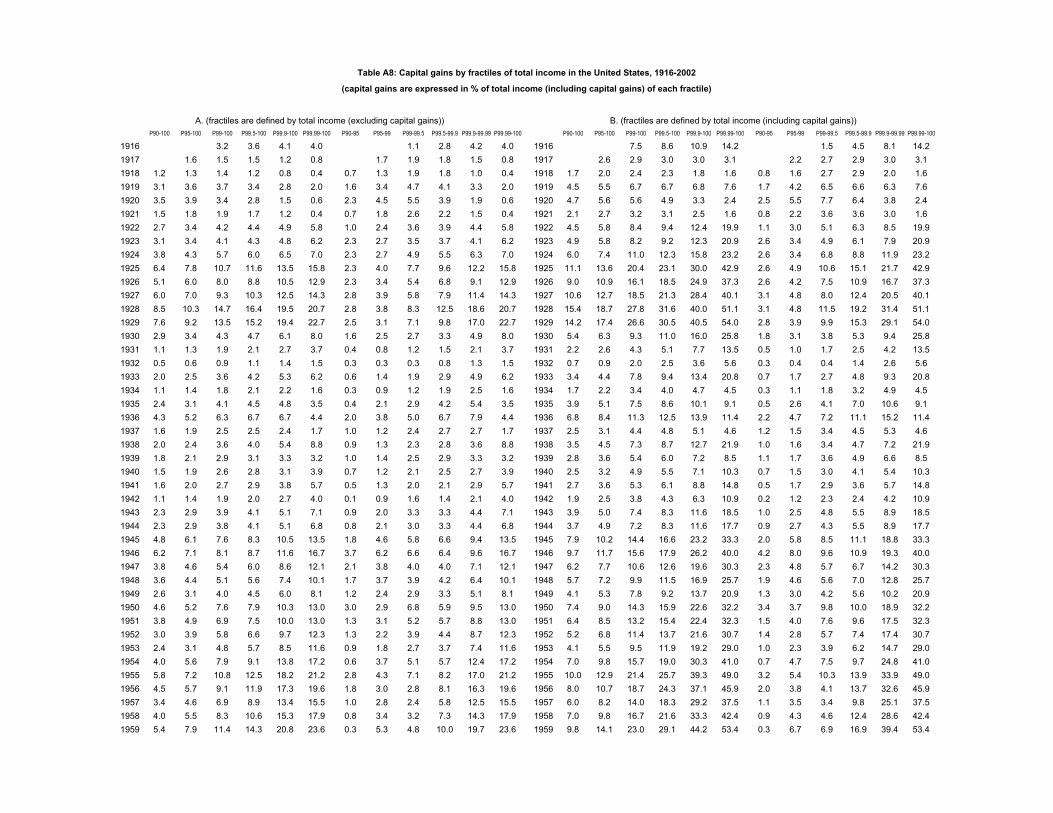
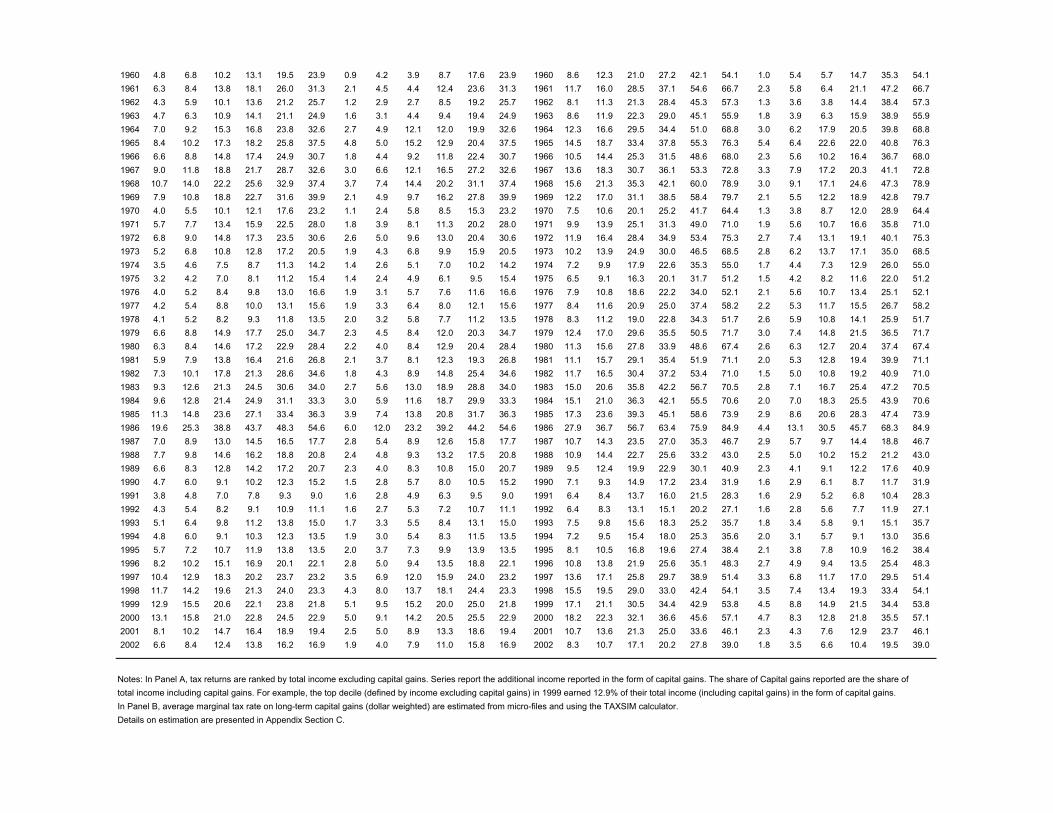
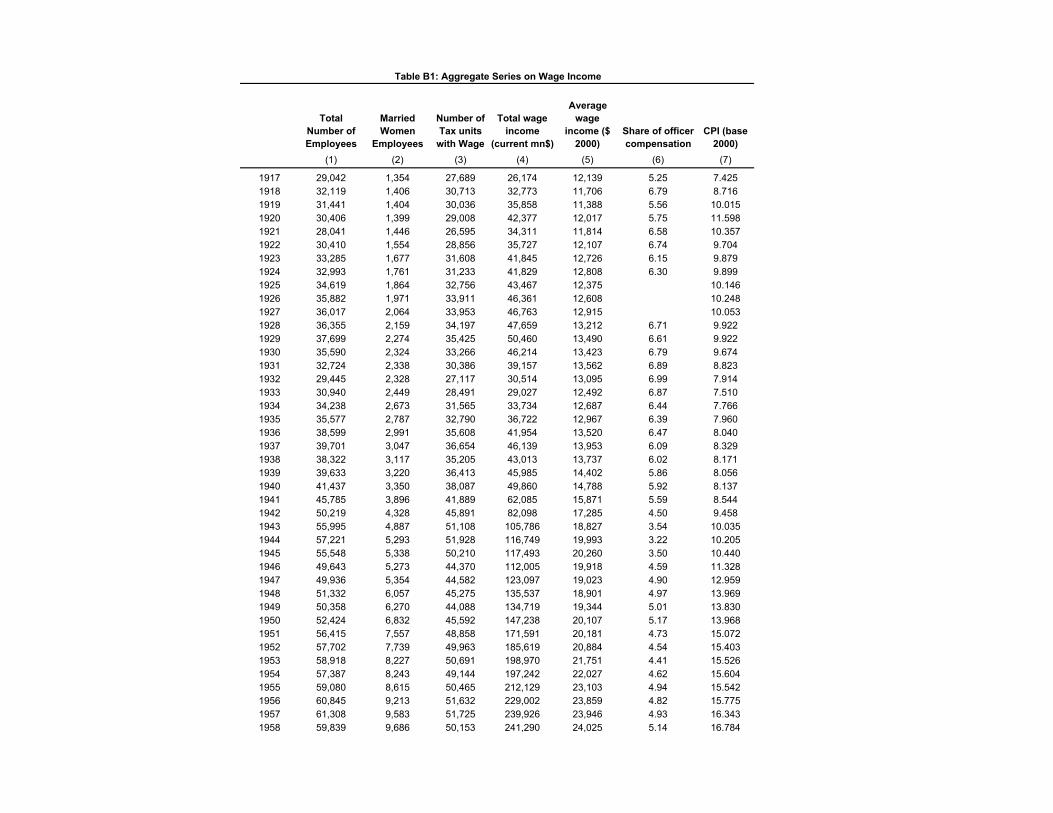

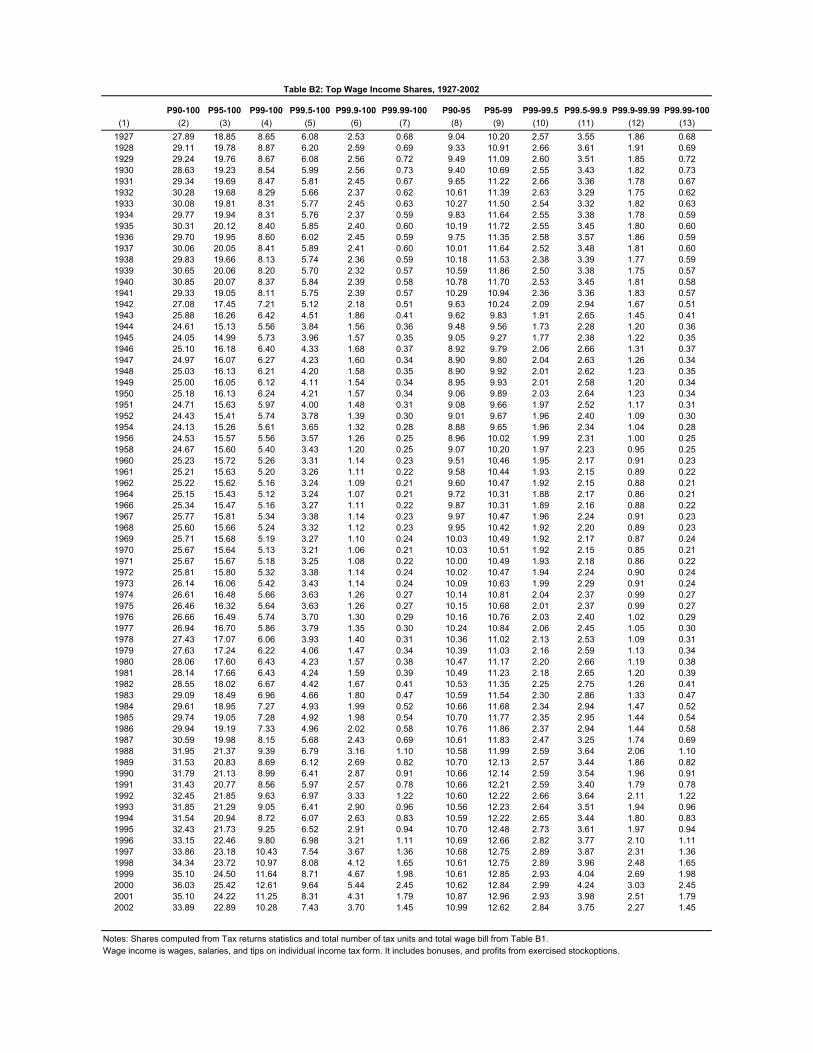
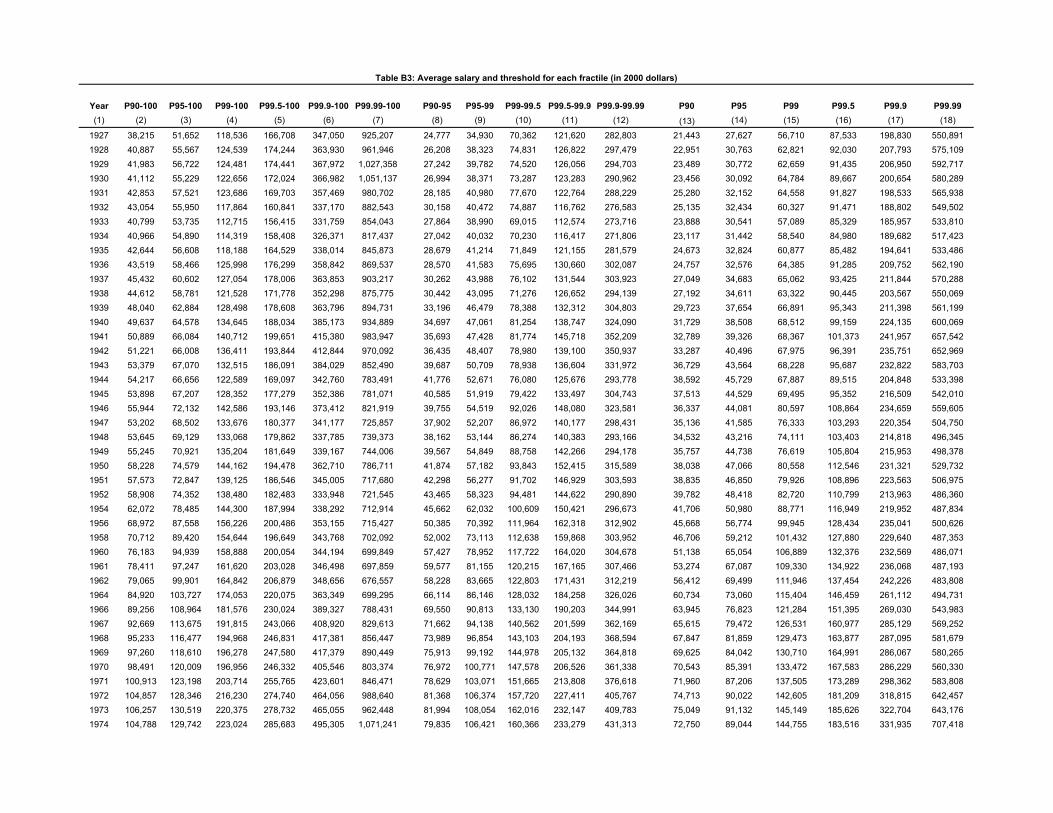
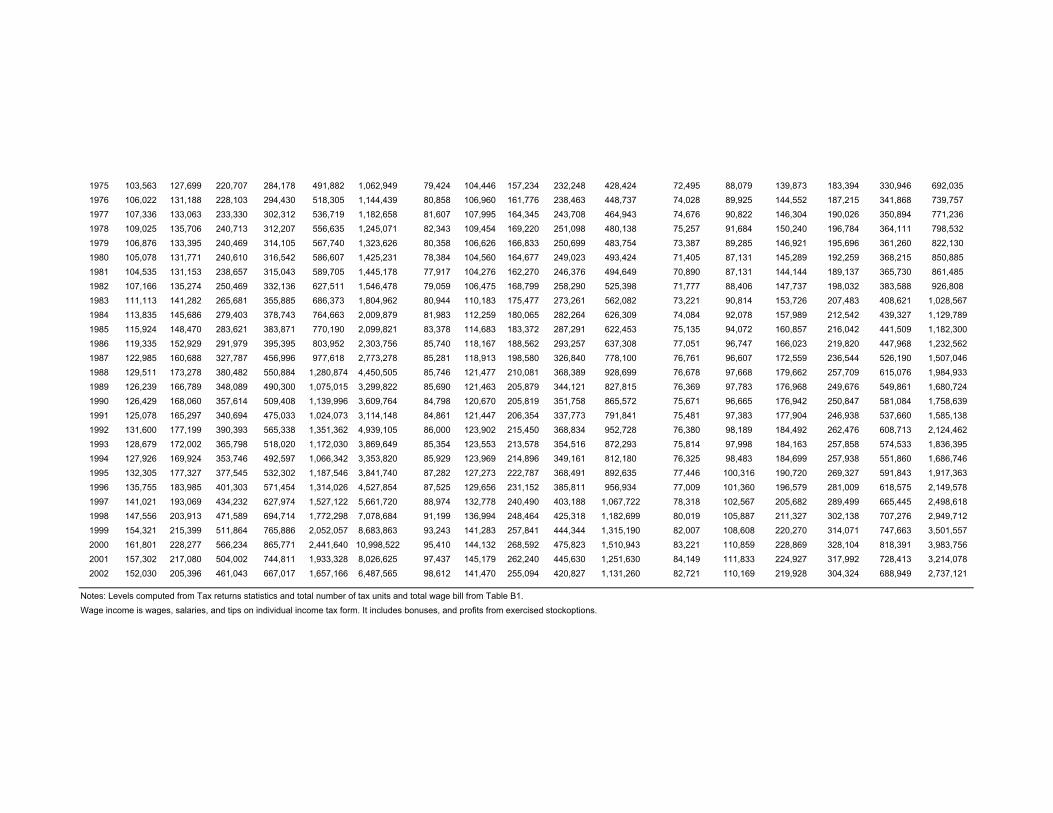
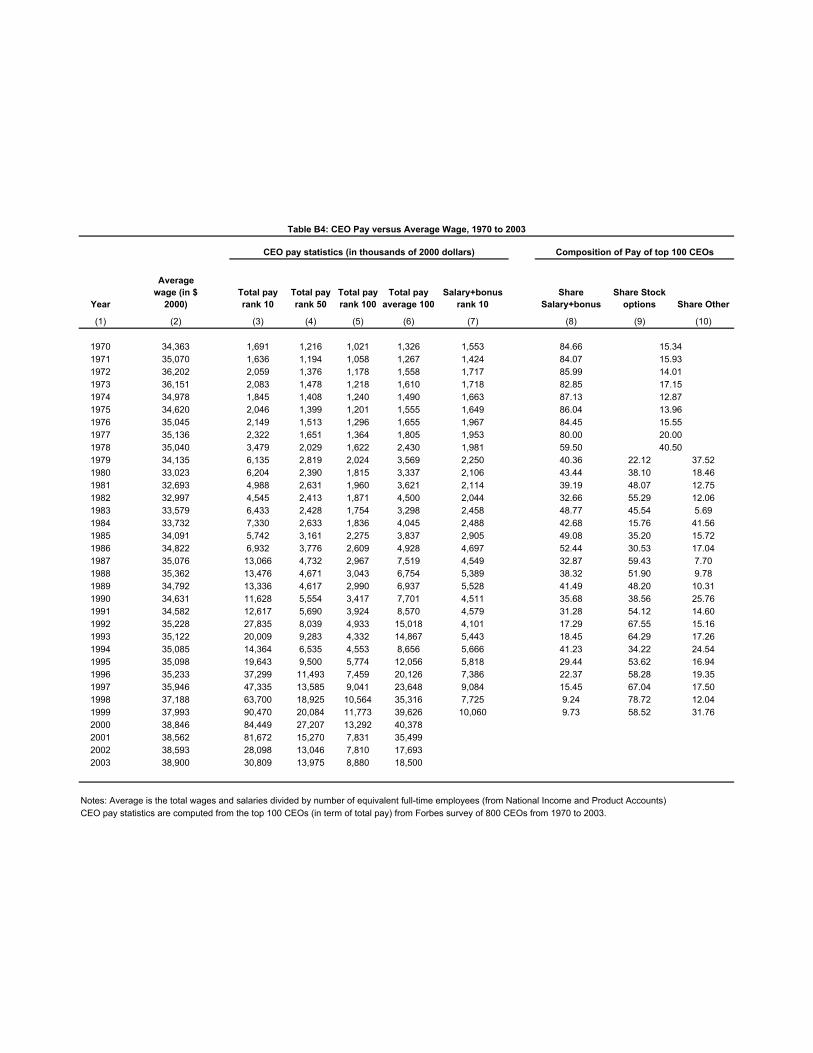


![Income Inequality: Evidence and Policy Implicationselsa.berkeley.edu/~saez/lecture_saez_arrow.pdf · some but not all countries [Atkinson-Piketty-Saez JEL’11] 2) Top tax rates have](https://static.documents.pub/doc/80x56/5e8e0f08107e6a414f603128/income-inequality-evidence-and-policy-saezlecturesaezarrowpdf-some-but-not.jpg)


