Page 1
Income, Salaries and Wages
Northumberland 2019
Northumberland Knowledge Research Report
October 2019
Prepared by
Julie Dowson
Northumberland County Council Economic and Inclusion Policy Team
e-mail. [email protected]
telephone: 07703683276
web. https://www.northumberland.gov.uk/Northumberland-Knowledge-and-JSNA.aspx
Page 2
Income, Salaries and Wages - Northumberland 2019
This page has been left blank
Page 2 of 21
Page 3
Income, Salaries and Wages - Northumberland 2019
Contents
1 INTRODUCTION 4
2 HOUSEHOLD INCOME 5
2.1 Gross Disposable Household Income 5
Figure 1: Regional GDHI per Head (£) 2013-2017 5
Figure 2: North East GDHI per Head (£) 2013-2017 6
2.2 CACI Paycheck 6
Figure 3: Northumberland Median Income by LSOA 2019 7
Figure 4: Northumberland Median Income by Main Town 2019 8
3 SALARIES AND WAGES 9
3.1 Annual Survey of Hours and Earnings 9
Figure 5: Northumberland Median Gross Weekly Earnings and gender 2014-18 9
3.2 Minimum and Living Wage 10
Figure 6: Proportion of employee jobs with hourly pay below the real living wage 2018 10
3.3 Gender Pay Gap 11
Figure 7: Gender Pay Gap 2018 11
Figure 8: Gender Pay Gap for those living and/or working in Northumberland 2008-18 12
3.4 Location of work 13
Figure 9: North East CA and LEP Gross Weekly Salary (Workplace Based) 2014-18 13
Figure 10: North East CA and LEP Gross Weekly Salary (Resident Based) 2014-18 13
Figure 11: UK Median Gross Weekly Salary (Workplace Based) 2014-18 14
3.5 Type of work 14
Figure 12: Median Gross Weekly Earnings (full-time employee jobs) by Major Industry Group, North East 2018 and Northumberland Employees, BRES 2018 15
Figure 13: Median Full-Time Gross Weekly Earnings by Major Occupation Group, North East 2018 and Northumberland Residents, APS 2018/19 16
Figure 14: Median Full-Time Gross Weekly Earnings by public and private sectors, North East 2014-18 and Northumberland Residents, APS 2014-18 16
4 SECTOR SALARY SURVEYS 17
Figure 15: Hays UK Salary Guide sector summary 2019 17
Figure 16: Engineering and Manufacturing Salary Ranges, Michael Page Salary Guide 2019 18
Figure 17: Food and Drink (Hospitality) Salary Ranges 2018 19
EXECUTIVE SUMMARY 20
Page 3 of 21
Page 4
Income, Salaries and Wages - Northumberland 2019
1 Introduction
This report provides a summary of the latest income and earnings data available at local, regional and national level
and gives an indication of salary levels by sector.
Information on household income, employer salaries, wages and earnings can be obtained from a number of
different sources and can be analysed from a household, resident or employer perspective.
This report provides information from the following sources:
Gross Disposable Household Income (GDHI) – Estimates of the amount of money that individuals in the household
sector have available for spending or saving after income distribution measures such as taxes. Data is for regions,
sub-regions and local areas but does not go below Northumberland County level.
CACI Paycheck – Estimates of household income at postcode level, based on government data sources, lifestyle
surveys and guarantee card returns.
Annual Survey of Hours and Earnings (ASHE) – One of the largest surveys of the earnings of UK individuals, ASHE
provides information about the levels, distribution and make-up of earnings and hours worked for employees in all
industries and occupations. Data is supplied at electoral district, county, regional and national levels and can be
analysed on either a residence or workplace basis.
Sector Salary Surveys – Recruitment organisations and some membership bodies conduct annual salary surveys
covering a range of sectors. The surveys tend to report at national level, but some contain regional variations.
Page 4 of 21
Page 5
Income, Salaries and Wages - Northumberland 2019
2 Household Income
Much research and policy is centred upon household income, consequently there are numerous data sources which
attempt to quantify or estimate approximate levels of income for households and residents of the UK. Data at small
geographical level is difficult to obtain and has large confidence intervals as the data has to be estimated from
sample data.
2.1 Gross Disposable Household Income
Gross Disposable Household Income (GDHI) is the amount of money that individuals have available for spending and
includes income from wages, salaries (including self-employment), pensions and property. It is a good indicator of
economic well-being and is based upon where a person lives (household) as opposed to where they work. GDHI is
not available below Northumberland County level. GDHI per head is influenced by productivity and labour market
outcomes. Additionally, household income depends on public policy such as taxation and on sources of income
apart from work including social transfers. The components of GDHI reflect these outcomes and give an insight into
the differences in GDHI per head between and within regions.
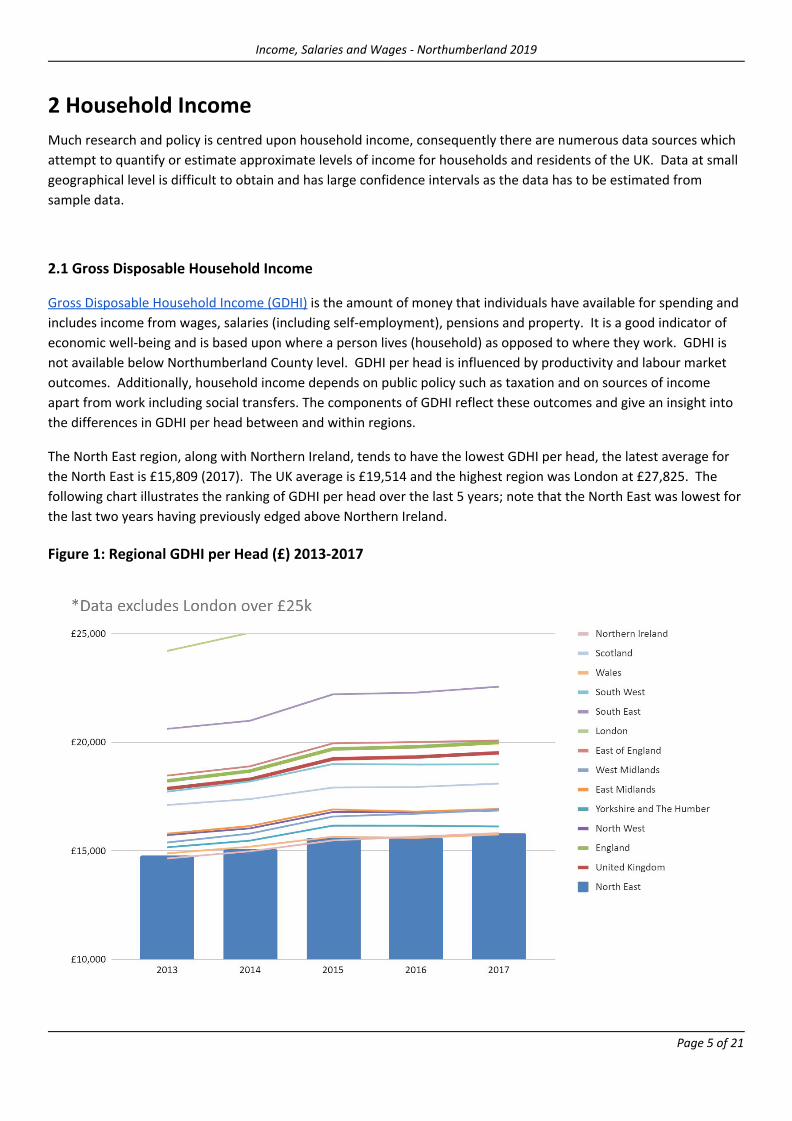
The North East region, along with Northern Ireland, tends to have the lowest GDHI per head, the latest average for
the North East is £15,809 (2017). The UK average is £19,514 and the highest region was London at £27,825. The
following chart illustrates the ranking of GDHI per head over the last 5 years; note that the North East was lowest for
the last two years having previously edged above Northern Ireland.
Figure 1: Regional GDHI per Head (£) 2013-2017
Page 5 of 21
Page 6
Income, Salaries and Wages - Northumberland 2019
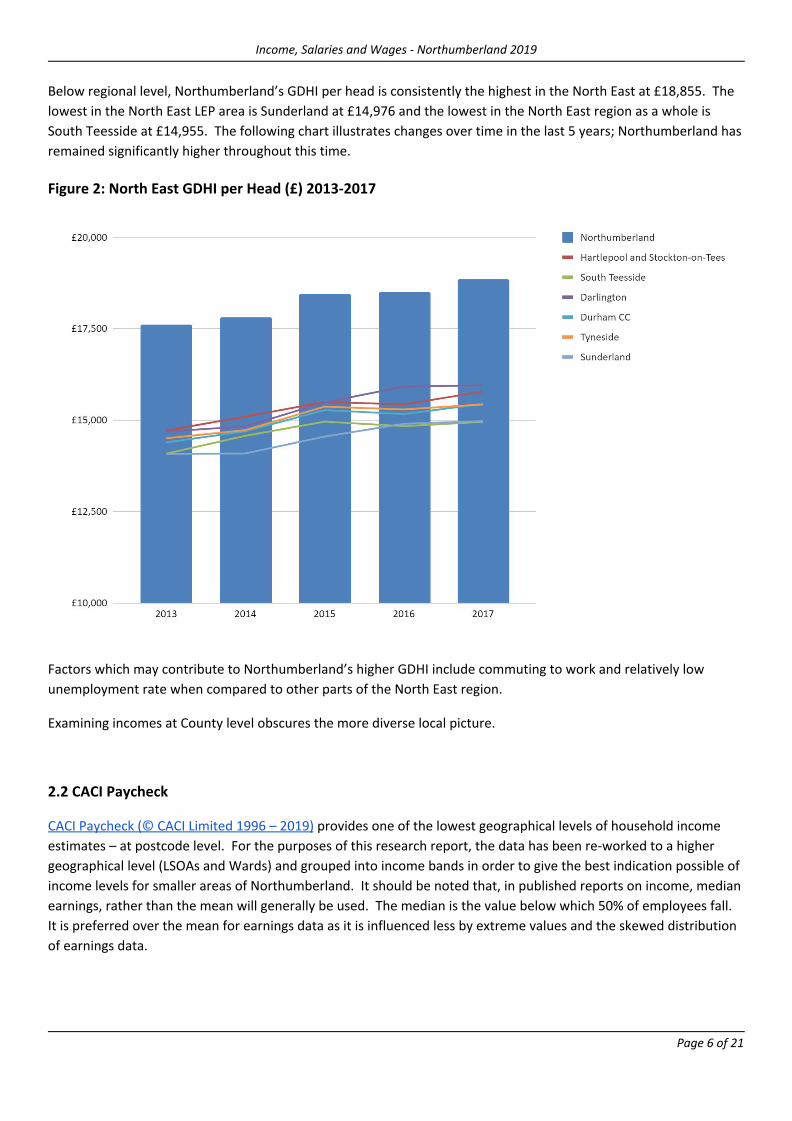
Below regional level, Northumberland’s GDHI per head is consistently the highest in the North East at £18,855. The
lowest in the North East LEP area is Sunderland at £14,976 and the lowest in the North East region as a whole is
South Teesside at £14,955. The following chart illustrates changes over time in the last 5 years; Northumberland has
remained significantly higher throughout this time.
Figure 2: North East GDHI per Head (£) 2013-2017
Factors which may contribute to Northumberland’s higher GDHI include commuting to work and relatively low
unemployment rate when compared to other parts of the North East region.
Examining incomes at County level obscures the more diverse local picture.
2.2 CACI Paycheck
CACI Paycheck (© CACI Limited 1996 – 2019) provides one of the lowest geographical levels of household income
estimates – at postcode level. For the purposes of this research report, the data has been re-worked to a higher
geographical level (LSOAs and Wards) and grouped into income bands in order to give the best indication possible of
income levels for smaller areas of Northumberland. It should be noted that, in published reports on income, median
earnings, rather than the mean will generally be used. The median is the value below which 50% of employees fall.
It is preferred over the mean for earnings data as it is influenced less by extreme values and the skewed distribution
of earnings data.
Page 6 of 21
Page 7
Income, Salaries and Wages - Northumberland 2019
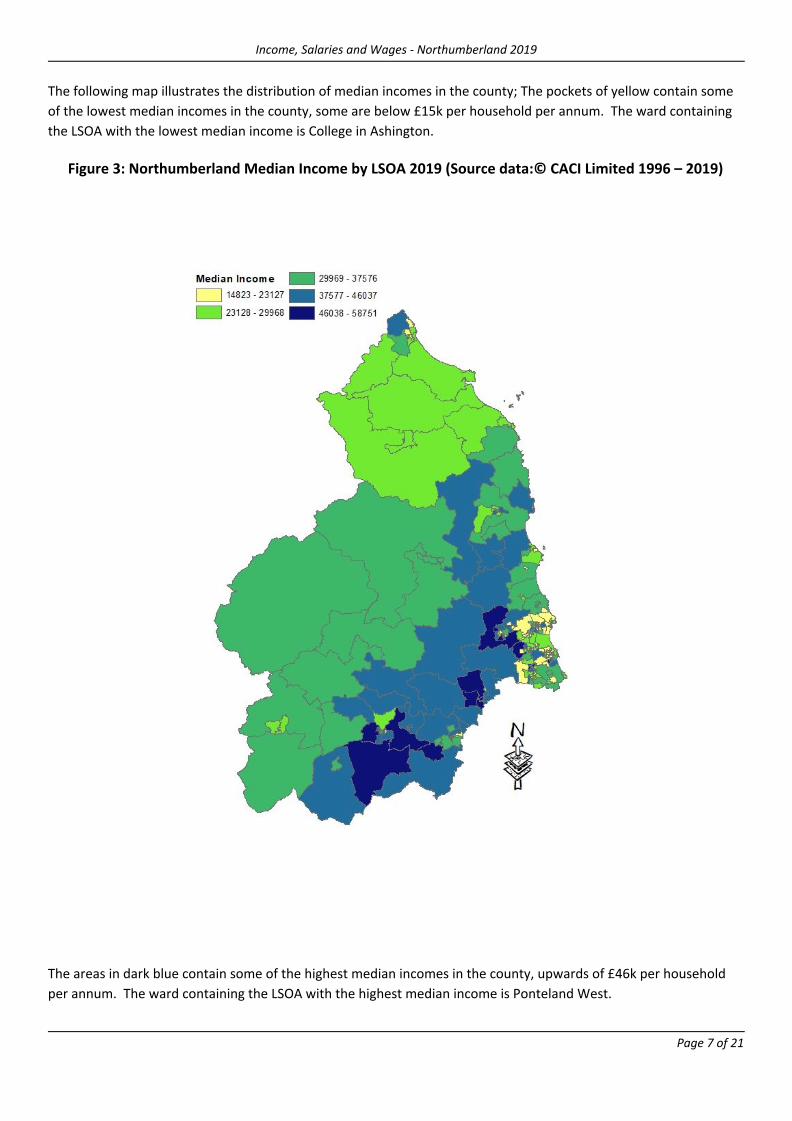
The following map illustrates the distribution of median incomes in the county; The pockets of yellow contain some
of the lowest median incomes in the county, some are below £15k per household per annum. The ward containing
the LSOA with the lowest median income is College in Ashington.
Figure 3: Northumberland Median Income by LSOA 2019 (Source data:© CACI Limited 1996 – 2019)
The areas in dark blue contain some of the highest median incomes in the county, upwards of £46k per household
per annum. The ward containing the LSOA with the highest median income is Ponteland West.
Page 7 of 21
Page 8
Income, Salaries and Wages - Northumberland 2019
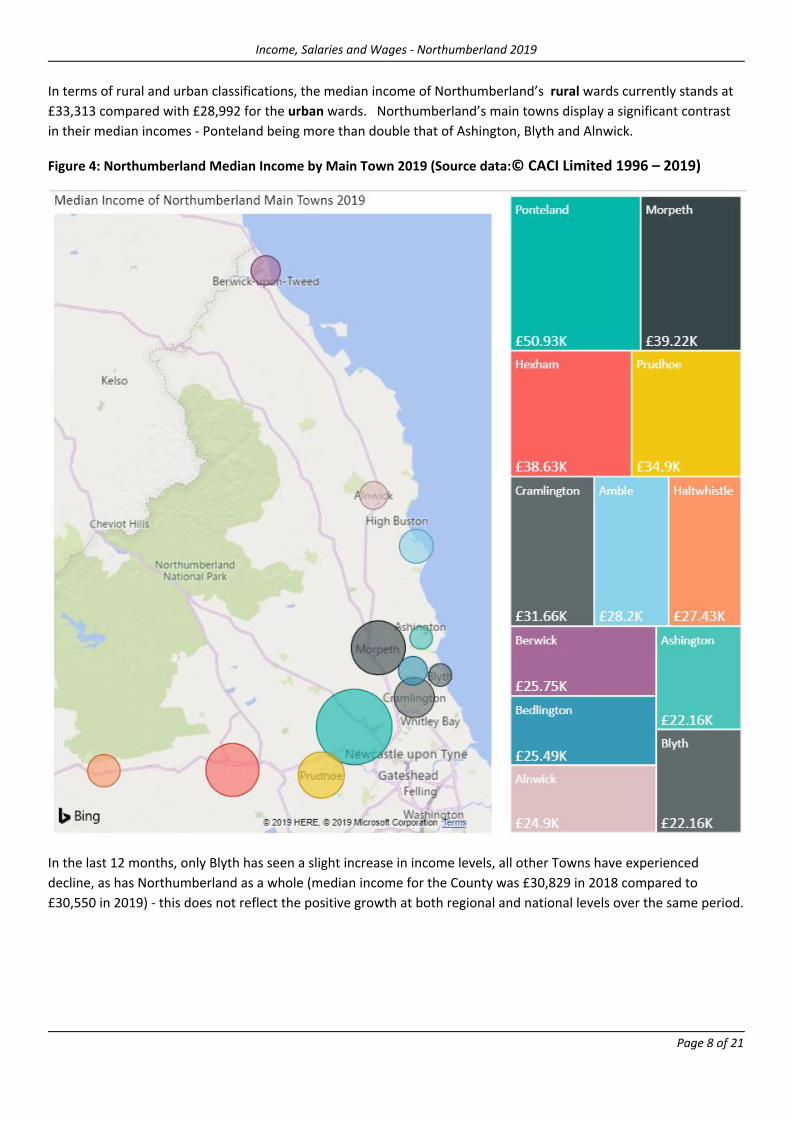
In terms of rural and urban classifications, the median income of Northumberland’s rural wards currently stands at
£33,313 compared with £28,992 for the urban wards. Northumberland’s main towns display a significant contrast
in their median incomes - Ponteland being more than double that of Ashington, Blyth and Alnwick.
Figure 4: Northumberland Median Income by Main Town 2019 (Source data:© CACI Limited 1996 – 2019)
In the last 12 months, only Blyth has seen a slight increase in income levels, all other Towns have experienced
decline, as has Northumberland as a whole (median income for the County was £30,829 in 2018 compared to
£30,550 in 2019) - this does not reflect the positive growth at both regional and national levels over the same period.
Page 8 of 21
Page 9
Income, Salaries and Wages - Northumberland 2019
3 Salaries and Wages
The main difference between salary and hourly wage is that salaries are a fixed upon payment agreed to by both the
employer and employee. Wages, on the other hand, may vary depending on hours worked and performance.
3.1 Annual Survey of Hours and Earnings
The Annual Survey of Hours and Earnings (ASHE) published by the Office for National Statistics (ONS) is based on
analysis of 1% of employee jobs taken from HM Revenue and Customs PAYE records. ASHE can provide an indication
of how pay compares nationally, how salaries vary according to type of job, public versus private sector wages and
how salaries have changed over time. Furthermore, at lower geographical level, analysis can be carried out based
upon where a person lives (resident analysis) or where a person works (workplace analysis). ASHE is the ONS’ most
detailed and comprehensive source of earnings data.
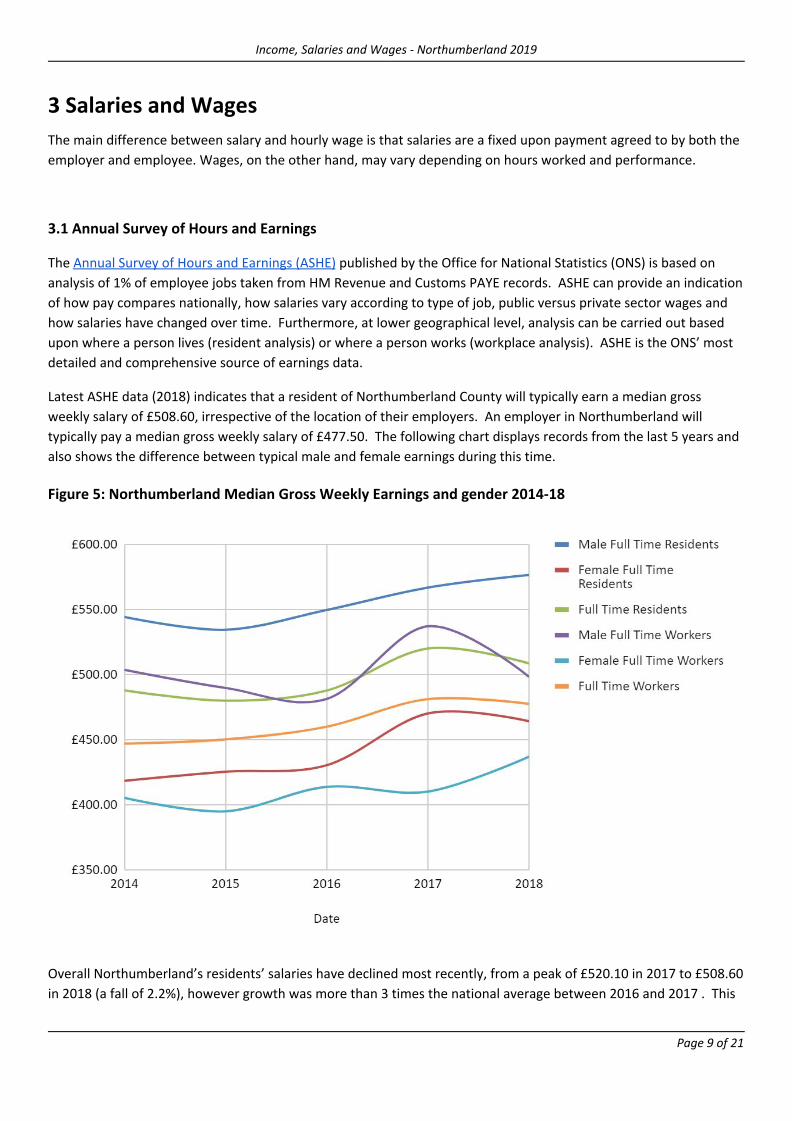
Latest ASHE data (2018) indicates that a resident of Northumberland County will typically earn a median gross
weekly salary of £508.60, irrespective of the location of their employers. An employer in Northumberland will
typically pay a median gross weekly salary of £477.50. The following chart displays records from the last 5 years and
also shows the difference between typical male and female earnings during this time.
Figure 5: Northumberland Median Gross Weekly Earnings and gender 2014-18
Overall Northumberland’s residents’ salaries have declined most recently, from a peak of £520.10 in 2017 to £508.60
in 2018 (a fall of 2.2%), however growth was more than 3 times the national average between 2016 and 2017 . This
Page 9 of 21
Page 10
Income, Salaries and Wages - Northumberland 2019
contrasts sharply with the national picture, median full-time weekly earnings increased 3.5% when compared to
2017. (Source: Employee Earnings in the UK: 2018 , ONS, October 2018).
3.2 Minimum and Living Wage
The Government’s National Minimum Wage was introduced in 1999 and the National Living Wage was introduced in
2016.
Currently, as of April 2019, a worker aged 25 and over, and not in the first year of an apprenticeship, is legally
entitled to at least the National Living Wage of £8.21 per hour. A worker aged under 25, or an apprentice, is legally
entitled to at least the National Minimum Wage (Apprentice; £3.90, Under 18; £4.35, 18-20; £6.15, 21-24; £7.70).
The rates change every April.
The Living Wage Foundation champions the Real Living Wage which is independently calculated based on what
people need to get by. All employers that can afford to do so are encouraged to ensure their employees earn a wage
that meets the costs of living, not just the government minimum, hence these rates are higher and include a
separate rate for those living in London. The real UK Living Wage is currently £9.00 per hour.
ONS has issued user requested data on “Annual Survey of Hours and Earnings (ASHE) - Estimates of the number and
proportion of employee jobs with hourly pay below the living wage, by work geography, local authority and
parliamentary constituency, UK, April 2017 and April 2018” (using Living Wage Foundation rates). Although ad hoc,
the data gives an indication of the number or proportion of people earning less than the real living wage (at 2017-18)
for each local authority. Rates used were £8.45 in 2017 and £8.75 in 2018.
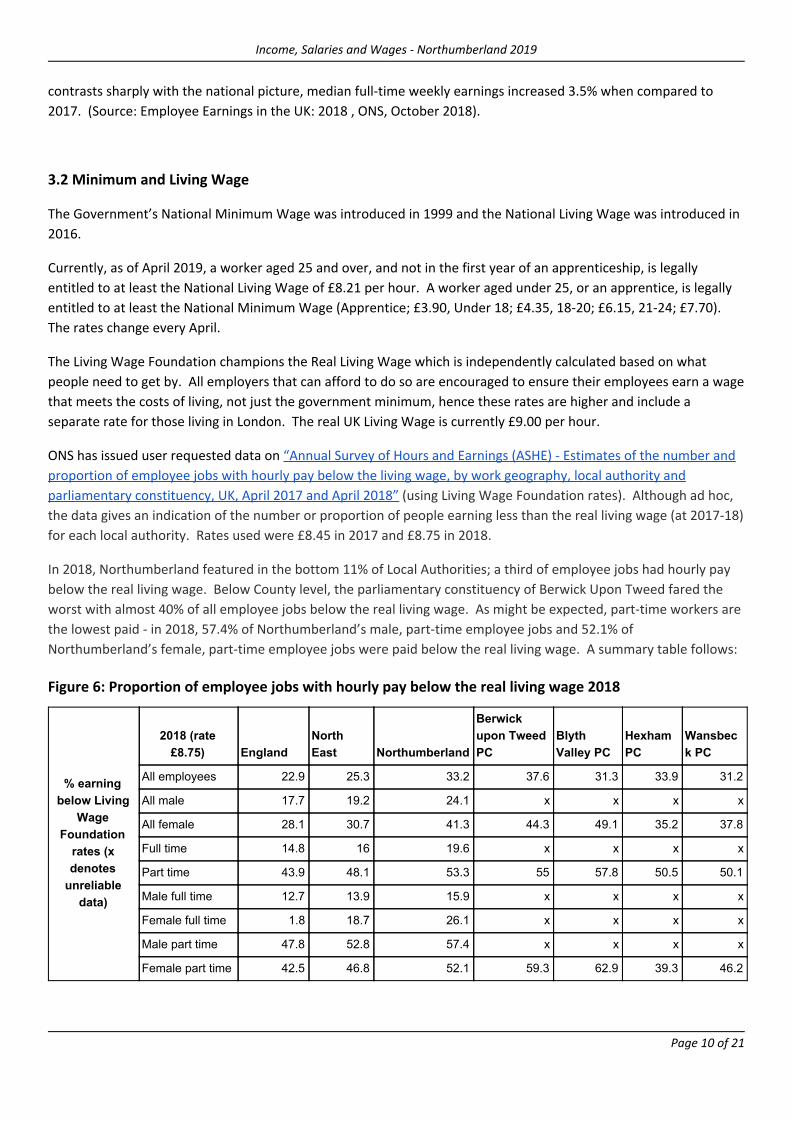
In 2018, Northumberland featured in the bottom 11% of Local Authorities; a third of employee jobs had hourly pay
below the real living wage. Below County level, the parliamentary constituency of Berwick Upon Tweed fared the
worst with almost 40% of all employee jobs below the real living wage. As might be expected, part-time workers are
the lowest paid - in 2018, 57.4% of Northumberland’s male, part-time employee jobs and 52.1% of
Northumberland’s female, part-time employee jobs were paid below the real living wage. A summary table follows:
Figure 6: Proportion of employee jobs with hourly pay below the real living wage 2018
% earning below Living
Wage Foundation
rates (x denotes
unreliable data)
2018 (rate £8.75) England
North East Northumberland
Berwick upon Tweed PC
Blyth Valley PC
Hexham PC
Wansbeck PC
All employees 22.9 25.3 33.2 37.6 31.3 33.9 31.2
All male 17.7 19.2 24.1 x x x x
All female 28.1 30.7 41.3 44.3 49.1 35.2 37.8
Full time 14.8 16 19.6 x x x x
Part time 43.9 48.1 53.3 55 57.8 50.5 50.1
Male full time 12.7 13.9 15.9 x x x x
Female full time 1.8 18.7 26.1 x x x x
Male part time 47.8 52.8 57.4 x x x x
Female part time 42.5 46.8 52.1 59.3 62.9 39.3 46.2
Page 10 of 21
Page 11
Income, Salaries and Wages - Northumberland 2019
Northumberland County Council adopted a minimum hourly pay rate of £9.00 per hour and £17,364 per annum for
all employees in April 2019. The implementation of the new revised pay structure made the “Northumberland Living
Wage” supplement introduced in 2015 to increase hourly salaries to a minimum of £7.85 per hour obsolete.
3.3 Gender Pay Gap
Gender pay gap - As a result of 2017 government legislation, organisations with 250 employees or more had to
report on their gender pay gap by 30 March 2018. From then on, they are required to do so every year. The gender
pay gap is the percentage difference between men's and women’s median hourly earnings, across all jobs in the UK;
it is not a measure of the difference in pay between men and women for doing the same job. Differences in pay
between women and men by age, region, full-time and part-time, and occupation is compiled from the Annual
Survey of Hours and Earnings (ASHE).
Male residents in Northumberland have consistently earned the highest median gross weekly salary over the last 5
years ranging from £544.30 in 2014 to £576.60 in 2018 (an increase of 5.9%).
Females who work, but don’t necessarily live in Northumberland consistently earn the lowest median gross weekly
salary, ranging from £405.30 in 2014 to £437.00 in 2018 (an increase of 7.8%).
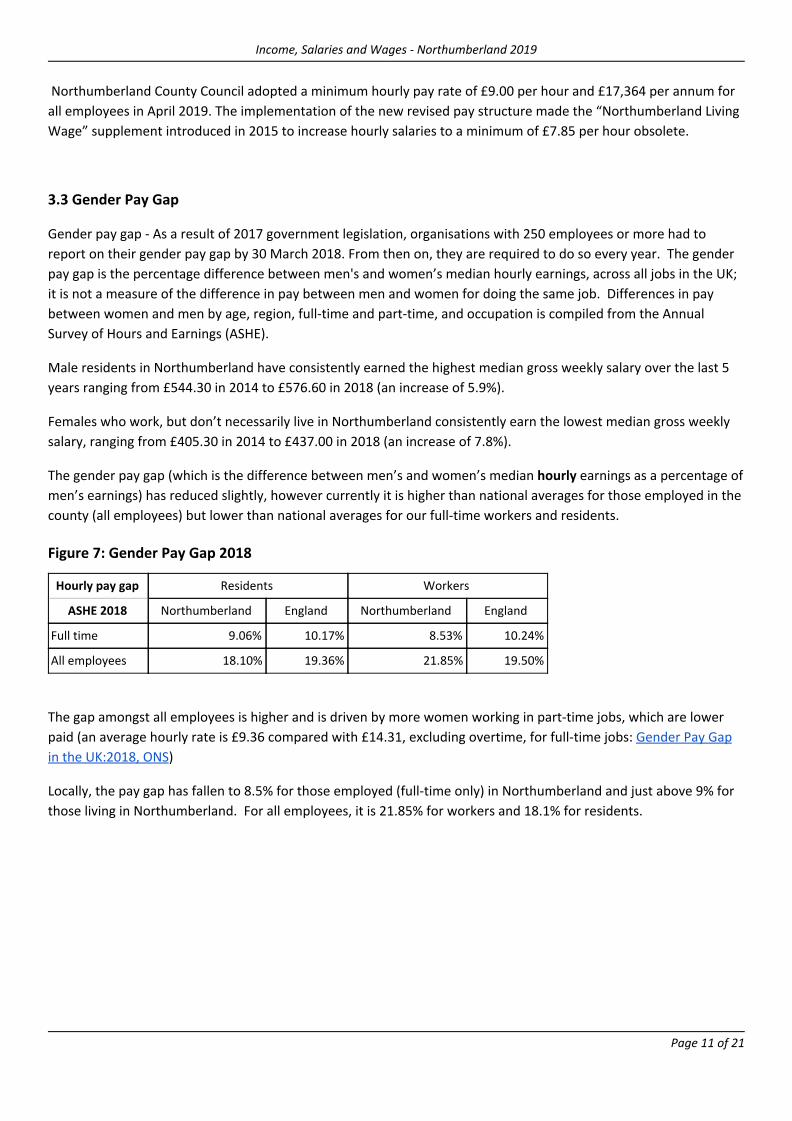
The gender pay gap (which is the difference between men’s and women’s median hourly earnings as a percentage of
men’s earnings) has reduced slightly, however currently it is higher than national averages for those employed in the
county (all employees) but lower than national averages for our full-time workers and residents.
Figure 7: Gender Pay Gap 2018
Hourly pay gap Residents Workers
ASHE 2018 Northumberland England Northumberland England
Full time 9.06% 10.17% 8.53% 10.24%
All employees 18.10% 19.36% 21.85% 19.50%
The gap amongst all employees is higher and is driven by more women working in part-time jobs, which are lower
paid (an average hourly rate is £9.36 compared with £14.31, excluding overtime, for full-time jobs: Gender Pay Gap
in the UK:2018, ONS)
Locally, the pay gap has fallen to 8.5% for those employed (full-time only) in Northumberland and just above 9% for
those living in Northumberland. For all employees, it is 21.85% for workers and 18.1% for residents.
Page 11 of 21
Page 12
Income, Salaries and Wages - Northumberland 2019
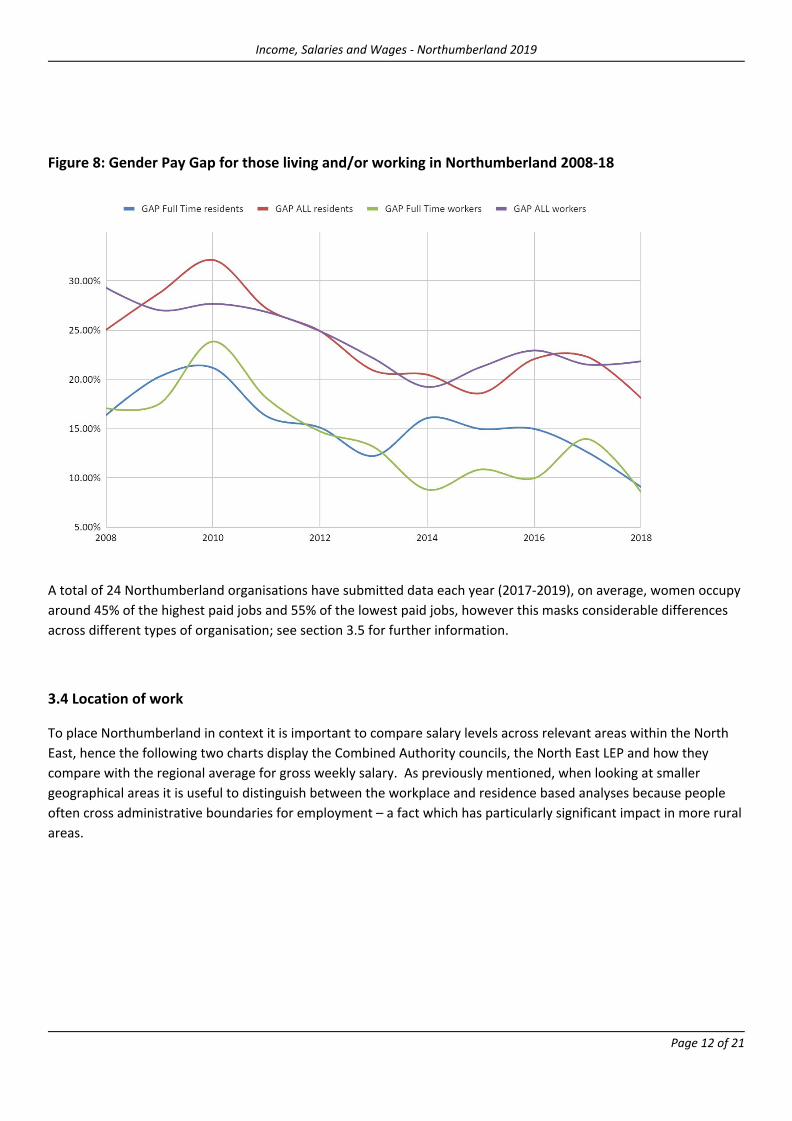
Figure 8: Gender Pay Gap for those living and/or working in Northumberland 2008-18
A total of 24 Northumberland organisations have submitted data each year (2017-2019), on average, women occupy
around 45% of the highest paid jobs and 55% of the lowest paid jobs, however this masks considerable differences
across different types of organisation; see section 3.5 for further information.
3.4 Location of work
To place Northumberland in context it is important to compare salary levels across relevant areas within the North
East, hence the following two charts display the Combined Authority councils, the North East LEP and how they
compare with the regional average for gross weekly salary. As previously mentioned, when looking at smaller
geographical areas it is useful to distinguish between the workplace and residence based analyses because people
often cross administrative boundaries for employment – a fact which has particularly significant impact in more rural
areas.
Page 12 of 21
Page 13
Income, Salaries and Wages - Northumberland 2019
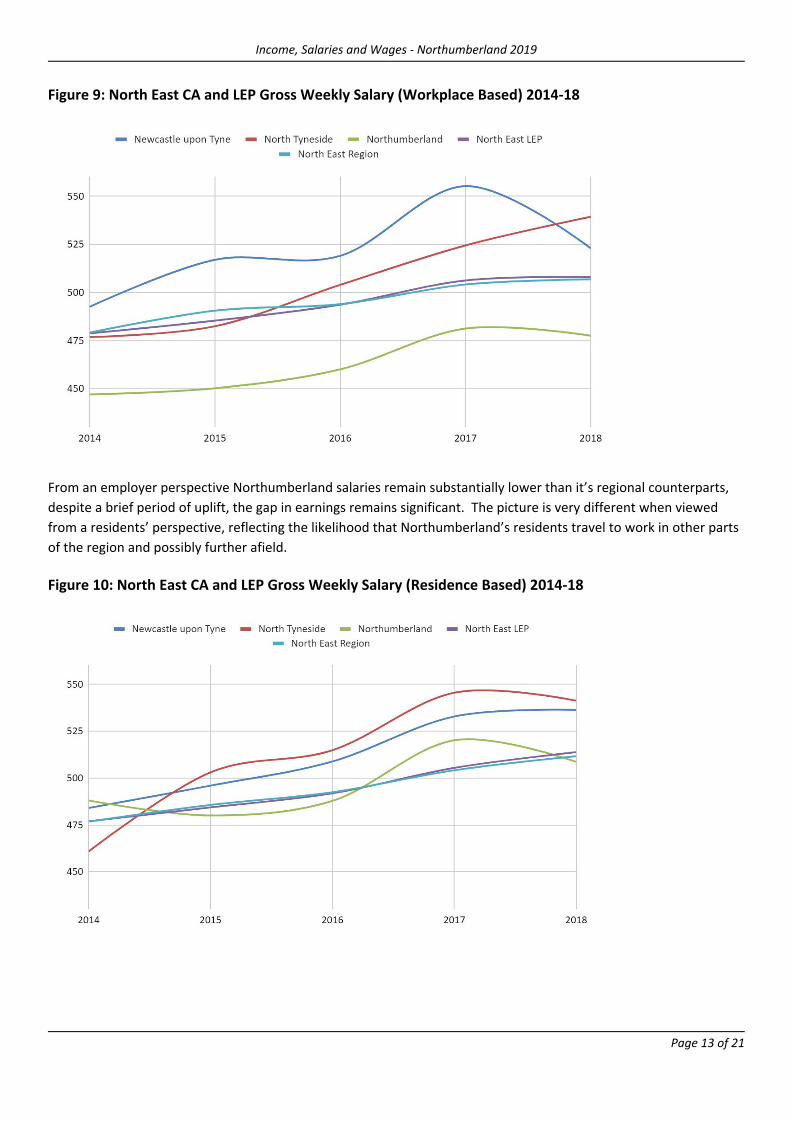
Figure 9: North East CA and LEP Gross Weekly Salary (Workplace Based) 2014-18
From an employer perspective Northumberland salaries remain substantially lower than it’s regional counterparts,
despite a brief period of uplift, the gap in earnings remains significant. The picture is very different when viewed
from a residents’ perspective, reflecting the likelihood that Northumberland’s residents travel to work in other parts
of the region and possibly further afield.
Figure 10: North East CA and LEP Gross Weekly Salary (Residence Based) 2014-18
Page 13 of 21
Page 14
Income, Salaries and Wages - Northumberland 2019
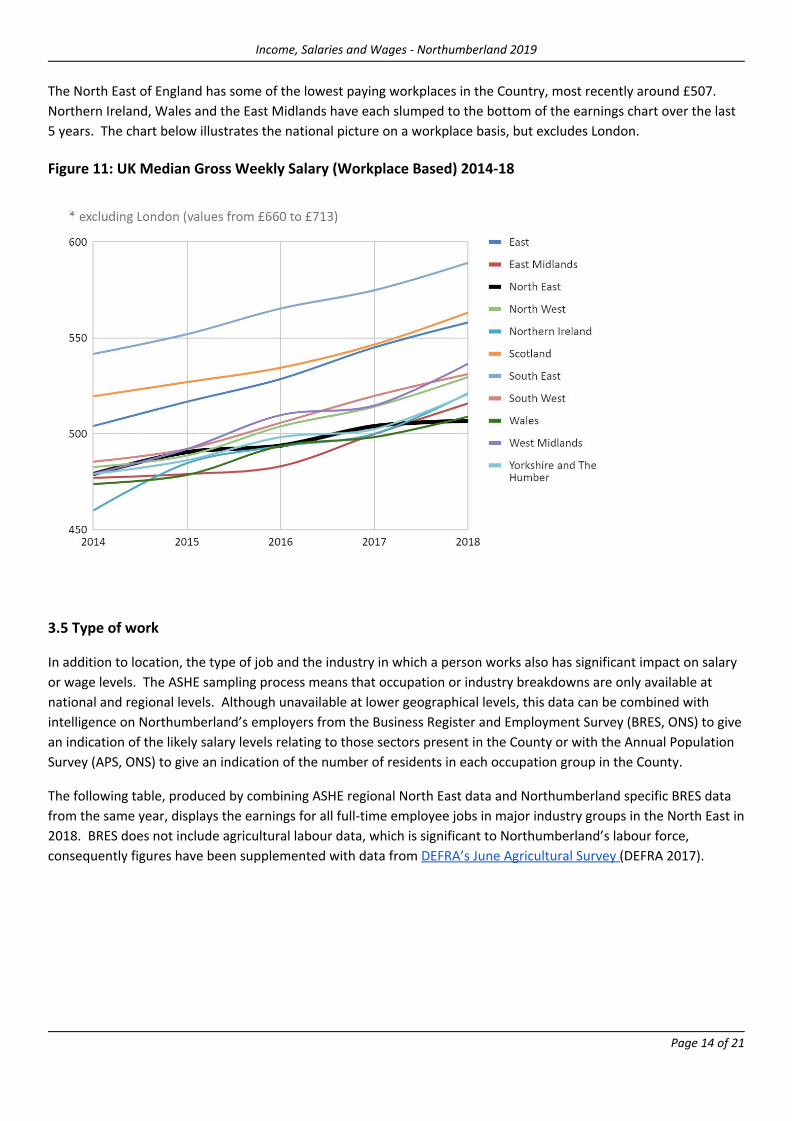
The North East of England has some of the lowest paying workplaces in the Country, most recently around £507.
Northern Ireland, Wales and the East Midlands have each slumped to the bottom of the earnings chart over the last
5 years. The chart below illustrates the national picture on a workplace basis, but excludes London.
Figure 11: UK Median Gross Weekly Salary (Workplace Based) 2014-18
3.5 Type of work
In addition to location, the type of job and the industry in which a person works also has significant impact on salary
or wage levels. The ASHE sampling process means that occupation or industry breakdowns are only available at
national and regional levels. Although unavailable at lower geographical levels, this data can be combined with
intelligence on Northumberland’s employers from the Business Register and Employment Survey (BRES, ONS) to give
an indication of the likely salary levels relating to those sectors present in the County or with the Annual Population
Survey (APS, ONS) to give an indication of the number of residents in each occupation group in the County.
The following table, produced by combining ASHE regional North East data and Northumberland specific BRES data
from the same year, displays the earnings for all full-time employee jobs in major industry groups in the North East in
2018. BRES does not include agricultural labour data, which is significant to Northumberland’s labour force,
consequently figures have been supplemented with data from DEFRA’s June Agricultural Survey (DEFRA 2017).
Page 14 of 21
Page 15
Income, Salaries and Wages - Northumberland 2019
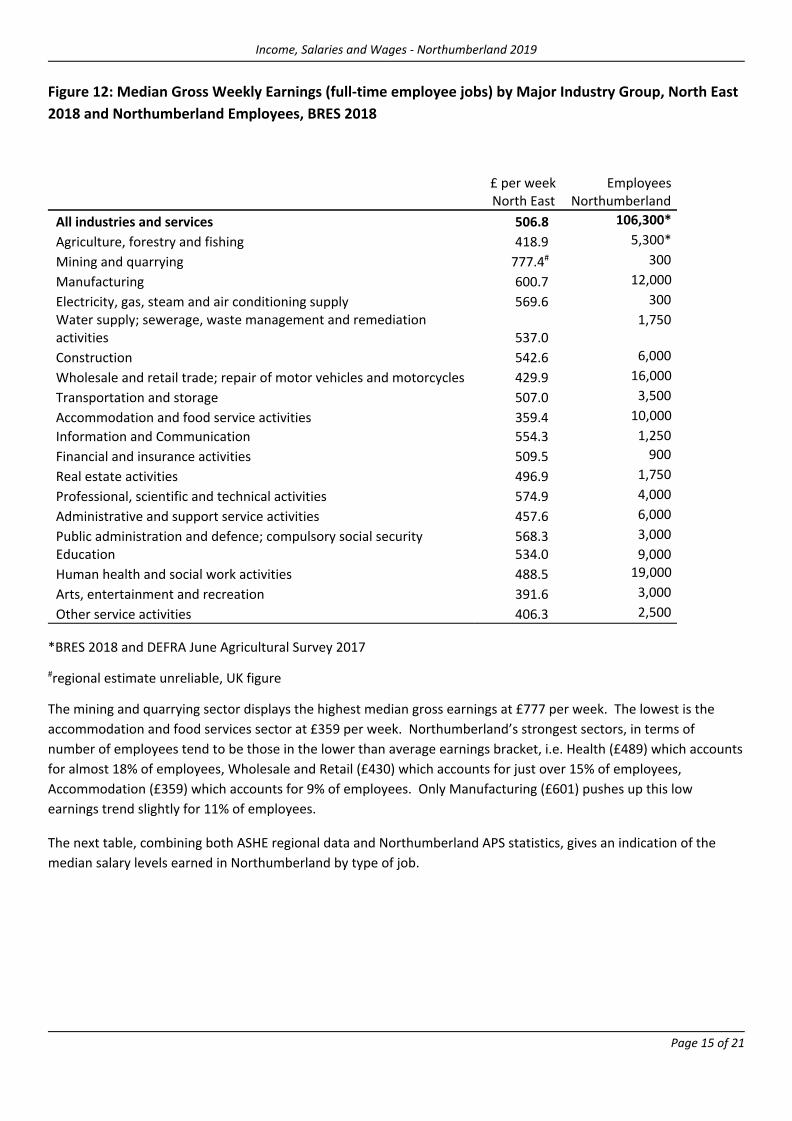
Figure 12: Median Gross Weekly Earnings (full-time employee jobs) by Major Industry Group, North East
2018 and Northumberland Employees, BRES 2018
£ per week North East
Employees Northumberland
All industries and services 506.8 106,300*
Agriculture, forestry and fishing 418.9 5,300*
Mining and quarrying 777.4# 300
Manufacturing 600.7 12,000
Electricity, gas, steam and air conditioning supply 569.6 300
Water supply; sewerage, waste management and remediation activities 537.0
1,750
Construction 542.6 6,000
Wholesale and retail trade; repair of motor vehicles and motorcycles 429.9 16,000
Transportation and storage 507.0 3,500
Accommodation and food service activities 359.4 10,000
Information and Communication 554.3 1,250
Financial and insurance activities 509.5 900
Real estate activities 496.9 1,750
Professional, scientific and technical activities 574.9 4,000
Administrative and support service activities 457.6 6,000
Public administration and defence; compulsory social security 568.3 3,000
Education 534.0 9,000
Human health and social work activities 488.5 19,000
Arts, entertainment and recreation 391.6 3,000
Other service activities 406.3 2,500
*BRES 2018 and DEFRA June Agricultural Survey 2017
#regional estimate unreliable, UK figure
The mining and quarrying sector displays the highest median gross earnings at £777 per week. The lowest is the
accommodation and food services sector at £359 per week. Northumberland’s strongest sectors, in terms of
number of employees tend to be those in the lower than average earnings bracket, i.e. Health (£489) which accounts
for almost 18% of employees, Wholesale and Retail (£430) which accounts for just over 15% of employees,
Accommodation (£359) which accounts for 9% of employees. Only Manufacturing (£601) pushes up this low
earnings trend slightly for 11% of employees.
The next table, combining both ASHE regional data and Northumberland APS statistics, gives an indication of the
median salary levels earned in Northumberland by type of job.
Page 15 of 21
Page 16
Income, Salaries and Wages - Northumberland 2019
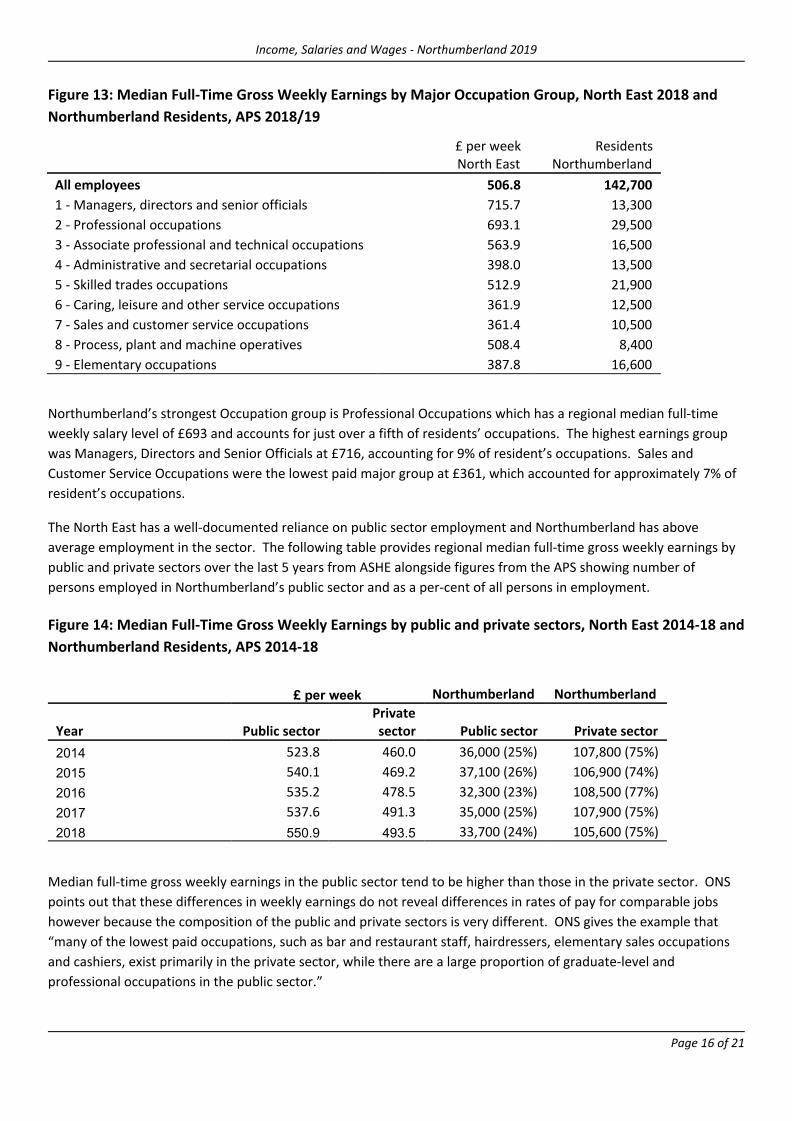
Figure 13: Median Full-Time Gross Weekly Earnings by Major Occupation Group, North East 2018 and
Northumberland Residents, APS 2018/19
£ per week North East
Residents Northumberland
All employees 506.8 142,700
1 - Managers, directors and senior officials 715.7 13,300
2 - Professional occupations 693.1 29,500
3 - Associate professional and technical occupations 563.9 16,500
4 - Administrative and secretarial occupations 398.0 13,500
5 - Skilled trades occupations 512.9 21,900
6 - Caring, leisure and other service occupations 361.9 12,500
7 - Sales and customer service occupations 361.4 10,500
8 - Process, plant and machine operatives 508.4 8,400
9 - Elementary occupations 387.8 16,600
Northumberland’s strongest Occupation group is Professional Occupations which has a regional median full-time
weekly salary level of £693 and accounts for just over a fifth of residents’ occupations. The highest earnings group
was Managers, Directors and Senior Officials at £716, accounting for 9% of resident’s occupations. Sales and
Customer Service Occupations were the lowest paid major group at £361, which accounted for approximately 7% of
resident’s occupations.
The North East has a well-documented reliance on public sector employment and Northumberland has above
average employment in the sector. The following table provides regional median full-time gross weekly earnings by
public and private sectors over the last 5 years from ASHE alongside figures from the APS showing number of
persons employed in Northumberland’s public sector and as a per-cent of all persons in employment.
Figure 14: Median Full-Time Gross Weekly Earnings by public and private sectors, North East 2014-18 and
Northumberland Residents, APS 2014-18
£ per week Northumberland Northumberland
Year Public sector Private sector Public sector Private sector
2014 523.8 460.0 36,000 (25%) 107,800 (75%)
2015 540.1 469.2 37,100 (26%) 106,900 (74%)
2016 535.2 478.5 32,300 (23%) 108,500 (77%)
2017 537.6 491.3 35,000 (25%) 107,900 (75%)
2018 550.9 493.5 33,700 (24%) 105,600 (75%)
Median full-time gross weekly earnings in the public sector tend to be higher than those in the private sector. ONS
points out that these differences in weekly earnings do not reveal differences in rates of pay for comparable jobs
however because the composition of the public and private sectors is very different. ONS gives the example that
“many of the lowest paid occupations, such as bar and restaurant staff, hairdressers, elementary sales occupations
and cashiers, exist primarily in the private sector, while there are a large proportion of graduate-level and
professional occupations in the public sector.”
Page 16 of 21
Page 17
Income, Salaries and Wages - Northumberland 2019
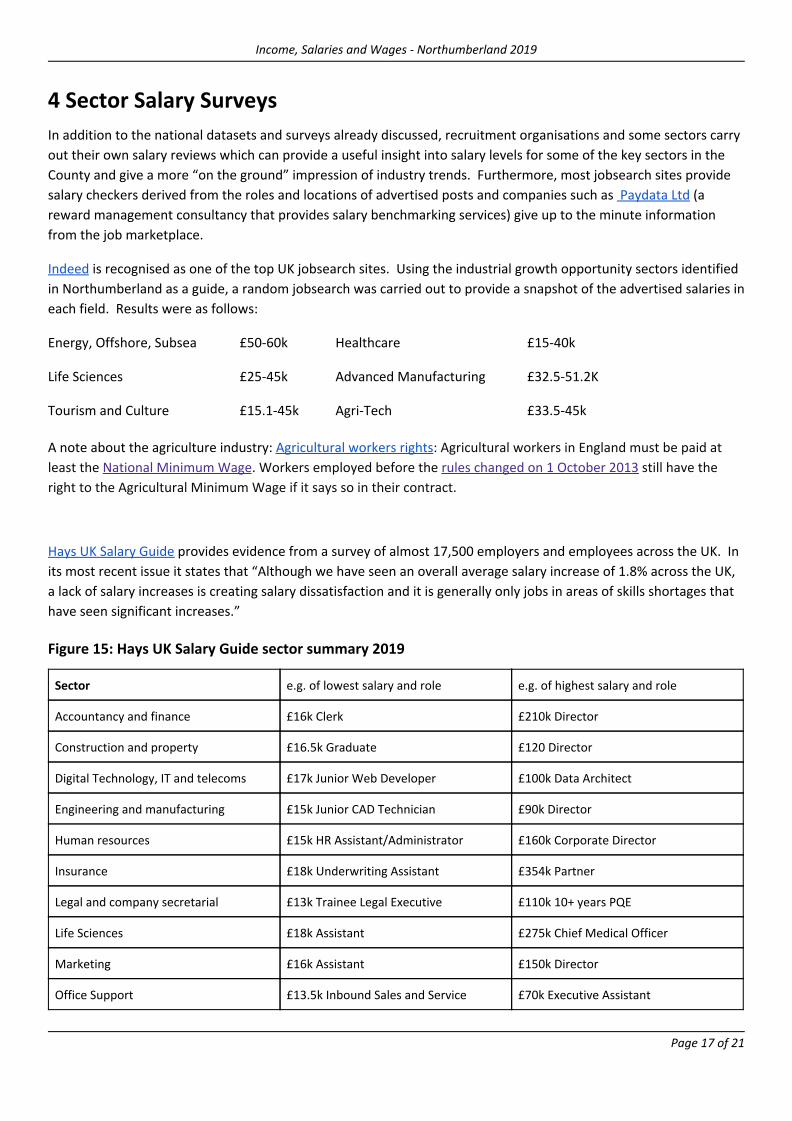
4 Sector Salary Surveys
In addition to the national datasets and surveys already discussed, recruitment organisations and some sectors carry
out their own salary reviews which can provide a useful insight into salary levels for some of the key sectors in the
County and give a more “on the ground” impression of industry trends. Furthermore, most jobsearch sites provide
salary checkers derived from the roles and locations of advertised posts and companies such as Paydata Ltd (a
reward management consultancy that provides salary benchmarking services) give up to the minute information
from the job marketplace.
Indeed is recognised as one of the top UK jobsearch sites. Using the industrial growth opportunity sectors identified
in Northumberland as a guide, a random jobsearch was carried out to provide a snapshot of the advertised salaries in
each field. Results were as follows:
Energy, Offshore, Subsea £50-60k Healthcare £15-40k
Life Sciences £25-45k Advanced Manufacturing £32.5-51.2K
Tourism and Culture £15.1-45k Agri-Tech £33.5-45k
A note about the agriculture industry: Agricultural workers rights: Agricultural workers in England must be paid at
least the National Minimum Wage. Workers employed before the rules changed on 1 October 2013 still have the
right to the Agricultural Minimum Wage if it says so in their contract.
Hays UK Salary Guide provides evidence from a survey of almost 17,500 employers and employees across the UK. In
its most recent issue it states that “Although we have seen an overall average salary increase of 1.8% across the UK,
a lack of salary increases is creating salary dissatisfaction and it is generally only jobs in areas of skills shortages that
have seen significant increases.”
Figure 15: Hays UK Salary Guide sector summary 2019
Sector e.g. of lowest salary and role e.g. of highest salary and role
Accountancy and finance £16k Clerk £210k Director
Construction and property £16.5k Graduate £120 Director
Digital Technology, IT and telecoms £17k Junior Web Developer £100k Data Architect
Engineering and manufacturing £15k Junior CAD Technician £90k Director
Human resources £15k HR Assistant/Administrator £160k Corporate Director
Insurance £18k Underwriting Assistant £354k Partner
Legal and company secretarial £13k Trainee Legal Executive £110k 10+ years PQE
Life Sciences £18k Assistant £275k Chief Medical Officer
Marketing £16k Assistant £150k Director
Office Support £13.5k Inbound Sales and Service £70k Executive Assistant
Page 17 of 21
Page 18
Income, Salaries and Wages - Northumberland 2019
Procurement and supply chain £16k Assistant Buyer £150k Director
Retail £15k Admin Assistant/Trainee £120k Head of Buying/Merchandise
The Robert Walters Salary Survey covers similar areas but also provides a global overview to enable international
benchmarking where necessary. It notes that “In comparison to the previous year, we saw salaries rise faster in
2018, but on the whole increases were not significant unless professionals were working in a market short of
qualified professionals, such as technology or compliance.” This reiterates the trend already alluded to. The report
details a narrower range of salaries but the higher end earnings and England regional variations are broadly similar
to the Hays report. Of particular note are the comments on Europe: “The European recruitment market went from
strength to strength in 2018. Overall hiring levels were high, underpinned by a growing economy, increased investor
confidence in the eurozone and UK-based roles transferring to the region due to Brexit, all of which led to businesses
aggressively hiring new talent...Europe is expected to continue its strong economic growth in 2019, resulting in a
favourable recruitment market with confidence remaining high among professionals and employers.”
Michael Page is a multi-sector recruitment company which conducts sector specific salary research. Their
Engineering and Manufacturing salary and skills guide provides an overview of the employment trends in the sector,
market insight and salary levels. Regional trends in the sector are also highlighted.
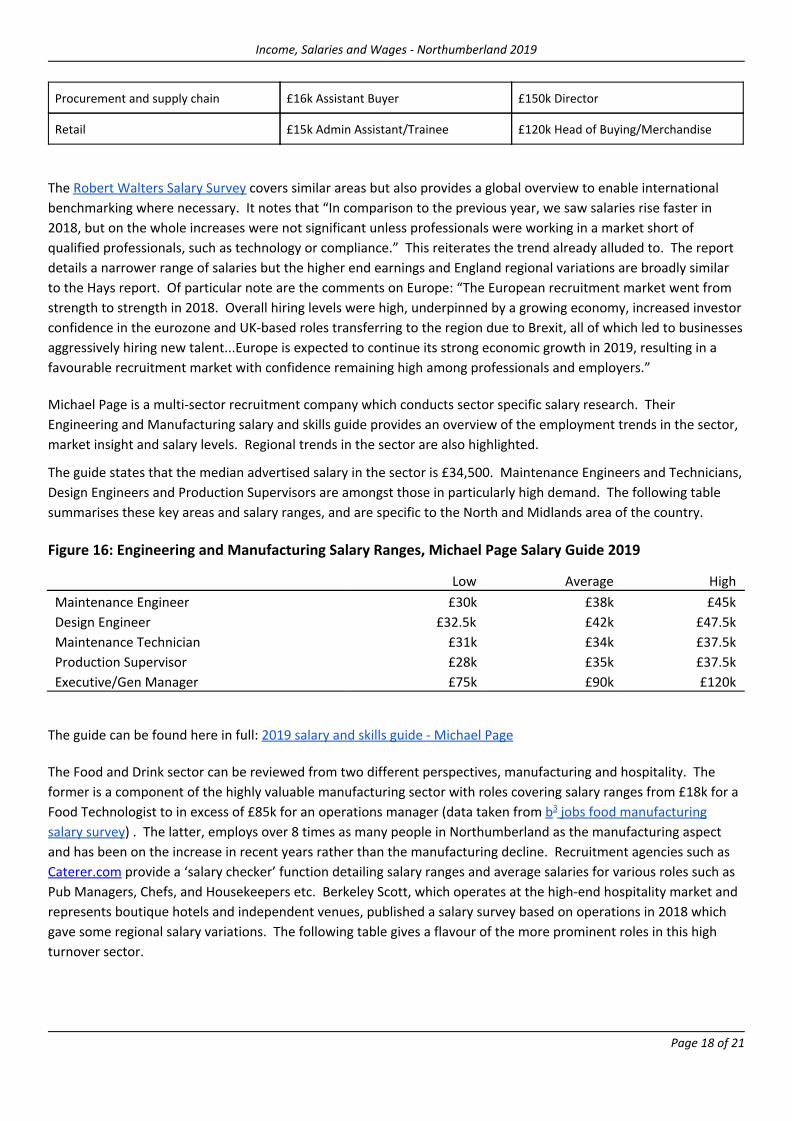
The guide states that the median advertised salary in the sector is £34,500. Maintenance Engineers and Technicians,
Design Engineers and Production Supervisors are amongst those in particularly high demand. The following table
summarises these key areas and salary ranges, and are specific to the North and Midlands area of the country.
Figure 16: Engineering and Manufacturing Salary Ranges, Michael Page Salary Guide 2019
Low Average High
Maintenance Engineer £30k £38k £45k
Design Engineer £32.5k £42k £47.5k
Maintenance Technician £31k £34k £37.5k
Production Supervisor £28k £35k £37.5k
Executive/Gen Manager £75k £90k £120k
The guide can be found here in full: 2019 salary and skills guide - Michael Page
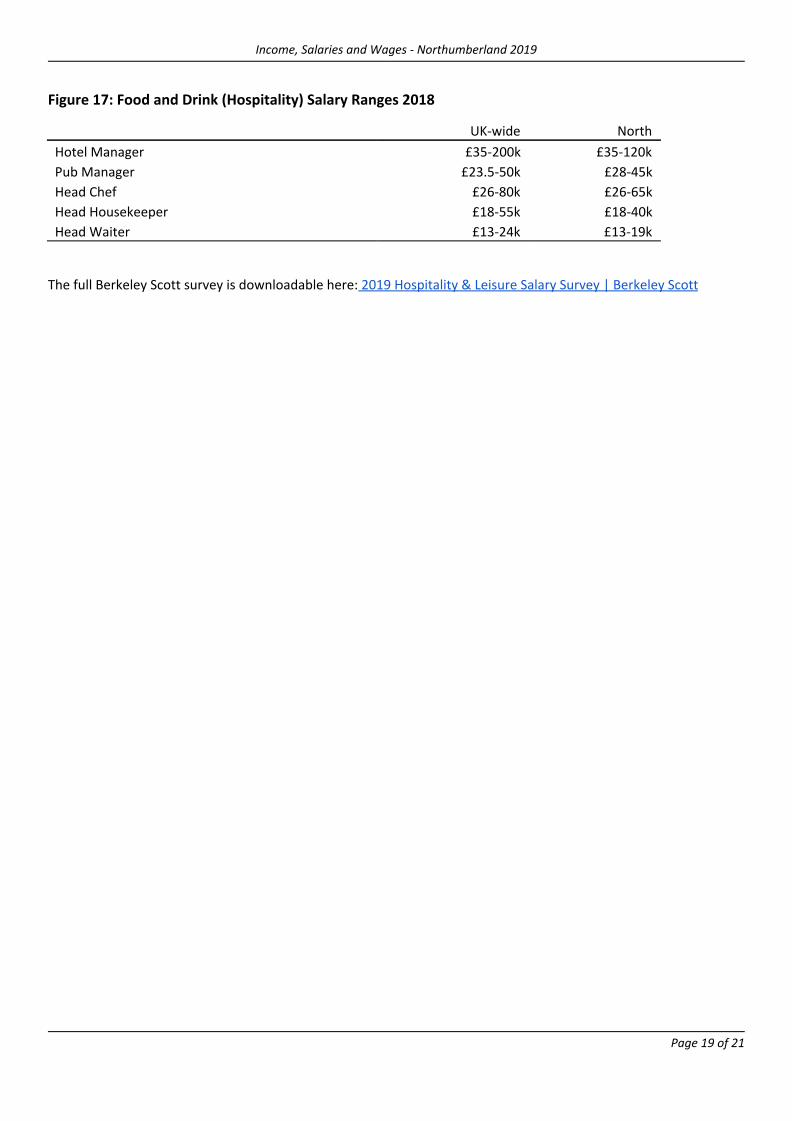
The Food and Drink sector can be reviewed from two different perspectives, manufacturing and hospitality. The
former is a component of the highly valuable manufacturing sector with roles covering salary ranges from £18k for a
Food Technologist to in excess of £85k for an operations manager (data taken from b3 jobs food manufacturing
salary survey) . The latter, employs over 8 times as many people in Northumberland as the manufacturing aspect
and has been on the increase in recent years rather than the manufacturing decline. Recruitment agencies such as
Caterer.com provide a ‘salary checker’ function detailing salary ranges and average salaries for various roles such as
Pub Managers, Chefs, and Housekeepers etc. Berkeley Scott, which operates at the high-end hospitality market and
represents boutique hotels and independent venues, published a salary survey based on operations in 2018 which
gave some regional salary variations. The following table gives a flavour of the more prominent roles in this high
turnover sector.
Page 18 of 21
Page 19
Income, Salaries and Wages - Northumberland 2019
Figure 17: Food and Drink (Hospitality) Salary Ranges 2018
UK-wide North
Hotel Manager £35-200k £35-120k
Pub Manager £23.5-50k £28-45k
Head Chef £26-80k £26-65k
Head Housekeeper £18-55k £18-40k
Head Waiter £13-24k £13-19k
The full Berkeley Scott survey is downloadable here: 2019 Hospitality & Leisure Salary Survey | Berkeley Scott
Page 19 of 21
Page 20
Income, Salaries and Wages - Northumberland 2019
Executive Summary
In 2017, the North East region had the lowest GDHI per head at £15,809. The UK average was £19,514 and the
highest region was London at £27,825. Northumberland’s GDHI per head is actually the highest in the North East at
£18,855.
Northumberland’s median income levels range from £14,823 to £58,751 at LSOA level. College Ward in Ashington is estimated to have the lowest median household income in the County and Ponteland West is estimated to have the highest.
The median income of Northumberland’s rural wards currently stands at £33,313 compared with £28,992 for the urban wards.
Northumberland’s main towns display a significant contrast in their median incomes - Ponteland (£50,930) being more than double that of Ashington (£22,160), Blyth (£22,160) and Alnwick (£24,900).
The Annual Survey of Hours and Earnings (ASHE) reveals that the North East area of England has some of the lowest
paying workplaces in the Country most recently at £507 (£26k per annum). The latest data (2018-19) indicates that
a resident of Northumberland County will typically earn a median gross weekly salary of £508.60 (£27.5k per
annum), irrespective of the location of their employers. An employer in Northumberland will typically pay a median
gross weekly salary of £477.50 (£25k pa). Northumberland’s residents’ salaries have declined most recently, from an
all time peak of £520.10 pw in 2017 to £508.60 in 2018 (a fall of 2%).
The Living Wage Foundation champions the Real Living Wage which is independently calculated based on what
people need to get by. The real UK Living Wage is currently £9.00 per hour. In 2018, Northumberland featured in
the bottom 11% of Local Authorities; a third of employee jobs had hourly pay below the real living wage. Below
County level, the parliamentary constituency of Berwick Upon Tweed fared the worst with almost 40% of all
employee jobs below the real living wage. As might be expected, part-time workers are the lowest paid - in 2018,
57.4% of Northumberland’s male, part-time employee jobs and 52.1% of Northumberland’s female, part-time
employee jobs were paid below the real living wage.
The gender pay gap in Northumberland has reduced overall, however it is currently higher than national averages for
those working in the county (all employees) but lower than national averages for our full-time workers and residents.
For full-time roles the pay gap has fallen to 8.5% for those employed in Northumberland and just above 9% for those
living in Northumberland. For all roles, it is 21.85% for workers and 18.1% for residents.
Male residents in Northumberland have consistently earned the highest median gross weekly salary over the last 5
years ranging from £544.30 in 2014 to £576.60 in 2018 (an increase of 5.9%).
Females who work, but don’t necessarily live in Northumberland consistently earn the lowest median gross weekly
salary, ranging from £405.30 in 2014 to £437.00 in 2018 (an increase of 7.8%).
From an employer perspective Northumberland salaries remain substantially lower than it’s regional counterparts,
despite a brief period of uplift, the gap in earnings remains significant. The picture is very different when viewed
from a residents’ perspective, reflecting the likelihood that Northumberland’s residents travel to work in other parts
of the region and possibly further afield.
The mining and quarrying sector displays the highest median gross earnings at £777 per week. The lowest is the
accommodation and food services sector at £359 per week. Northumberland’s strongest sectors, in terms of
number of employees tend to be those in the lower than average earnings bracket, i.e. Health (£489) which accounts
Page 20 of 21
Page 21
Income, Salaries and Wages - Northumberland 2019
for almost 18% of employees, Wholesale and Retail (£430) which accounts for just over 15% of employees,
Accommodation (£359) which accounts for 9% of employees. Only Manufacturing (£601) pushes up this low
earnings trend slightly for 11% of employees.
Northumberland’s strongest Occupation group is Professional Occupations which has a regional median full-time
weekly salary level of £693 and accounts for just over a fifth of residents’ occupations. The highest earnings group
was Managers, Directors and Senior Officials at £716, accounting for 9% of resident’s occupations. Sales and
Customer Service Occupations were the lowest paid major group at £361, which accounted for approximately 7% of
resident’s occupations.
In addition to the national datasets and surveys, recruitment organisations and some sectors carry out their own
salary reviews which can provide a useful insight into salary levels for some of the key sectors in the County and give
a more “on the ground” impression of industry trends. Furthermore, most jobsearch sites provide salary checkers
derived from the roles and locations of advertised posts and companies these give up to the minute information
from the rapidly changing job marketplace.
Page 21 of 21


![Elements of Income Tax [Rai Foundation] - EIILM University · 2014-03-03 · of income, the Income Tax Act has recognized five heads of income. They are salaries, income from house](https://static.documents.pub/doc/80x56/5f93a19930466137974d0d41/elements-of-income-tax-rai-foundation-eiilm-2014-03-03-of-income-the-income.jpg)


