Page 1
1
INCOME SHOCKS, EDUCATIONAL INVESTMENTS AND CHILD WORK*
Christophe J. Nordmana, Smriti Sharmab and Naveen Sunderc
June 2018
Preliminary: please do not cite or circulate
Abstract: In predominantly agrarian economies with limited irrigation, rainfall plays a critical role in
shaping households’ spending decisions. We estimate the effect of income shocks, as proxied by
exogenous rainfall deviations in annual rainfall from long-term trends, on children’s education and
work status in rural Indian households. Using household-level panel data from the nationally
representative India Human Development Survey, we find that the substitution effect outweighs the
income effect, such that there is a decline in educational expenditures in years characterized by higher
than average rainfall, indicating reduced school attendance. This is accompanied by an increase in
likelihood of children working in household farm, non-farm household enterprise, and animal care
activities. We also document important heterogeneity in impacts based on the household’s caste
affiliation and landownership status.
Keywords: Rainfall shocks, Education expenditures, Child work, India
JEL classification: D13, I21, J16, O12
* We thank Yasmine Bekkouche, Saurabh Singhal and participants at the Nordic Conference in Development Economics
2017 for comments on an earlier draft. a IRD, DIAL and IFP, Pondicherry, India. Email: [email protected] . b UNU-WIDER, Helsinki, Finland. Email: [email protected] (corresponding author). c Cornell University, Ithaca, NY, USA. Email: [email protected] .
Page 2
2
1. Introduction
Households in low-income and developing countries are routinely exposed to a variety of aggregate
income and price shocks. As large shares of populations in these countries rely on rain-dependent
agriculture for their livelihood, rainfall and other climatic shocks constitute critical sources of income
volatility (Dell et al., 2014 provides an overview of the literature on climatic shocks). In the absence
of well-functioning formal credit or insurance markets, households are unable to easily borrow or save
money to tide over periods of income uncertainty. Similarly, imperfect labour markets do not offer
opportunities to households to either hire labour or find alternative employment in the event of
income volatility. These constraints impact the households’ ability to smooth consumption and have
consequences for basic investments in their children, not just through scaling back on consumption
but also via asset liquidation and labour reallocation (e.g., Rosenzweig and Wolpin, 1993; Dercon,
2002; Jacoby and Skoufias, 1997; Rose, 1999).
Aggregate shocks, such as transitory or short-term rainfall shocks, have both income and substitution
effects on agrarian households. In the event of favourable rainfall (i.e., when rainfall is better than the
usual trend), due to higher agricultural productivity, there is an income effect, through which there is
an increase in earnings which expands the pool of resources available to the household for
consumption and investments in children. However, there is also a substitution effect. A possibility of
higher earnings also increases the opportunity cost of children’s time spent in school or time spent
away from income-generating activities.1 Which of these two effects dominates is theoretically
ambiguous.
In this paper, using data from rural India, we examine the contemporaneous impacts of income
shocks, as proxied by exogenous variations in rainfall, on educational investments in children, as
measured by education expenditures, as well as children’s contribution to work. While the previous
literature studying educational outcomes has focused on metrics such as enrolment status and test
scores, we examine child-specific education expenditures, an important parental input into the
learning process. Moreover, we find countercyclical impacts of rainfall shocks on educational
spending. This makes us among the first to document that transitory positive income shocks can
adversely affect investment decisions by parents, potentially translating into long-term consequences
for their children’s human capital. Further, we use a large-scale nationally representative household-
level panel data from India, making our analysis richer than most other studies that rely on repeated
cross-sectional data.
1 Positive rainfall shocks also result in increased wages (Jayachandran, 2006; Kaur, 2018; Shah and Steinberg, 2017).
Page 3
3
To date, existing work on aggregate weather and commodity price shocks provides empirical
evidence of both procyclical and countercyclical effects. In a review article, Ferreira and Schady
(2009) summarize that, in richer countries, child health and education are largely countercyclical in
that they tend to improve during recessions as the substitution effect outweighs the income effect. But
in low-income and middle-income countries, the evidence is more nuanced. Cogneau and Jedwab
(2012) find a procyclical effect of the cocoa crisis in Cote d’Ivoire on school enrolment, labour,
height stature, and morbidity. Björkman-Nyqvist (2013) finds that negative rainfall shocks in Uganda
have detrimental effects on the enrolment and academic performance, particularly for girls. Jensen
(2000) finds that droughts in Cote d’Ivoire reduce school enrolment and increase malnutrition. Beegle
et al. (2006) find that a transitory idiosyncratic income shock in the form of accidental crop loss in
Tanzania decreases school attendance and increases child labour. In contrast, using data from Brazil,
Kruger (2007) finds a countercyclical effect in that probability of school enrolment decreases as the
value of coffee production increases, with stronger effects on low- and middle-income children.
Duryea and Arends-Kuenning (2003) document an increase in the likelihood of child employment
(and decline in schooling) in states that experienced an increase in unskilled wages due to the
Brazilian macroeconomic crises. Using Tanzanian data on child labour, Dumas (2018) shows that the
importance of the income effect vis-à-vis the substitution effect depends crucially on the labour
market quality. Shah and Steinberg (2017) also find a countercyclical effect of rainfall shocks on
school attendance and test scores in rural India.
Using a panel data based on two rounds of the India Human Development Survey that measures
detailed child-specific education expenditures as well as child-specific engagement in a variety of
work categories, and combining it with geo-spatial rainfall data, we find that a positive rainfall shock
significantly reduces total educational expenditures with no change in the probability of enrolment.
This indicates that children are less likely to be attending school in years characterized by higher than
long-term average rainfall. Therefore, our results provide evidence of a countercyclical effect on
educational spending. This is accompanied by an increase in likelihood of children working in on-
farm and off-farm activities. In contrast to most existing literature, our paper documents important
heterogeneity in impacts based on the household’s caste affiliation and landownership status. First,
low caste children’s education spending is more adversely affected, and they are more likely to
engage in wage work in the event of positive rainfall shocks. Second, we find that children in landed
households are more likely to engage in farm work and animal care than children in landless
households in case of positive rainfall deviations. Further, the negative impact of rainfall deviations
on education expenditures is mitigated for children from landed families.
Page 4
4
This paper is organized as follows. Section 2 describes the data sources and the empirical framework
employed. Section 3 presents descriptive statistics, regression results, robustness checks. Section 4
examines heterogeneity in impacts of the rainfall shock. Section 5 concludes.
2. Data and Empirical Specification
2.1 Data Sources
Our primary data of interest come from the two rounds of the India Human Development Survey
(IHDS). The IHDS is a nationally representative panel survey conducted by the University of
Maryland in collaboration with the National Council of Applied Economic Research, New Delhi. The
first round, IHDS-I, was conducted between November 2004 and October 2005 covering 41,554
households across 1,504 villages and 971 urban areas from 33 states and union territories of India
(Desai et al., 2005).2 The second wave of the survey (IHDS-II), took place between November 2011
and October 2012, covering 42,152 households across 1,420 villages and 1,042 urban areas, and could
track 83 percent of households from IHDS-I (Desai et al., 2012). In both rounds, the respondents
included a person who was knowledgeable about the household’s economic situation (usually the
male head of the household) and an ever-married woman aged 15-49. The various modules of the
survey collect data on a wide range of topics including economic activity, income and consumption
expenditure, asset ownership, social capital, education, health, marriage and fertility etc.
While most other datasets usually report total education expenditures at the level of the household,
one of the strengths of this data is the availability of education-related spending for each enrolled
child. Child-specific educational expenditures for the year preceding the survey date are available for
the following three categories: (i) school fees; (ii) books, uniforms, other materials, and
transportation; and (iii) private tuition. We calculate the real total education expenditure per child as
the sum of the abovementioned categories. Further, for each child, the survey also provides
information on their engagement in household farm-related activities, household non-farm businesses,
animal care and external wage work.
As rainfall shocks matter for household income and welfare predominantly in rural areas due to their
reliance on rain-fed agriculture, we limit our sample to observations in rural areas, which constitutes
71 percent of the IHDS households sample.3 However, as a placebo check, we also present results
using the sample of urban households. Since our primary interest is in understanding the allocation of
2 Andaman and Nicobar and Lakshadweep were not included in the sample. These Union Territories account for less than
0.05 percent of India's population. 3 The following twenty states are in our sample: Jammu and Kashmir, Himachal Pradesh, Punjab, Uttarakhand, Haryana,
Rajasthan, Uttar Pradesh, Bihar, Assam, West Bengal, Jharkhand, Orissa, Chhattisgarh, Madhya Pradesh, Gujarat,
Maharashtra, Andhra Pradesh, Karnataka, Kerala and Tamil Nadu.
Page 5
5
educational expenditures and work among school-aged children, we restrict the analysis to households
where there is at least one member aged 5-16 at the time of the survey.
Rainfall shocks are computed based on monthly rainfall data available from the Centre for Climatic
Research at the University of Delaware.4 The first year of data availability is 1900 and we use data
beginning 1980. As the monthly rainfall data are gridded at 0.5 intervals of longitude and latitude, we
match the station closest to the centroid of the district and assign the value of the rainfall at that
station as being the district-level rainfall in a certain month. As a robustness check, following Maccini
and Yang (2009), we also instrument rainfall with the rainfall at the second to fifth closest stations.
We combine the district-level rainfall data with the IHDS data using district identifiers and month and
year of interview available in the latter. We calculate district-month-specific rainfall shocks as the
logarithm of the rainfall in the district in the twelve months preceding the interview minus the
logarithm of the long-term average monthly district rainfall. The long-term rainfall is constructed as
average monthly rainfall between 1980 and 2005 (corresponding to IHDS-I) and 1980 and 2012 (for
IHDS-II), leaving out the twelve months preceding the interview. This definition has been used in
other work (Maccini and Yang, 2009; Björkman-Nyqvist, 2013; Levine and Yang, 2014) and has a
simple interpretation as a percentage deviation from the long-term mean. A positive (negative) value
of the rainfall shock implies higher (lower) than average rainfall within the district.
2.2 Empirical Specification
We estimate the following equation:
𝑌𝑖𝑗𝑑𝑡 = 𝛽0 + 𝛽1 𝑅𝑎𝑖𝑛𝑆ℎ𝑜𝑐𝑘𝑑𝑡 + 𝛽2𝑆𝑒𝑥𝑖𝑗𝑡 + 𝛾𝑖𝑗𝑡 + 𝛿𝑗 + 𝜃𝑡 + 휀𝑖𝑗𝑑𝑡 (1)
where Y is the outcome variable for individual 𝑖 in household 𝑗 in district 𝑑, interviewed in month-
year 𝑡. Our main outcomes under consideration are logarithm of real educational expenditures as well
as binary variables for working in the household farm, household non-farm business, animal care and
wage work. 𝛽1 is the key coefficient of interest and measures the effect of a rainfall shock in district 𝑑
in month-year 𝑡. Among individual-level covariates, we control for sex that takes value 1 if female
and 0 if male, and year of birth fixed effects (𝛾𝑖𝑗𝑡). We include survey month-year fixed effects (𝜃𝑡)
as well as household fixed effects (𝛿𝑗) to purge the estimates of any influence of time-invariant
household characteristics that are jointly related to outcomes and to the likelihood of experiencing the
rainfall shock. 휀𝑖𝑗𝑑𝑡 is the individual-specific error term. Errors are assumed to be correlated within
districts, therefore, we cluster standard errors at the district level.
4 Data available at: https://www.esrl.noaa.gov/psd/data/gridded/data.UDel_AirT_Precip.html#tools.
Page 6
6
3. Results
3.1 Descriptive Statistics
In Table 1, we present descriptive statistics. Ninety four percent of the sample is currently enrolled in
school. The average yearly expenditure on education is about INR 1435. The average amounts spent
on school fees and on books, uniforms, and transport are approximately INR 580 and INR 757
respectively. About INR 162 is spent on private tutoring annually. The average rainfall deviation is
approximately 9 percent below the long-term mean.
[Table 1 here]
Twelve percent of children work on the household farm, and about 13.5 percent in tending to animals.
Just over 1 percent work in the non-farm household enterprises. Around 2.5 percent are engaged in
external paid work. This is consistent with other evidence that shows that majority of children in
developing countries are engaged as agricultural and related labour on their family-operated farms. As
expected, most children in wage work are those aged 14-16 years old.
Forty six percent of the sample comprises females. As mentioned before, the sample consists of those
aged 5-16, and the average age is just below 11 years. The average household size is 7.5. 32 percent
belong to the historically marginalized Scheduled Caste and Scheduled Tribes (SCST) categories. 80
percent are Hindus, the dominant religion in India. Over two-thirds of households report owning any
land.
3.2 Regression Results
Using rainfall shocks as proxies of income shocks hinges on the assumption that agricultural
productivity is systematically correlated with rainfall shocks. Previous studies from several
developing country contexts have convincingly shown that rainfall variations have implications for
agricultural productivity such that in periods of low (high) rainfall, yields of important crops are
significantly lower (higher), thereby affecting rural incomes.5 For India, Jayachandran (2006) and
Shah and Steinberg (2017) show that yields of key crops such as rice, wheat and jowar are sensitive to
rainfall variations. Therefore, rainfall shocks can serve as a plausible proxy for income shocks in rural
India.
In Table 2, we present regression estimates of equation (1). In column 1, we estimate the effect of
rainfall shocks on enrolment status and find that there is no statistically or economically significant
impact. In column 2, we examine impacts on total education expenditures. The results point towards a
5 For example, see Levine and Yang (2014) for Indonesia, Hidalgo et al. (2010) for Brazil, Yang and Choi (2007) for
Philippines, and Björkman-Nyqvist (2013) for Uganda. Dell et al. (2014) provide an overview.
Page 7
7
countercyclical effect such that a transitory increase in rainfall over the long-term mean leads to a
decline in education spending. This is consistent with countercyclical effects observed in Shah and
Steinberg (2017) using recent data on test scores from India. Upon disaggregating the educational
expenditures into its three sub-components in columns 3-5, we find negative effects of rainfall on
school fees and also on associated costs of schooling in the form of spending on books, uniforms, and
transportation. While the survey does not canvass information on school attendance, the lack of a
significant effect on enrolment combined with decreased spending on essential costs of schooling,
provides a strong indication that children are attending school less frequently in periods characterized
by higher than usual rainfall. In terms of other controls, we find that girls are less likely to be enrolled
and significantly lower amounts are spent on them on all categories of education expenditures. This is
in accordance with other evidence from India (e.g., Azam and Kingdon, 2013; Maitra et al., 2016).
[Table 2 here]
In Table 3, we proceed to examine effects of rainfall deviations on children’s participation in different
types of work. In higher rainfall years, children are significantly more likely to work on the household
farm, engage in the household’s non-farm enterprise, as well as spend time on tending to livestock.
There is a negligible and insignificant effect on participation in wage work. As the IHDS data do not
contain information on children’s involvement in domestic chores such as cooking, cleaning and
caring for elders or younger siblings, we are unable to examine effects on outcomes related to
household chores. Results from Tables 2 and 3 show that while transitory rainfall shocks do not
reduce enrolment in schools, there are lower expenditures on education, indicating reduced attendance
at school. This reduced school attendance is accompanied by a greater likelihood of children being
engaged in various household activities. That we do not observe an effect on the margin of enrolment
along with a significant increase in children’s probability of work is has also been previously
observed (e.g., Beegle et al., 2006; Ravallion and Wodon, 2000). However, existing literature
documents unfavourable effects of child work on learning outcomes (e.g., Heady, 2003; Gunnarson et
al., 2006; Emerson et al., 2017). Our results may also be the channel explaining the countercyclical
effects on test scores in Shah and Steinberg (2017).
[Table 3 here]
3.3 Robustness Checks
The first robustness check is concerned with measurement error in the rainfall variable, which can
lead to attenuated impact estimates. As rainfall recorded at the weather station closest to the district
centroid may be an imperfect measure of the actual rainfall faced by a household, as in Maccini and
Yang (2009), we estimate an instrumental variables (IV) regression. Here, rainfall at the weather
Page 8
8
station closest to the district centroid is instrumented by average rainfall in the second, third, fourth
and fifth closest stations. In Table 4, we find that our results are qualitatively similar when using this
IV. We find that an increase in rainfall is associated with lower educational spending and a greater
likelihood of engagement in farm work, non-farm business, and animal care by children.
[Table 4 here]
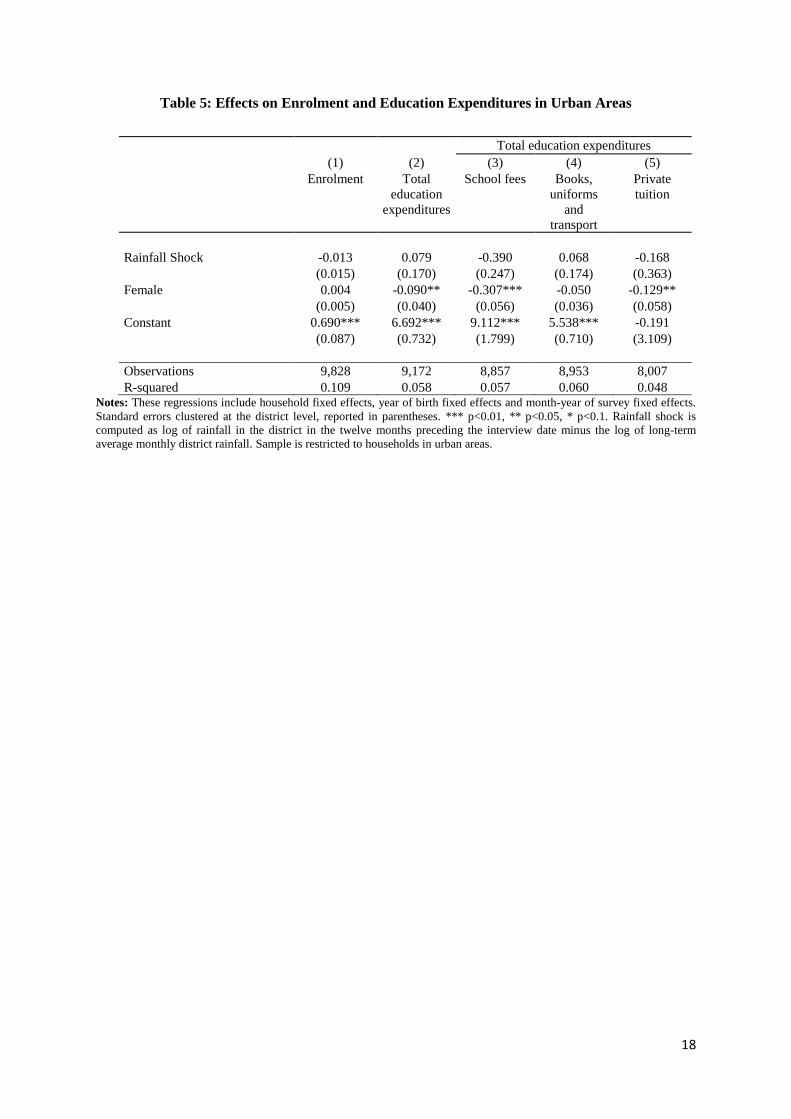
In Table 5, we conduct a placebo test by limiting the sample only to urban areas. A priori we would
not expect any impacts of rainfall shocks on spending decisions for urban households as (rain-
dependent) agriculture is primarily a rural activity. The results show that none of the educational
expenditures in urban areas are significantly associated with rainfall deviations. We find that the
female disadvantage in educational spending also prevails in urban India.
[Table 5 here]
4. Heterogeneity Analyses
We now examine some avenues of heterogeneity. In this section, we report results for the following
outcomes: enrolment, total educational spending, farm work, non-farm household enterprise, animal
care, and wage work.
The first avenue we explore is gender. Existing evidence generally documents a significant gender
gap in the health and education domains, with females’ being more vulnerable to income shocks. For
instance, Rose (1999) finds that favourable rainfall shocks increase the ratio of survival probability of
girls vis-à-vis that of boys. Focusing on education-related outcomes, Björkman-Nyqvist (2013), using
panel data from Uganda, finds that negative rainfall shocks adversely affect the enrolment and
academic performance of girls, with no effects on boys. Zimmermann (2012) finds that girls’ school
enrolment is more sensitive to rainfall variations than that of boys. On the other hand, Shah and
Steinberg (2017) do not find significant gender differences in the effects of rainfall shocks on test
scores in India. In Table 6, upon interacting rainfall shocks with child gender, we find that transitory
rainfall shocks have different effects on the work status of boys and girls. Specifically, our results
show that girls are less likely to engage in farm work and wage work in periods of better rainfall.
However, in such times, it is possible that girls are more likely to substitute for adult women in
domestic chores that we cannot identify in the data.
[Table 6 here]
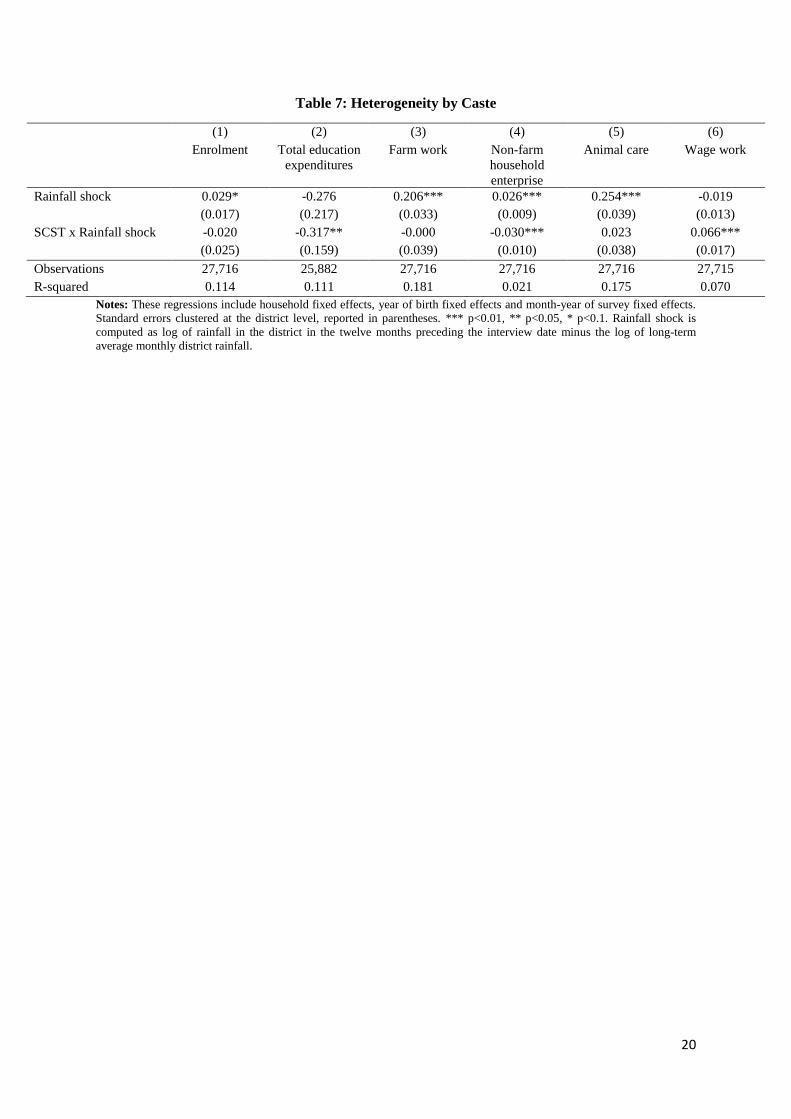
In Table 7, we examine heterogeneity by caste. Caste is a deeply embedded institution in India that is
highly correlated with one’s social status and economic well-being in India. The Scheduled Castes
and Scheduled Tribes (SCSTs) are the marginalized groups that have been historically subjected to
Page 9
9
practices of untouchability and large-scale exclusion from mainstream society. While affirmative
action was enacted in 1950 after the country gained independence, and there have been some
improvements in terms of educational attainment and incomes (e.g., Hnatkovska et al., 2012), lower
castes continue to fare systematically worse than upper castes on a variety of socioeconomic
indicators (Deshpande, 2011 provides an overview). Using caste as a proxy for socioeconomic status
as it is determined exogenously at birth (and is therefore time invariant), and interacting that with the
rainfall shock, we find that a transitory increase in rainfall induces SCST households to scale back
more than non-SCST households on the amount spent on their children’s education, thereby
worsening the impact of the shock. Further, SCST children are more likely to engage in paid work
during such periods. This is potentially explained by a greater credit constraint faced by these
households because of which they are unable to hire labour to maximize the productivity gains
accruing from higher than usual rainfall. Adults are potentially spending more time on the farm while
children engage in wage work. That SCST children are less likely to work in non-farm household
enterprise is explained by the fact that SCSTs tend to perform significantly worse than other higher
caste groups in terms of enterprise ownership and performance (Deshpande and Sharma, 2013 and
2016).
[Table 7 here]
The third aspect we examine is related to land wealth. On the one hand, wealthier or land-rich
households are in a better position to buffer against shocks, implying that the outcomes of children are
less sensitive to weather variability (Beegle et al., 2006). However, in the presence of labour market
imperfections, households owning land may not be able to hire appropriate outside labour to take
advantage of the productivity shock, leading them to rely on family labour (Bhalotra and Heady,
2003; Dumas, 2007; Dumas, 2018). Further, concerns of moral hazard with hired labour may lead to a
preference for household labour. To examine this, we create a binary variable any land that takes a
value 1 if the household owns any land, and 0 otherwise.6 Results in Table 8 show that children in
landed households are more likely to engage in farm work and animal care than children in landless
households in case of positive rainfall deviations. This is in line with evidence presented in Bhalotra
and Heady (2003), who using data from rural Pakistan and Ghana, find that the likelihood of child
work is positively related to the size of landholding. Further, the negative impact of rainfall shocks on
education expenditures is smaller for children from landed families. We also find that children from
land-owning households are less likely to engage in external wage work in periods of better rainfall.
[Table 8 here]
6 In this analysis, we do not examine the intensive margin of landownership (i.e., land size).
Page 10
10
Finally, we examine heterogeneous impacts based on exposure to a large-scale public works program.
The reason we examine this policy is because it is one of the world’s largest workfare programs that
was introduced between the two rounds of the data we use for this study. India’s National Rural
Employment Guarantee Act (NREGA) announced in 2005, legally guarantees 100 days of unskilled
wage employment in a year to a rural household whose adult members are willing to undertake
unskilled manual work at state-level statutory minimum wages. The program was rolled out in three
phases in 2006, 2007 and 2008 with the 200 poorest districts being the earliest program recipients.
Several studies find that the program increased rural private sector wages (e.g., Azam, 2012; Berg et
al., 2018; Imbert and Papp, 2015). We examine if exposure to the program has differential effects on
the relationship between rainfall shocks and child education and work. As the first IHDS wave in
2004-05 is entirely pre-NREGA and the second wave in 2011-12 is post-NREGA rollout, we
operationalize this by interacting the rainfall shock with the length of program exposure at the district
level (measured as number of months elapsed between the NREGA rollout and the median interview
month for a district in IHDS-II). Our results (Table A1 in the online appendix) show that the duration
of a district’s exposure to the NREGA has no differential impact on the relationship between rainfall
shocks and allocation of child-specific educational expenditures and work.
5. Conclusion
Increased rainfall can have both income and substitution effects – income effect dictates a higher
investment in children via enhanced earnings. Simultaneously, there is a rise in the opportunity cost of
child labour which in turn leads to increased participation in children’s work inside and outside the
household. We examine which of these effects is stronger by the estimating the effect of income
shocks, as proxied by exogenous rainfall shocks, on children’s education and work status in rural
Indian households. Using household-level panel data from the nationally representative India Human
Development Survey, we find that there is a decline in educational expenditures in years characterized
by higher than average rainfall. Combined with no significant effect on school enrolment, this points
towards reduced school attendance. This indicates a countercyclical effect such that the
substitution/productivity effect of rainfall exceeds the income effect. This is accompanied by an
increase in likelihood of children working in household farm, non-farm household enterprise, and
animal care activities. These results have implications for the learning outcomes. In contrast to most
existing literature, our paper documents important heterogeneity in impacts based on the household’s
caste affiliation and landownership status. Low caste children’s education spending is more adversely
affected, and they are more likely to engage in wage work in the event of positive rainfall shocks.
Children in landed households are more likely to engage in farm work and animal care than children
in landless households in case of positive rainfall deviations. Further, the negative impact of rainfall
deviations on education expenditures is mitigated for children from landed families.
Page 11
11
References
Azam, M. (2012). The impact of Indian job guarantee scheme on labor market outcomes: Evidence
from a natural experiment. IZA DP No. 6548.
Azam, M., and Kingdon, G. (2013). Are girls the fairer sex in India? Revisiting intra-household
allocation of education expenditure. World Development, 42, 143-164.
Beegle, K., Dehejia, R.H., and Gatti, R. (2006). Child labor and agricultural shocks. Journal of
Development Economics, 81, 80-96.
Berg, E., Bhattacharya, S., Rajasekhar, D., and Manjula, R. (2018). Can public works increase
equilibrium wages? Evidence from India’s National Rural Employment Guarantee. World
Development, 103, 239-254.
Bhalotra, S., and Heady, C. (2003). Child farm labor: The wealth paradox. World Bank Economic
Review, 17(2), 197-227.
Björkman-Nyqvist, M. (2013). Income shocks and gender gaps in education: Evidence from Uganda.
Journal of Development Economics, 105, 237-253.
Cogneau, D., and Jedwab, R. (2012). Commodity price shocks and child outcomes: The 1990 cocoa
crisis in Cote d’Ivoire. Economic Development and Cultural Change, 60(3), 507-534.
Dell, M., Jones, B.F., and Olken, B.A. (2014). What do we learn from the weather? The new climate-
economy literature. Journal of Economic Literature, 52(3), 740-798.
Dercon, S. (2002). Income risk, coping strategies, and safety nets. World Bank Research
Observer,17(2), 141-166.
Desai, S., Vanneman, R., and National Council of Applied Economic Research, New Delhi (2005).
India Human Development Survey (IHDS). ICPSR22626-v8. Ann Arbor, MI: Inter-university
Consortium for Political and Social Research [distributor], 2010-06-29.
Desai, S., Vanneman, R., and National Council of Applied Economic Research, New Delhi (2012).
India Human Development Survey-II (IHDS-II). ICPSR36151-v2. Ann Arbor, MI: Inter-
university Consortium for Political and Social Research [distributor], 2015-07-31.
Deshpande, A. (2011). The Grammar of Caste. Oxford University Press.
Deshpande, A., and Sharma, S. (2013). Entrepreneurship or survival? Caste and gender of small
business in India. Economic and Political Weekly, XLVIII (28), 38-49.
Deshpande, A., and Sharma, S. (2016). Disadvantage and discrimination in self-employment: Caste
gaps in earnings in Indian small businesses. Small Business Economics, 46(2), 325-346.
Dumas, C. (2007). Why do parents make their children work? A test of the poverty hypothesis in rural
areas of Burkina Faso. Oxford Economic Papers, 59(2), 301-329.
Dumas, C. (2018). Productivity shocks and child labor: The role of credit and labor markets.
Economic Development and Cultural Change, forthcoming.
Page 12
12
Duryea, S., and Arends-Kuenning, M. (2003). School attendance, child labor and local labor market
fluctuations in urban Brazil. World Development, 31 (7), 1165-1178.
Emerson, P.M., Ponczek, V., and Souza, A.P. (2017). Child labor and learning. Economic
Development and Cultural Change, 65(2), 265-296.
Ferreira, F.H.G., and Schady, N. (2009). Aggregate economic shocks, child schooling, and child
health. World Bank Research Observer, 24, 147-181.
Gunnarson, V., Orazem, P.F., and Sanchez, M.O. (2006). Child labor and school achievement in Latin
America. World Bank Economic Review, 20(1), 31-54.
Heady, C. (2003). The effect of child labor on learning achievement. World Development, 31(2), 385-
398.
Hidalgo, F.D., Naidu, S., Nichter, S., and Richardson, N. (2010). Economic determinants of land
invasions. Review of Economics and Statistics, 92(3), 505-523.
Hnatkovska, V., Lahiri, A., and Paul, S. (2012). Castes and labor mobility. American Economic
Journal: Applied Economics, 4(2), 274-307.
Imbert, C., and Papp, J. (2015). Labor market effects of social programs: Evidence from India’s
employment guarantee. American Economic Journal: Applied Economics, 7(2), 233-263.
Jacoby, H., and Skoufias, E. (1997). Risk, financial markets, and human capital in a developing
country. Review of Economic Studies, 64(3), 311-335.
Jayachandran, S. (2006). Selling labor low: wage responses to productivity shocks in developing
countries. Journal of Political Economy, 114(3), 538-575.
Jensen, R. (2000). Agricultural volatility and investments in children. American Economic Review:
Papers and Proceedings, 90(2), 399-404.
Kaur, S. (2018). Nominal wage rigidity in village labor markets. American Economic Review,
forthcoming.
Kruger, D. (2007). Coffee production effects on child labor and schooling in rural Brazil. Journal of
Development Economics, 82, 448-463.
Levine, D.I., and Yang, D. (2014). The impact of rainfall on rice output in Indonesia. NBER Working
Paper 20302.
Maccini, S., and Yang, D. (2009). Under the weather: Health, schooling, and economic consequences
of early-life rainfall. American Economic Review, 99(3), 1006-1026.
Maitra, P., Pal, S., and Sharma, A. (2016). Absence of altruism: Female disadvantage in private
school enrolment in India. World Development, 85, 105-125.
Ravallion, M., and Wodon, Q. (2000). Does child labour displace schooling? Evidence on behavioral
responses to an enrollment subsidy. The Economic Journal, CX, 158-175.
Rose, E. (1999). Consumption smoothing and excess female mortality in India. The Review of
Page 13
13
Economics and Statistics, 81(1), 41-49.
Rosenzweig, M. R., and Wolpin, K. I. (1993). Credit market constraints, consumption smoothing,
and the accumulation of durable production assets in low-income countries: Investments in
bullocks in India. Journal of Political Economy, 101(2), 223-244.
Shah, M., and Steinberg, B.M. (2017). Drought of opportunities: Contemporaneous and long-term
impacts of rainfall shocks on human capital. Journal of Political Economy, 125(2), 527-561.
Yang, D., and Choi, H. (2007). Are remittances insurance? Evidence from rainfall shocks in the
Philippines. World Bank Economic Review, 21(2), 219-248.
Zimmermann, L. (2012). Remember when it rained: The elusiveness of gender discrimination in
Indian school enrolment. IZA DP No. 6833.
Page 14
14
Table 1: Descriptive Statistics
(1)
Mean
(2)
Standard deviation
Education related:
Currently enrolled 0.936 0.245
Total education expenditure 1435.659 2345.968
Expenditures on school fees 580.595 1625.227
Expenditures on books, uniforms, transport 757.603 993.476
Expenditures on private tuitions 161.826 565.621
Work related:
Farm work 0.122 0.328
Non-farm household enterprise 0.012 0.111
Animal care 0.135 0.341
Wage work 0.026 0.159
Right-hand side:
Rainfall shock -0.092 0.227
Female 0.462 0.499
Age 10.856 3.201
Household size 7.497 3.291
Scheduled Caste/Tribe (SCST) 0.322 0.467
Any land owned (binary variable) 0.672 0.469
Observations 27,719 Notes: Authors’ calculations using India Human Development Surveys, 2004-05 and 2011-12. Rainfall shock is computed
as log of rainfall in the district in the twelve months preceding the interview date minus the log of long-term average
monthly district rainfall.
Page 15
15
Table 2: Effects on Enrolment and Education Expenditures
Total education expenditures
(1) (2) (3) (4) (5)
Enrolment Total
education
expenditures
School fees Books,
uniforms
and
transport
Private
tuition
Rainfall Shock 0.023 -0.380* -1.341*** -0.457* 0.114
(0.015) (0.217) (0.340) (0.247) (0.265)
Female -0.011*** -0.217*** -0.407*** -0.160*** -0.228***
(0.003) (0.023) (0.040) (0.022) (0.031)
Constant 0.796*** 6.364*** 4.751*** 5.569*** 1.728**
(0.064) (0.857) (0.764) (0.880) (0.667)
Observations 27,719 25,885 24,623 25,457 22,121
R-squared 0.114 0.111 0.123 0.104 0.056 Notes: These regressions include household fixed effects, year of birth fixed effects and month-year of survey fixed effects.
Standard errors clustered at the district level, reported in parentheses. *** p<0.01, ** p<0.05, * p<0.1. Rainfall shock is
computed as log of rainfall in the district in the twelve months preceding the interview date minus the log of long-term
average monthly district rainfall.
Page 16
16
Table 3: Effects on Children’s Work
(1) (2) (3) (4)
Farm work Non-farm
household
enterprise
Animal care Wage work
Rainfall Shock 0.206*** 0.016** 0.262*** 0.003
(0.033) (0.008) (0.036) (0.015)
Female -0.026*** -0.006*** -0.008* -0.010***
(0.004) (0.001) (0.005) (0.002)
Constant 0.221** 0.031 0.253** 0.022
(0.088) (0.035) (0.114) (0.045)
Observations 27,719 27,719 27,719 27,718
R-squared 0.181 0.020 0.175 0.068 Notes: These regressions include household fixed effects, year of birth fixed effects and month-year of survey fixed effects.
Standard errors clustered at the district level, reported in parentheses. *** p<0.01, ** p<0.05, * p<0.1. Rainfall shock is
computed as log of rainfall in the district in the twelve months preceding the interview date minus the log of long-term
average monthly district rainfall.
Page 17
17
Table 4: Instrumental Variables Regressions
(1) (2) (3) (4) (5)
Total education
expenditures
Farm work Non-farm
household
enterprise
Animal care Wage work
Rainfall Shock -0.882*** 0.124*** 0.0185* 0.228*** -0.0271
(0.259) (0.0419) (0.0102) (0.0489) (0.0216)
Female -0.228*** -0.0265*** -0.00582*** -0.00830* -0.0102***
(0.0229) (0.00460) (0.00153) (0.00503) (0.00214)
Constant 6.326*** 0.217** 0.0316 0.255** 0.0201
(0.855) (0.0887) (0.0347) (0.114) (0.0449)
Observations 24,793 26,550 26,550 26,550 26,549
Notes: These regressions include household fixed effects, year of birth fixed effects and month-year of survey fixed effects.
Standard errors clustered at the district level, reported in parentheses. *** p<0.01, ** p<0.05, * p<0.1. Rainfall shock is
computed as log of rainfall in the district in the twelve months preceding the interview date minus the log of long-term
average monthly district rainfall. Rainfall instrumented with rainfall in the second through fifth closest rainfall stations
following Maccini and Yang (2009).
Page 18
18
Table 5: Effects on Enrolment and Education Expenditures in Urban Areas
Total education expenditures
(1) (2) (3) (4) (5)
Enrolment Total
education
expenditures
School fees Books,
uniforms
and
transport
Private
tuition
Rainfall Shock -0.013 0.079 -0.390 0.068 -0.168
(0.015) (0.170) (0.247) (0.174) (0.363)
Female 0.004 -0.090** -0.307*** -0.050 -0.129**
(0.005) (0.040) (0.056) (0.036) (0.058)
Constant 0.690*** 6.692*** 9.112*** 5.538*** -0.191
(0.087) (0.732) (1.799) (0.710) (3.109)
Observations 9,828 9,172 8,857 8,953 8,007
R-squared 0.109 0.058 0.057 0.060 0.048 Notes: These regressions include household fixed effects, year of birth fixed effects and month-year of survey fixed effects.
Standard errors clustered at the district level, reported in parentheses. *** p<0.01, ** p<0.05, * p<0.1. Rainfall shock is
computed as log of rainfall in the district in the twelve months preceding the interview date minus the log of long-term
average monthly district rainfall. Sample is restricted to households in urban areas.
Page 19
19
Table 6: Heterogeneity by Gender
(1) (2) (3) (4) (5) (6)
Enrolment Total education
expenditures
Farm work Non-farm
household
enterprise
Animal care Wage work
Rainfall shock 0.032** -0.430** 0.226*** 0.018** 0.257*** 0.014
(0.016) (0.216) (0.035) (0.008) (0.040) (0.017)
Female -0.013*** -0.207*** -0.030*** -0.006*** -0.007 -0.012***
(0.004) (0.025) (0.005) (0.002) (0.006) (0.003)
Female x Rainfall shock -0.020 0.108 -0.042** -0.006 0.011 -0.025***
(0.014) (0.081) (0.018) (0.006) (0.021) (0.009)
Observations 27,719 25,885 27,719 27,719 27,719 27,718
R-squared 0.114 0.111 0.182 0.021 0.175 0.069
Notes: These regressions include household fixed effects, year of birth fixed effects and month-year of survey fixed effects.
Standard errors clustered at the district level, reported in parentheses. *** p<0.01, ** p<0.05, * p<0.1. Rainfall shock is
computed as log of rainfall in the district in the twelve months preceding the interview date minus the log of long-term
average monthly district rainfall.
Page 20
20
Table 7: Heterogeneity by Caste
(1) (2) (3) (4) (5) (6)
Enrolment Total education
expenditures
Farm work Non-farm
household
enterprise
Animal care Wage work
Rainfall shock 0.029* -0.276 0.206*** 0.026*** 0.254*** -0.019
(0.017) (0.217) (0.033) (0.009) (0.039) (0.013)
SCST x Rainfall shock -0.020 -0.317** -0.000 -0.030*** 0.023 0.066***
(0.025) (0.159) (0.039) (0.010) (0.038) (0.017)
Observations 27,716 25,882 27,716 27,716 27,716 27,715
R-squared 0.114 0.111 0.181 0.021 0.175 0.070
Notes: These regressions include household fixed effects, year of birth fixed effects and month-year of survey fixed effects.
Standard errors clustered at the district level, reported in parentheses. *** p<0.01, ** p<0.05, * p<0.1. Rainfall shock is
computed as log of rainfall in the district in the twelve months preceding the interview date minus the log of long-term
average monthly district rainfall.
Page 21
21
Table 8: Heterogeneity by Land Ownership
(1) (2) (3) (4) (5) (6)
Enrolment Total education
expenditures
Farm work Non-farm
household
enterprise
Animal care Wage work
Rainfall shock 0.010 -0.807*** -0.097*** 0.027** 0.199*** 0.040
(0.021) (0.255) (0.031) (0.011) (0.036) (0.026)
Any land 0.005 0.119 0.200*** -0.003 0.057*** -0.004
(0.009) (0.079) (0.013) (0.004) (0.015) (0.006)
Rainfall shock * Any Land 0.020 0.645*** 0.447*** -0.017 0.091*** -0.057**
(0.020) (0.210) (0.040) (0.012) (0.032) (0.022)
Observations 27,719 25,885 27,719 27,719 27,719 27,718
R-squared 0.114 0.112 0.209 0.021 0.177 0.069
Notes: These regressions include household fixed effects, year of birth fixed effects and month-year of survey fixed effects.
Standard errors clustered at the district level, reported in parentheses. *** p<0.01, ** p<0.05, * p<0.1. Rainfall shock is
computed as log of rainfall in the district in the twelve months preceding the interview date minus the log of long-term
average monthly district rainfall.
Page 22
22
Online Appendix
Table A1: Heterogeneity by NREGA Exposure
(1) (2) (3) (4) (5) (6)
Enrolment Total education
expenditures
Farm work Non-farm
household
enterprise
Animal care Wage work
Rainfall shock 0.025 -0.541** 0.167*** 0.021** 0.243*** 0.007
(0.019) (0.248) (0.045) (0.009) (0.044) (0.018)
NREGA Exposure -0.000 0.010** 0.003*** -0.000 0.001* 0.001***
(0.000) (0.004) (0.001) (0.000) (0.001) (0.000)
NREGA x Rainfall
shock
-0.000 0.011 0.002 -0.000 0.001 -0.000
(0.001) (0.008) (0.001) (0.000) (0.001) (0.000)
Observations 27,519 25,698 27,519 27,519 27,519 27,518
R-squared 0.114 0.113 0.184 0.021 0.176 0.069
Notes: These regressions include household fixed effects, year of birth fixed effects and month-year of survey fixed effects.
Standard errors clustered at the district level, reported in parentheses. *** p<0.01, ** p<0.05, * p<0.1. Rainfall shock is
computed as log of rainfall in the district in the twelve months preceding the interview date minus the log of long-term
average monthly district rainfall. NREGA exposure is the number of months in the second wave that the district has been
included under NREGA.