Vasiliy A. Anikin, Yulia P. Lezhnina, Svetlana V. Mareeva, Ekaterina D. Slobodenyuk, Nataliya N. Tikhonovа INCOME STRATIFICATION: KEY APPROACHES AND THEIR APPLICATION TO RUSSIA BASIC RESEARCH PROGRAM WORKING PAPERS SERIES: PUBLIC AND SOCIAL POLICY WP BRP 02/PSP/2016 This Working Paper is an output of a research project implemented within NRU HSE’s Annual Thematic Plan for Basic and Applied Research. Any opinions or claims contained in this Working Paper do not necessarily reflect the views of HSE.
Transcript
Vasiliy A. Anikin, Yulia P. Lezhnina, Svetlana V. Mareeva,
Ekaterina D. Slobodenyuk, Nataliya N. Tikhonovа
INCOME STRATIFICATION:
KEY APPROACHES AND THEIR
APPLICATION TO RUSSIA
BASIC RESEARCH PROGRAM
WORKING PAPERS
SERIES: PUBLIC AND SOCIAL POLICY
WP BRP 02/PSP/2016
This Working Paper is an output of a research project implemented within NRU HSE’s Annual Thematic Plan for
Basic and Applied Research. Any opinions or claims contained in this Working Paper do not necessarily reflect the
views of HSE.
Vasiliy A. Anikin1, Yulia P. Lezhnina
2, Svetlana V. Mareeva
3 (corresponding author),
Ekaterina D. Slobodenyuk4, Nataliya N. Tikhonovа
5
INCOME STRATIFICATION:
KEY APPROACHES AND THEIR APPLICATION TO RUSSIA6
The various approaches to income stratification can be divided into two broad categories – relative and
absolute. Our study suggests that the most widely used thresholds of the absolute approach cannot be
efficiently applied to contemporary Russian society, which has undergone fundamental changes over
the last 15 years regarding income, as they fail to define the subgroups within the population.
Absolute models of stratification which define income groups based on a pre-determined
income thresholds rank Russia in line with industrially advanced rather than developing countries,
rendering the absolute income bounds, set for the latter group of countries, irrelevant.
The relative approach, based on the median income as the social standard of living, appears
more effective for income stratification in Russia. Furthermore, it also implies possibilities for
structural adjustments such as regional- and settlement-specific disparities in income distribution,
which are relevant for Russia given its regional heterogeneity. The application of the relative approach
in authors’ version shows that the income stratification model in Russia is quite stable even during the
economic crisis. The results of the comparison between the Russian income stratification model and
those of other countries confirm that Russia's income stratification model is currently more similar to
those of developed rather than developing countries.
National Research University Higher School of Economics. Institute for Social Policy.
[email protected] 2 National Research University Higher School of Economics. Institute for Social Policy.
[email protected] 3 National Research University Higher School of Economics. Institute for Social Policy.,
[email protected] 4 National Research University Higher School of Economics. Institute for Social Policy.
[email protected] 5 National Research University Higher School of Economics. Institute for Social Policy.
[email protected] 6 The results of the project “Analysis of the demographic and socio-economic behaviour of households at different stages of the life cycle
and assessment of social and tax policies impact on the dynamics of the living standard and its differentiation”, carried out within the
framework of the Basic Research Program at the National Research University Higher School of Economics (HSE) in 2016, are
Income stratification seems to be one of the most straightforward approaches to analysing the
structure of a society as it applies a one-dimensional gradualist scheme of stratification: a “low income
– high income” scale. This method can be used to get quantitative estimates of well-off and poor
groups, to gauge the risks of increased vulnerability to poverty and low income, to access the degree of
inequality and to measure changes in the income of different groups caused by a recession or growth.
This model of stratification is widely used for international cross-country comparisons, as it is based
on income level which is a universal indicator. It is also important for social policies, setting
thresholds defining the poor and needy population eligible for welfare.
However, developing a model for income stratification is not a trivial methodological exercise.
The methods used to define groups based on their positions in the income distribution can be summed
up in two broad approaches – absolute and relative. Most of these approaches (and the resulting
income thresholds) are only to a certain extent applicable to Russia, as they have been developed for
different purposes and countries at different stages of social and economic development7. Given the
variety of methods in use, this paper defines the most efficient approaches to income stratification in
contemporary Russia. To achieving this goal requires several steps: reviewing the key approaches to
absolute and relative income stratification, applying them to empirical data (monitoring surveys 2014–
2016 conducted by the Institute of Sociology of the Russian Academy of Sciences (IS RAS) in 2014–
2016 and the Russian Longitudinal Monitoring Survey (RLMS-HSE) of the Higher School of
Economics, waves of 2014–2015), developing a specific model of income stratification for Russia and
evaluating its heuristic potential both for a comprehensive analysis of the Russian situation and
international comparative analysis. The literature mostly focuses on defining certain social groups but
not on developing the model of stratification – the aim that we address. In order to develop an income
stratification model for Russia, we carry out preliminary testing and a comparison of the relevance of
different absolute and relative approaches in describing modern reality.
The first section of this paper includes an analysis of the main theoretical approaches to income
stratification, while in the second section we apply some of these methods to the representative all-
Russian survey data. We also offer a model of income stratification which works most effectively for
Russian society at its current stage of development.
7 In the paper, we use terms “developed” and “developing” countries to describe societies with different economic and socio-cultural
levels of development. In line with other studies, we prefer to apply this terminology rather than to use the World Bank’s approach, that
of distinguishing high- and low-income countries, because the concept of socio-economic development provides a broader set of
analytical tools for understanding the fundamental differences between countries. See, for example: Chun, N., Hasan, R., Rahman, M.
H., & Ulubaşoğlu, M. A. (2016) and Mitra, S., Posarac, A., & Vick, B. (2013).
4
Key methods of income-based social stratification
Income is one of the key indicators of living standards traditionally included in social
stratification models. There are at least three methodological issues for income stratification studies.
The first relates to justifying the recipients of income – either individuals or households. The second
concerns the necessity of applying the most appropriate equivalence scales to adjust recipient income
to household size. The third and main methodological issue, which is the focus of our analysis, is to
select one of the approaches that apply different criteria for defining income groups and their
boundaries: absolute income thresholds (the absolute approach), which distinguishes income
groups in relation to a clearly defined amount of income, and relative income thresholds (the
relative approach) – based on the mean (less often) / median (more often) income, or income
distribution by percentile groups.
Absolute income thresholds for income stratification
The absolute approach to income stratification is largely borrowed from the corresponding
understanding of poverty – via setting a quantitative needs-based poverty line8, which is typically
defined as a monetary cut-off point set at subsistence level which is in turn set at the value of goods
and services (the consumer basket) necessary for satisfying essential needs and meeting mandatory
payments. Administrative regulations may set the relative share of non-food commodities in the
consumer basket.
Following this logic, the Russian Federal Service for State Statistics (FSSS) defines the groups
of poor for statistical purposes (The Federal State Statistics…, 2015)9 and the needy population for
analytical purposes10
. Statistical services of many other countries, including the joint Statistics Service
of the CIS (and not only the low- and middle-income ones), also use the subsistence level to define the
poverty threshold (Yasinskiy, 2014). The definition of poverty in the US follows the same principles,
but with the additional condition that the relative share of expenditures on food commodities should
not exceed one-third of the minimum consumer basket11
.
8 Starting from Rowntree (1901; 1913). 9In Russia, starting from 2013 the subsistence minimum defines the relative share of expenditures on non-food commodities at 50% (see
the Federal Law “On general consumer basket in the Russian Federation”). In a quarterly Household Budget Survey (HBS), covering
47,800 households across Russia, this group is referred to as “low income”, whereas the group earning half or less than half of
subsistence level is called “extremely poor”. The HBS is conducted to analyse a structure of households’ expenditures and consumption.
The data are obtained from daily spending records filled by respondents and from interviews and then adjusted for the general population
and re-weighted due to the absence of high-income groups in the HBS samples. The spending represents the sum of actual household
expenditures, including both consumer spending and other expenses. Though income data obtained in such a way can be somewhat
inaccurate, they are widely employed to describe the general trends of incomes and to calculate the direct and indirect indicators that can
be used to assess the stratification of the Russian society by income and to draw comparison with other countries (see more at
Chelovecheskij kapital …, 2016; Elefterov, 2011). 10 To define the needy population, FSSS uses the HBS data.
11 More information about the methodology may be found at the Census Bureau's official website
National poverty lines, defined in specific geographical, economic, cultural and other contexts,
make international comparisons only partly relevant. It is also necessary to take into account the
nation's stage of industrialisation when defining boundaries of income groups for a particular country,
so they vary in countries that are at different stages of their development (Cowell, 2011).
Several other methods can be used as alternatives to national poverty metrics. Among them is
the definition of the poverty threshold as the amount of income/expenditures that corresponds to the
consumption of a certain amount of calories (most often 2,100 or 2,400 calories per day, though other
options also exist (Report of the expert group…, 2014)). However, since the same amount of calories
can be consumed from totally different product sets with different costs, this method has a limited
usage.
For comparative research, the methodology of the World Bank (WB) on poverty measures and
their variations are widely used (Chen & Ravallion, 2010; Chen & Ravallion, 2011; Ravallion, 2008;
Ravallion, Chen, & Sangraula, 2009; Ravallion, Datt, & van de Walle, 1991). This method draws
income group thresholds according to the poverty lines of the countries in the WB sample (126
countries in total). It was constructed and used mainly for the analysis of the situation in developing
countries (22 in the 1980s), and their poverty lines served as the basis for the poverty threshold in the
method in general.
In the past, WB widely used a global poverty measure set at $1 per day. The original "$1-a-
day" method was an average of absolute lines (Ravallion et al., 1991), converted to international
dollars at purchasing power parity (PPP12
), for such regions as Africa, East Asia, and the Pacific and
South Asia. For middle-income countries (in such regions as Europe and Central Asia, Latin America
and the Caribbean, and the Middle East and North Africa), the original poverty headcount ratio was set
at $2 per day (the median poverty threshold for all developing nations). However, these values were
several times reassessed because of the increased number of countries in the sample for international
comparison, inflation in the US, a new methodology of collecting PPPs and other factors (Deaton &
Aten, 2014). Numerous WB’s reports used various thresholds such as $1, $1.25, $1.45, $2, $2.5 per
day. Now, instead of the previously used thresholds values of $1 and $2, WB uses $1.9 and $3.1 per
day, respectively (2011 PPP). The amount equal to double the cut-off value of absolute poverty is seen
as the threshold of vulnerability to poverty, i.e. indicating high risks of poverty.
12 The methodology of purchasing power parities (PPPs) is not trivial, so there are many ways to calculate them. The World Bank uses its
proprietary International Comparison Program (ICP, 199 countries participating (see at the World Bank official website
(http://iresearch.worldbank.org/PovcalNet/index.htm?0,2)). To calculate the PPPs, the ICP holds surveys every six years to collect price
and expenditure data for the whole range of final goods and services that comprise GDP including consumer goods and services,
government services and capital goods. The latest PPP data from WB is for the 2011 year, however, the ICP published 2011 PPPs only in
2014. The analysis of income distribution based on PPP exchange rate varies significantly from that based on the official rates. For
example, the USD/RUB rate used by the Word Bank was 29.35 while the PPP rate was 17.35 rubbles per dollar in 2011.
6
The WB concept of drawing the poverty line is further applied to defining the middle class in
the developing countries13
, though different thresholds are used for this purpose. Ravallion (2010) sets
the lower bound of the middle class in developing countries at the poverty line ($2 per day) and the
higher bound ($13 per day) – at the poverty line in the US, therefore suggesting that the members of
the middle class in these countries are not poor compared to the living standards of the majority of
their residents but are poor by the standards of developed or wealthy countries. Ravallion (2010) also
notes that it can be useful to single out the upper-middle class in developing countries at a lower bound
of at least $9 per day (equal to the poverty line in Uruguay, which has the highest cut-off value of
poverty among developing nations studied in Ravallion (2010)). The author believes that in order to be
classified as “Western middle class” one should at least have an income above the US poverty line.
Often the following version of the income stratification in Russia and other countries of Europe
and Central Asia is proposed in WB publications: poor ($5 or less); vulnerable ($5–10); middle class
($10 and more per day) (Meyer & Sanchez-Paramo, 2014). The middle class can be further subdivided
also based on income: $10–25 per day, $25–50 per day, $50 and more per day (Grant & Hansl, 2015).
Applying the same approach to other regions, the respective income in dollars is different (see Vakis,
Jamele, and Lucchetti, 2015, Dang and Ianchovichina, 2016).
Different authors provide other variations of the absolute approach to income stratification.
Milanovic et al. (2002), focusing on defining the global middle class, choose the upper bound of its per
capita income at $50 per day, which is equal to the average income in Italy, the least wealthy among
G7 members. The lower threshold is set equal to the mean earnings in Brazil ($12 per day). Kharas
(2010) chooses the lower threshold of middle-class income in developing countries ($10 per day)
equal to the average between poverty lines of the two developed countries with the lowest of such
values – Italy and Portugal14
.
Some papers verify the lower and upper bounds of middle class incomes by comparing their
estimates to those produced by other approaches – for example, relative ones. For instance, Banerjee et
al. (2008) define the middle class of developing countries as the group between the poor in these
countries and the middle class in developed countries (e.g. the USA), setting the range of per capita
income at $2–10 per day (splitting them further into three groups: $2–4, 4–6 and $6–10), and compare
their results to those of Easterly (2001) and Birdsall, Graham, and Pettinato (2000), who define middle
class via quintiles.
Other papers justify the lower and upper bounds of income by theoretical arguments. López-
Calva and Ortiz-Juarez (2014), for example, define the lower bound of middle-class income to a
13 In economic literature, the term “class” is widely used in the sense of grouping of people on the basis of income. Among sociologists,
this approach is known as a “simple gradational analysis”, which is opposed to the measures of a class via ‘differential control over
income and labour’ (Wright, 2004; Tikhonova, 2014). 14 However, the ground for the upper bound is different – the author proposes $100, which is a doubled median income in Luxembourg,
the richest of the developed countries.
7
maximum of a bearable economic instability for the middle class – i.e. the 10% probability of slipping
into a poverty on a five-year horizon (which is the average level of poverty in countries like Argentina,
Colombia, Costa Rica but slightly smaller than for the whole region)15
.
Non-academic research centres also work towards income stratification scales using national
poverty lines and findings from both WB studies and academic papers (see Tab. 1 regarding PEW
Research Centre (2015) and Court et al. (2010)). For instance, Rose (2016) proposes an income
stratification for the US setting a 2014 income threshold for poor at 1.5x the federal poverty line (i.e.
up to $30,000 equalised annual income for a household of three members), while the rich are defined
in line with the survey responses from people regarding the relative number of rich in the country -
that is, 1–2%, corresponding to $350,000 annual income. The population with incomes between these
thresholds are categorised as middle class with the following subgroups: upper-middle (from $100,000
(5x the official poverty line) to $350,000 per year), middle-middle ($50,000 - $100,000), and lower-
middle ($30,000 - $50,000).
Approaches based on WB methodology in general can be considered “weakly relative”, since
the living standards of high-income countries serve as benchmarks for affluent social groups in
developing countries, and income thresholds are based on calibrated national poverty lines. The
disparity of the living standards of developing nations for the mass social strata of developed countries
leaves little opportunity to propose a unified scale of income-based stratification for them. As for more
prosperous nations, researchers either multiply these figures by some factor or use entirely different
approaches. Since developed nations are more concerned about the issues of social exclusion and
socio-economic deprivation (Townsend, 1987), rather than physical survival (as in African countries,
for example), most developed countries apply so-called relative poverty lines (or a “strongly relative
approach”, whereas the absolute approach is most often used in developing countries.
Tab. 1 presents a systematic review of the existing ways of categorising income groups using
the methods based on the absolute approach.
Generally speaking, though there is no consensus in the literature on income stratification
thresholds, the views on the upper threshold of the low-income strata and the lower threshold of the
middle class are more congruent than estimates of the upper bound of the middle class or thresholds
for high-income strata. For example, Rank (1999), Danziger, Gottschalk, and Smolensky (1989) and
Hirschl, Altobelli, and Rank (2001) set the upper demarcation of the middle class at 8, 10 and 12x
national poverty lines, respectively. Furthermore, theoretical justifications of these thresholds provoke
many questions since they are often ad hoc postulated, or superficially considered.
15 In order to arrive at the amount of income equivalent to this level of vulnerability, researchers explore what income level associates
with this by making a model that incorporates demographic and labour force indicators and the shocks that households may encounter.
8
Tab. 1. Absolute income thresholds for income stratification, by selected papers, US dollars (PPP) per capita per day 16
Authors,
years
Low income Middle income (MI)
High income Geography of methodology
implementation Extremely
poor Poor
Vulnerable to
poverty
Lower
MI
Middle
MI
Higher
MI
Ravallion (2010);
Ravallion et al. (2009) 1.25 2- 9 9-13 Developing countries
Vakis et al. (2015) below 2.5 2.5-4 4-10 10-50 Latin America and the Caribbean
Dang and Ianchovichina (2016) below 2 2-4.9 above 4.9 The Middle East and North Africa
Meyer and Sanchez-Paramo (2014) below 517 5-10 10-50 above 50 Russia Federation,
Europe and Central Asia
Grant and Hansl (2015) below 5 5-10 10-25 25-50 above 50 Russia
Milanovic and Yitzhaki (2002) 12-50 Global middle class,1993
Banerjee and Duflo (2008) 2-4 4-6 6-10 11 developing countries18
Kharas (2010);
Cardenas, Kharas, and Henao (2011) 10-100
Global middle class;
Latin America
López-Calva and Ortiz-Juarez (2014) 10-50 Chile, Mexico, Peru
PEW Research Center (2015) below 2 2.01-10 10.01-20 20.01-50 Over 50 All countries
Court and Narasimhan (2010)19 9 9-15 15-40 40 -77 Over 77 Developing countries, including
Russia, Poland
Based on poverty line, multiplication coefficient
Burkhauser, Smeeding, and Merz (1996)
2-5 and
0.75-5 USA & Germany
Rose (2016) 1.5 1.5-2.5 2.5-5 5-17.5 1-2% USA
Hirschl et al. (2001)
8, 10 and 12
USA
16 As various authors focus on different social strata and/or present different configurations of social structures, some cells in the table hereafter (see Tab. 2) left blank, meaning these positions were not
mentioned by the respective authors in their publications. The authors of this paper aligned the income groups outlined by the researchers with the categories in the table to their own subjective
discretion, as all the authors use their own classifications. 17 It should be noted that some publications set the poverty threshold for Russia at $4 per day (Statistika SNG, 2015). The “Extreme poverty” and “poverty” levels for all the countries in the “Europe and
Central Asia” region (where the WB places Russia) are set at $2.5 and $5 per day, respectively. 18 This classification was based on expenditures. 19 A referential adjustment to comparable indicators is provided.
9
Relative income thresholds for income stratification
The relative approach to defining the boundaries between groups in income stratification is a
major alternative to the absolute approach. It divides groups by income based either on percentile
distribution or comparison with the average or median income that indicates an average standard of
living in a specific society. The median income is usually preferred as it eliminates the distortion
effect of outliers.
The definition of income groups by percentiles usually is done symmetrically. For example,
Easterly (2001) and Barro (2000) rank everyone within the second to fourth percentiles (between 20
and 80%) as middle class. Dallinger (2013) applies the same boundaries but also proposes using
quintiles ‘in order to capture the internal differentiation of the societal middle’ (Ibid, p. 88). That is,
the middle-middle class in a narrow sense is the middle 20% of the income distribution (quintile 3),
lower-middle class is below it (quintile 2), and, above it, lies the upper-middle class (quintile 4).
Partridge (1997) defines the middle class as Dallinger's middle-middle class (quintile 3) only.
The quintiles other than the central ones are also used to define the middle class in the
academic literature, but less often. Alesina and Perotti (1996) as well as Bellettini and Ceroni
(2007), for example, define the middle class as those in the third and fourth quintiles, whereas
Solimano (2008) sets out the middle class concerning those within the third and ninth deciles.
The income boundaries of the most affluent groups are the most disputable issue of income
stratification, even when divided by deciles. Peichl and Pestel (2011), as well as Bellettini and
Ceroni (2007), set the respective upper bound at the 80% percentile, which is in line with most
other studies that consider the top bound of middle-class income as the lower threshold of high-
income groups (see Tab. 2). There are also approaches that rank a much lower share of population
(0.5–10%) as high-income strata: Solimano (2008) sets it at 10%, Dynan, Skinner, and Zeldes
(2004) – 1% or 5%, Carroll (2002), Weicher (1997) and Wolff (2010) – 1%, Beeghley (2004) –
0.9%, Feenberg and Poterba (2000) – 0.5%. However, the authors scarcely provide any clear
reasons for their choice of income thresholds.
The percentile method is traditionally criticised (e.g. by Birdsall et al. (2000)) because it
yields groups of predetermined fixed sizes. This problem does not come up if the income
stratification is based on median income.
For poverty, OECD methodology, widely used by various European statistics agencies,
defines the poverty line at half the median household income of the total population20
(though 40%,
60% or 70% levels can be used too). Eurostat views the equivalised income of less than 60% of the
20 More information about the methodology you may find at the OECD official website (https://data.oecd.org/inequality/poverty-
rate.htm).
10
median income in the country as the at-risk-of-poverty threshold21
. These figures are widely used
by the academic community to define relative poverty indicators.
The relative approach based on median income traditionally defines the middle class as
those with incomes “around” the median income – from 0.75x to 1.25x (Thurow (1987), Birdsall et
al. (2000), Pressman (2007), Pressman and Scott (2009), Chauvel (2013)). Atkinson and Brandolini
(2013) propose a theoretical reasoning for the 0.75x and 1.25x cut-offs. Following Horrigan and
Haugen (1988), the authors suppose that the lower endpoint of the middle class should represent ‘an
income significantly above the poverty level’ and ‘comfortably clear’ secure ‘of being at-risk-of-
poverty’. In the course of this, the at-risk-of-poverty line is set as 0.6x median (disposable money)
income22
, whereas the lower bound of the middle class is defined as the at-risk-of-poverty line
increased by 25% – i.e. 0.75x median cut-off. In contrast, a rationale behind setting 1.25x median
income as an upper endpoint of the middle class is less obvious, apart from its symmetry with the
0.75x threshold; authors tend to refer to the successful use of this threshold by Pressman (2007).
Ultimately, Atkinson and Brandolini (2013) distinguish lower and upper middle classes (0.6–0.75x
and 1.25-1.67x median income (a quarter more than 1.25x cut-off), respectively).
Chauvel (2006) defines the lower and upper demarcations of the middle-class income within
a wider range – from 0.50x to 2x relative adjusted disposable income23
. Later Chauvel (2013),
taking into account the works of her colleagues, particularly Pressman (2007) and Atkinson and
Brandolini (2013), and analysing the equalised relative disposable income distribution curve,
concludes that the middle class is not homogeneous and divides it into the "lower" (0.75–1.25x
median) and “upper” (1.5-2.5x median) segments. Grabka and Frick (2008) use the 0.7–1.5x
median range for Germany, while Blackburn and Bloom (1985) apply values of 0.6-2.25x for the
US, Vanneman and Dubey (2013) – 0.5-2х for India, and Ólafsson and Kristjansson (2013) – 0.75-
1.5x for Iceland.
The US-based PEW Research Centre (Fry & Kochhar, 2016) defines the middle class (or the
population “with the average income level”) as those with the annual income per household of three
members (the closest integer number to the average household size in the US in 2015 – 2.5x) from
0.67-2x the nationwide median24
.
The upper threshold of the middle-class income, serving as the lower threshold for rich, also
has no consensus definition. Peichl, Schaefer, and Scheicher (2010) see this as 2x median,
21 More information about the methodology you may find at Eurostat official website (http://ec.europa.eu/eurostat/web/products-
datasets/-/tesov016). 22 Atkinson and Brandolini (2013) define the disposable money income as the sum of all cash incomes earned by the household, net
of income taxes and social contributions. 23 According to Chauvel (2006), the relative adjusted disposable income is a total net income after taxes and transfers, adjusted by
household size, where the equivalence scale is the square-root of the number of residents of the household. 24 More information about the methodology you may find in complete Technical Documentation about the Current Population
Survey (CPS) at the Census Bureau's official website (http://www.census.gov/programs-surveys/cps/technical-
documentation/complete.html).
11
Brzezinski (2010) – 2, 3 and 4x median (and the upper 1%, 5% and 10%). According to Medeiros
(2006) the affluence line may be considered at the level of 4x standard deviations above average
income, which gives 1% of the reach in Brazil.
Attempts to justify the income demarcations of groups within the relative approach to
stratification are more typical for studies focused on higher-income strata. Atkinson and Brandolini
(2013) believe that high-income groups should be able to hire personnel for some chores, such as
babysitters and cleaning, and the net income after expenditures on this kind of services should not
lead to the poverty of the family (i.e. should not fall below the 60% cut-off). Checking various
ratios of spending for personal needs and the services of hired workers, the authors set the upper
bound of the middle-class income at 2x and 3x median income but do not comment on the
relevance of their conclusions.
Eisenhauer (2011, p. 297) defines the rich as those who are wealthy enough to liquidate their
assets, i.e. ‘purchase risk-free bonds, and thereby generate sufficient after-tax interest income to
remain above the poverty level indefinitely without incurring risk and without having to earn
additional income through employment’.
Medeiros (2006) defines the affluence line as the level of income that enables the
elimination of poverty (defined through a set monetary line) in society through redistribution. This
approach is based on the national poverty line not on the median income. According to Brazilian
data for 1999, the poverty line was at the level of income of 33rd percentile of the population while
the affluence line exceeded this level by 26.8x (i.e. $1,142 per month per household in prices of
1999).
There are also attempts to strengthen methods of defining the high-income group by adding
wealth indicators. Hauser and Becker (2002), discussing the case of Germany in 1998, set the
affluence line at double the median of equalised net income but add a requirement to have an
additional one million German marks per household member.
Tab. 2 presents a systematic review of studies on income stratification and social group
thresholds using the relative approach. This method is mostly used in the research of income
stratification in developed countries. However, the relative approach lacks transparency for
international comparison (Ferreira, Messina, Rigolini, López-Calva, Lugo, & Vakis, 2013). The
adherents of the relative approach lack consensus in the selection of thresholds in income
stratification and in reasoning (as with the absolute approach).
To sum up, it can be claimed that the key argument for the choice of approach to income
stratification is the country’s level of development. While research in well-developed and high-
income countries requires the application of relative income thresholds which correspond with their
average standard of living, for the countries with low income and weak progress in modernisation it
12
is common to appeal to a measure of needs-based poverty and an absolute approach for the
stratification model as a whole. For Russia, the question of its classification as developed or
developing country is important because of its transitional state. It inevitably perplexes scholars
searching for an income stratification model. The next section will address the empirical evidence
for this issue in contemporary Russian society.
13
Tab. 2. Relative income thresholds for income stratification, by selected papers
Authors, years
Low income Middle income High income
Geography of methodology implementation Extremely
poor Poor Vulnerable
Lower
MI
Middle
MI
Higher
MI Affluent Rich
Based on quintiles or percentiles, quintiles/ percentiles
Alesina and Perotti (1996);
Bellettini and Ceroni (2007)
3-4 quintiles
71 countries;
22 countries (OECD)
Partridge (1997) 3 quintile USA
Barro (2000);
Easterly (2001)
2-4 quintiles
84 countries;
175 countries
Solimano (2008) 3-9 quintiles 129 countries
Peichl and Pestel (2011) 5 quintile Germany
Dynan et al. (2004) upper 1% and 5% USA
Feenberg and Poterba (2000) upper 0.5% USA
Carroll (2002);
Weicher (1997); Wolff (2010)
upper 1% USA
Gornick, Jantti et al. (2013) 2-4 quintiles High- and middle-income countries (LIS)
30 countries, including high-income transition economies and Latin America;
11 developed countries (LIS)
Chauvel (2013)
0.75-1.25 1.5-2.5 France, Italy, Norway, USA
Grabka and Frick (2008)
below 0.5 0.5-0.7 0.7-0.9 0.9-1.1+
1.1-1.325 1.3-1.5 1.5-2 above 2 Germany
Peichl et al. (2010) below 0.6 over 2 Germany
Eisenhauer (2011)
below 0.6 Calculated a richness line
Italy
Smeeding (2006)
below 0.5 11 developed countries (LIS) including the
USA
Kangas (2001) below 0.5 over 3
Brzezinski (2010) 2, 3 and 4 Poland
Atkinson and Brandolini (2013)
0.6-0.75 0.75-1.25 1.25-1.67 over 2 or 3 11 European countries, USA, Canada,
Taiwan, Mexico
Ólafsson and Kristjansson (2013) 0.75-1.5 Iceland
Vanneman and Dubey (2013) below 0.5 0.5-2 over 2 India
PEW Research Center below 2/3 2/3-2 over 2 USA
25 Grabka and Frick (2008) define eight income groups, however, with more detailed focus on the middle income groups. To fit our classification, we consider them into one category.
14
Income stratification of the Russian society: the heuristic potential of
applied methods
As shown above, different approaches to income stratification have been designed for
various research purposes and countries at different stages of social and economic development – so
their efficiency may vary when applied to Russia. We now focus on choosing the most relevant
approach to income stratification in Russia by applying different methods to data provided by
nationwide representative surveys. The empirical data for the analysis are from monitoring surveys
by IS RAS in 2014–201626
, and the RLMS-HSE conducted by the Higher School of Economics in
2014–2015.27
The acceptability of sample survey data for the evaluation of individual and household
incomes is debated. As respondents can incorrectly report their income (either by chance or
intentionally distorting them), researchers use different imputation methods and readjustment
procedures to correct the data. Equivalence scales are sometimes applied to account for the
household size and economy on scale. However, here we consciously do not make any of such
corrections. As one of the questions about income in the surveys mentioned above was asked in a
similar way (self-assessment of monthly monetary income28
), we expect the probable distribution
bias concerning the respondents' replies would be similar29
. Moreover, similar questions about the
self-assessment of monthly income are included in some international comparative surveys, e.g.
ISSP30
, so it makes it possible to study the specifics of Russian income stratification model in a
global context.
Another issue for proposing the income stratification model is the underrepresentation of
high-income groups in representative samples. Absolute approaches suggest a stratification design
is applicable for non-extreme population samples. For relative approaches, median values are
mostly correct because small groups with both extremely low and extremely high incomes are not
included in the sampling.
We apply some of the most widely-used methods based on the absolute approach
(stratification about subsistence level, the WB method, the "Western middle class" method) to
26 Series of all-Russian surveys carried out by the Institute of Sociology RAS as part of a monitoring project “Dynamics of Social
Transformation of Modern Russia in Socio-economic, Political, Socio-cultural and Ethno-religious Contexts”, sample is
representative by gender, age, education, and type of location (October 2014, March 2015, October 2015, March 2016; N=4,000). 27 RLMS-HSE is conducted by the Higher School of Economics and ZAO Demoscope with the help of the Population Center at the
North Carolina University, Chapel Hill, and IS RAS (RLMS-HSE survey websites: http://www.cpc.unc.edu/projects/rlms and
http://www.hse.ru/rlms). 28 The RLMS-HSE data provides the corresponding question “What was the monetary income of your entire family in the last 30
days? Include here all the money received by all members of the family: wages, pensions, stipends, and any other money received,
including hard currency converted into rubles”. Using the number of households’ members, we recalculated it into monthly income
per capita. In the IS RAS data the similar question is asked, but on the per capita income. 29 We expect that this bias will not affect the relative income-based stratification model (assuming that the magnitude of the deviation
of reported income data from the actual values is the same across all income groups included in the representative samples). 30The International Social Survey Programme – an annual program of cross-national collaboration on surveys (http://www.issp.org,
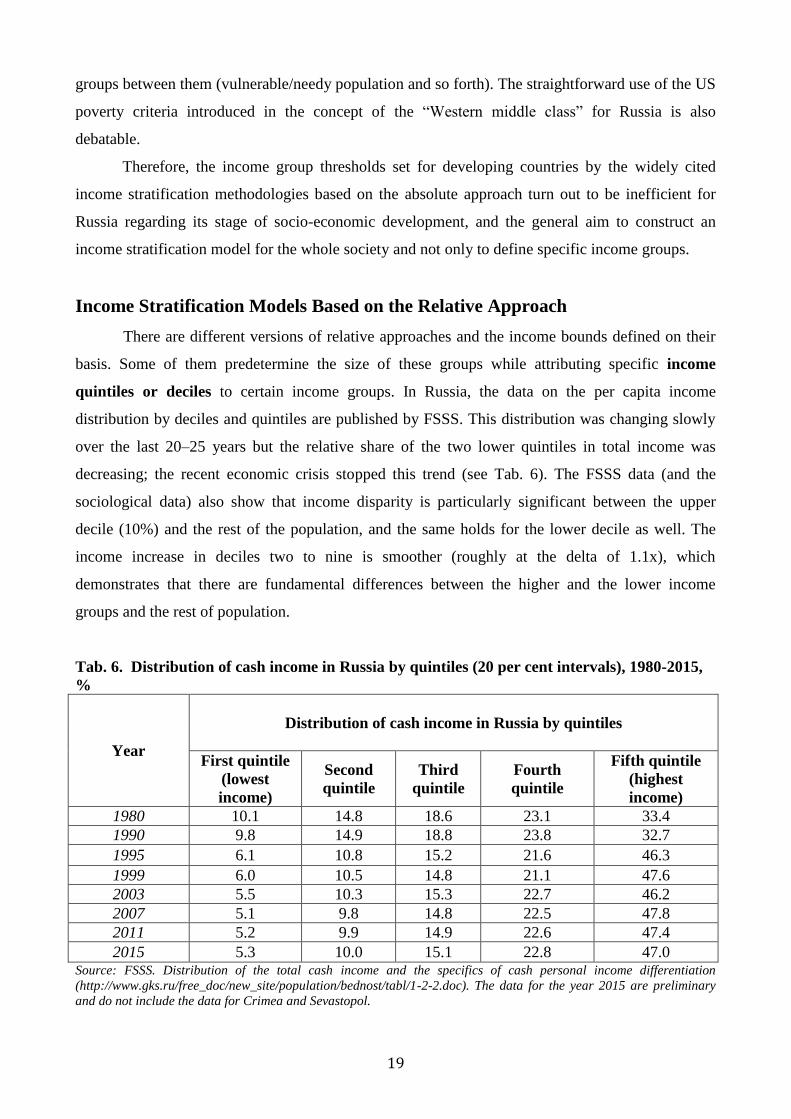
Russian data and propose our version of the relative approach for income stratification model in
Russia using the median income.
Stratification Models Based on the Absolute Approach
The absolute approach to income stratification is more familiar to Russian researchers and is
applied to both statistical and sociological data. FSSS publishes official data on the number of
people with incomes within specific bounds defined in absolute terms. With the data, a regional
breakdown of income stratification can be studied and the dynamics in the absolute incomes can be
traced. However, the FSSS data on the distribution of the population by income groups is not linked
to subsistence levels or the central tendencies of this distribution (mean, mode or median values), so
a comprehensive analysis of income stratification is not possible.
The absolute approach is officially used in Russia for defining poverty; for this purpose, a
subsistence level is used, and households and individuals can be grouped into poor / not poor
according to the relation of their income to the subsistence level. Income stratification based on
the official subsistence level can be expanded by the further differentiation of the "not poor" group
splitting it into subgroups according to the ratio of their income and the subsistence level (see Fig.
1)31
.
Fig. 1. Income stratification model based on subsistence level, autumn 2015, %32
Source: IS RAS, calculation by authors
31 A structure of households and the regional values of subsistence level are accounted for. 32 According to the FSSS estimates, 13.3% of Russians lived below the poverty threshold in 2015. The estimates from selected
surveys, including those of IS RAS, are higher. This is because of the differences in methodologies (e.g. weighting of the data, use of
equalisation scales etc.) and the fact that FSSS estimates income indirectly (through expenses and spending).
16
The model of income stratification relative to the subsistence level helps gauge the
proportion who are poor, and define the groups that are characterised by higher poverty risks –
population with incomes close to the poverty line. The incomes of the largest group – almost one-
third of the entire population – fall within 1-1.5x of subsistence level; this is also where the median
income lies. This model of income stratification based on the subsistence level is important for the
analysis of the poverty zone and the risks of its expansion; it also helps identify those who need
welfare assistance most. However, to analyse the groups higher on the income scale, income
thresholds in relation to the subsistence level must be further studied and validated.
Let us now turn to another well-cited version of the absolute approach that is used by the
WB to define various income groups across countries. The income stratification model based on
the WB methodology for Russia in 2014 and 2015 (using PPP calculated by WB at USD/RUB PPP
rate at 22.57 in 2014 and 23.97 in 201533
) is shown in Table 3.
Tab. 3. Income stratification based on the World Bank methodology
Income
groups
Daily
income, $34
2014 2015
Monthly per
capita income,
PPP, rubbles
% income
groups Monthly per
capita income,
PPP, rubbles
% income
groups
RLMS-
HSE
IS
RAS
RLMS-
HSE
IS
RAS
Poor 2.5 and less 1,693 and less 0.4 0.3 1,798 and less 0.3 0.3
Over 50 Over 33,855 5.4 7.9 Over 35,955 5.3 3.7 Source: IS RAS and RLMS-HSE, calculation by authors
The application of WB methodology to two different datasets yields similar results. The
model shows an extremely low share of the poor in Russia (just 1–2% even during the economic
crisis) and those at high risk of poverty were about 10%. The overwhelming majority of the
population falls within the middle class (though the lower-middle class prevails). Given that the
minimum middle-class per-capita income ($10 per day) in this methodology equals around 7,000
rubles per month in PPP, it is not surprising. This threshold is about 50% of the median income
(which was 14,000 rubles per month in 2014 according to both IS RAS and RLMS-HSE datasets,
and 20,594 rubles per month according to FSSS; the former figure was unchanged in 2015 while
33 Data source: World Bank (http://data.worldbank.org/indicator/PA.NUS.PRVT.PP?locations=RU). 34 As mentioned above, the World Bank changed the boundaries of extreme poverty from $1.25 to $1.9 in 2015, which entails
changing the poverty line from $2.5 to $3.1. However, this does not bring any significant changes in the income stratification model
in Russia, since less than 0.5% of the population live on less than $ 3.1 per day.
17
FSSS estimate increased to 22,729 rubles) and cuts off only the poorest group (0.5x median income
is a widely used threshold of relative poverty). This threshold for the middle class is even lower
than the official Russian subsistence level. Hence the middle class by this definition is
disproportionally large and heterogeneous, and even its division into three subgroups does not help
analyse its inner structure, as over half of the population still falls within one subgroup (lower-
middle class).
However, the followers of the WB's approach highlight that these poverty thresholds are
developed for the purposes of international comparison and have a limited application for the
analysis of poverty in any given country (Lokshin & Yemtsov, 2013). In the course of international
comparison, both statistical and survey data show that Russia is better off regarding population
incomes than the other BRICS countries and developing nations. FSSS publishes the data showing
changes in the share of people with income below various monetary poverty thresholds used by the
WB, and it proves that Russia has crucial differences from other BRICS countries. In Russia, per
capita incomes below $5 per day are almost non-existent, but this income is typical for 30% of
Brazilians, nearly 60% in South Africa and China and most of the population in India35
. ISSP data
shows that income stratification in Russia is much closer to that of Western Europe (where over
75% population are in the middle class and the relative number of the poor is small) rather than
China or Latin America (where the shares of poor and vulnerable groups are large and the middle
class makes up about half of the population) (see Tab. 4).
Tab. 4. Income stratification based on the World Bank model, 2012, %
Groups Germany Russia Hungary Venezuela China
Poor 0 2.4 5.0 14.0 23.6
Vulnerable 0.9 11.7 19.2 32.0 25.8
Middle class 99.1 85.9 75.8 54.0 50.6 Source: ISSP, calculation by authors.
This situation is the result of fundamental changes in Russian society which have occurred
over the last 15 years and can be traced using this methodology. The calculations by the WB show
that only slightly more than a quarter of the Russian population (27%) belonged to the middle class
in 2000, while this share increased to 60% by 2010. Sociological surveys show that the expansion
of the middle class further continued in 2014–2015. Such drastic changes in personal income make
the use of such poverty/middle-class income ranges inefficient at the current stage of Russia's
economic development – they cannot define income subgroups within the largest part of the
population and only cut off the population with lowest and highest incomes. Russian society has
35 The FSSS data. Disparity and poverty (http://www.gks.ru/free_doc/new_site/population/bednost/tabl/2-6.html). The data are
compiled on the selective survey of household budgets and the macroeconomic indicator of personal cash income, the World Bank’s
“Poverty and Inequality Database”.
18
already moved away from the minimum physical survival standard for the population that these
ranges are based on, (Dinamika Monetarnykh…, 2014), so different methods of income-based
stratification are needed. Most methods based on the absolute approach that set the middle-class
income threshold at $10–13 per day cannot be used for an income stratification model of
contemporary Russia.
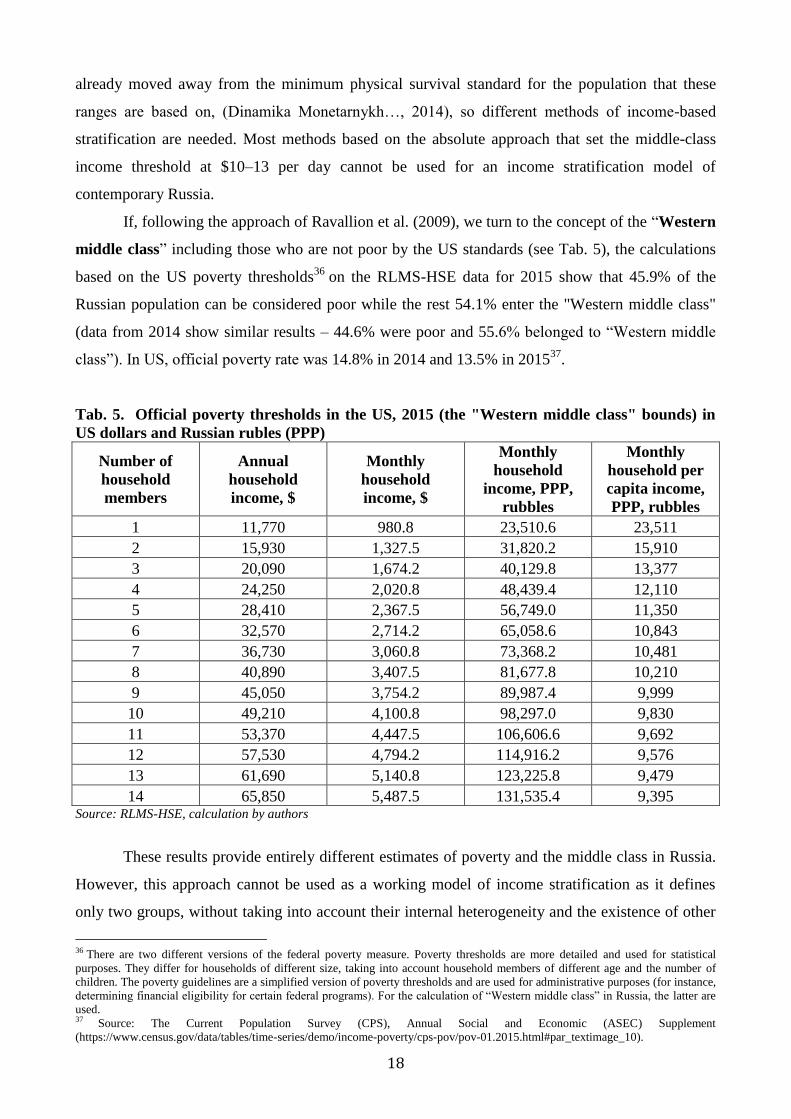
If, following the approach of Ravallion et al. (2009), we turn to the concept of the “Western
middle class” including those who are not poor by the US standards (see Tab. 5), the calculations
based on the US poverty thresholds36
on the RLMS-HSE data for 2015 show that 45.9% of the
Russian population can be considered poor while the rest 54.1% enter the "Western middle class"
(data from 2014 show similar results – 44.6% were poor and 55.6% belonged to “Western middle
class”). In US, official poverty rate was 14.8% in 2014 and 13.5% in 201537
.
Tab. 5. Official poverty thresholds in the US, 2015 (the "Western middle class" bounds) in
US dollars and Russian rubles (PPP)
Number of
household
members
Annual
household
income, $
Monthly
household
income, $
Monthly
household
income, PPP,
rubbles
Monthly
household per
capita income,
PPP, rubbles
1 11,770 980.8 23,510.6 23,511
2 15,930 1,327.5 31,820.2 15,910
3 20,090 1,674.2 40,129.8 13,377
4 24,250 2,020.8 48,439.4 12,110
5 28,410 2,367.5 56,749.0 11,350
6 32,570 2,714.2 65,058.6 10,843
7 36,730 3,060.8 73,368.2 10,481
8 40,890 3,407.5 81,677.8 10,210
9 45,050 3,754.2 89,987.4 9,999
10 49,210 4,100.8 98,297.0 9,830
11 53,370 4,447.5 106,606.6 9,692
12 57,530 4,794.2 114,916.2 9,576
13 61,690 5,140.8 123,225.8 9,479
14 65,850 5,487.5 131,535.4 9,395 Source: RLMS-HSE, calculation by authors
These results provide entirely different estimates of poverty and the middle class in Russia.
However, this approach cannot be used as a working model of income stratification as it defines
only two groups, without taking into account their internal heterogeneity and the existence of other
36 There are two different versions of the federal poverty measure. Poverty thresholds are more detailed and used for statistical
purposes. They differ for households of different size, taking into account household members of different age and the number of
children. The poverty guidelines are a simplified version of poverty thresholds and are used for administrative purposes (for instance,
determining financial eligibility for certain federal programs). For the calculation of “Western middle class” in Russia, the latter are
used. 37 Source: The Current Population Survey (CPS), Annual Social and Economic (ASEC) Supplement