Predicting range shifts and population persistence in the face of climate change is a major ecological challenge, one that is further complicated by the potential for local adaptation (LA) to historical climate. Many species show strong reductions in performance when individuals are moved beyond range boundaries, suggesting that many distributional limits are driven by species’ climate tolerances (Hargreaves, Samis, & Eckert, 2014; Lee‐Yaw et al., 2016; Sexton & Dickman, 2016). But broad climate tolerances at the species level are generally comprised of narrower, locally adapted tolerances at
the scale of populations (e.g., Angert, Sheth, & Paul, 2011; Hoffman, Anderson, & Hallas, 2002; Kelly, Sanford, & Grosberg, 2012; Sheth & Angert, 2014). Furthermore, such LA is common across both latitudinal and elevational ranges (e.g., Ågren & Schemske, 2012; Anderson, Perera, Chowdhury, & Mitchell‐Olds, 2015; Angert & Schemske, 2005; Clausen, Keck, & Hiesey, 1940; Joshi et al., 2001). Taken together, these patterns provide strong evidence that climate tolerances vary throughout species’ ranges (Bocedi et al., 2013; Fournier‐Level et al., 2011; Jump & Peñuelas, 2005; King, McKeown, Smale, & Moore, 2017; Savolainen, Pyhäjärvi, & Knürr, 2007) and will influence responses to ongoing climate change, with local responses
Incorporating local adaptation into forecasts of species’ distribution and abundance under climate change
Megan L. Peterson1 | Daniel F. Doak1 | William F. Morris2
1Environmental Studies Program, University of Colorado Boulder, Boulder, Colorado2Biology Department, Duke University, Durham, North California
CorrespondenceMegan L. Peterson, Environmental Studies Program, University of Colorado Boulder, Boulder, CO.Email: [email protected]
Funding informationDivision of Environmental Biology, Grant/Award Number: 1242355, 1340024, 1353781 and 1753954
AbstractPopulations of many species are genetically adapted to local historical climate condi‐tions. Yet most forecasts of species’ distributions under climate change have ignored local adaptation (LA), which may paint a false picture of how species will respond across their geographic ranges. We review recent studies that have incorporated in‐traspecific variation, a potential proxy for LA, into distribution forecasts, assess their strengths and weaknesses, and make recommendations for how to improve fore‐casts in the face of LA. The three methods used so far (species distribution models, response functions, and mechanistic models) reflect a trade‐off between data avail‐ability and the ability to rigorously demonstrate LA to climate. We identify key con‐siderations for incorporating LA into distribution forecasts that are currently missing from many published studies, including testing the spatial scale and pattern of LA, the confounding effects of LA to nonclimatic or biotic drivers, and the need to incor‐porate empirically based dispersal or gene flow processes. We suggest approaches to better evaluate these aspects of LA and their effects on species‐level forecasts. In particular, we highlight demographic and dynamic evolutionary models as promising approaches to better integrate LA into forecasts, and emphasize the importance of independent model validation. Finally, we urge closer examination of how LA will alter the responses of central vs. marginal populations to allow stronger generaliza‐tions about changes in distribution and abundance in the face of LA.
K E Y W O R D S
climate change, forecast, landscape demography, local adaptation, mechanistic distribution model, response function, species distribution model, transfer function
to climate change differing throughout a species’ range (Gilman, Wethey, & Helmuth, 2006; Herrando‐Pérez et al., 2018; Kelly et al., 2012; Pelini et al., 2009; Peterson, Doak, & Morris, 2018).
Unfortunately, most models that have been used to forecast species distributions under climate change assume that climate tol‐erances do not differ among populations (Bellard, Bertelsmeier, Leadley, Thuiller, & Courchamp 2012). Failure to account for intraspe‐cific variation in climate tolerances can introduce errors into forecasts about geographic distributions and the future viability of a species as a whole (Pearman, D'Amen, Graham, Thuiller, & Zimmermann, 2010), and precludes analysis of the fates of particular intraspecific lineages or the maintenance of genetic variation in ecologically important traits (D’Amen, Zimmermann, & Pearman, 2013; Marcer, Mendez‐Vigo, Alonso‐Blanco, & Pico, 2016). For example, if LA is strong, such that the breadth of environmental tolerances in local populations (in‐cluding those at range edges) is much narrower than for a species as a whole (Holt, 2009), then locally adapted populations could be highly susceptible to climate change regardless of their position within the range, especially where the velocity of climate change (sensu Loarie et al., 2009) surpasses the species’ dispersal ability and gene flow is limited by habitat fragmentation (Figure 1). Further, in the Northern hemisphere, warming has been and is predicted to be greatest at high latitudes (IPCC, 2014), raising the possibility that populations may be most vulnerable not at the southern range limit, where tem‐perature is already warmer, but at the polar limit, where change will be faster (Figure 1). However, further complicating the picture is the possibility that, even with strong LA, polar‐edge populations may, due to gene flow, perform better under conditions that are more be‐nign than those they have historically experienced (Reich & Oleksyn, 2008; Yang, Pedlar, McKenney, & Weersink, 2015) and may also have broader climate tolerances due to historically greater climate variabil‐ity (Deutsch et al., 2008; Janzen, 1967; Molina‐Montenegro & Naya, 2012; Sunday, Bates, & Dulvy, 2011).
A particularly important consequence of including LA in range‐shift forecasts is that it may overturn the commonly assumed “trail‐ing‐edge, leading‐edge” range‐shift pattern. Under this paradigm, species’ distributions are expected to change primarily by expanding at the polar or cooler range edge, while contracting at the equato‐rial or warmer range edge where climate change will probably first exceed the species‐wide upper thermal limit (Figure 1b, Maggini et al., 2011). Although this pattern has already been observed in many taxa, for many others it has not been seen, either in response to con‐temporary climate change (Chan, Hill, Ohlemüller, Roy, & Thomas, 2011; Groom, 2013; Moritz et al., 2008; Parmesan et al., 1999; Poloczanska et al., 2013) or during climate shifts in the past (Davis & Shaw, 2001; Hampe & Petit, 2005). In particular, the “trailing‐edge, leading‐edge” pattern of range shifts has occurred less consistently in terrestrial species than marine species (Sunday, Bates, & Dulvy, 2012). Although many mechanisms may interact with climate change to limit or alter range shifts (Anderson, Inouye, McKinney, Colautti, & Mitchell‐Olds, 2012; Louthan, Doak, & Angert, 2015; Pinsky, Worm, Fogarty, Sarmiento, & Levin, 2013; Suttle, Thomsen, & Power, 2007), several theoretical studies have highlighted the potential for LA to
historical climate to drive nonintuitive patterns of range shifts. LA can result in range fragmentation, greater extinction risk, and loss of evolutionary diversity, including predominant losses of warm, cool, or even centrally adapted genotypes (Atkins & Travis, 2010; Bocedi et al., 2013; Valladares et al., 2014). The misperception that climate change effects will only manifest strongly at leading and trailing edges is also likely to curtail study of central populations, thus limit‐ing our knowledge of range‐wide climate change impacts.
While most recently published range‐shift predictions have continued to ignore LA, an increasing number of studies are at‐tempting to incorporate some form of intraspecific variation in climate responses. We note that genetically based variation in cli‐mate tolerances within species (hereafter “G × E,” or gene by en‐vironment interactions) will influence responses to climate change whether or not it is consistent with a pattern of LA to historical climate and that few forecast studies distinguish between G x E in
F I G U R E 1 Changes in species distributions and abundances will depend on the magnitude of climate change, strength of local adaptation, and potential for dispersal. Shifts in both climate and species’ performance from the present (solid lines) into the future (dashed lines) may differ across species’ latitudinal ranges (or, equivalently, elevational ranges) in a variety of ways. (a) Climate is predicted to change throughout species’ ranges but the magnitude of change may be greatest at high latitudes. (b) Without local adaptation, climate change is predicted to cause range contraction at the warm edge through declining performance (population growth or probability of occurrence) and expansion beyond the cold edge as species track their climate envelope. (c) Local adaptation to historical climate conditions will drive the re‐distribution of intraspecific lineages, with cold‐edge populations moving beyond the historical range boundary and greater movement required where the velocity of climate change is faster (arrows). (Inset) The climate envelope of a particular population will depend on the responses of multiple vital rates, some of which may show opposing climate responses (“demographic compensation”). (d) Populations throughout the species’ range may be at risk if there are barriers to dispersal, so that locally adapted lineages are unable to move to new areas with appropriate climate conditions
Velocity ofclimate changeC
limat
e
Latitude
(a)
Per
form
ance
Per
form
ance
Per
form
ance
Latitude
Trailingedge
Leadingedge
(b)
Historicallimit
Latitude
(c)
Growth SurvivalClimate
Dispersalbarriers
Latitude
(d)
| 3PETERSON ET al.
general vs. LA in particular (see Results). Indeed, although climate tolerances may often be correlated with historical climate condi‐tions throughout a species’ range, the correlation is unlikely to be perfect due to gene flow, especially at range edges (Kirkpatrick & Barton, 1997; Paul, Sheth, & Angert, 2011). Given the growing rec‐ognition of the role that LA may play in shaping range shifts, more forecasts incorporating G × E are likely to soon appear, so now is a timely moment to assess the strengths and weaknesses of the ap‐proaches that have been adopted to date, to ask whether we can discern any generalities from these studies, and to identify best practices for including LA in future forecasts of climate responses.
In this review, we focus on approaches to incorporate existing G x E into forecasts of future climate responses. While the long‐term biological impact of climate change will depend on future evolution‐ary processes, species’ immediate responses to climate change will be shaped by current patterns of local adaptation to climate. This is particularly true for species with long generation times that may lack the capacity for rapid adaptation. Further, given the challenge of forecasting evolutionary dynamics (see Discussion), understanding the traits and environmental variables that have driven evolutionary adaptation in the past is a necessary first step to more speculative predictions of future evolutionary responses.
2 | RE VIE W OF RECENT LITER ATURE INCORPOR ATING INTR A SPECIFIC VARIATION INTO R ANGE FOREC A STS
We searched ISI Web of Science on February 9, 2018, for studies that incorporated intraspecific variation into spatially explicit forecasts of species’ distributions under projected climate (see Supporting Information Appendix S1). This yielded a total of 28 studies includ‐ing 53 distribution models of 91 species (one model predicted 48 species simultaneously, Hamann & Aitken, 2013; and several studies made predictions for the same tree species). These included models for 32 plants (including 23 trees), 9 mammals, 4 birds, 2 reptiles, 1 amphibian, 4 insects, and 1 coral.
2.1 | Overview of differences among forecasting approaches
All of the studies included in our review (Table 1, Appendix S2) adopted one of three general methods to incorporate intraspecific variation into range predictions (see examples in Box 1). We now review the characteristics of the three methods and summarize the general strengths and limitations of each approach.
2.1.1 | Species distribution models
The most common approach, and also the simplest in terms of its data requirements, is to use a species distribution model (SDM, Franklin, 2009). SDMs represented 18 of 28 studies (64%) and
37 of 53 models in our review (Figure 2, Supporting Information Appendix S2). SDMs that incorporate intraspecific variation use known occurrences for each of two or more intraspecific groups, based on taxonomic, genetic, or biogeographic information, and the historical climate (and sometimes other abiotic and biotic vari‐ables) at those sites, and then project the distribution of all groups in the future climate. Modifications of the basic SDM approach use occurrences of community types that include a species to predict the frequency of that species across the future landscape (e.g., Gray, Gylander, Mbogga, Chen, & Hamann, 2011; Hamann & Aitken, 2013), or use data on survival of a species in multiple transplant gardens to fit a model that predicts probability of oc‐currence as a function of climate (Benito Garzón, Alía, Robson, & Zavala, 2011).
The prevalence of SDMs in general, and in analysis of intraspecific variation in species forecasts in particular, is directly related to the read‐ily available data sources they employ and the ease of using well‐de‐veloped software (e.g., MaxEnt; Phillips, Anderson, & Schapire, 2006). Other advantages of SDMs are that they commonly consider an exten‐sive set of potential climate variables (Supporting Information Appendix S2), increasingly incorporate model uncertainty by using several algo‐rithms, and build uncertainty in future climate into ensemble‐based dis‐tribution forecasts (Table 1; Araújo & New, 2007; Thuiller, 2004).
Species distribution models, however, are agnostic about the un‐derlying mechanisms shaping distribution and thus rely on the assump‐tion that distributional patterns reflect differing climate tolerances of the intraspecific lineages. But intraspecific groups may occupy differ‐ing climate ranges by chance. Dividing a species’ range into several groups is likely to yield different climate–occupancy relationships for each group even in the absence of LA. Conversely, many SDMs we reviewed rely on relatively coarse intraspecific groupings, such as sub‐species or varieties (Figure 2a), which likely underestimate the true magnitude of LA to climate. Indeed, we could find no examples or ar‐guments that show how SDMs by themselves can establish whether a species shows LA to climate. This makes it impossible to determine whether forecasts of whole‐species SDMs or intraspecific SDMs are more likely to be correct without gathering additional information, thus weakening the advantage of their simple data requirements.
Very few of the SDM studies we reviewed looked for evi‐dence of adaptation to local climate in the different intraspecific groups. However, a recent trend in SDM papers is to also use occurrence and climate data to test for similarity in the climatic niches of the groups (e.g., Hu et al., 2017; Ikeda et al., 2017, Meynard et al., 2017). An important caveat is that patterns of occurrence by themselves do not provide very strong tests of the hypothesis that intraspecific groups differ in their environmen‐tal tolerances. Tests for niche similarity (cf. Broennimann et al., 2012; Warren, Glor, & Turelli, 2008) typically compare the ob‐served niche overlap between two groups (measured by statistics such as Schoener's D) to the distribution obtained by comparing occurrences of one group to randomized sets of pseudo‐occur‐rences chosen repeatedly from within the range of the second group, thus accounting for differences in available environments
4 | PETERSON ET al.
TAB
LE 1
Su
mm
ary
of th
e co
mm
on p
ract
ices
, str
engt
hs, a
nd w
eakn
esse
s of
met
hods
use
d to
inco
rpor
ate
intr
aspe
cific
var
iatio
n in
to s
peci
es’ d
istr
ibut
ion
fore
cast
s. V
alue
s ar
e th
e nu
mbe
r of
mod
els
(out
of t
he to
tal n
umbe
r of m
odel
s) o
f eac
h m
etho
d th
at in
clud
e M
odel
val
idat
ion
of (a
) fitt
ed li
neag
e‐sp
ecifi
c cl
imat
e re
spon
se fu
nctio
ns (“
G ×
E”);
(b) p
redi
cted
dis
trib
utio
n pa
tter
ns
(“dis
trib
utio
n”);
sour
ces
of u
ncer
tain
ty in
fore
cast
s du
e to
(c) u
ncer
tain
ty in
fore
cast
ed c
limat
e; (d
) mod
el s
truc
ture
or p
aram
eter
val
ues;
(e) t
he g
eogr
aphi
c sc
ale
of v
aria
tion
in c
limat
e re
spon
ses
(incl
udin
g co
mpa
rison
to a
spe
cies
‐wid
e m
odel
); an
d (f)
pre
sent
any
evi
denc
e fo
r int
rasp
ecifi
c va
riatio
n in
clim
ate
resp
onse
s re
leva
nt to
the
mod
el (“
evid
ence
for G
× E
”), in
clud
ing
from
oth
er e
xper
imen
ts o
r pre
viou
sly
publ
ishe
d st
udie
s
Met
hod
Dat
a
Mod
el v
alid
atio
nSo
urce
s of u
ncer
tain
ty in
fo
reca
st
Evid
ence
fo
r G ×
ESt
reng
ths
Wea
knes
ses
Exam
ple
stud
ies
G ×
ED
istr
ibut
ion
Clim
ate
fore
cast
Mod
el/
para
met
erSc
ale
of
G x
E
SDM
sC
urre
nt d
istr
ibu‐
tion
and
clim
ate
for f
ew g
roup
s,
ofte
n re
pres
ent‐
ing
mos
t of
spec
ies
rang
e
0/37
34/3
716
/37
8/37
25/3
78/
37D
ata
and
soft
war
e av
aila
bilit
y, e
nsem
ble
fore
cast
s, e
xten
sive
cl
imat
e dr
iver
s
Cor
rela
tive,
as
sum
es e
quili
bria
l di
strib
utio
ns,
cann
ot te
st fo
r G
× E
Mar
cer e
t al.
(201
6),
Häl
lfors
et a
l. (2
016)
Mec
hani
stic
mod
els
Varia
ble
quan
tity
and
reso
lutio
n,
expe
rimen
tal o
r co
rrel
ativ
e
1/8
8/8
0/8
1/8
1/8
2/8
Mec
hani
sm li
nkin
g cl
imat
e to
pe
rfor
man
ce
Lim
ited
vita
l rat
es,
ofte
n st
rong
as
sum
ptio
ns
Buck
ley
(200
8),
Cha
pman
et a
l. (2
017)
Resp
onse
func
tions
Tran
spla
nt
perf
orm
ance
, us
ually
incl
udin
g m
any
popu
latio
ns
and
envi
ronm
ents
0/8
4/8
0/8
1/8
2/8
5/8
Clim
ate
resp
onse
s pr
edic
ted
from
cl
imat
e of
orig
in,
appl
icab
le to
new
lin
eage
s.
Lim
ited
vita
l rat
es,
data
‐inte
nsiv
e,
extr
apol
atio
n be
yond
gar
den
envi
ronm
ents
Wan
g et
al.
(200
6),
One
y et
al.
(201
3)
| 5PETERSON ET al.
between the two groups (followed by a parallel test in the other direction). While such tests can show whether intraspecific groups occupy more different environmental conditions than can be explained by background environmental differences be‐tween their two ranges, they do not unambiguously show that individuals of two groups would perform differently in the same
environment. Many abiotic and biotic factors typically not exam‐ined in these tests could shape the environmental tolerances of a species. For example, geographic differences in the capacity of the substrate to hold moisture could mean that a plant species would only be able to persist at sites experiencing greater than average rainfall in one region, but could tolerate lower levels of
Box 1 Methods to forecast responses to climate change given intraspecific variation
Species distribution modelsThis approach infers the climate sensitivity of each intraspecific lineage based on the statistical relationship between its pattern of occurrence and one or more climate variables. For example, D'Amen et al. (2013) modeled the distributions of previously identified phylogeographic lineages within each of nine large mammal species in Africa. They used IUCN distribution maps to identify occurrences and absences for each phylogeo‐graphic lineage (between two and seven per species) and excluded lineages with very narrow distributions. They fit separate generalized boosted models (GBMs) to the presence/absence data for each lineage as well as species‐wide models fit to all lineages and composite models represent‐ing the mean probability of occurrence of at least one lineage. Models were fit using six WorldClim bioclimate variables (Hijmans, Cameron, Parra, Jones, & Jarvis, 2005) and cross‐validated using 10% of the data in 10 random samples. The distribution of each lineage and species was forecasted for two future time periods and compared to the distribution of existing protected areas. They found that lineage‐specific models predicted disparate climate responses within species and greater declines in suitable habitat relative to species‐wide models.
Box Figure 1 Projected future distribution for warthog (Phacochoerus africanus) subspecies, modified from D'Amen et al. (2013).
Mechanistic modelsThese approaches model the climate sensitivity of each intraspecific group by describing the mechanistic biological processes (e.g. phe‐nology, physiology, or development) that link data on fitness or trait variation to climate responses in distribution or abundance. For example, Angert et al. (2011) quantified thermal performance curves (TPCs) for growth rate in 12 populations of the plant Mimulus cardinalis by experimentally manipulating growing temperatures. To relate TPCs to patterns of distribution, they used EcoCrop, a pro‐cess‐based model which estimates habitat suitability based on temperature and precipitation conditions relative to those needed for optimal growth. Separate temperature thresholds were inferred for each population from fitted TPCs while other parameters were as‐sumed to be constant. They validated model predictions by comparison to independent occurrence data. The distribution under climate change was forecasted for each population separately, as well as species‐wide models based on the average or range of fitted TPC pa‐rameters. How climate responses differed throughout the species range was then tested by relating the TPC parameters of each popula‐tion to its local climate and range position. Angert et al. (2011) predicted that populations from higher latitudes and colder environments, which had lower thermal optima, and those with lower thermal breadth were at greater risk from climate change.
P. a. africanusP. a. sundevalliiP. a. massaicus
6 | PETERSON ET al.
precipitation in another. That is, the climatic niche of a uniform species could be influenced nonadditively by other factors that vary geographically, and this explanation for differences in the
climatic conditions experienced by different groups in different areas would be difficult to distinguish from LA without data from reciprocal transplant or controlled climate experiments.
Box Figure 2 Populations’ thermal optima affect predicted range shifts, modified from Angert et al. (2011).
Climate response functionsThese approaches empirically measure the climate sensitivity of each intraspecific group using extensive transplant data to model per‐formance as an interaction between source and site environmental conditions. For example, Wang, O'Neill, and Aitken (2010) used data on the 20‐yr height of the tree Pinus contorta from 140 populations transplanted into 60 sites throughout British Columbia. They fit a multiple regression for height using population and test site temperature and heat: moisture variables and their interactions, as well as the geographic position of each site, as explanatory variables. The standard error of model predictions was computed by bootstrapping the dataset. Forecasts were generated for 1.6‐km2 grid cells in British Columbia by using the historical climate as population values and predicted climate as site values (i.e., assuming no dispersal) and also by using the population values that produced the highest forecasted growth (i.e., assuming optimal dispersal). Wang et al. (2010) predicted that climate change would have the most negative impacts in populations from historically warmer environments and in the warmest sites.
Box Figure 3 Performance as an interaction between source (provenance) and site mean annual temperature, modified from Wang et al. (2010).
Provenance temperature (C)
Test site temperature (C)
)m(thgiehry-02
| 7PETERSON ET al.
However, none of the SDM studies we reviewed used indepen‐dent data to validate fitted models (Figure 2d). Further, we found only one SDM study that compared multiple approaches to delineat‐ing intraspecific groups (Marcer et al., 2016), even though different ways of grouping occurrences could lead to dramatically different forecasts.
2.1.2 | Mechanistic models
The second approach, which we are calling mechanistic models, uses information about the mechanism linking individual performance to climate, such as phenology, physiology, or climate‐dependent devel‐opment, to predict performance across space under future climate regimes. Mechanistic models require more knowledge about the biology of each species, tend to be more idiosyncratic between spe‐cies relative to SDMs, and account for only four of the studies we reviewed (Appendix S2). Models used data ranging from variation in body size and prey availability in natural populations (Buckley, 2008) to flowering or leaf‐out phenology in common gardens (Chapman, Scalone, Stefanic, & Bullock, 2017; Morin, Viner, & Chuine, 2008) to laboratory‐estimated temperature‐dependent growth curves (Angert et al., 2011). What unites these disparate approaches is that they combined data on intraspecific trait variation with mechanistic physiological, phenological, or developmental models to predict cli‐mate effects on distribution. The main advantage of this approach is that these models are developed from first principles and generally represent specific hypotheses about the mechanism linking climate to distribution. However, this strategy nearly always also requires strong assumptions for which little direct data are available. Perhaps
for this reason, every study included an independent model valida‐tion step, by testing the ability of models to predict current distribu‐tions (Figure 2d). However, few evaluated the potential for different model structures or parameter values to substantively alter fore‐casts (Table 1).
2.1.3 | Climate response functions
These models use regressions of individual performance measures, such as growth or survival, from transplant gardens against climate variables at the site of the garden and also at the source location for each intraspecific group (i.e., “provenance”). The fitted regression (“response function” or “transfer function”) is then used to predict future performance of all provenances across the landscape (Aitken, Yeaman, Holliday, Wang, & Curtis‐McLane, 2008). This approach re‐quires extensive data and accounted for only 7 of the reviewed stud‐ies, all focused on commercially important tree species (Appendix S2).
The principal advantage of response function models is their abil‐ity to capture how the historical climate of a provenance shapes its responses to forecasted climate, which allows the response function to be applied broadly across the species’ range (not only at trans‐plant sites). Where data on multiple vital rates are available, this ap‐proach also allows forecasts for individual vital rates (e.g., separate forecasts for growth rate and survival, as in Valladares et al., 2014) as well as composite fitness metrics or occurrence. However, this is rarely done in practice as the goal of most provenance experiments and response function models has been to inform future planting recommendations for commercially valuable trees, and most fore‐casts have predicted tree productivity (measured in biomass per
F I G U R E 2 Summary of main approaches to incorporate intraspecific variation into published distribution forecasts. Barplots show the number of models of each method that used a particular approach. (a) Individuals within species were divided into groups with differing climate responses on the basis of populations, taxonomic units (e.g., subspecies, cultivars), biogeographic regions, genetic groups (e.g., haplotypes), or phenotypes. (b) Climate responses for each intraspecific lineage were estimated using observational data, field transplant experiments, or controlled climate manipulations. (c) The number of intraspecific lineages used in a given forecast model. (d) Forecast models were not validated, cross‐validated using a portion of the dataset, or validated using an independent dataset
Mechanistic Response SDM
010
0203
04
ObservationalField transplantClimate manipulation
Data type
sledomforeb
muN01
002
0304
sledomforeb
muN
Mechanistic Response SDM
Mechanistic Response SDM
Taxonomic units
Genetic groups
Intraspecific variation
Phenotypes
Populations
Biogeographic regions
010
0203
04sledo
mforebmu
N
Mechanistic Response SDM
NoneCross-validationIndependent data
Model validation
050
001051
002segaenilforeb
muN
(c) (d)
(a) (b)
8 | PETERSON ET al.
hectare, or basal area) or height (Supporting Information Appendix S2). Moreover, none of the transplant studies has been carried out long enough to assess climate effects on recruitment, fecundity, or adult survival, even though the latter two are likely to strongly affect tree population growth (Caswell, 2001).
This method is also data‐intensive, using on average 104 prov‐enances and 34 gardens (range: 4–195 provenances, 4–62 gardens, Figure 2c), and, even so, frequently requires extrapolating fitted cli‐mate responses beyond the conditions observed in any experimen‐tal gardens to make forecasts (Wang, Hamann, Yanchuk, O'Neill, & Aitken, 2006). Although these studies have some of the best datasets with which to test for LA, few did so by comparing inferred climate optima or breadths to historical climate conditions across prove‐nances (but see O'Neill, Hamann, & Wang, 2008; Wang et al., 2010; Yang et al., 2015). Finally, very few of the response function studies tested the ability of fitted climate functions to predict responses of other populations or gardens not used in the model fitting process, or evaluated the potential for different model structures or parame‐ter uncertainty to substantively alter forecasts (Table 1, Figure 2d).
2.2 | Summary of past approaches
While the studies we found differ in many ways (Figure 2), some common issues emerge from our survey. We review these issues in this section, before turning to suggestions to address each of them in the following section.
First, while studies employing each method differ in the type and number of intraspecific lineages they considered, very few could clearly identify LA at the geographic scale being modeled (Table 1, Supporting Information Appendix S2). This is a critical consideration, as the spatial scale of LA to climate, relative to dispersal rates and the velocity of climate change, could have profound consequences for distribution forecasts. Instead, the type of intraspecific variation included in forecasts has primarily been determined by data avail‐ability and modeling approach rather than biological considerations; mechanistic models and response function studies primarily incor‐porated G × E at the level of populations, whereas SDMs recognized coarser intraspecific groups (Figure 2a).
Second, most studies used only observational data (Figure 2b) to assess differential responses to climate. Although observational data‐sets can be suggestive of LA effects, experiments that disentangle genetic and environmental effects on performance are necessary to rigorously test for LA to climate. All of the response function mod‐els used data from field common garden experiments, and in addi‐tion, they were the exception to the generally low replication used in data collection or analysis, including many more intraspecific lin‐eages on average than either mechanistic models or SDMs (Figure 2c). However, of the 12 models that were parameterized using experimen‐tal data, only one used controlled climate manipulations (Angert et al., 2011) to unambiguously pinpoint climate adaptation, and no experi‐mental study controlled for maternal effects, such as environmental effects on offspring quality (Mousseau & Fox, 1998), which can mask genetically based environmental responses (Kawecki & Ebert, 2004).
Third, although we found some effort at model validation, often these efforts did not assess the added uncertainty associated with incorporating LA into distribution forecasts. SDMs were the only models to incorporate uncertainty in future climate conditions when making forecasts, and were also more likely to compare intraspecific models to forecasts from a species‐wide model (Table 1, Supporting Information Appendix S2), even though it would be straightfor‐ward to do both using other approaches. However, most models, especially SDMs, were cross‐validated to a portion of the dataset (Figure 2d). Cross‐validation cannot assess the ability of a model to accurately extrapolate to new lineages and environments, which necessarily occurs when forecasting responses across the species’ range. Studies using mechanistic models were a notable excep‐tion; every mechanistic model was validated using an independent dataset on distribution or performance. This approach provides a rigorous test of the underlying climate‐performance models, by evaluating their ability to predict the performance of new lineages under new environments as well as testing the relevance of specific performance metrics for determining distributions.
Finally, there were several other aspects of LA that were gen‐erally ignored in published studies that, while requiring additional data, could also have major impacts on species’ responses to cli‐mate change. None of the studies we reviewed included climate responses across the entire life cycle of an organism or allowed climate tolerances to continue to evolve over time (Appendix S2). Only three studies considered LA to aspects of the local environ‐ment other than climate (Hu et al., 2017; Schwalm et al., 2016; Wang et al., 2010), and none considered LA to biotic drivers such as interacting species. Only two studies included empirical estimates of dispersal rates (Cacciapaglia & van Woesik, 2018; Morin et al., 2008) and none considered gene flow among intraspecific lineages or locations. We discuss each of these considerations, and their po‐tential impact on species’ forecasts, in greater detail below.
3 | IMPROVING FOREC A STS OF CLIMATE CHANGE EFFEC TS IN THE FACE OF LOC AL ADAPTATION
Having reviewed how recent papers have attempted to include in‐traspecific variation, ideally reflecting LA, into climate change fore‐casts, we now turn to approaches that could be used to improve such analyses. In our discussion, we start with steps that apply to current approaches and end with methods that either require new data or employ analytical methods that the recent papers did not utilize.
3.1 | Better addressing forecast uncertainty associated with local adaptation
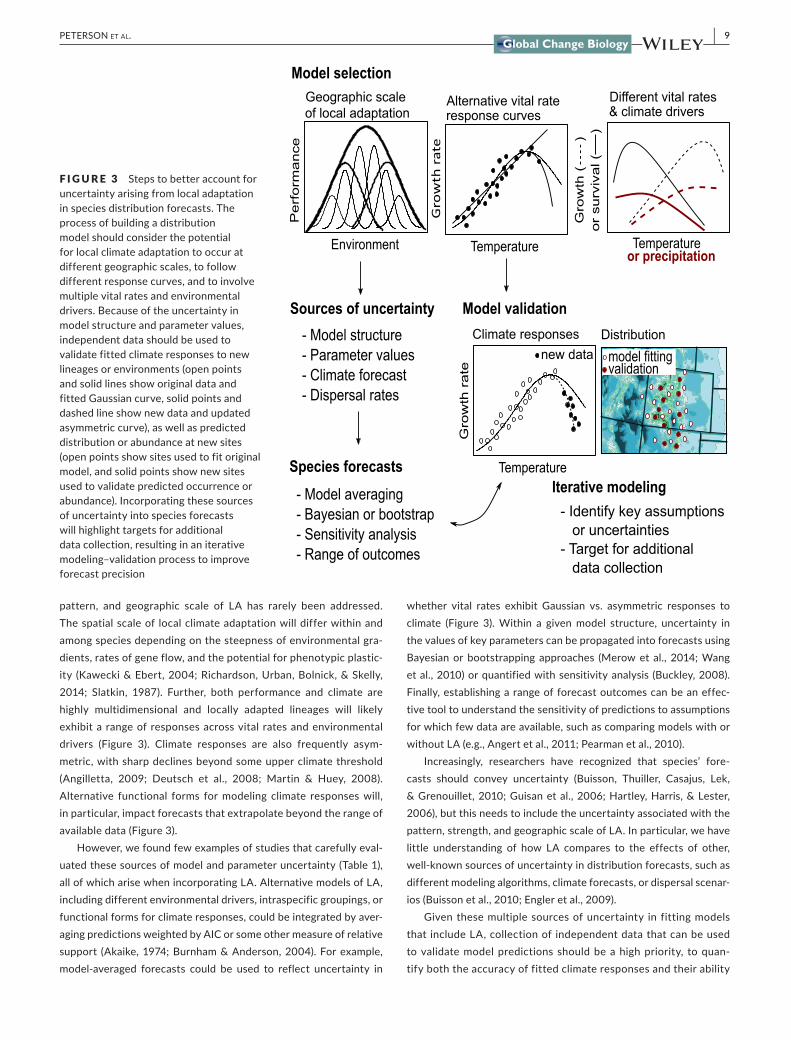
In order for forecasts to be useful, they must accurately reflect the uncertainty inherent in any distribution model (Araújo & New, 2007). Incorporating LA into forecasts increases the complexity of distribution models (Figure 3), yet uncertainty in the strength,
| 9PETERSON ET al.
pattern, and geographic scale of LA has rarely been addressed. The spatial scale of local climate adaptation will differ within and among species depending on the steepness of environmental gra‐dients, rates of gene flow, and the potential for phenotypic plastic‐ity (Kawecki & Ebert, 2004; Richardson, Urban, Bolnick, & Skelly, 2014; Slatkin, 1987). Further, both performance and climate are highly multidimensional and locally adapted lineages will likely exhibit a range of responses across vital rates and environmental drivers (Figure 3). Climate responses are also frequently asym‐metric, with sharp declines beyond some upper climate threshold (Angilletta, 2009; Deutsch et al., 2008; Martin & Huey, 2008). Alternative functional forms for modeling climate responses will, in particular, impact forecasts that extrapolate beyond the range of available data (Figure 3).
However, we found few examples of studies that carefully eval‐uated these sources of model and parameter uncertainty (Table 1), all of which arise when incorporating LA. Alternative models of LA, including different environmental drivers, intraspecific groupings, or functional forms for climate responses, could be integrated by aver‐aging predictions weighted by AIC or some other measure of relative support (Akaike, 1974; Burnham & Anderson, 2004). For example, model‐averaged forecasts could be used to reflect uncertainty in
whether vital rates exhibit Gaussian vs. asymmetric responses to climate (Figure 3). Within a given model structure, uncertainty in the values of key parameters can be propagated into forecasts using Bayesian or bootstrapping approaches (Merow et al., 2014; Wang et al., 2010) or quantified with sensitivity analysis (Buckley, 2008). Finally, establishing a range of forecast outcomes can be an effec‐tive tool to understand the sensitivity of predictions to assumptions for which few data are available, such as comparing models with or without LA (e.g., Angert et al., 2011; Pearman et al., 2010).
Increasingly, researchers have recognized that species’ fore‐casts should convey uncertainty (Buisson, Thuiller, Casajus, Lek, & Grenouillet, 2010; Guisan et al., 2006; Hartley, Harris, & Lester, 2006), but this needs to include the uncertainty associated with the pattern, strength, and geographic scale of LA. In particular, we have little understanding of how LA compares to the effects of other, well‐known sources of uncertainty in distribution forecasts, such as different modeling algorithms, climate forecasts, or dispersal scenar‐ios (Buisson et al., 2010; Engler et al., 2009).
Given these multiple sources of uncertainty in fitting models that include LA, collection of independent data that can be used to validate model predictions should be a high priority, to quan‐tify both the accuracy of fitted climate responses and their ability
F I G U R E 3 Steps to better account for uncertainty arising from local adaptation in species distribution forecasts. The process of building a distribution model should consider the potential for local climate adaptation to occur at different geographic scales, to follow different response curves, and to involve multiple vital rates and environmental drivers. Because of the uncertainty in model structure and parameter values, independent data should be used to validate fitted climate responses to new lineages or environments (open points and solid lines show original data and fitted Gaussian curve, solid points and dashed line show new data and updated asymmetric curve), as well as predicted distribution or abundance at new sites (open points show sites used to fit original model, and solid points show new sites used to validate predicted occurrence or abundance). Incorporating these sources of uncertainty into species forecasts will highlight targets for additional data collection, resulting in an iterative modeling–validation process to improve forecast precision
Environment
Geographic scaleof local adaptation
Pe
rfo
rma
nce
Model selection
etarht
wor
G
Temperature
Alternative vital rateresponse curves
Temperatureor precipitation
)(
htw
orG
)(l
avivrus
ro
Different vital rates& climate drivers
Model validationSources of uncertainty- Model structure- Parameter values- Climate forecast- Dispersal rates
- Model averaging- Bayesian or bootstrap- Sensitivity analysis- Range of outcomes
Species forecastsIterative modeling
Climate responses
etar
htw
orG
Temperature
new dataDistribution
model fittingvalidation
- Identify key assumptionsor uncertainties
- Target for additionaldata collection
10 | PETERSON ET al.
to capture patterns of distribution (Figure 3). This can include laboratory or field experiments that test predicted responses to forecasted climate or the collection of data from new populations not used in the fitting process. In addition to validating climate re‐sponses, the ability of a model to capture current distributions can be evaluated by sampling new locations throughout the species range and assessing the ability of the model to predict presence of the species at those locations (“present‐casting”); these same steps can also be applied to demographic rates or abundances. This step is especially important for understanding the ability of models to interpolate LA to new populations and environments. Independent model validation is a powerful tool, enabling an it‐erative modeling process whereby key sources of forecast uncer‐tainty can be identified and targeted for additional data collection (Figure 3).
3.2 | Interpolating climate responses throughout species’ ranges
An important and outstanding challenge for distribution models is how to apply local climate sensitivities, often estimated for a nar‐row subset of lineages, field sites, or environments, to predict fu‐ture performance throughout the species range. For example, several studies have developed detailed models of varying climate responses along environmental gradients, but stop short of fore‐casting changes in species’ distribution (Crozier, Zabel, & Hamlet, 2008; Kingsolver & Buckley, 2018). Perhaps the most biologically re‐alistic approach would be to use historical environmental conditions to infer a population's likely response to future climate. Field and laboratory experiments suggest that many populations perform best under conditions that are similar to their historical climate (Eliason et al., 2011; Hoffman et al., 2002; Wilczek, Cooper, Korves, & Schmitt, 2014). The exceptions are populations from high latitudes or eleva‐tions, which often perform better under conditions that are more benign than they have typically experienced (i.e., “countergradient variation”; Conover & Present, 1990; Fangue, Podrabsky, Crawshaw, & Schulte, 2009; Reich & Oleksyn, 2008). However, the positive effects of warming in these portions of the range may only occur with a very limited amount of warming and could also be mitigated by biotic effects such as competition that may also increase with warming (e.g., Alexander, Diez, & Levine, 2015; Compagnoni & Adler 2014; Klanderud & Totland 2007). This suggests that tying peak performance to average local climate and incorporating geographic trends in the breadth of climate/performance relationships could be the best way to interpolate climate responses from well‐studied populations to new sites throughout the species range. Response function studies come closest to this goal, predicting performance at any site based on historical and future climate. However, popu‐lations from similar climates can also show significant variation in their responses to climate change (Wang et al., 2006), and this varia‐tion has so far not been propagated into any forecasts. Indeed, most studies we reviewed did not attempt to interpolate patterns of LA, but instead aggregated separate forecasts across lineages to predict
the species‐level distribution under climate change (D'Amen et al., 2013; Pearman et al., 2010). This approach is most plausible when the chosen intraspecific lineages are representative of the entire species and the geographic scale of LA is broad, but these assump‐tions need to be justified.
The potential for adaptation to aspects of the local environment other than climate will further complicate interpolation across the species range. For example, most distribution models use climate drivers such as temperature or precipitation regardless of whether this variation occurs across altitudinal or latitudinal gradients, which may differ in other variables that modulate climate responses. For example, competition with newly co‐occurring species, changes in photoperiod, or other nonclimate abiotic factors such as soils could limit the ability of lineages to expand their ranges into otherwise climatically suitable habitat (Griffith & Watson, 2006; Merrill et al., 2008). The extent to which climate responses across altitude are pre‐dictive of climate responses across latitude, or vice versa, remains a major outstanding question (De Frenne et al., 2013; Jump, Matyas, & Peñuelas, 2009; Matias & Jump, 2015). Wang et al. (2010) consid‐ered interactions of climate variables with latitude, longitude, and elevation to allow for geographically constrained climate responses; support for inclusion of these indirect variables suggests the impor‐tance of other, correlated aspects of the environment (Austin, 2002). Only three studies in our review considered LA to nonclimate en‐vironmental drivers, all of which were abiotic variables such as soil type or topography that were assumed to remain static over time. No study attempted to include LA to biotic drivers, such as interact‐ing species, that could also shift under climate change. Intraspecific variation can have profound impacts on species interactions (Des Roches et al., 2018; Moran, Hartig, & Bell, 2016), suggesting LA to biotic drivers is an important consideration in applying climate re‐sponses across the species’ range and should be a high priority for independent model validation.
3.3 | Estimation and use of empirical dispersal and gene flow rates
Whether species will be able to disperse sufficiently quickly to track shifting climate conditions has profound consequences for forecasts of species distribution under climate change (Engler et al., 2009; Schloss, Nuñez, & Lawler, 2012). Incorporating LA only magnifies the importance of dispersal, as it will determine the redistribution of intraspecific lineages throughout the species range, with impor‐tant consequences for the conservation of genetic variation (Sgro, Lowe, & Hoffmann, 2011). For example, several studies have paired traditional species‐wide SDMs, which do not incorporate LA in re‐sponses to climate, with range‐wide genetic sampling to infer the loss of unique genetic lineages in the warmer portions of the species range due to predicted declines in habitat suitability there (Bálint et al., 2011; Buonomo et al., 2018; Neiva et al., 2015). However, other studies directly incorporating LA into distribution models have pre‐dicted warmer‐adapted lineages to expand their distributions under climate change (Benito Garzón et al., 2011; Kapeller, Lexer, Geburek,
| 11PETERSON ET al.
Hiebl, & Schueler, 2012). In general, if populations are strongly adapted to local climate conditions, then in situ persistence under climate change could be low throughout the species range (see Figure 2 in Peterson et al., 2018). In this case, the relative risk to dif‐ferent lineages will depend critically on rates of dispersal. If dispersal rates are high, then warmer‐adapted lineages may be able to persist by replacing colder‐adapted lineages, whereas colder‐adapted line‐ages may have to disperse well beyond the historical range and could therefore be at greater risk, particularly for polar or alpine species (Figure 1).
Although most distribution forecasts that incorporate LA as‐sume either unlimited dispersal or compare unlimited and no dis‐persal scenarios, potential dispersal rates for intraspecific lineages will likely have fairly narrow bounds. To better characterize dis‐persal, some studies have used direct estimates of dispersal rates (Cacciapaglia & van Woesik, 2018; Morin et al., 2008), whereas oth‐ers have assumed dispersal will be constrained by land use bound‐aries (D'Amen et al., 2013; Hamann & Aitken, 2013; Schwalm et al., 2016). More complex models could incorporate spatially varying dispersal rates due to habitat fragmentation or biotic filters, or even the potential for dispersal traits to evolve at shifting range margins (Phillips, Brown, Webb, & Shine, 2006; Williams, Kendall, & Levine, 2016). Placing biologically grounded bounds on dispersal rates will improve our ability to predict the redistribution and potential loss of genetic lineages and ecologically important traits. Achieving this goal would be facilitated by additional computational tools, such as MIGCLIM (Engler, Hordijk, & Guisan, 2012) or RangeShifter (Bocedi et al., 2014), that can incorporate dispersal into grid‐based distribu‐tion models (Chipperfield, Holland, Dytham, Thomas, & Hovestadt, 2011). Although many species‐wide forecasts have emphasized greater risk in the warmest portions of species ranges, identifying the areas of greatest conservation concern may depend on whether the focus is on preserving specific lineages (perhaps as a means to ensure adaptability to future conditions range‐wide) or simply main‐taining healthy populations, regardless of their genetic composition, within a particular geographic region (Bálint et al., 2011; Crandall, Bininda‐Emonds, Mace, & Wayne, 2000; D'Amen et al., 2013; Sgro et al., 2011).
Finally, as intraspecific lineages shift their distributions under climate change, a critical question is how gene flow among diver‐gently adapted lineages could alter climate responses. In all of the studies we reviewed, climate sensitivities were assumed to remain static into the future. Yet there is a growing effort to incorporate ongoing evolutionary dynamics into models of climate change re‐sponses (Bocedi et al., 2014; Bush et al., 2016; Cotto et al., 2017; Kearney, Porter, Williams, Ritchie, & Hoffmann, 2009; Thuiller et al., 2013). For example, AdaptR (Bush et al., 2016) allows thermal response curves of Drosophilids to evolve under changing climate conditions. To our knowledge, none of these approaches have yet incorporated intraspecific variation in initial climate responses to account for LA to historical climate conditions. However, this would be straightforward to implement if the data were available (Bush et al., 2016). LA could also be simulated for historical climate
conditions and then compared to current patterns of intraspecific variation to validate their use in forecasting future evolutionary change. Dynamic evolutionary models require information on indi‐vidual variation in responses to climate within populations, such as the heritability of thermal optima or breadth. Collecting these data for multiple populations to incorporate LA requires experimen‐tally tractable organisms and thus will be even more difficult than current approaches that account for the short‐term effects of LA but ignore the potential for future evolutionary change. However, where feasible, dynamic evolutionary models that account for LA to historical climate conditions could be used to explicitly test dif‐fering hypotheses about the joint effects of dispersal, gene flow, and evolutionary potential in driving species’ responses to climate change.
3.4 | Taking advantage of existing local adaptation datasets to improve forecasts
The majority of studies we reviewed relied on occurrence data, from which inference about LA is extremely constrained (see above). However, datasets on local climate adaptation are abundant (Bocedi et al., 2013; Fournier‐Level et al., 2011; Jump & Peñuelas, 2005; King et al., 2017; Savolainen et al., 2007). Nonetheless, linking LA datasets to models that can predict species‐wide patterns of distribution or abundance will be challenging. Perhaps the most obvious issue is the replication of environmental conditions and populations necessary to parameterize a species‐wide distribution model. Among the studies we reviewed, those based on experimental data used an average of 1,050 (median = 134, range = 9–3,600) population × environment combinations.1 In contrast, a review of reciprocal transplant experiments found an average of 11.2 (median = 4, range = 2–72) population–garden combinations2 (Hereford, 2009). However, it may be the case that capturing responses at environmental extremes, as is common in transplant experiments, is more important than high levels of replication to accurately parameterize distribution models with LA. Wang et al. (2010) performed a rarefaction analysis for a response function model and found that model precision was not greatly increased beyond 49 populations and 21 test sites, or about 12% of the dataset used to parameterize the full model. However, it would be useful to expand this approach to additional datasets and to test the effects of capturing populations and gardens representative of environmental extremes relative to random subsampling.
Datasets that span multiple years also increase the power to observe limiting conditions and detect locally adapted climate re‐sponses. The studies we reviewed all used time‐averaged measures of climate and performance, such as 30‐year climate summary sta‐tistics (WorldClim bioclimatic variables; Hijmans et al., 2005), histor‐ical occurrences, or diameter at breast height after 20 years (Wang
1 We were only able to estimate the number of combinations for 10 of 12 models with exper‐imental data, some of which used the same dataset in multiple studies (Appendix S2).
2 We calculated the number of combinations used in each study in the Appendix of Hereford (2009).
12 | PETERSON ET al.
et al., 2006). However, demographic studies have shown that rare bad years can profoundly limit population growth and persistence (Boyce, Haridas, Lee, & The Nceas Stochastic Demography Working Group, 2006; Lewontin & Cohen, 1969; Tuljapurkar & Orzack, 1980; Young, 1994), suggesting that time‐averaged climate and perfor‐mance measures are both oversimplified and less powerful for de‐tecting LA than are annual data. Careful analyses of the sensitivity of model predictions to levels of replication, including over time, would shed light on the potential to use sparser, but more readily avail‐able, experimental or demographic data sets, while also establishing guidelines for the design of future studies. Sparser LA datasets can also be used in combination with more readily available presence/absence or abundance data to infer distribution, using hidden pro‐cess or inverse modeling approaches (reviewed by Evans, Merow, Record, McMahon, & Enquist, 2016).
3.5 | Taking demographic approaches to forecasting distribution and abundance
Importantly, no study in our review addressed how the population growth rate, perhaps the ultimate determinant of distribution (Birch, 1953; Pulliam, 2000), will respond to climate change given LA, although Buckley (2008) predicted patterns of abundance that several populations might achieve across the range. Instead, existing studies have mostly predicted occurrence, whereas forecasts of local abundance would be far more useful for predicting the ecological and conservation impacts of climate change (Cotto et al., 2017; Ehrlén & Morris, 2015). That said, it is not trivial to determine how LA will impact climate responses in the full set of vital rates that determine population growth rate, abundance, and the likelihood of persistence. Existing approaches, based on data for one or a few vital rates, mask the potential for other unstudied vital rates to have stronger impacts on population growth or even opposing responses to climate variation (Figure 1c, inset). Several studies have shown that climate responses differ among developmental stages, with some stages more sensitive to projected climate changes than others (Levy et al., 2015; McLaughlin & Zavaleta, 2012; Radchuk, Turlure, & Schtickzelle, 2013; Woods & Wilson, 2013). For example, Radchuk et al. (2013) found that warming improved performance across all life stages of a butterfly, except for overwintering larvae which had lower survival under warming. Interestingly, population growth was most sensitive to this life cycle transition, and population growth rates decreased with warming despite positive effects on all other life stages. However, none of the studies we reviewed assessed climate effects across the entire life cycle of an organism. In addition to differences among life stages, different types of vital rates, such as survival, growth, or fecundity, could have opposing responses to climate change (Bestion, Teyssier, Richard, Clobert, & Cote, 2015; Doak & Morris, 2010; Peterson et al., 2018), a possibility that becomes more likely when populations across a species’ entire range are considered (Villellas, Doak, García, & Morris,
2015). The climate responses of a single vital rate or life stage may therefore have little influence on population growth, and thus patterns of distribution or abundance, leading to biased forecasts of species range shifts.
A landscape demography approach (Gurevitch, 2016) could address these challenges by incorporating data on all of the vital rates needed to predict population growth rates (Figure 4). Landscape demography approaches have the advantage of in‐corporating density dependence, thereby allowing the predic‐tion of changes in equilibrial abundance, which provides much more information on the ecological impact and conservation risk for populations throughout the species range (Ehrlén & Morris, 2015). Another advantage of these models is that their output can be directly linked to potential conservation actions, by identifying the vital rates, life stages, or environ‐mental changes to which population growth or extinction risk is most sensitive (Merow et al., 2014). Although a few studies have used demographic models to forecast species’ range re‐sponses to climate change (Fernández‐chacón et al., 2011; García‐Callejas, Molowny‐Horas, & Retana, 2016; Merow et al., 2014), or used demographic models in conjunction with tradi‐tional SDMs (Swab, Regan, Matthies, Becker, & Bruun, 2015; Ulrey, Quintana‐Ascencio, Kauffman, Smith, & Menges, 2016), none have yet included LA in vital rate responses to climate, most likely because of the additional data needed to separately estimate vital rate responses to climate drivers within multiple populations. Incorporating LA will thus require multisite demo‐graphic studies as well as methods to interpolate vital rate/cli‐mate relationships throughout the species’ range. Although this approach is necessarily data‐intensive, requiring experimental climate manipulations or substantial spatial and temporal repli‐cation, we advocate its adoption in well‐studied or experimen‐tally tractable systems for which these data can be collected.
Finally, individual‐based models provide perhaps the most flex‐ible, albeit computationally intensive, frameworks for incorporat‐ing local adaptation, dispersal, and demographic stochasticity into range and abundance predictions. For example, RangeShifter is a platform that combines demographic models with individual‐based variation in dispersal (Bocedi et al., 2014), and could be used to incorporate local adaptation by separately modeling intraspecific groups with differing environmental tolerances. Similar but sep‐arate modeling frameworks include dynamic vegetation models (DVMs), which employ approaches that generalize the strategy used in the original forest gap models (Snell et al., 2014). These models include both demographic processes as well as physio‐logical attributes and competitive interactions among individuals (e.g., Vanderwel, Lyutsarev, & Purves, 2013; Gutiérrez, Snell, & Bugmann, 2016). Although there have been repeated calls to use this framework to predict climate change effects, including range shifts, and also suggestions that these models incorporate local adaptation (Anderegg, 2015; Keane et al., 2001; Snell et al., 2014), we could find no existing studies using this framework that have done so yet.
| 13PETERSON ET al.
4 | BUILDING TOWARD A GENER AL FR AME WORK
As we have reviewed, there are myriad approaches and challenges to incorporating LA into climate response forecasts and thus at‐tempting to improve our predictions. In the face of this complexity, it is important to return to the importance of trying to do so in the first place. First, there is overwhelming evidence that LA to climate is strong and extremely common in natural populations (Bocedi et al., 2013; Fournier‐Level et al., 2011; Jump & Peñuelas, 2005; King et al., 2017; Savolainen et al., 2007). Second, if LA to climate has the effects proposed by us and by many others (Atkins & Travis, 2010; Bocedi et al., 2013; Valladares et al., 2014), it will profoundly alter general patterns of climate change response away from those pre‐dicted by the dominant paradigm of “trailing‐edge/leading‐edge” responses (Hampe & Petit, 2005 has been cited 1,390 times and “trailing‐edge leading‐edge climate change” has 52,300 results on Google Scholar). While this paradigm is a powerful way to conceive of climate responses, if LA is strong, it may also severely under‐estimate the impacts of climate change on the range, density, and genetic diversity of species.
Addressing any of the challenges outlined above requires data that are unavailable for many organisms and unlikely to be collected within the timeframe needed to make accurate fore‐casts for conservation planning. For this reason, a high priority
for climate change biologists must be to test general hypotheses about the effects of intraspecific variation in shaping species’ re‐sponses to climate change. For example, does optimal climate or climate niche breadth vary predictably with latitude or elevation? Does incorporating LA tend to make species‐level forecasts more or less pessimistic? Are warm or cold‐adapted lineages at greater risk, and does this depend on dispersal rates? Searching for generalities will require consistent reporting of key data across studies (Table 2). For example, surprisingly few of the studies we reviewed here reported the geographic distribution, historical en‐vironmental conditions, and inferred climate responses for each intraspecific lineage considered. These data, collected across a range of taxa, are necessary for any meta‐analysis seeking to un‐derstand the role of LA in shaping forecasted responses to cli‐mate change.
Studies that report the results of multiple models for the same sys‐tem will further clarify the strengths and weaknesses of differing data sources and modeling approaches. For example, reporting the results of a species‐wide distribution model alongside one incorporating in‐traspecific variation would allow tests of whether accounting for such variation alters either predictive accuracy or forecasted risk. Although this question has been the subject of a few individual studies (Angert et al., 2011; D'Amen et al., 2013; Pearman et al., 2010), developing a species‐wide model is an important step in the model selection and val‐idation process, and the inclusion of the results of such a model would
F I G U R E 4 This flowchart outlines a protocol for using a landscape demography approach to project future distribution and range‐wide abundance given local adaptation. Statistical and modeling steps are in solid boxes, demographic data are in dash‐dotted boxes, occurrence/abundance data from nonstudy sites are in dotted boxes, and historic and projected climate data are in dashed boxes. DD: density‐dependent; DI: density‐independent; λ: low‐density population growth rate. Sources of uncertainty are in bold
1a. In populations across range for 1+ years, measure: i. all vital rates; ii. environmental variables; iii. density around individuals
1b. Conduct laboratory/field reciprocal transplant experiments (to broaden environments for genotypes from demography populations)
2. Fit multiple models for each vital rate as functions of environmental variables and density
3. Select suite of best models (model uncertainty) for each vital rate in each population; retain parameter uncertainty in all models
4. Interpolate models for each vital rate for sites across range other than demography sites (uncertainty about local adaptation pattern)
5. Construct suite of spatially varying population models that integrate environment- and density-dependent models for all vital rates
6. Obtain range-wide historical climate data, downscaled to the level of 1a; interpolate nonclimate drivers
7a. Test ability of DI version of population model to predict (λ > 1) occurrence at sites other than those in 1a
7b. Test ability of DD version of population model to predict abundance at sites other than those in 1a
Validation of population model
8. Refine range-wide population model (e.g., reject poorly performing vital rate models; add dispersal limitations)
9. Obtain projections, across current range and beyond, from multiple GCMs (climate model uncertainty), downscaled to the level of 1a
10. Project future range using DI version of population model, and project abundance across future range using DD version of population model; incorporate all sources of uncertainty
14 | PETERSON ET al.
TAB
LE 2
G
ener
al h
ypot
hese
s th
at c
an b
e ad
dres
sed
by m
odel
s in
corp
orat
ing
intr
aspe
cific
var
iatio
n in
clim
ate
resp
onse
s (“G
× E
”) in
to s
peci
es’ d
istr
ibut
ion
fore
cast
s. D
ata
requ
ired
and
exam
ples
of s
tudi
es th
at e
valu
ate
each
hyp
othe
sis.
For
hyp
othe
ses
addr
esse
d by
at l
east
ten
mod
els,
we
repo
rt th
e nu
mbe
r of m
odel
s ou
t of t
he to
tal n
umbe
r tha
t fin
d su
ppor
t for
the
hypo
thes
is (S
uppo
rtin
g In
form
atio
n A
ppen
dix
S2).
We
also
sug
gest
ste
ps fo
r fut
ure
stud
ies
to te
st th
ese
hypo
thes
es. C
onsi
sten
t rep
ortin
g of
key
dat
a ac
ross
man
y st
udie
s ar
e ne
cess
ary
for
stro
nger
test
s of
thes
e hy
poth
eses
in th
e fu
ture
Hyp
othe
sis
Eval
uatio
n m
etho
dEx
ampl
esCu
rren
t un
ders
tand
ing
Sugg
estio
ns
Intr
aspe
cific
gro
ups
diff
er in
resp
onse
s to
clim
ate
chan
geC
limat
e re
spon
ses
in p
erfo
rman
ce fo
r a s
et o
f in
tras
peci
fic li
neag
esO
’Nei
ll et
al.
(200
8)14
/15
mod
els
in
supp
ort
Stat
istic
al te
sts
for l
inea
ge ×
clim
ate
inte
ract
ions
Incl
udin
g G
× E
incr
ease
s m
odel
acc
urac
yVa
lidat
ion
of m
odel
s w
ith a
nd w
ithou
t G ×
EPe
arm
an e
t al.
(201
0)17
/24
mod
els
in
supp
ort
Com
pare
intr
aspe
cific
mod
els
to a
sp
ecie
s‐w
ide
mod
el, p
erfo
rm
inde
pend
ent m
odel
val
idat
ion
Incl
udin
g G
× E
incr
ease
s fo
reca
sted
risk
of
spec
ies‐
leve
l dec
lines
Spec
ies‐
leve
l for
ecas
ts fr
om m
odel
s w
ith a
nd w
ithou
t G
× E
Cac
ciap
aglia
and
van
W
oesi
k (2
018)
10/2
3 m
odel
s in
su
ppor
tC
ompa
re in
tras
peci
fic m
odel
s to
a
spec
ies‐
wid
e m
odel
, agg
rega
te
linea
ge‐le
vel f
orec
asts
to u
nder
stan
d sp
ecie
s‐le
vel r
isk
Clim
atic
opt
ima
(bre
adth
) are
cor
rela
ted
with
hi
stor
ical
clim
ate
mea
ns (v
aria
bilit
y)In
ferr
ed p
erfo
rman
ce/c
limat
e re
latio
nshi
ps a
nd
hist
oric
al c
limat
e co
nditi
ons
for e
ach
linea
geA
nger
t et a
l. (2
011)
Insu
ffic
ient
ev
iden
ceSt
atis
tical
test
s fo
r cor
rela
tions
bet
wee
n cl
imat
e re
spon
ses
and
clim
ate
of o
rigin
ac
ross
line
ages
War
m‐a
dapt
ed li
neag
es a
re a
t gre
ater
risk
than
co
ld‐a
dapt
ed li
neag
esLi
neag
e‐le
vel f
orec
asts
and
his
toric
al c
limat
e co
nditi
ons
or in
ferr
ed p
erfo
rman
ce/c
limat
e re
latio
nshi
ps
Hu
et a
l. (2
017)
Insu
ffic
ient
ev
iden
ceSt
atis
tical
test
s fo
r cor
rela
tions
bet
wee
n fo
reca
sted
risk
and
clim
ate
of o
rigin
or
clim
ate
optim
a ac
ross
line
ages
, with
an
d w
ithou
t dis
pers
al
Rang
e‐ed
ge li
neag
es a
re a
t gre
ater
risk
than
ce
ntra
lly o
ccur
ring
linea
ges
Line
age‐
leve
l for
ecas
ts a
nd c
urre
nt d
istr
ibut
ions
Wan
g et
al.
(200
6)In
suff
icie
nt
evid
ence
Stat
istic
al te
sts
for c
orre
latio
ns b
etw
een
rang
e po
sitio
n an
d fo
reca
sted
risk
, with
an
d w
ithou
t dis
pers
al
| 15PETERSON ET al.
allow more general tests of the effects of LA on species forecasts. Similarly, studies that incorporate intraspecific variation through re‐sponse functions or mechanistic models could easily compare these re‐sults to SDMs fit to more readily available occurrence data (e.g., Oney, Reineking, O'Neill, & Kreyling, 2013).
5 | CONCLUSIONS
Incorporating LA in climate responses has the potential to greatly improve forecasts of species’ responses to climate change. A wide range of data sources to estimate intraspecific variation in climate responses and methods to incorporate this information into species‐level forecasts already exist. However, current approaches can be substantially improved by rigorously testing and validating intraspe‐cific variation in climate responses across a range of geographic scales and thoroughly evaluating the effects of uncertainty asso‐ciated with LA on forecasts. Landscape demographic models and dynamic evolutionary models, while data‐intensive, each hold great promise for addressing the effects of climate change across the life cycle and of future evolutionary processes. Finally, we hope that by continuing to improve and apply these methods across a wide range of taxa, we can begin to evaluate more general hypotheses for the ways in which LA may alter species’ responses to climate change.
ACKNOWLEDG EMENTS
This work was supported by NSF grants DEB‐1340024, DEB‐1353781, DEB‐1242355, and DEB‐1753954.
ORCID
Megan L. Peterson https://orcid.org/0000‐0002‐5010‐2721
R E FE R E N C E S
Ågren, J., & Schemske, D. W. (2012). Reciprocal transplants demonstrate strong adaptive differentiation of the model organism Arabidopsis thaliana in its native range. New Phytologist, 194, 1112–1122. https://doi.org/10.1111/j.1469‐8137.2012.04112.x
Aitken, S. N., Yeaman, S., Holliday, J. A., Wang, T., & Curtis‐McLane, S. (2008). Adaptation, migration or extirpation: Climate change out‐comes for tree populations. Evolutionary Applications, 1, 95–111. https://doi.org/10.1111/j.1752‐4571.2007.00013.x
Akaike, H. (1974). A new look at the statistical model identification. IEEE Transactions on Automatic Control, 19, 716–723. https://doi.org/10.1109/TAC.1974.1100705
Alexander, J. M., Diez, J. M., & Levine, J. M. (2015). Novel competitors shape species' responses to climate change. Nature, 525, 515–518. https://doi.org/10.1038/nature14952
Anderegg, W. R. L. (2015). Spatial and temporal variation in plant hy‐draulic traits and their relevance for climate change impacts on veg‐etation. New Phytologist, 205, 1008–1014. https://doi.org/10.1111/nph.12907
Anderson, J. T., Inouye, D. W., McKinney, A. M., Colautti, R. I., & Mitchell‐Olds, T. (2012). Phenotypic plasticity and adaptive evolution
contribute to advancing flowering phenology in response to climate change. Proceedings of the Royal Society of London. Series B: Biological Sciences, 279, 3843–3852. https://doi.org/10.1098/rspb.2012.1051
Anderson, J. T., Perera, N., Chowdhury, B., & Mitchell‐Olds, T. (2015). Microgeographic patterns of genetic divergence & adaptation across environmental gradients in Boechera stricta (Brassicaceae). The American Naturalist, 186, S60–S73.
Angert, A. L., & Schemske, D. W. (2005). The evolution of species' dis‐tributions: Reciprocal transplants across the elevation ranges of Mimulus cardinalis and M. lewisii. Evolution, 59, 1671–1684. https://doi.org/10.1111/j.0014‐3820.2005.tb01817.x
Angert, A. L., Sheth, S. N., & Paul, J. R. (2011). Incorporating population‐level variation in thermal performance into predictions of geographic range shifts. Integrative and Comparative Biology, 51, 733–750. https://doi.org/10.1093/icb/icr048
Angilletta, M. J. (2009). Thermal adaptation: A theoretical & empirical syn-thesis. Oxford, UK: Oxford University Press.
Araújo, M. B., & New, M. (2007). Ensemble forecasting of species dis‐tributions. Trends in Ecology and Evolution, 22, 42–47. https://doi.org/10.1016/j.tree.2006.09.010
Atkins, K. E., & Travis, J. M. (2010). Local adaptation and the evolution of species' ranges under climate change. Journal of Theoretical Biology, 266, 449–457. https://doi.org/10.1016/j.jtbi.2010.07.014
Austin, M. P. (2002). Spatial prediction of species distribution: An interface between ecological theory and statistical modelling. Ecological Modelling, 157, 101–118. https://doi.org/10.1016/S0304‐3800(02)00205‐3
Bálint, M., Domisch, S., Engelhardt, C. H. M., Haase, P., Lehrian, S., Sauer, J., … Nowak, C. (2011). Cryptic biodiversity loss linked to global climate change. Nature Climate Change, 1, 313–318. https://doi.org/10.1038/nclimate1191
Bellard, C., Bertelsmeier, C., Leadley, P., Thuiller, W., & Courchamp, F. (2012). Impacts of climate change on the future of biodiversity. Ecology Letters, 15, 365–377.
Benito Garzón, M., Alía, R., Robson, T. M., & Zavala, M. A. (2011). Intra‐specific variability and plasticity influence potential tree species dis‐tributions under climate change. Global Ecology & Biogeography, 20, 766–778. https://doi.org/10.1111/j.1466‐8238.2010.00646.x
Bestion, E., Teyssier, A., Richard, M., Clobert, J., & Cote, J. (2015). Live fast, die young: Experimental evidence of population extinction risk due to climate change. PLoS Biology, 13, e1002281. https://doi.org/10.1371/journal.pbio.1002281
Birch, L. C. (1953). Experimental background to the study of the distri‐bution and abundance of insects: I. The influence of temperature, moisture and food on the innate capacity for increase of three grain beetles. Ecology, 34, 698–711. https://doi.org/10.2307/1931333
Bocedi, G., Atkins, K. E., Liao, J., Henry, R. C., Travis, J. M., & Hellmann, J. J. (2013). Effects of local adaptation & interspecific competition on species' responses to climate change. Annals of the New York Academy of Sciences, 1297, 83–97.
Bocedi, G., Palmer, S. C. F., Pe'er, G., Heikkinen, R. K., Matsinos, Y. G., Watts, K., … Freckleton, R. (2014). RangeShifter: A platform for mod‐elling spatial eco‐evolutionary dynamics and species' responses to environmental changes. Methods in Ecology and Evolution, 5, 388–396. https://doi.org/10.1111/2041‐210X.12162
Boyce, M. S., Haridas, C. V., Lee, C. T., & The Nceas Stochastic Demography Working Group (2006). Demography in an increasingly variable world. Trends in Ecology and Evolution, 21, 141–148. https://doi.org/10.1016/j.tree.2005.11.018
Broennimann, O., Fitzpatrick, M., Pearman, P., Petitpierre, B., Pellissier, L., Yoccoz, N., … Guisan, A. (2012). Measuring ecological niche overlap from oc‐currence and spatial environmental data. Global Ecology and Biogeography, 21, 481–497. https://doi.org/10.1111/j.1466‐8238.2011.00698.x
Buckley, L. B. (2008). Linking traits to energetics and population dy‐namics to predict lizard ranges in changing environments. American Naturalist, 171, E1–E19. https://doi.org/10.1086/523949
Buisson, L., Thuiller, W., Casajus, N., Lek, S., & Grenouillet, G. (2010). Uncertainty in ensemble forecasting of species distribution. Global Change Biology, 16, 1145–1157. https://doi.org/10.1111/j.1365‐2486.2009.02000.x
Buonomo, R., Chefaoui, R. M., Lacida, R. B., Engelen, A. H., Serrao, E. A., & Airoldi, L. (2018). Predicted extinction of unique genetic diversity in marine forests of Cystoseira spp. Marine Environment Research, 138, 119–128. https://doi.org/10.1016/j.marenvres.2018.04.013
Burnham, K. P., & Anderson, D. R. (2004). Multimodel inference: Understanding AIC and BIC in model selection. Sociological Methods and Research, 33, 261–304. https://doi.org/10.1177/0049124104268644
Bush, A., Mokany, K., Catullo, R., Hoffmann, A., Kellermann, V., Sgro, C., … Ferrier, S. (2016). Incorporating evolutionary adaptation in species distribution modelling reduces projected vulnerability to climate change. Ecology Letters, 19, 1468–1478. https://doi.org/10.1111/ele.12696
Compagnoni, A., & Adler, P. (2014). Warming, competition, and Bromus tectorum population growth across an elevation gradient. Ecosphere, 5, 121.
Cacciapaglia, C., & van Woesik, R. (2018). Marine species distribution mod‐elling and the effects of genetic isolation under climate change. Journal of Biogeography, 45, 154–163. https://doi.org/10.1111/jbi.13115
Caswell, H. (2001). Matrix population models: Construction, analysis, and interpretation. Sunderland, MA: Sinauer Associates.
Chan, I. C., Hill, J. K., Ohlemüller, R., Roy, D. B., & Thomas, C. D. (2011). Rapid range shifts of species associated with high levels of cli‐mate warming. Science, 333, 1024–1026. https://doi.org/10.1126/science.1206432
Chapman, D. S., Scalone, R., Stefanic, E., & Bullock, J. M. (2017). Mechanistic species distribution modeling reveals a niche shift during invasion. Ecology, 98, 1671–1680. https://doi.org/10.1002/ecy.1835
Chipperfield, J. D., Holland, E. P., Dytham, C., Thomas, C. D., & Hovestadt, T. (2011). On the approximation of continuous dispersal kernels in discrete‐space models. Methods in Ecology and Evolution, 2, 668–681. https://doi.org/10.1111/j.2041‐210X.2011.00117.x
Clausen, J., Keck, D. D., & Hiesey, W. M. (1940). Experimental studies on the nature of species. I. Effect of varied environments on western North American plants. Washington, DC: Carnegie Institute.
Conover, D. O., & Present, T. M. C. (1990). Countergradient variation in growth rate: Compensation for length of the growing season among Atlantic silversides from different latitudes. Oecologia, 83, 316–324. https://doi.org/10.1007/BF00317554
Cotto, O., Wessely, J., Georges, D., Klonner, G., Schmid, M., Dullinger, S., … Guillaume, F. (2017). A dynamic eco‐evolutionary model pre‐dicts slow response of alpine plants to climate warming. Nature Communications, 8, 15399. https://doi.org/10.1038/ncomms15399
Crandall, K. A., Bininda‐Emonds, O. R. P., Mace, G. M., & Wayne, R. K. (2000). Considering evolutionary processes in conservation biology. Trends in Ecology & Evolution, 15, 290–295. https://doi.org/10.1016/S0169‐5347(00)01876‐0
Crozier, L. G., Zabel, R. W., & Hamlet, A. F. (2008). Predicting differential effects of climate change at the population level with life‐cycle mod‐els of spring Chinook salmon. Global Change Biology, 14, 236–249. https://doi.org/10.1111/j.1365‐2486.2007.01497.x
D’Amen, M., Zimmermann, N. E., & Pearman, P. B. (2013). Conservation of phylo‐geographic lineages under climate change. Global Ecology and Biogeography, 22, 93–104. https://doi.org/10.1111/j.1466‐8238.2012.00774.x
Davis, M. B., & Shaw, R. G. (2001). Range shifts and adaptive responses to Quaternary climate change. Science, 292, 673–678. https://doi.org/10.1126/science.292.5517.673
De Frenne, P., Graae, B. J., Rodríguez‐Sánchez, F., Kolb, A., Chabrerie, O., Decocq, G., … Verheyen, K. (2013). Latitudinal gradients as nat‐ural laboratories to infer species' responses to temperature. Journal of Ecology, 101, 784–795. https://doi.org/10.1111/1365‐2745.12074
Des Roches, S., Post, D., Turley, N., Bailey, J., Hendry, A., Kinnison, M., … Palkovacs, E. (2018). The ecological importance of
Deutsch, C. A., Tewksbury, J. J., Huey, R. B., Sheldon, K. S., Ghalambor, C. K., Haak, D. C., … Martin, P. (2008). Impacts of climate warming on terrestrial ectotherms across latitude. Proceedings of the National Academy of Sciences of the United States of America, 105, 6668–6672. https://doi.org/10.1073/pnas.0709472105
Doak, D. F., & Morris, W. F. (2010). Demographic compensation and tip‐ping points in climate‐induced range shifts. Nature, 467, 959–962. https://doi.org/10.1038/nature09439
Ehrlén, J., & Morris, W. F. (2015). Predicting changes in the distribution and abundance of species under environmental change. Ecology Letters, 18, 303–314. https://doi.org/10.1111/ele.12410
Eliason, E. J., Clark, T. D., Hague, M. J., Hanson, L. M., Gallagher, Z. S., Jeffries, K. M., … Farrell, A. (2011). Differences in thermal tolerance among sockeye salmon populations. Science, 332, 109–112. https://doi.org/10.1126/science.1199158
Engler, R., Hordijk, W., & Guisan, A. (2012). The MIGCLIM R package – Seamless integration of dispersal constraints into projections of species distribution models. Ecography, 35, 872–878. https://doi.org/10.1111/j.1600‐0587.2012.07608.x
Engler, R., Randin, C. F., Vittoz, P., Czáka, T., Beniston, M., Zimmermann, N. E., … Guisan, A. (2009). Predicting future distributions of moun‐tain plants under climate change: Does dispersal capacity matter? Ecography, 32, 34–45.
Evans, M. E. K., Merow, C., Record, S., McMahon, S. M., & Enquist, B. J. (2016). Towards process‐based range modeling of many species. Trends in Ecology & Evolution, 31, 860–871. https://doi.org/10.1016/j.tree.2016.08.005
Fangue, N. A., Podrabsky, J. E., Crawshaw, L. I., & Schulte, P. M. (2009). Countergradient variation in temperature preference in populations of killifish Fundulus heteroclitus. Physiological and Biochemical Zoology, 82, 776–786.
Fernández‐Chacón, A., Bertolero, A., Amengual, A., Tavecchia, G., Homar, V., & Oro, D. (2011). Spatial heterogeneity in the effects of climate change on the population dynamics of a Mediterranean tortoise. Global Change Biology, 17, 3075–3088. https://doi.org/10.1111/j.1365‐2486.2011.02469.x
Fournier‐Level, A., Korte, A., Cooper, M. D., Nordborg, M., Schmitt, J., & Wilczek, A. (2011). A map of local adaptation in Arabidopsis thaliana. Science, 334, 86–89. https://doi.org/10.1126/science.1209271
Franklin, J. (2009). Mapping species distributions: Spatial inference and pre-dictions. Cambridge, UK: Cambridge University Press.
García‐Callejas, D., Molowny‐Horas, R., & Retana, J. (2016). Projecting the distribution and abundance of Mediterranean tree species under climate change: A demographic approach. Journal of Plant Ecology, 10, 731–743. rtw081. https://doi.org/10.1093/jpe/rtw081
Gilman, S. E., Wethey, D. S., & Helmuth, B. (2006). Variation in the sen‐sitivity of organismal body temperature to climate change over local and geographic scales. Proceedings of the National Academy of Sciences of the United States of America, 103, 9560–9565. https://doi.org/10.1073/pnas.0510992103
Gray, L. K., Gylander, T., Mbogga, M. S., Chen, P., & Hamann, A. (2011). Assisted migration to address climate change: Recommendations for aspen reforestation in western Canada. Ecological Applications, 21, 1591–1603. https://doi.org/10.1890/10‐1054.1
Griffith, T. M., & Watson, M. A. (2006). Is evolution necessary for range expansion? Manipulating reproductive timing of a weedy annual transplanted beyond its range. The American Naturalist, 167, 153–164. https://doi.org/10.1086/498945
Groom, Q. J. (2013). Some poleward movement of British native vascular plants is occurring, but the fingerprint of climate change is not evi‐dent. PeerJ, 1, e77. https://doi.org/10.7717/peerj.77
Guisan, A., Lehmann, A., Ferrier, S., Austin, M., Overton, J. M. C., Aspinall, R., … Hastie, T. (2006). Making better biogeographical predictions
of species' distributions. Journal of Applied Ecology, 43, 386–392. https://doi.org/10.1111/j.1365‐2664.2006.01164.x
Gurevitch, J. (2016). Landscape demography: Population change & its drivers across spatial scales. The Quarterly Review of Biology, 91, 460–485.
Gutiérrez, A. G., Snell, R. S., & Bugmann, H. (2016). Using a dynamic for‐est model to predict tree species distributions. Global Ecology and Biogeography, 25, 347–358. https://doi.org/10.1111/geb.12421
Hällfors, M. H., Liao, J., Dzurisin, J. D., Grundel, R., Hyvärinen, M., Towle, K., … Hellmann, J. (2016). Addressing potential local adaptation in species distribution models: Implications for conservation under climate change. Ecological Applications, 26, 1154–1169. https://doi.org/10.1890/15‐0926
Hamann, A., & Aitken, S. N. (2013). Conservation planning under climate change: Accounting for adaptive potential and migration capacity in species distribution models. Diversity and Distributions, 19, 268–280. https://doi.org/10.1111/j.1472‐4642.2012.00945.x
Hampe, A., & Petit, R. J. (2005). Conserving biodiversity under climate change: The rear edge matters. Ecology Letters, 8, 461–467. https://doi.org/10.1111/j.1461‐0248.2005.00739.x
Hargreaves, A. L., Samis, K. E., & Eckert, C. G. (2014). Are species' range limits simply niche limits writ large? A review of transplant experi‐ments beyond the range. American Naturalist, 183, 157–173. https://doi.org/10.1086/674525
Hartley, S., Harris, R., & Lester, P. J. (2006). Quantifying uncertainty in the potential distribution of an invasive species: Climate and the Argentine ant. Ecology Letters, 9, 1068–1079. https://doi.org/10.1111/j.1461‐0248.2006.00954.x
Hereford, J. (2009). A quantitative survey of local adaptation and fitness trade‐offs. American Naturalist, 173, 579–588.
Herrando‐Pérez, S., Ferri‐Yáñez, F., Monasterio, C., Beukema, W., Gomes, V., Belliure, J., … Araújo, M. (2018). Intraspecific variation in lizard heat tolerance alters estimates of climate impact. Journal of Animal Ecology, 1–11. https://doi.org/10.1111/1365‐2656.12914
Hijmans, R. J., Cameron, S. E., Parra, J. L., Jones, P. G., & Jarvis, A. (2005). Very high resolution interpolated climate surfaces for global land areas. International Journal of Climatology, 25, 1965–1978. https://doi.org/10.1002/joc.1276
Hoffman, A. A., Anderson, A., & Hallas, R. (2002). Opposing clines for high and low temperature resistance in Drosophila melanogaster. Ecology Letters, 5, 614–618. https://doi.org/10.1046/j.1461‐0248.2002.00367.x
Holt, R. D. (2009). Bringing the Hutchinsonian niche into the 21st century: Ecological and evolutionary perspectives. Proceedings of the National Academy of Sciences, 106, 19659–19665. https://doi.org/10.1073/pnas.0905137106
Hu, X.‐G., Wang, T., Liu, S.‐S., Jiao, S.‐Q., Jia, K.‐H., Zhou, S.‐S., … Mao, J.‐F. (2017). Predicting future seed sourcing of Platycladus orientalis (L.) for future climates using climate niche models. Forests, 8, 471.
Ikeda, D. H., Max, T. L., Allan, G. J., Lau, M. K., Shuster, S. M., & Whitham, T. G. (2017). Genetically informed ecological niche models improve climate change predictions. Global Change Biology, 23, 164–176. https://doi.org/10.1111/gcb.13470
IPCC (2014). Climate change 2014: Synthesis report. Contribution of Working Groups I, II and III to the fifth assessment report of the Intergovernmental Panel on Climate Change [Core Writing Team, RK Pachauri & LA Meyer (eds)]. IPCC, Geneva, Switzerland, 151 pp.
Janzen, D. H. (1967). Why mountain passes are higher in the tropics. The American Naturalist, 101, 233–249. https://doi.org/10.1086/282487
Joshi, J., Schmid, B., Caldeira, M. C., Good, J., Harris, R., Hector, A., … Lawton, J. (2001). Local adaptation enhances performance of common plant species. Ecology Letters, 4, 536–544. https://doi.org/10.1046/j.1461‐0248.2001.00262.x
Jump, A. S., Matyas, C., & Peñuelas, J. (2009). The altitude‐for‐latitude disparity in the range retractions of woody species. Trends in Ecology & Evolution, 24, 694–701. https://doi.org/10.1016/j.tree.2009.06.007
Jump, A. S., & Peñuelas, J. (2005). Running to stand still: Adaptation and the response of plants to rapid climate change. Ecology Letters, 8, 1010–1020. https://doi.org/10.1111/j.1461‐0248.2005.00796.x
Kapeller, S., Lexer, M. J., Geburek, T., Hiebl, J., & Schueler, S. (2012). Intraspecific variation in climate response of Norway spruce in the eastern Alpine range: Selecting appropriate provenances for future climate. Forest Ecology and Management, 271, 46–57. https://doi.org/10.1016/j.foreco.2012.01.039
Kawecki, T. J., & Ebert, D. (2004). Conceptual issues in local ad‐aptation. Ecology Letters, 7, 1225–1241. https://doi.org/10.1111/j.1461‐0248.2004.00684.x
Keane, R. E., Austin, M., Field, C., Huth, A., Lexer, M. J., Peters, D., … Wyckoff, P. (2001). Tree mortality in gap models: Application to cli‐mate change. Climatic Change, 51, 509–540.
Kearney, M., Porter, W. P., Williams, C., Ritchie, S., & Hoffmann, A. A. (2009). Integrating biophysical models and evolutionary theory to predict climatic impacts on species’ ranges: The dengue mosquito Aedes aegypti in Australia. Functional Ecology, 23, 528–538.
Kelly, M. W., Sanford, E., & Grosberg, R. K. (2012). Limited potential for adaptation to climate change in a broadly distributed marine crus‐tacean. Proceedings of the Royal Society B: Biological Sciences, 279, 349–356. https://doi.org/10.1098/rspb.2011.0542
King, N. G., McKeown, N. J., Smale, D. A., & Moore, P. J. (2017). The importance of phenotypic plasticity and local adaptation in driving intraspecific variability in thermal niches of marine macrophytes. Ecography, 40, 1–14.
Kingsolver, J. G., & Buckley, L. B. (2018). How do phenology, plas‐ticity, and evolution determine the fitness consequences of cli‐mate change for montane butterflies? Evolutionary Applications, 11, 1231–1244.
Kirkpatrick, M., & Barton, N. H. (1997). Evolution of a species' range. The American Naturalist, 150, 1–23. https://doi.org/10.1086/286054
Klanderud, K., & Totland, Ø. (2007). The relative role of dispersal and local interactions for alpine plant community diversity under simu‐lated climate warming. Oikos, 116, 1279–1288.
Lee‐Yaw, J. A., Kharouba, H. M., Bontrager, M., Mahony, C., Csergo, A. M., Noreen, A. M., … Angert, A. (2016). A synthesis of transplant experiments and ecological niche models suggests that range lim‐its are often niche limits. Ecology Letters, 19, 710–722. https://doi.org/10.1111/ele.12604
Levy, O., Buckley, L. B., Keitt, T. H., Smith, C. D., Boateng, K. O., Kumar, D. S., … Angilletta, M. (2015). Resolving the life cycle alters expected impacts of climate change. Proceedings of the Royal Society of London. Series B: Biological Sciences, 282, 20150837. https://doi.org/10.1098/rspb.2015.0837
Lewontin, R. C., & Cohen, D. (1969). On population growth in a ran‐domly varying environment. Proceedings of the National Academy of Sciences of the United States of America, 62, 1056–1060. https://doi.org/10.1073/pnas.62.4.1056
Loarie, S. R., Duffy, P. B., Hamilton, H., Asner, G. P., Field, C. B., & Ackerly, D. D. (2009). The velocity of climate change. Nature, 462, 1052–1055. https://doi.org/10.1038/nature08649
Louthan, A. M., Doak, D. F., & Angert, A. L. (2015). Where and when do species interactions set range limits? Trends in Ecology & Evolution, 30, 780–792.
Maggini, R., Lehmann, A., Kéry, M., Schmid, H., Beniston, M., Jenni, L., … Zbinden, N. (2011). Are Swiss birds tracking climate change? Ecological Modelling, 222, 21–32.
Marcer, A., Mendez‐Vigo, B., Alonso‐Blanco, C., & Pico, F. X. (2016). Tackling intraspecific genetic structure in distribution models better reflects species geographical range. Ecology and Evolution, 6, 2084–2097. https://doi.org/10.1002/ece3.2010
Martin, T. L., & Huey, R. B. (2008). Why "suboptimal" is optimal: Jensen's inequality and ectotherm thermal preferences. American Naturalist, 171, E102–118. https://doi.org/10.1086/527502
Matias, L., & Jump, A. S. (2015). Asymmetric changes of growth and re‐productive investment herald altitudinal and latitudinal range shifts of two woody species. Global Change Biology, 21, 882–896. https://doi.org/10.1111/gcb.12683
McLaughlin, B. C., & Zavaleta, E. S. (2012). Predicting species re‐sponses to climate change: Demography and climate microrefugia in California valley oak (Quercus lobata). Global Change Biology, 18, 2301–2312. https://doi.org/10.1111/j.1365‐2486.2011.02630.x
Merow, C., Latimer, A. M., Wilson, A. M., McMahon, S. M., Rebelo, A. G., & Silander, J. A. (2014). On using integral projection models to generate demographically driven predictions of species' distribu‐tions: Development and validation using sparse data. Ecography, 37, 1167–1183. https://doi.org/10.1111/ecog.00839
Merrill, R. M., Gutierrez, D., Lewis, O. T., Gutierrez, J., Diez, S. B., & Wilson, R. J. (2008). Combined effects of climate and bi‐otic interactions on the elevational range of a phytophagous insect. Journal of Animal Ecology, 77, 145–155. https://doi.org/10.1111/j.1365‐2656.2007.01303.x
Meynard, C. N., Gay, P. E., Lecoq, M., Foucart, A., Piou, C., & Chapuis, M. P. (2017). Climate‐driven geographic distribution of the desert locust during recession periods: Subspecies' niche differentiation and rela‐tive risks under scenarios of climate change. Global Change Biology, 23, 4739–4749. https://doi.org/10.1111/gcb.13739
Molina‐Montenegro, M. A., & Naya, D. E. (2012). Latitudinal patterns in phenotypic plasticity and fitness‐related traits: Assessing the climatic variability hypothesis (CVH) with an invasive plant species. PLoS One, 7, e47620. https://doi.org/10.1371/journal.pone.0047620
Moran, E., Hartig, G., & Bell, D. (2016). Intraspecific trait variation across scales: Implications for understanding global change responses. Global Change Biology, 22, 137–150. https://doi.org/10.1111/gcb.13000
Morin, X., Viner, D., & Chuine, I. (2008). Tree species range shifts at a continental scale: New predictive insights from a pro‐cess‐based model. Journal of Ecology, 96, 784–794. https://doi.org/10.1111/j.1365‐2745.2008.01369.x
Moritz, C., Patton, J. L., Conroy, C. J., Parra, J. L., White, G. C., & Beissinger, S. R. (2008). Impact of a century of climate change on small‐mammal communities in Yosemite National Park, USA. Science, 322, 261–264. https://doi.org/10.1126/science.1163428
Mousseau, T. A., & Fox, C. W. (1998). The adaptive significance of ma‐ternal effects. Trends in Ecology & Evolution, 13, 403–407. https://doi.org/10.1016/S0169‐5347(98)01472‐4
Neiva, J., Assis, J., Coelho, N. C., Fernandes, F., Pearson, G. A., & Serrao, E. A. (2015). Genes left behind: Climate change threatens cryptic genetic diversity in the canopy‐forming seaweed Bifurcata bifurcata. PLoS One, 10, e0131530.
O’Neill, G. A., Hamann, A., & Wang, T. (2008). Accounting for popula‐tion variation improves estimates of the impact of climate change on species growth and distribution. Journal of Applied Ecology, 45, 1040–1049. https://doi.org/10.1111/j.1365‐2664.2008.01472.x
Oney, B., Reineking, B., O'Neill, G., & Kreyling, J. (2013). Intraspecific variation buffers projected climate change impacts on Pinus contorta. Ecology and Evolution, 3, 437–449.
Parmesan, C., Ryrholm, N., Stefansecu, C., Hill, J. K., Thomas, C. D., Descimon, H., … Warren, M. (1999). Poleward shifts in geographical ranges of butterfly species associated with regional warming. Nature, 399, 579–583. https://doi.org/10.1038/21181
Paul, J. R., Sheth, S. N., & Angert, A. L. (2011). Quantifying the impact of gene flow on phenotype‐environment mismatch: A demonstra‐tion with the scarlet monkeyflower Mimulus cardinalis. The American Naturalist, 178, S62–S79.
Pearman, P. B., D'Amen, M., Graham, C. H., Thuiller, W., & Zimmermann, N. E. (2010). Within‐taxon niche structure: Niche conservatism, di‐vergence and predicted effects of climate change. Ecography, 33, 990–1003. https://doi.org/10.1111/j.1600‐0587.2010.06443.x
Pelini, S. L., Dzurisin, J. D., Prior, K. M., Williams, C. M., Marsico, T. D., Sinclair, B. J., … Hellmann, J. (2009). Translocation experiments with butterflies reveal limits to enhancement of poleward popula‐tions under climate change. Proceedings of the National Academy of Sciences of the United States of America, 106, 11160–11165. https://doi.org/10.1073/pnas.0900284106
Peterson, M. L., Doak, D. F., & Morris, W. F. (2018). Both life‐history plasticity and local adaptation will shape range‐wide responses to climate warming in the tundra plant Silene acaulis. Global Change Biology, 24, 1614–1625.
Phillips, B. L., Brown, G. P., Webb, J. K., & Shine, R. (2006). Invasion and the evolution of speed in toads. Nature, 439, 803.
Phillips, S. J., Anderson, R. P., & Schapire, R. E. (2006). Maximum entropy modeling of species geographic distributions. Ecological Modelling, 190, 231–259.
Pinsky, M. L., Worm, B., Fogarty, M. J., Sarmiento, J. L., & Levin, S. A. (2013). Marine taxa track local climate velocities. Science, 341, 1239–1242. https://doi.org/10.1126/science.1239352
Poloczanska, E. S., Brown, C. J., Sydeman, W. J., Kiessling, W., Schoeman, D. S., Moore, P. J., … Richardson, A. J. (2013). Global imprint of cli‐mate change on marine life. Nature Climate Change, 3, 919–925. https://doi.org/10.1038/nclimate1958
Pulliam, H. R. (2000). On the relationship between niche and distribution. Ecology Letters, 3, 349–361. https://doi.org/10.1046/j.1461‐0248.2000.00143.x
Radchuk, V., Turlure, C., & Schtickzelle, N. (2013). Each life stage matters: The importance of assessing the response to climate change over the complete life cycle in butterflies. Journal of Animal Ecology, 82, 275–285. https://doi.org/10.1111/j.1365‐2656.2012.02029.x
Reich, P. B., & Oleksyn, J. (2008). Climate warming will reduce growth and survival of Scots pine except in the far north. Ecology Letters, 11, 588–597. https://doi.org/10.1111/j.1461‐0248.2008.01172.x
Richardson, J. L., Urban, M. C., Bolnick, D. I., & Skelly, D. K. (2014). Microgeographic adaptation and the spatial scale of evolution. Trends in Ecology & Evolution, 29, 165–176. https://doi.org/10.1016/j.tree.2014.01.002
Savolainen, O., Pyhäjärvi, T., & Knürr, T. (2007). Gene flow and local adaptation in trees. Annual Review of Ecology, Evolution, and Systematics, 38, 595–619. https://doi.org/10.1146/annurev.ecolsys.38.091206.095646
Schloss, C. A., Nuñez, T. A., & Lawler, J. J. (2012). Dispersal will limit ability of mammals to track climate change in the Western Hemisphere. Proceedings of the National Academy of Sciences of the United States of America, 109, 8606–8611. https://doi.org/10.1073/pnas.1116791109
Schwalm, D., Epps, C. W., Rodhouse, T. J., Monahan, W. B., Castillo, J. A., Ray, C., … Jeffress, M. (2016). Habitat availability and gene flow influence diverging local population trajectories under scenarios of climate change: A place‐based approach. Global Change Biology, 22, 1572–1584. https://doi.org/10.1111/gcb.13189
Sexton, J. P., & Dickman, E. E. (2016). What can local and geographic pop‐ulation limits tell us about distributions? American Journal of Botany, 103, 129–139.
Sgro, C. M., Lowe, A. J., & Hoffmann, A. A. (2011). Building evo‐lutionary resilience for conserving biodiversity under climate change. Evolutionary Applications, 4, 326–337. https://doi.org/10.1111/j.1752‐4571.2010.00157.x
Sheth, S. N., & Angert, A. L. (2014). The evolution of environmental tol‐erance and range size: A comparison of geographically restricted and widespread Mimulus. Evolution, 68, 2917–2931.
Slatkin, M. (1987). Gene flow and the geographic structure of natu‐ral populations. Science, 236, 787–792. https://doi.org/10.1126/science.3576198
Snell, R. S., Huth, A., Nabel, J. E. M. S., Bocedi, G., Travis, J. M. J., Gravel, D., … Lischke, H. (2014). Using dynamic vegetation models
to simulate plant range shifts. Ecography, 37, 1184–1197. https://doi.org/10.1111/ecog.00580
Sunday, J. M., Bates, A. E., & Dulvy, N. K. (2011). Global analysis of thermal tolerance and latitude in ectotherms. Proceedings of the Royal Society B: Biological Sciences, 278, 1823–1830. https://doi.org/10.1098/rspb.2010.1295
Sunday, J. M., Bates, A. E., & Dulvy, N. K. (2012). Thermal tolerance and the global redistribution of animals. Nature Climate Change, 2, 686–690.
Suttle, K. B., Thomsen, M. A., & Power, M. E. (2007). Species interactions reverse grassland responses to changing climate. Science, 315(5812), 640–642. https://doi.org/10.1126/science.1136401
Swab, R. M., Regan, H. M., Matthies, D., Becker, U., & Bruun, H. H. (2015). The role of demography, intra‐species variation, and species distribu‐tion models in species' projections under climate change. Ecography, 38, 221–230. https://doi.org/10.1111/ecog.00585
Thuiller, W. (2004). Patterns and uncertainties of species' range shifts under climate change. Global Change Biology, 10, 2020–2027. https://doi.org/10.1111/j.1365‐2486.2004.00859.x
Thuiller, W., Munkemuller, T., Lavergne, S., Mouillot, D., Mouquet, N., Schiffers, K., … Gravel, D. (2013). A road map for integrating eco‐evolutionary processes into biodiversity models. Ecology Letters, 16, 94–105. https://doi.org/10.1111/ele.12104
Tuljapurkar, S., & Orzack, S. H. (1980). Population dynamics in variable environments 1. Long‐run growth rates and extinction. Theoretical Population Biology, 18, 314–342.
Ulrey, C., Quintana‐Ascencio, P. F., Kauffman, G., Smith, A. B., & Menges, E. S. (2016). Life at the top: Long‐term demography, microclimatic refugia, and responses to climate change for a high‐elevation south‐ern Appalachian endemic plant. Biological Conservation, 200, 80–92. https://doi.org/10.1016/j.biocon.2016.05.028
Valladares, F., Matesanz, S., Guilhaumon, F., Araujo, M. B., Balaguer, L., Benito‐Garzon, M., … Zavala, M. (2014). The effects of phenotypic plasticity and local adaptation on forecasts of species range shifts under climate change. Ecology Letters, 17, 1351–1364. https://doi.org/10.1111/ele.12348
Vanderwel, M. C., Lyutsarev, V. S., & Purves, D. W. (2013). Climate‐re‐lated variation in mortality and recruitment determine regional for‐est‐type distributions. Global Ecology and Biogeography, 22, 1192–1203. https://doi.org/10.1111/geb.12081
Villellas, J., Doak, D. F., García, M. B., & Morris, W. F. (2015). Demographic compensation among populations: What is it, how does it arise and what are its implications? Ecology Letters, 18, 1139–1152.
Wang, T., Hamann, A., Yanchuk, A., O'Neill, G. A., & Aitken, S. N. (2006). Use of response functions in selecting lodgepole pine populations for
future climates. Global Change Biology, 12, 2404–2416. https://doi.org/10.1111/j.1365‐2486.2006.01271.x
Wang, T., O'Neill, G., & Aitken, S. N. (2010). Integrating environ‐mental and genetic effects to predict responses of tree popula‐tions to climate. Ecological Applications, 20, 153–163. https://doi.org/10.1890/08‐2257.1
Warren, D. L., Glor, R. E., & Turelli, M. (2008). Environmental niche equivalency versus conservatism: Quantitative approaches to niche evolution. Evolution, 62, 2868–2883. https://doi.org/10.1111/j.1558‐5646.2008.00482.x
Wilczek, A. M., Cooper, M. D., Korves, T. M., & Schmitt, J. (2014). Lagging adaptation to warming climate in Arabidopsis thaliana. Proceedings of the National Academy of Sciences of the United States of America, 111, 7906–7913. https://doi.org/10.1073/pnas.1406314111
Williams, J. L., Kendall, B. E., & Levine, J. M. (2016). Rapid evolution accel‐erates plant population spread in fragmented experimental landscapes. Science, 353, 482–485. https://doi.org/10.1126/science.aaf6268
Woods, H. A., & Wilson, R. (2013). Ontogenetic changes in the body tem‐perature of an insect herbivore. Functional Ecology, 27, 1322–1331. https://doi.org/10.1111/1365‐2435.12124
Yang, J., Pedlar, J. H., McKenney, D. W., & Weersink, A. (2015). The devel‐opment of universal response functions to facilitate climate‐smart re‐generation of black spruce and white pine in Ontario, Canada. Forest Ecology and Management, 339, 34–43. https://doi.org/10.1016/j.foreco.2014.12.001
Young, T. P. (1994). Natural die‐offs of large mammals: Implications for conservation. Conservation Biology, 8, 410–418. https://doi.org/10.1046/j.1523‐1739.1994.08020410.x
SUPPORTING INFORMATION
Additional supporting information may be found online in the Supporting Information section at the end of the article.
How to cite this article: Peterson ML, Doak DF, Morris WF. Incorporating local adaptation into forecasts of species’ distribution and abundance under climate change. Glob Change Biol. 2019;00:1–19. https://doi.org/10.1111/gcb.14562