49
Sponsored by XSInc Increase Yields and Reduce Costs with Variable Rate Planting Precision Ag Insight Webinar July 8, 2015
| Date post: | 11-Aug-2015 |
| Category: |
Presentations & Public Speaking |
| Upload: | xsinc |
| View: | 61 times |
| Download: | 0 times |

Sponsored by XSInc
Increase Yields and Reduce Costs with Variable Rate Planting
Precision Ag Insight WebinarJuly 8, 2015

Sponsored by XSInc
Webcast Format
• You are muted.
• Please ask questions using the “Questions” box.• Click the red arrow to close/open
controls.• Click the “plus” next to “Questions” if
you don’t see the questions box.
• A recording of today’s webcast will be emailed to you.
Minimized Controls
Sponsored by XSInc
Speakers• Chad Godsey, PhD
Owner, Godsey Precision Ag
• Dave Scheiderer President, Integrated Ag
• Dale Cowan Senior Agronomist, AGRIS and Wanstead Coops

Sponsored by XSInc
Registration QuestionHow many of your growers are currently utilizing variable seeding technology?
• Very few, 0-25%• Some, 26-50%• Most, 51-75% • Almost all, 76-100%

Sponsored by XSInc
Results
Very few, 0-25%62%
Some, 26-50%32%
Most, 51-75%3%
Almost all, 76-100%3%

Sponsored by XSInc
Basics of Variable Rate Planting
• Local agronomy trumps everything most of what we will discuss this morning
• Types of data required to create quality seeding zones vary from region to region
• Seek professional support from someone who understands your local agronomy and has experience using GIS tools

Sponsored by XSInc
Basics of Variable Rate Planting
• Develop clear cut goals for what you want to accomplish• Save on seed costs?• Increase yield?

Sponsored by XSInc
End of Year Analysis - Whole Field
Table 1. Input cost and realized savings for 2010-2014
Input Minimum Rate Maximum Rate Average RateSavings over uniform rate
- - - - - - - - - - - - - - - - - - - - - per acre - - - - - - - - - - - - - - - - - - - - -
Seed 27,000 34,000 31,299 $1.75†
Nitrogen (lb/N) 30 100 67 $11.07‡
Total Input Savings $12.82

Sponsored by XSInc
End of Year Analysis – Whole Field
Table 2. Whole field analysis and increase in revenue from variable rate management
Long-term Average Prior to Mgt†
Difference in Year of Treatment minus Long-term Average
Seed Savings for Field
Nitrogen Savings for Field
Increase Revenue for Field from Yield Increase
201 bu/ac 17.1 $229† $1450‡ $8960¶
†Savings based on a uniform seeding rate of 32,000 seeds per acre and $80 per acre seeding cost.‡Savings based on a uniform rate of 85 lb N/ac and $0.60/lb N, applied as UAN.¶ Revenue increased on $4.00/bu selling price.

Sponsored by XSInc
Considerations
• Work with seed companies on hybrid population dynamics
• Cover the basics before moving on to VRS
• Set reasonable expectations from VR seeding and do it early• Economics• Chances of achieving goals in year one

Sponsored by XSInc
Understanding Sources of Variability
• There are 3 main types of field variability: 1. Natural - field landscape2. Man made – field activities3. Random – weather
• All 3 interact individually and together to determine crop outcome
• The fourth source of variability is plant to plant

Sponsored by XSInc
Cobs collected from 1/1000 of an acre

Sponsored by XSInc
1 2 3 4 5 6 7 8 9 10 11 12 13 14 15 16 17 18 19 20 21 22 23 24 25 26 27 28 29 30 31 320
50
100
150
200
250
Range in Corn Yield 1/1000 of an Acre
Ear Location
Yiel
d bu
s/ a
cre
125.6 bushel range in estimated yieldOverall average yield 175 bus/ acre , potential yield with plant uniformity 217 bushels per acre a 42 bushel increase

Sponsored by XSInc
Management Zones
• First, understand the scope of the variability and opportunities; then create management zones
• Consistent size and shape• Consistent year over year in terms of yield performance • Attributes that can be measured and managed • Sources are - multiple years of yield maps, topography, soil data,
drone imagery, farmer input , others – all layers should support a consistent development of management zones

Sponsored by XSInc
Management Zones • Most GIS software packages contain tools for multiyear yield
analysis (MYYA), yield normalization or merging of layers.• Simple is the best place to start• Identify above average, average and below average yield areas;
sometimes you will find areas that are variable each year • Decide how you will position population rates in zones or
management blocks within zones• What are the specific hybrid dynamics? • Work with seed companies

Sponsored by XSInc
Registration QuestionWhat is your biggest challenge in achieving your objectives for variable seeding?
• Collecting the data • Establishing management zones• Getting the recommendation implemented correctly • Evaluating effectiveness of the recommendation at the
end of the season

Sponsored by XSInc
ResultsCollecting the
data17%
Establishing management
zones19%
Evaluating effectiveness of the recommendation at the end of the season
36%
Getting the recommenda-
tion imple-mented cor-
rectly28%

Sponsored by XSInc
Hybrid Performance Data
• 3 yield potentials per maturity zones:
< 80 RM 80 - 90 RM > 90 RMLow <120 bu/ac <140 bu/ac <160 bu/acMid 120-150 bu/ac 140-180 bu/ac 160-210 bu/acHigh >150 bu/ac >180 bu/ac >210 bu/ac

Sponsored by XSInc

Sponsored by XSInc
DKC49-82RIB Optimums
Yield Optimum Economical Optimum
Pop (Pl/Ac)
Yield (Bu/Ac)
Revenue ($/Ac)
Pop (Pl/Ac)
Revenue ($/Ac)
High 40.2 239.2 811.33 36.1 818.76
Mid 34.4 194.8 654.63 30.3 662.05
Low N/A N/A N/A N/A N/A
Seeds Price = $275/80 000 kernels bag95% GerminationCorn Price = 4 $/Bu

Sponsored by XSInc

Sponsored by XSInc
DKC57-75RIB Optimums
Yield Optimum Economical Optimum
Pop (Pl/Ac)
Yield (Bu/Ac)
Revenue ($/Ac)
Pop (Pl/Ac)
Revenue ($/Ac)
High 43.2 242.1 812.02 36.9 823.35
Mid 46.8 190.1 591.13 33.3 615.51
Low N/A N/A N/A N/A N/A
Seeds Price = $275/80 000 kernels bag95% GerminationCorn Price = 4 $/Bu

Sponsored by XSInc

Sponsored by XSInc
DKC61-89RIB Optimums
Yield Optimum Economical Optimum
Pop (Pl/Ac)
Yield (Bu/Ac)
Revenue ($/Ac)
Pop (Pl/Ac)
Revenue ($/Ac)
High 36.4 242.1 836.50 33.9 841.04
Mid 37.0 191.3 631.25 33.1 638.23
Low N/A N/A N/A N/A N/A
Seeds Price = $275/80 000 kernels bag95% GerminationCorn Price = 4 $/Bu

Sponsored by XSInc
Price/ unit of seed (80,000) = $275.00
Seed cost per 1000 seeds $3.44
If you increase population by 5K, seed cost increases by $17.22/ acre.
At $4.00 corn, you need 4.3 bushels per acre increase to break even.
If you decrease seed by 5K and save $17.22 an acre in seed costs, yields can drop the same for a break even; but ideally they must stay the same as normal rate to realize a true benefit.
Simple Seeding Economics

Sponsored by XSInc
MYYA 3 years of corn yield data- 3 years of corn in last 5 years
Most farmers alternate Corn, Soy, Wheat, so it takes 9 years to get 3 years of corn – we can normalize soy and corn together.
This map formed the base for creating management zones.
The Process

Sponsored by XSInc
VRS Target • MYYA
• Soil test data
• Hybrid performance data
• Monitor information 20/20
• Farmer input
Sponsored by XSInc
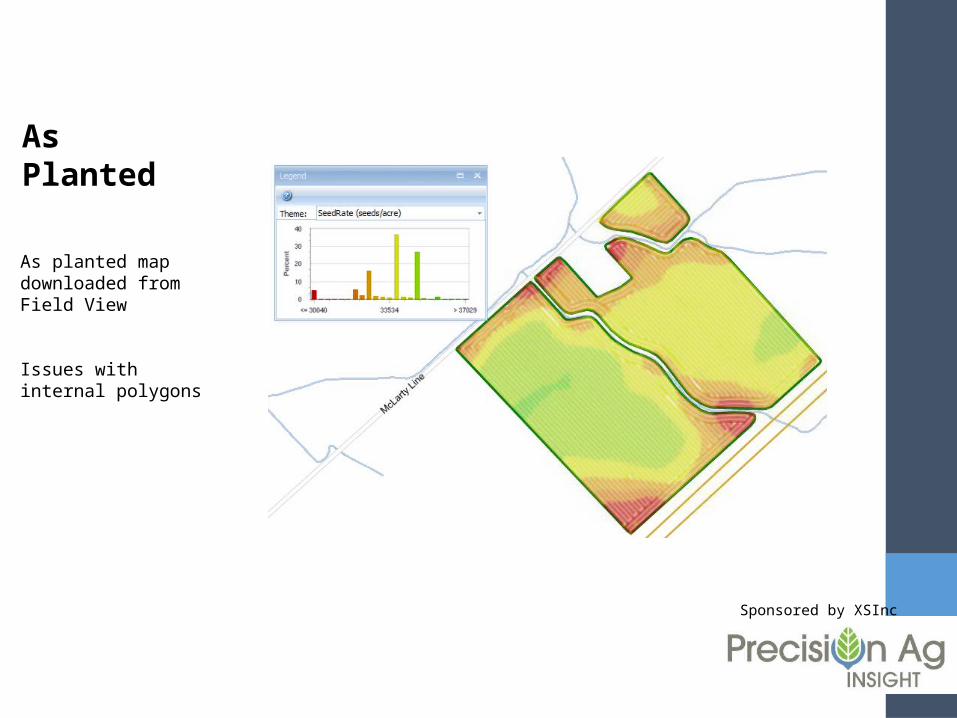
As planted map downloaded from Field View
Issues with internal polygons
As Planted
Sponsored by XSInc
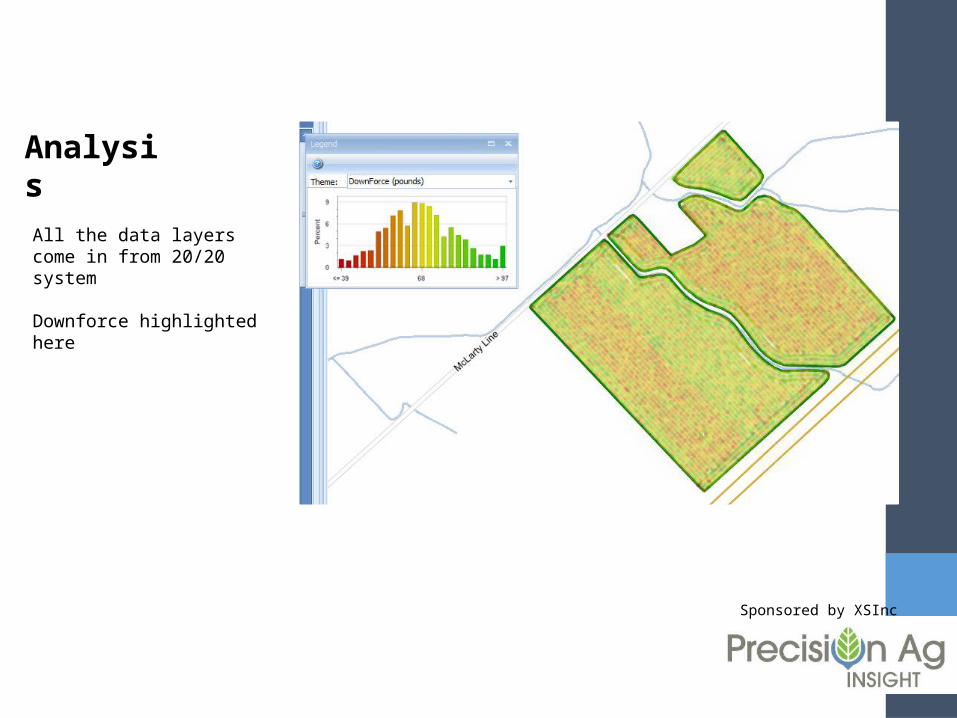
All the data layers come in from 20/20 system
Downforce highlighted here
Analysis

Sponsored by XSInc
After all the effort and investment, take the time to scout and understand the issues with final plant populations.
Not being critical, just realistic
What you plan and plant with precision may not all show up
Other learning opportunities “emerge” that impact VRS outcomes

Sponsored by XSInc
Summary
• Having data (all relevant data ) organized in the GIS allows analysis tools to be used (e.g. XS Inc)
• Yield x population etc.• The only variable on this farm is the seeding rate • Small management blocks afford an opportunity to analyze
within the zone, without skewing the yield in larger areas • Verification of management zones and population rates
compared to normal farmer practices• Calculate the ROI

Sponsored by XSInc
Redefining Seeding Zones & Optimizing Rates
Sponsored by XSInc
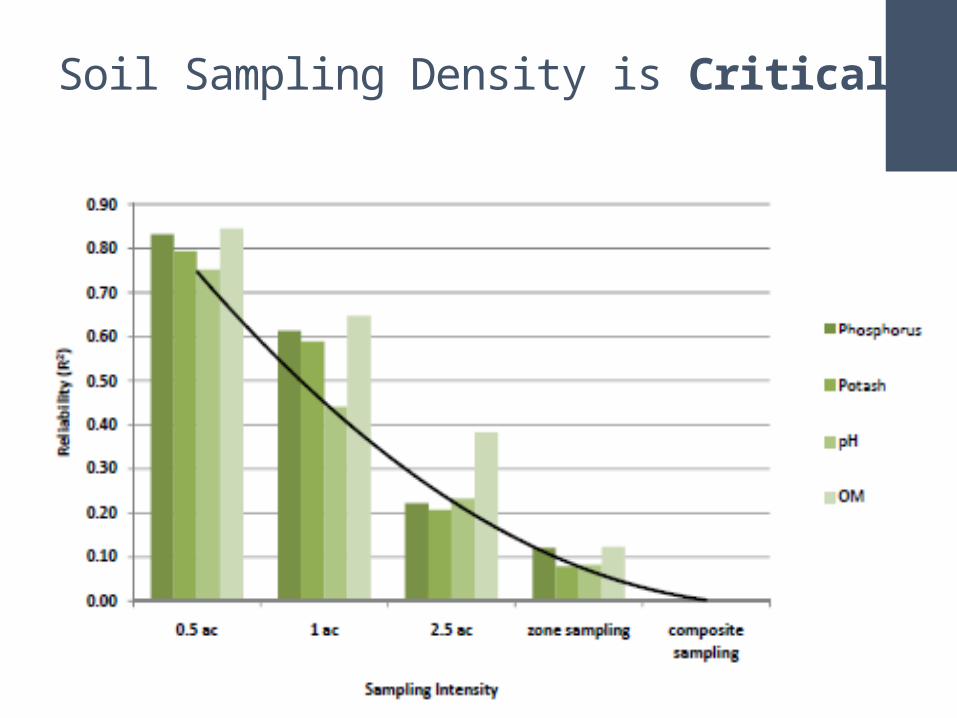
Soil Sampling Density is Critical

Sponsored by XSInc
What is a Common Production Unit?Common Production Unit (CPU)• Classifies land units that possess similar
characteristics affecting crop development• Quantifies the temporal stability of the field from:
-Soil Organic Matter-Soil Texture (CEC)-Normalized Yield (+2 yrs.) -Slope (elevation) -Irrigation

How A CPU Is CreatedSoil Organic Matter
Soil CEC
Normalized Yield
Slope
CPUs - created from compiled data

Sponsored by XSInc
Soil Types as Management Zones Don’t Model Well
NDVI/Soil Type
CPU/Soil Type

Yield DataCPU using normalized yields, om, slope, CEC

Aerial Imagery
• Great diagnostic tool• Must have a good
understanding of the field to set up management zones

Thermal Imagery
Multi-Layer CPU

Sponsored by XSInc
Theoretical Yield Response to Population
Optimizing Seeding Rates for Corn Production (Crop Insights, Pioneer-DuPont)
By Steve Butzen, Agronomy Information Manager
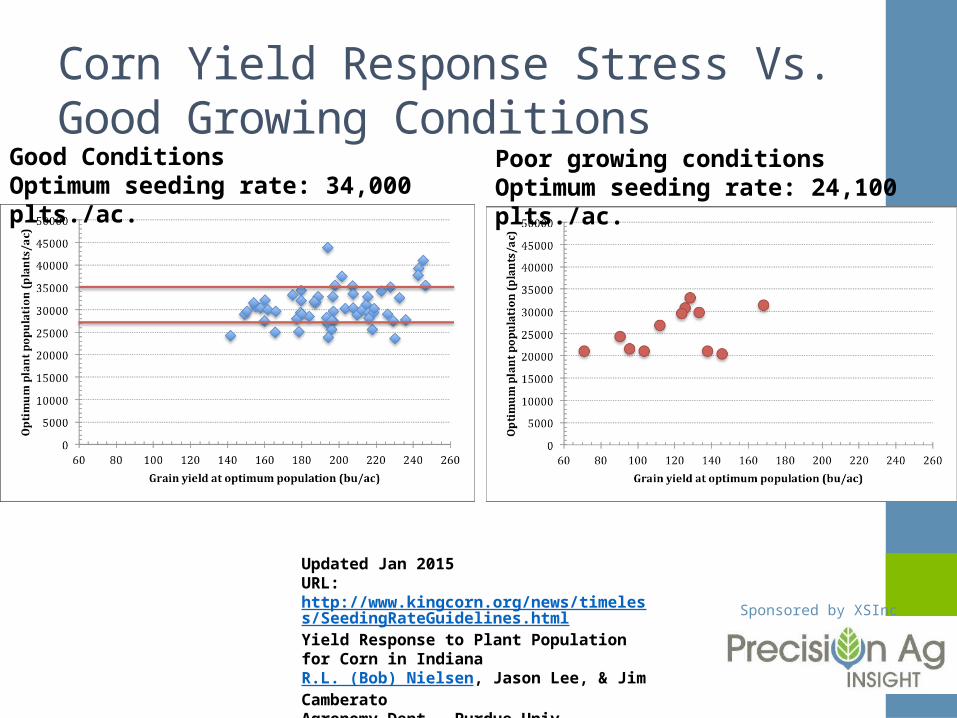
Corn Yield Response Stress Vs. Good Growing Conditions
Updated Jan 2015URL: http://www.kingcorn.org/news/timeless/SeedingRateGuidelines.htmlYield Response to Plant Population for Corn in IndianaR.L. (Bob) Nielsen, Jason Lee, & Jim CamberatoAgronomy Dept., Purdue Univ.West Lafayette, IN 47907-2054
Good Conditions Optimum seeding rate: 34,000 plts./ac.
Poor growing conditions Optimum seeding rate: 24,100 plts./ac.

Sponsored by XSInc
CPU Zones to VR Seeding Prescription
CPU VR Seeding Prescription

Sponsored by XSInc
Data Analysis to Refine Populations and Hybrid Choice

Sponsored by XSInc
Thank You
Chad Godsey, PhDOwner, Godsey Precision AgPhone: 970-630-7732Email: [email protected]: godseyag.comTwitter: @godseyag
Stick around for an AgVeritas demonstration.

Sponsored by XSInc
AgVeritas – Overview
• Web-based yield analysis tool• Uses spatial statistics to analyze yield• Analyzes all the factors that impact yield simultaneously
• Planting choice / rate• Treatment choice / rate• Nutrient levels, soil types, elevation• And many more
• Determines which factors impacted yield more and less• Calculates if and where a tested management practice is
profitable

Sponsored by XSInc
AgVeritas - Variable Rate Analysis Example
Seeding Rate ChecksManagement Zones
The Question: What is the optimal seeding rate in my management zones?
- 36k - 33K- 33K - 31K - 28K

Sponsored by XSInc
AgVeritas – Variable Rate Analysis Result
Optimal rates by zone• Above Average = 35k• Slightly Above Average = 32k• Average = 34k• Slightly Below Average = 32k• Below Average = 29K
Check – Originally Recommended Rates:
• Above Average = 36K• Slightly Above Average
= 33K• Average = 33k• Slightly Below Average
= 31K• Below Average = 28K

Sponsored by XSInc
Thank You
Chad Godsey, PhDOwner, Godsey Precision AgPhone: 970-630-7732Email: [email protected]: godseyag.comTwitter: @godseyag


