Increased light efficiency of coherent-optical matchedfilters
Adolf W. Lohmann and Charlotte Thum
The light efficiency of the coherent-optical matched filter is determined by the integral intensity transmit-tance of the spatial filter; in other words, by the integral power spectrum of the target object. We increasethe light efficiency by multiplying the object with a spatially fixed phase mask which disperses the light moreevenly in the Fourier domain. The mask has to be designed to achieve a reasonable balance between in-crease of light efficiency and decrease of SNR. The SNR will decrease in general, since the target object isat an arbitrary position but the phase mask is at a fixed position. In special cases, however, the light effi-ciency can be increased considerably while the SNR remains almost the same as in the case of an ordinarymatched filter.
I. Introduction
A well-known tool in optical pattern recognition is theVanderLugt "matched filter." 1 By use of this filter,one particular object in an input scene can be identifiedby a correlation peak in the output. For additive sig-nal-independent white noise in the input, the signal-to-noise ratio (SNR) in the output peak is maximum,if the filter function is the complex conjugate of thetarget frequency spectrum.
If the matched filter is used in coherent-optical dataprocessing, it has one important drawback: the lightefficiency, that is, the fraction of the input light whichis converted into the output peak, is generally ratherlow. Horner 2 introduced a measure for the light effi-ciency of optical pattern recognition systems which heapplied to the design of filters on dichromated gelatin.Caulfield3 emphasized the importance of the Hornerefficiency in optical pattern recognition.
The low light efficiency of coherent-optical matchedfilters is due to the fact that, for most common inputobjects (e.g., alphabetic letters), the light power in theFourier spectrum is very unevenly distributed: it ischaracterized by a high peak at zero spatial frequencyand a rapid falloff of the power toward higher spatialfrequencies. This falloff is detrimental since the
The authors are with Universitat Erlangen-Nurnberg, Physikal-isches Institut, Erwin-Rommel-str. 1, 8520 Erlangen, Federal Re-public of Germany.
maximum of the filter transmittance is normalized tounity.4
In ordinary holography, it is well known how to in-crease the light efficiency: a diffuser, i.e., a phase mask,is placed on the object during the recording process.Hence, the range of brightness in the recording planeis better matched to dynamic range of the photographicplate.5'6 This approach for improving the light effi-ciency can also be used if a Fourier hologram is used asa pupil function for incoherent matched filtering.7' 8
We wish to use such a high-efficiency Fourier holo-gram as a matched filter with coherent light. This is notpossible in general because, during hologram recording,object and phase mask are at a fixed relative position.If later the object (as target) is in the same relative po-sition to the phase mask, there will be a perfect detec-tion peak in the matched filtering experiment. But thisassumption is too restrictive from a practical point ofview. We want the object (without the phase mask) tobe allowed to occupy any arbitrary position, whereas thephase mask is a fixed part of the matched filtering ap-paratus. While such a system would not work with anarbitrary random-phase mask, it will work fairly wellwith a specially designed, periodic phase mask. Thedesign of this periodic phase mask is the crux of our newmethod.
II. Light Efficiency of the Coherent-Optical MethodFilter
The photographic filter is matched to one particularobject u(x). Its amplitude transmission i3(v) is thecomplex conjugate of the Fourier transform C1 (v) of u (x),normalized to unity:
where max (z) I = a (0) for real non-negative objectsu(x). When this filter is used to detect the objectu (x - x0) in the input, we get an autocorrelation peakat x0 in the output whose intensity is
I(xo) = (u0u)(O)1 2 1K2 = Ilu(x)l 2 dxI2 /K 2
= I Ia(v) 12dvP I 2/K2. (1)
For the light efficiency we use a definition which isslightly different from that of Horner.2 The importantfactors for the light efficiency q in the output peak arethe overall input intensity SIu(x)I2 dx = SJ i(v)I 2dv,the output peak intensity I(xo), and the width of thecorrelation peak which is the sensible width of a slitdetector for measuring the peak intensity. The widthof the peak is approximately inversely proportional tothe spatial frequency bandwidth Az' of the object u (x).We define it as
I(xO)/AV fSCZ(v)I2dv fA 2 (v)dv -
flU(x)12dx AZvK2 -A maxA
2(v) 1
(2)
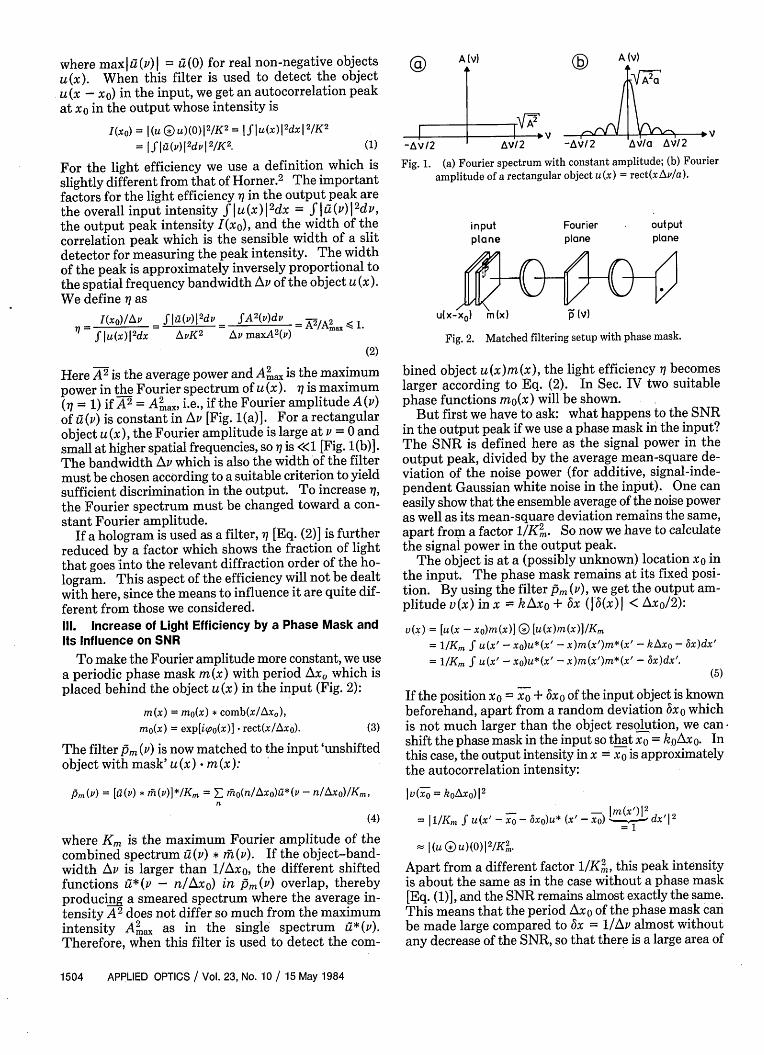
Here A2 is the average power and A 2ax is the maximumpower in the Fourier spectrum of u (x). is maximum(=1) if A2 = A2ax, i.e., if the Fourier amplitude A(v)of u(v) is constant in AlP [Fig. 1(a)]. For a rectangularobject u (x), the Fourier amplitude is large at v = 0 andsmall at higher spatial frequencies, so 7 is <<1 [Fig. 1(b)].The bandwidth Av which is also the width of the filtermust be chosen according to a suitable criterion to yieldsufficient discrimination in the output. To increase aq,the Fourier spectrum must be changed toward a con-stant Fourier amplitude.
If a hologram is used as a filter, Xq [Eq. (2)] is furtherreduced by a factor which shows the fraction of lightthat goes into the relevant diffraction order of the ho-logram. This aspect of the efficiency will not be dealtwith here, since the means to influence it are quite dif-ferent from those we considered.1I1. Increase of Light Efficiency by a Phase Mask and
Its Influence on SNR
To make the Fourier amplitude more constant, we usea periodic phase mask m(x) with period Ax, which isplaced behind the object u(x) in the input (Fig. 2):
m(x) = mO(x) * comb(x/Ax),
mo(x) = exp[ispo(x)] - rect(x/Axo). (3)
The filter 1m (v) is now matched to the input 'unshiftedobject with mask' u(x) . :
where Km is the maximum Fourier amplitude of thecombined spectrum a (v) * mh(v). If the object-band-width Av is larger than 1/Axo, the different shiftedfunctions a*(v - n/Axo) in pm(v') overlap, therebyproducing a smeared spectrum where the average in-tensity A 2 does not differ so much from the maximumintensity Anax as in the single spectrum a*(v).Therefore, when this filter is used to detect the com-
A(v)
Xi
-AI2 Av2 -Avl2 AVla AvI2
Fig. 1. (a) Fourier spectrum with constant amplitude; (b) Fourieramplitude of a rectangular object u(x) = rect(xAP/a).
input Fourier outputplane plane plane
u(x-x 0) m(x) p (v)
Fig. 2. Matched filtering setup with phase mask.
bined object u(x)m(x), the light efficiency n becomeslarger according to Eq. (2). In Sec. IV two suitablephase functions mo(x) will be shown.
But first we have to ask: what happens to the SNRin the output peak if we use a phase mask in the input?The SNR is defined here as the signal power in theoutput peak, divided by the average mean-square de-viation of the noise power (for additive, signal-inde-pendent Gaussian white noise in the input). One caneasily show that the ensemble average of the noise poweras well as its mean-square deviation remains the same,apart from a factor 1/KM. So now we have to calculatethe signal power in the output peak.
The object is at a (possibly unknown) location x0 inthe input. The phase mask remains at its fixed posi-tion. By using the filter Pm (v), we get the output am-plitude v(x) in x = kAxo + 5x (I (x)I < Axo/2):
= 1/Km f u(x' - xo)u*(x' - x)m(x')m*(x' - bx)dx'.(5)
If the position x0 = xo + 5x0 of the input object is knownbeforehand, apart from a random deviation bxo whichis not much larger than the object resolution, we canshift the phase mask in the input so that xo = koAxo. Inthis case, the output intensity in x = xo is approximatelythe autocorrelation intensity:
Iv(xo = koAxo)12
-IM(XI)12
=11Km, X >(x W xo - 6xo)u* (x - xo) dx' 1 2
U (D ) (0) I21Km.
Apart from a different factor 1/K2, this peak intensityis about the same as in the case without a phase mask[Eq. (1)], and the SNR remains almost exactly the same.This means that the period Ax0 of the phase mask canbe made large compared to 3x = 1/Av almost withoutany decrease of the SNR, so that there is a large area of
overlap of the shifted functions u(P - n/Axo) in Eq. (4),and X) can be increased considerably ( $ 1).
The case looks different if the input position x0 of theobject is not known. Now x0 is not a multiple of themask period Ax0 in general. The intensity of the out-put peak is
If the mask period Axo is large compared to 1/Az, thepeak will in general occur at some distance bx from thewanted position xo(13xi1 < Axo/2), and its height willgenerally be much less than the autocorrelation heightI (U 0 U)(O) 2 /K'. So the SNR will be decreased con-siderably, and the spatial resolution of the matchedfilter will also be decreased. On the other hand, a largermask period Ax0 means a larger area of overlapping inPm () [Eq. (4)] and therefore a smaller normalizationfactor K2 for the light efficiency [Eq. (2)]. The choiceof Ax0 determines the compromise between ij on the onehand and SNR plus resolution on the other hand.
However, if the specific application permits moving(or scanning) the phase mask with respect to the objectover the distance of one mask period in the x direction(and the y direction for 2-D masks), at some time it hitsapproximately the correct position where x0 is a mul-tiple of Ax0 , and we get the desired autocorrelation peakin the output. In this case we can choose the mask pe-riod so that 77 is very much increased almost without anydecrease of SNR.
IV. Special Phase Masks and Experimental ResultWhat should the phase mask [Eq. (3)] look like? In
the Fourier spectrum the peaks I ho(n/Axo) I [Eq. (4)]should be approximately equal in height in some fre-quency range and then drop off rapidly toward zero. Inthat case 1Pm () I will be approximately constant insome central area owing to the overlapping of the shiftedfunctions (v - n/Ax0), and outside this area 1Pm (v) Idrops off rapidly toward (approximately) zero. Herewe will show two possible phase masks that may beused.
The first phase mask consists of a staircase functionwith rectangular steps:
mN(x) = exp[27rix/(NAx)] comb(x/Ax) * rect(x/Ax).
Apart from a linear phase factor, this function has theform of Eq. (3). Its Fourier transform is
rhN(v) - comb(vAx - 1/N) sinc(vAx)
E (-I) (nN + 1)- *5(vAx - n - 1/N).n
Figure 3 shows this for N = 2. Here m 2(x) is calledphase Ronchi. l 2(v) I has two central peaks with equalheight and gets smaller toward higher spatial frequen-cies. For N > 2, the heights of the peaks are all differ-ent. So it seems that the mask m2(x) is best suited toincrease . Also its production is not too difficult asonly two different phases (0 and r) have to be imple-mented.
The second phase mask was developed by Dammannand Klotz.9 It has the form of Eq. (3) where mo(x)consists of rectangular phase functions of differentwidths and phases (0 or 7r). Its Fourier transform hasseveral peaks of equal height (up to 15 X 15 for a 2-Dmask) in the central diffraction orders, and the peakheight decreases rapidly outside this central region.
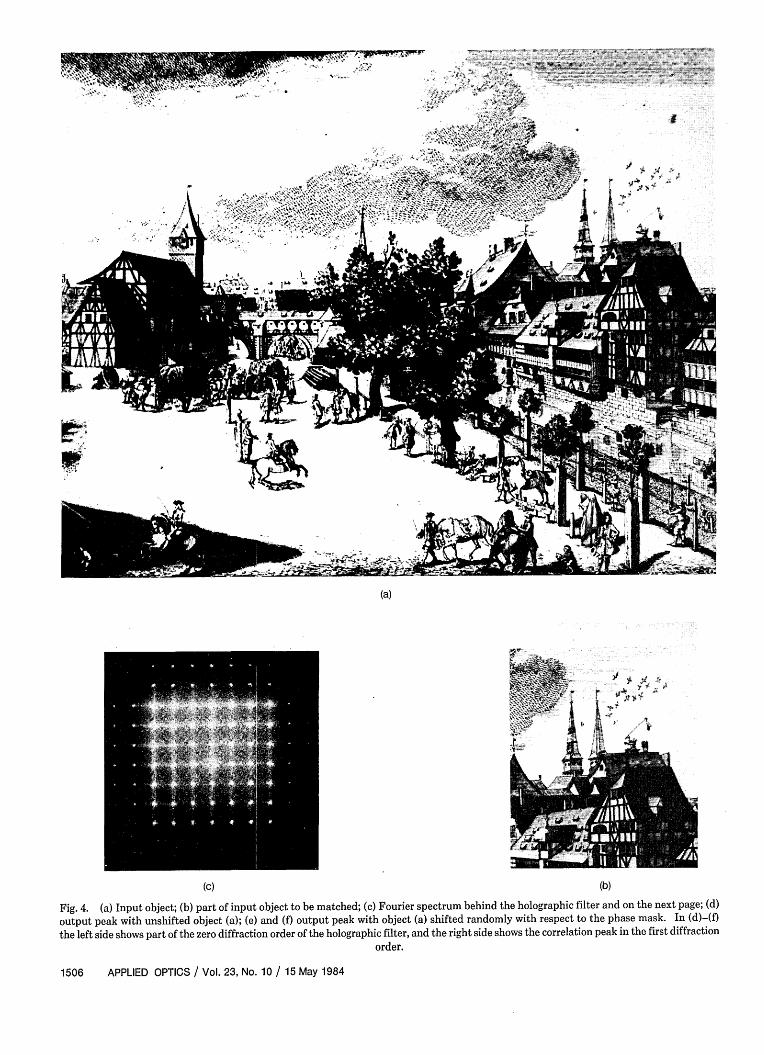
We used such a mask for a first experiment whichshows how the method can work in principle. The ho-lographic filter was matched to a certain part [Fig. 4(b)]of the whole input object [Fig. 4(a)]. The phase maskhad 7 X 7 diffraction orders of almost equal height.Figure 4(c) shows the combined spectrum of object andmask which was photographed behind the holographicfilter. The shifted object spectra overlap to a certaindegree. If the input object is unshifted with respect tothe phase mask in the matched filtering setup, we getan autocorrelation peak in the output at the location ofthe matched object and some noise at other locations[Fig. 4(d)]. But even if the input object is shifted ran-domly with respect to the phase mask, the peak in theoutput can be seen clearly in spite of the noise (Figs. 4(e)and (f)). However, the shifted object spectra did notoverlap very much here, so i7 was not increased to a largedegree.
V. Conclusion
We have shown a method to increase the light effi-ciency of the matched filter by putting a phase maskbehind the object. If the location of the input object isnot known previously, the increase of light efficiency jhas to be bought at the price of a decrease of SNR (seeRef. 3) and the spatial resolution. This difficulty maybe overcome by scanning the input mask over the dis-tance of one mask period in the x (and y) directions. Ifthe location of the input object is approximately knownwithin a small deviation range, j can be increased con-siderably ( 1) almost without any decrease of SNR.
Fig. 4. (a) Input object; (b) part of input object to be matched; (c) Fourier spectrum behind the holographic filter and on the next page; (d)
output peak with unshifted object (a); (e) and (f) output peak with object (a) shifted randomly with respect to the phase mask. In (d)-(f)
the left side shows part of the zero diffraction order of the holographic filter, and the right side shows the correlation peak in the first diffraction
-This is the case, for example, in an optical characterrecognition system where the position of the inputcharacter is known, or else the vertical y position isknown and the character is moved horizontally over allpossible x positions. According to the requirements of
previous page.
the system, the phase mask may have different periodsin the x and y directions, so that w), SNR, and spatialresolution are also different in different directions.
The problem remains of choosing an optimum phasemask. The special masks shown here have peaks of
equal height in the central part of the Fourier spectrum,but the peak intensity falls off relatively slowly towardhigher spatial frequencies. An ideal mask would havea Fourier spectrum with equally high peaks in the centerand would be zero outside. If the location of the inputobject is known, the mask need not even be periodic. Inthis case, a phase retrieval algorithm (see, e.g., Refs.10-12) might be used to construct a phase mask thatcould be optimally adapted to the problem.
The use of a phase mask can considerably improvethe light efficiency of a matched filter as an off-axishologram where only a fraction of the light goes into therelevant diffraction order. However, a phase mask mayalso be used for designing kinoform (phase-only)matched filters'3 that work on-axis and therefore havea much higher light efficiency. This implies the use ofa tandem component consisting of a phase mask behindthe object and a phase filter in the Fourier plane.14
References
1. A. B. VanderLugt, IEEE Trans. Inf. Theory IT-10, 139 (1964).2. J. L. Horner, Appl. Opt. 21, 4511 (1982).3. H. J. Caulfield, Appl. Opt. 21, 4391 (1982).4. H. Bartelt, Proc. Soc. Photo-Opt. Instrum. Eng. 437, 7 (1983).5. E. N. Leith and J. Upatnieks, J. Opt. Soc. Am. 54, 1295 (1964).6. S. Lowenthal and Y. Belvaux, C. R. Acad. Sci. Ser. B 263, 904
(1966).7. A. W. Lohmann, Appl. Opt. 7, 561 (1968).8. A. W. Lohmann and H. W. Werlich, Phys. Lett. A, 25, 570
(1967).9. H. Dammann and E. Klotz, Opt. Acta 24, 505 (1977).
10. R. W. Gerchberg and W. 0. Saxton, Optik 35, 237 (1972).11. W. J. Dallas, Optik 44, 45 (1975).12. J. R. Fienup, Opt. Lett. 3, 27 (1978).13. L. B. Lesem, P. M. Hirsch, and J. A. Jordan, Jr., IBM J. Res. Dev.
13, 150 (1969).14. H. Bartelt, "A computer generated holographic component with
optimum light efficiency," 23, 1499 (1984).
CHEISY/SEMICONDUC1ORTEOL5GY
SODIUM "POISONING" OF SEMICONDUCIORS STUDIEDResearchers in the NBS Center for Analytical Chemistry are usingthe bureau's 10 megawatt reactor to study how sodium ions cancause semiconductors to fail. Sodium can migrate in semiconduc-tors, causing bridges that "poison" the devices, rendering themineffective. Tb examine this, NBS scientists are "doping" sampleswith sodium to simulate conditions found during the manufactureand operation of semiconductors. Then using a nondestructivetechnque called neutron depth profiling (NDP), they are exposingdoped samples to a beam of neutrons from the reactor. This allowsa "map" to be made that profiles the depth distribution of sodiumin the samples. Data from the NDP research will be used bymanufacturers to design barriers for blocking sodium that will beplaced within the protective oxide coating on semiconductors. NBSalso is mapping other elements in semiconductors, such as boronand lithium.
SEMICONDUCTORTEIGY
H-P RESEARCHER JOINS PROJECT ON LINEWIDTH MEASUREM1ETA researcher from Hewlett-Packard Company has joined the NBSprogram to develop improved methods and standards for measuringlinewidths on integrated-circuit photcmasks and wafers usingscanning electron microscopes (SEMs) or electron-beam measurementsystems. As VLSI linewidths are reduced below 1 Pm, SEMs arebeing used to measure these critical dimensions. However, themeasurement theories, instrumentation, and reference standardsthat have been worked out for optical instruments do not exist forSEM and other e-beam systems. H-P physicist Dr. Steven Erasmuswill work with the NBS Semiconductor Materials and ProcessesDivision on a program to develop accurate edge-detection tech-niques; standard reference materials and procedures for thecalibration of SEM and e-beam systems; and related instrumenta-tion, including an automated SEM-based linewidth measurementsystem. This NBS Industrial Research Associate Program is expect-ed to take about two years.


![[203] Fabric Defect Detection Using Multi-level Tuned-matched Gabor Filters](https://static.documents.pub/doc/80x56/55cf9b54550346d033a5a043/203-fabric-defect-detection-using-multi-level-tuned-matched-gabor-filters.jpg)


