INCREASED SKELETAL MUSCLE AKT CONTENT IN A MURINE MODEL OF MOTOR NEURON DISEASE Lori Rose Cunningham B .Sc. (Human Kinetics), University of Guelph, 1996 THESIS SUBMITTED IN PARTIAL FULFILLMENT OF THE REQUIREMENTS FOR THE DEGREE OF MASTER OF SCIENCE In the School of Kinesiology O Lori Rose Cunningham 2005 SIMON FRASER UNIVERSITY Spring 2005 All rights reserved. This work may not be reproduced in whole or in part, by photocopy or other means, without permission of the author.
Transcript
INCREASED SKELETAL MUSCLE AKT CONTENT IN A MURINE MODEL OF MOTOR NEURON DISEASE
Lori Rose Cunningham B .Sc. (Human Kinetics), University of Guelph, 1996
THESIS SUBMITTED IN PARTIAL FULFILLMENT OF THE REQUIREMENTS FOR THE DEGREE OF
MASTER OF SCIENCE
In the School of Kinesiology
O Lori Rose Cunningham 2005
SIMON FRASER UNIVERSITY
Spring 2005
All rights reserved. This work may not be reproduced in whole or in part, by photocopy
or other means, without permission of the author.
Name:
Degree:
Title of Thesis:
Examining Committee:
APPROVAL
Lori Rose Cunningham
Master of Science
Increased Skeletal Muscle Akt Content in a Murine Model of Motor Neuron Disease
Chair: Dr. John Dickinson Professor
Dr. Wade Parkhouse Senior Supervisor Professor, School of Kinesiology
Dr. Charles Krieger Supervisor Professor, School of Kinesiology
Dr. Neil Watson External Examiner Associate Professor, Department of Psychology Simon Fraser University
Date Approved: 1 sth March 2005
SIMON FRASER UNIVERSITY
PARTIAL COPYRIGHT LICENCE
The author, whose copyright is declared on the title page of this work, has granted to Simon Fraser University the right to lend this thesis, project or extended essay to users of the Simon Fraser University Library, and to make partial or single copies only for such users or in response to a request from the library of any other university, or other educational institution, on its own behalf or for one of its users.
The author has further granted permission to Simon Fraser University to keep or make a digital copy for use in its circulating collection.
The author has further agreed that permission for multiple copying of this work for scholarly purposes may be granted by either the author or the Dean of Graduate Studies.
It is understood that copying or publication of this work for financial gain shall not be allowed without the author's written permission. \
Permission for public performance, or limited permission for private scholarly use, of any multimedia materials forming part of this work, may have been granted by the author. This information may be found on the separately catalogued multimedia material and in the signed Partial Copyright Licence.
The original Partial Copyright Licence attesting to these terms, and signed by this author, may be found in the original bound copy of this work, retained in the Simon Fraser University Archive.
W. A. C. Bennett Library Simon Fraser University
Burnaby, BC, Canada
ABSTRACT
Potential alterations in the skeletal muscle P13-WAkt pathway were examined in
a murine model of ALS, due to its documented role in maintaining muscle mass andlor
ameliorating apoptosis. Hindlimb muscle from G93A mice was examined at various
stages of disease progression and compared to age-matched wild-type controls. Akt and
phospho-Akt increased significantly with disease progression but these elevations were
not accompanied by alterations in downstream proteins such as p70s6K or BAD. These
findings suggest a potential role of Akt in muscle undergoing progressive denervation. I
further determined whether the increase in Akt was localized to innervated or denervated
muscle cells. Akt-irnmunofluorescence was localized primarily to cells staining positive
for neural cell adhesion molecule (NCAM), a marker of skeletal muscle denervation.
These localized elevations in Akt may reflect compensatory changes occurring in muscle
in response to denervation, potentially in an attempt to maintain muscle mass or
alternately, to promote cell survival.
ACKNOWLEDGEMENTS
I would like to thank my supervisory committee, Dr. Wade Parkhouse and Dr.
Charles Krieger, for the guidance and support they offered throughout the course of my
graduate work at SFU. I would especially like to thank my senior supervisor, Wade
Parkhouse, for giving me the opportunity to work towards a thesis I am extremely proud
of. You have been an incredible supervisor, educator and mentor. I would like to extend
my gratitude to both the staff at the Animal Care Facility and the Kinesiology Main
Office - your efforts are much appreciated. I am also grateful to the Michael Smith
Foundation for Health Research for their contributions to the funding required to
undertake this project.
To all of the friends I have made during my time here at SFU - your assistance
with lab work, the coffee breaks at Renaissance, the one-on-one chats and the endless
laughs will never be forgotten. You have all made this roller coaster ride a memorable
one. My deepest thanks and love to my family as well, especially my parents, who have
always supported me in any direction I have chosen to go in life.
Finally, to Darren, my husband and best friend, whose never-ending love, support
and understanding have helped me get through all the ups and downs of this journey.. .
Acknowledgements .......................................................................................................... iv
Table of Contents ............................................................................................................... v . .
List of Figures .................................................................................................................. vii ...
List of Tables .................................................................................................................. vlll
Chapter 1: Review of Literature ...................................................................................... 1 ..................................................................................................... Introduction 1
................ Amyotrophic Lateral Sclerosis & Skeletal Muscle: An Overview 2 What is ALS? ............................................................................................... 2
.......................................................... G93A Murine Model of Human ALS 4 Neurodegeneration and Skeletal Muscle ..................................................... 5 NCAM as a Marker of Skeletal Muscle Denervation .................................. 8
P13-WAkt Pathway ........................................................................................ -9 P13-WAkt Signalling ................................................................................... 9 Akt and p70s6K - Protein Synthesis and Hypertrophy .............................. 12
..................................................................... Akt and BAD - Cell Survival 14 ................................................. P13-WAkt and Neurodegenerative Disease 1 8
................................................................... P13-WAkt and Neural Tissue -18 ............................................................................... P13-WAkt and Muscle 22
Chapter 2: Increased Skeletal Muscle Akt Content in a Murine Model of ................................................................................. Motor Neuron Disease 27
..................................................................................... 2.1 Justification of Study 27 ....................................................................................................... 2.2 Rationale -28
............................................................................ 2.3 Objectives and Hypotheses 29 ......................................................................................................... 2.4 Methods 30
...................................................................................................... 2.4.1 Animals 30 2.4.2 Determination of Animal Genotype .......................................................... 31 2.4.3 Determination of Symptomatology ........................................................... 33
.............................................................. 2.4.4 Western Blot Analysis of Protein 33 2.4.5 Immunohistochemical Analysis ................................................................ 37
............................................................................................. 2.4.6 Data Analysis 41 ........................................................................................................... 2.5 Results 42
...................................................................................................... 2.5.1 Animals 42 2.5.2 Western Blot Analysis of Protein .............................................................. 43
Table 2 Mouse Characteristics: G93A vs. age-matched wild-type control mice. Values are reported as means + SE ...................................................... 72
Table 3 NCAM Expression: Wild-type controls vs. G93A mice. Values are .................................................................................. reported as means + SE 73
CHAPTER 1: REVIEW OF LITERATURE
1 . Introduction
Neurodegenerative diseases such as amyotrophic lateral sclerosis (ALS) are
characterized by a progressive loss of motor neurons in not only the brain (upper motor
neurons) and spinal cord (lower motor neurons), but by the occurrence of axonal
degeneration in peripheral tissues as well. The skeletal muscle supplied by the
degenerating motor neuron thus becomes progressively denervated, resulting in ongoing
muscle atrophy and weakness leading to paralysis and eventual death.
Much of the research on ALS has focused on alterations occurring within neural
tissue, with interest surrounding the roles of protein and lipid kinases in the pathogenesis
of the disease itself. Neural tissue of ALS patients demonstrates abnormalities in the
activities and levels of certain kinases within the CNS. These alterations are thought to
negatively affect intracellular signalling and functioning of the cell. Specifically,
increased expression and activity of phosphatidylinositol3-base (PI3-K) has been
shown to occur in spinal cord fractions of ALS patients without a concurrent increase in
peptides found downstream in this cascade. These findings could indicate an impairment
in the mechanisms involved in P13-K signalling within degenerating neurons.
The P13-K pathway exists ubiquitously in various tissues and is known to play
major roles in skeletal muscle with respect to processes such as myocyte proliferation 1
differentiation, protein synthesis and cell survival. As the PI3-K pathway has been
shown to be altered in degenerating neural tissue, the possibility exists that the same
1
cascade could be similarly affected within the compromised skeletal muscle itself. While
perturbations in normal signalling could reflect impairment within the muscle, increases
in protein content and/or activity could instead reflect a compensatory mechanism within
the skeletal muscle to reduce the loss of muscle mass associated with denervation, and/or
alternately, to promote cell survival for either the muscle itself or potentially the neuron
as well.
The development of animal models reflective of neuromuscular disorders such as
ALS, affords a unique opportunity to study adaptations occurring in skeletal muscle as a
consequence of progressive, long-term denervation.
1.2 Amyotrophic Lateral Sclerosis & Skeletal Muscle: An Overview
1.2.1 What is ALS?
Amyotrophic lateral sclerosis (ALS), also known as Lou Gherig's Disease, is a
neurodegenerative disease characterized by degeneration of upper and lower motor
neurons as well as corticospinal tract neurons. Mean age of onset is usually between 54-
58 years of age, and progression of the disease is manifested in skeletal muscle atrophy
and weakness as a result of continual axonal degeneration and denervation of the muscle.
Early symptoms can include muscle twitching or cramping, slurred speech and mild
dysphagia, with heightened symptomatology occurring over time. Indicators of upper
motor neuron damage include muscle spasticity, abnormal plantar reflexes and
hyperreflexia; fasciculations, muscle cramping, weakness and atrophy occur in response
to deficits in lower motor neuron functionality (Appel et al., 2001, Guegan and
Przedborski, 2003). Ultimate failure in respiratory function often results in death within
5 years of onset of the disease (Menzies et al., 2002, Simpson et al., 2002).
Approximately 90-95% of ALS cases are represented by a sporadic form of the disease
(sALS). The remaining 510% involve genetic inheritance and is so referred to as the
familial form (fALS) (Appel et al., 2001, Guegan and Przedborski, 2003). While the
acquisition of the two forms of the disease may differ, clinical and pathological aspects of
both sALS and fALS are very similar, indicating the possibility of a shared
pathophysiological mechanism (Mulder, 1982, Simpson et al., 2002).
The mechanism of injury remains unclear, however there are various proposed
theories including glutamate toxicity, protein aggregation, de-regulation of apoptotic
cascades, and mitochondria1 dysfunction (Brown, 1995, Appel et al., 2001, Simpson et
al., 2002, Guegan and Przedborski, 2003). A significant finding with respect to the
pathogenesis of the disease showed that approximately 20-30% of patients diagnosed
with fALS possessed point mutations within the SODl gene (CuIZn superoxide
dismutase) (Rosen et al., 1993). Superoxide dismutase (encoded for by the SOD gene)
predominantly functions by catalyzing 2 main reactions: 1) as its name implies, it has a
major role in dismutation (02'- + 0 2 ' - + H202), and 2) production of hydroxyl radicals
(.OH) via the use of anionic scavengers, as well as H202. Findings have demonstrated
that of the two reactions, the production of hydroxyl radicals (a highly reactive species of
oxygen-free radicals) is increased significantly in fALS individuals via the mutated
SODl gene. In addition to other theories, this increase in free-radical production implies
potential involvement of oxidative stress in the pathogenetic mechanism of ALS (Yim et
al., 1996). These findings, as well as others (Gurney et al., 1994, Brown, 1995) suggest
that the SODl mutations result in a detrimental "gain-of-function" ultimately
contributing to the neurodegeneration characteristic of ALS.
The processes thought to be involved in the pathophysiology of ALS are
intriguing in that they appear to be highly intertwined, and it is quite likely that the
varying theorized mechanisms underlying disease progression should not be considered
independently, but rather as acting synergistically to cumulatively attack motor neurons
and other target tissues, such as skeletal muscle (Simpson et a]., 2002).
1.2.2 G93A Murine Model of Human ALS
The discovery of genetic mutations within a subset of ALS patients has aided in
the development of transgenic mice which exhibit similar disease progression to human
ALS cases. One example is the G93A SODl mouse which was generated to over-
express a mutant form of the human SODl gene. It possesses a glycine93jalanine
amino acid substitution, a mutation thought to exert its effects via a toxic "gain of
function" rather than a loss of function (Gurney et al., 1994). Clinical symptomatology
typically develops at approximately 90 days of age, as evidenced by slight tremors in at
least one limb. Animal weight tends to remain comparable to non-transgenic littermates
until approximately 75 days of age, at which point they exhibit a decline in rate of
growth. With disease progression, the tremor worsens and mice develop muscle
weakness and atrophy (primarily in the hindlimbs), with eventual paralysis occurring at
end-stage of the disease (approximately 140 days) (Chiu et al., 1995, Guegan and
Przedborski, 2003). At end-stage, G93A mice show a large decrease in the number of
motor neurons, resulting in denervation of skeletal muscle and eventually diaphragm
(Chiu et al., 1995). As this symptomatology is characteristic of motor neuron diseases
such as ALS, the G93A transgenic mouse is now commonly utilized as a model in
studying the pathology of human ALS.
1.2.3 Neurodegeneration and Skeletal Muscle
1.2.3.1 The Denervation Process
In the pathogenesis of ALS, anterior horn cells and their associated motor neurons
degenerate, causing the myofibres supplied by the motor-neuron to become gradually
denervated. The remaining intact motor nerve terminals at the neuromuscular junction
will begin to "sprout" (Brown et al., 1981, Frey et a]., 2000, Millecamps et al., 2001) in
response to terminal Schwann cell "bridges" being constructed between the innervated
and denervated motor endplates (Kang et al., 2003, Love et al., 2003) The process of
axonal sprouting occurs in an attempt to re-innervate the already denervated myofibres,
thereby maintaining functionality of the damaged muscle. Partial denervation studies
have shown that axonal sprouting can compensate for a loss of up to approximately 85%
of the healthy motor neuron pool (Gordon et al., 2004). However, the continual loss of
functional motor neurons and motor units ultimately impedes the capacity to sprout,
resulting in extreme muscle denervation (Chiu et al., 1995, Gordon et al., 2004). In
addition, it is possible that the growing and sprouting of remaining neurons might place
an even higher demand on the healthy motor unit, thereby essentially overworking it and
potentiating the degeneration at a more rapid rate (Pachter and Eberstein, 1992,
McComas, 1998, Kang et al., 2003).
Findings from human ALS studies that have examined motor neuron degeneration
have indicated preferential degeneration of larger, fast type-motor neurons (Theys et al.,
1999), with corroborative animal experiments showing selective vulnerability of synapses
5
associated with fast-twitch, type I1 muscle fibres (Frey et al., 2000). Loss of
neuromuscular synapses has been found to occur very early in the progression of the
disease, with myofibre denervation being observed as early as 47 (Fischer et al., 2004)
and 50 days of age (Frey et al., 2000). However, further examination of
innervationldenervation patterns via the use of multiple animal models (including the
G93A mouse) demonstrate that early denervation of muscle occurs primarily in type IIb
(fast-fatigable) fibres (Frey et al., 2000). Notably, when examining axonal sprouting
capabilities between synapse sub-types, findings from the same study indicate that
synapses coupled to type I1 fibres are not only vulnerable to neuronal degeneration, but
are unable to effectively sprout. However, synapses associated with slow-twitch, type I
fibres were shown to possess pronounced sprouting capabilities and were much more
resilient to denervation, with significant denervation in the primarily slow-twitch soleus
muscle not being observed until 120 days of age (Frey et al., 2000). Overall, it appears as
though a relative "sparing effect" exists in those motor neurons and muscle fibres with
higher capacities to buffer products of oxidative stress, in comparison to motor units that
are less robust to such an environment. Taken together, these findings again substantiate
oxidative stress theories with respect to the pathogenesis of ALS.
1.2.3.2 Denervation and Skeletal Muscle
Maintenance of muscle mass requires a balance between protein synthetic and
protein degradation pathways. Disuse-atrophy, induced by denervation, occurs due to
decreases in protein synthesis with concurrent increases in protein degradation
(Goldberg, 1969, Jackrnan and Kandarian, 2004). While atrophy is characterized by a
decrease in protein content and muscle fibre size (Jackrnan and Kandarian, 2004,
Sartorelli and Fulco, 2004), the lack of neural input consequent of ongoing denervation
also results in structural and functional alterations within the skeletal muscle. Decreases
in mean fibre area, the occurrence of angulated myofibres, and increased adipocyte and
collagen content have been observed in the presence of significant whole muscle atrophy
(Pachter and Eberstein, 1992, Kern et al., 2004). Ultrastructural changes that accompany
post-denervation atrophy include early loss of myofibril alignment, disruption of
sarcomeres through both disarrangement and loss of myosin and actin filaments, and
progressive loss of mitochondria (Schmalbruch and Lewis, 1994, Borisov et al., 2001).
Initiation of myogenic processes via satellite cell proliferation and differentiation
occurs in response to both short term and long-term denervation. Literature shows that
muscle atrophy resulting from cell degeneration and death stimulates the replacement of
dead cells with new myofibres via a myogenic repair response (Schmalbruch and Lewis,
1994, Borisov et al., 2001). However, further research also shows evidence of an early
myogenic response whereby it is thought that myogenesis occurs as a direct result of
denervation-induced loss of neural signalling to the muscle as a whole, prior to
appearance of any tissue loss (Borisov et al., 2001). While the regeneration of muscle
fibres is able to occur without intact innervation, denervated myofibres are not able to
survive without neural signalling. Therefore, in the context of long-term progressive
denervation, continual degenerative and regenerative cycles ultimately deplete satellite
cell pools and impede the reparative myogenic processes (Schmalbruch and Lewis,
1994). The ongoing atrophy that occurs as a result, in part by protein degradation, is
further exacerbated by the consequential shift toward cell death over regeneration,
thereby contributing to the overall muscle wasting that is characteristic to neuromuscular
diseases such as ALS.
1.2.4 NCAM as a Marker of Skeletal Muscle Denervation
In addition to histopathological changes, denervation will also result in
biochemical changes within the neuromuscular junction and muscle itself, including
alterations in myofibre surface proteins. Neural cell adhesion molecule (NCAM), a cell
membrane glycoprotein, was originally discovered for its role in communication and
interactions within the nervous system [(Brackenbury et al., 1977) as cited in (Gosztonyi
et al., 2001)l. Since then, it has been found to be present on the cell surface of embryonic
myotubes, with its disappearance occurring within 2 weeks after birth (Covault and
Sanes, 1985). This progressive loss of NCAM results in its absence from the sarcolemma
in adult myofibres (Covault and Sanes, 1985, Gosztonyi et al., 2001), at which point it
has been shown to become concentrated at the neuromuscular junction (Rieger et al.,
1985, Covault and Sanes, 1986, Moscoso et al., 1995). Findings from in situ
hybridization studies have supported these findings by showing selective expression of
NCAM mRNA at synaptic sites in adult mouse and rat muscle (Moscoso et al., 1995),
with a wider distribution of mRNA being observed in embryonic mouse skeletal muscle
[(Lyons et al., 1992) as cited in (Moscoso et al., 1995)l.
The involvement of NCAM in both nervous tissue and muscle led to a study that
examined the effects of denervation on muscle NCAM appearance (Covault and Sanes,
1985). Both animal experiments (Covault and Sanes, 1985, Tews et al., 1997b) and
human studies (Cashman et al., 1987, Figarella-Branger et al., 1990, Gosztonyi et al.,
2001) have consistently demonstrated a re-appearance of NCAM at extra-synaptic
muscular sites in denervated myofibres, with immunostaining occurring around the cell
membrane in most cases, but also appearing intracellularly in some muscle cells. Further
studies reveal that at the onset of re-innervation, NCAM remains accumulated at extra-
synaptic sites. However, upon completion of the re-innervation process, NCAM
disappears from the cell surface once again (Covault and Sanes, 1985, Tews et al., 1997b,
Gosztonyi et al., 2001). Taken together, these findings suggest that NCAM acts as a
mediator between muscle and nerve in an attempt to regulate the re-innervation process
(Covault & Sanes, 1985; Cashman et al., 1987).
The comparability between studies with respect to the accumulation patterns of
NCAM has resulted in its common use as a marker of skeletal muscle denervation in a
variety of studies (Hayatsu and De Deyne, 2001, Urbanchek et al., 2001, Kalliainen et al.,
2002).
1.3 PI3-KIAkt Pathway
1.3.1 PI3-WAkt Signalling
The heterodimer phosphatidylinositol-3-kinase (PI3-K) is a lipid / protein serine
kinase consisting of an 85 kDa regulatory subunit and a 110 kDa catalytic subunit
(Scheid and Woodgett, 2001). This enzyme has been shown to be activated by numerous
anabolic agents and growth factors including insulin, insulin-like growth factor 1 (IGF-1)
(Wagey et al., 1998, Glass, 2003b), nerve-growth factor (NGF) (Crowder and Freeman,
1998), and vascular endothelial growth factor (VEGF) (Li et al., 2003a). For example,
binding of a survival factor such as IGF-1 to its cell surface receptor results in a
conformational change in the IGF-1 receptor tyrosine kinase, resulting not only in auto-
phosphorylation, but subsequent phosphorylation of insulin receptor substrate 1 (IRS-I).
The IRS-1 protein then binds to the regulatory subunit of P13-K, resulting in activation of
the enzyme [(Kapeller and Cantley, 1994) as cited in (Wagey et al., 1998)l (Glass,
2003b). Activated P13-K phosphorylates the membrane-phospholipid
phosphatidylinosital-4,5-biphosphate (PtdIns-4,5-P2), generating the lipid product
phosphatidylinositol-3,4,5-triphosphate (PtdIns-3,4,5-P3) which is then further converted
by phosphatases to phosphatidylinositol-3,4-biphosphate (PtdIns-3,4-P2) (Woscholski and
Parker, 1997). These products act as binding sites for various kinases downstream in the
signalling cascade, including the serinelthreonine protein kinase B (PKB), also known as
Akt (Burgering and Coffer, 1995, Glass, 2003a) (Figure 1).
Akt, the cellular homologue of the transforming oncogene of the Akt8 retrovirus,
was first discovered as a kinase displaying similarities to both protein kinase A (PKA)
and protein kinase C (PKC), thereby resulting in the name PKB (Toker, 2000, Scheid and
Woodgett, 2001). There are three isoforms of Akt - PKBodAktl, PKBplAkt2 and
PKBylAkt3 - all very similar in structure, size and regulatory mechanisms (Alessi and
Cohen, 1998, Scheid and Woodgett, 2001). The amino-terminal end of Akt contains a
pleckstrin homology (PH) domain which has been shown to be important for its
activation (Downward, 1998), specifically by acting as the binding site for the lipid
products of PI3-K mentioned previously (James et al., 1996, Franke et al., 1997,
Downward, 1998). Through binding to PtdIns-3,4,5-P3 and PtdIns-3,4-P2, Akt is
translocated to the plasma membrane (Andjelkovic et al., 1997) where it becomes
activated by PtdIns-3,4,5-P3 -dependent kinases PDKl and PDK2, via phosphorylation of
two residues - Thr308 (PDKl) and Ser473 (PDK2) (Alessi et al., 1996, Downward,
1998).
The phosphorylation of both Thr308 (located in the b a s e activation loop) and
Ser473 (located in the hydrophobic region) is needed for complete activation of Akt
(Toker, 2000). However, the mechanism of activation is not yet fully understood,
primarily due to contrasting findings with respect to the means of Ser473
phosphorylation. It has been shown that the use of a broad-spectrum kinase inhibitor
(staurosporine) to block PDKl activity prevents Thr308 phosphorylation exclusively,
without any effect on Ser473 phosphorylation (Hill et al., 2001), suggesting the existence
of a unique kinase involved in the phosphorylation of Ser473 (PDK2). However, other
studies have shown that kinase-inactive Akt can become phosphorylated at Thr308 but
not at Ser473, with further in vitro and in vivo experiments indicating that
phosphorylation of Thr308 actually triggers the auto-phosphorylation of Ser473 (Toker
and Newton, 2000). In contradiction to the PDK2 theory of Ser473 phosphorylation,
these findings suggest that Ser473 is instead auto-phosphorylated once Akt has been
initially activated by PDK1-mediated phosphorylation at Thr308, resulting in a fully
active Akt (Scheid and Woodgett, 2001).
Akt has been implicated as a major downstream effector in the P13-K signalling
pathway and, once activated, can result in phosphorylation of various substrates, thereby
resulting in biological events such as protein synthesis, cell survival, glucose metabolism
and cell cycle regulation (Downward, 1998, Kandel and Hay, 1999, Toker, 2000) (Figure
1). The remainder of this literature review will deal primarily with the consequences of
Akt activation on pathways involved with protein synthesis and cell survival.
1.3.2 Akt and p70s6K - Protein Synthesis and Hypertrophy
Studies have shown that induction of a constitutively-active form of Akt (c.a.-
Akt), either via muscle transfection (Pallafacchina et al., 2002) or transgenic adaptation
(Lai et al., 2004) results in muscle hypertrophy in vivo, with an average of a more than 2-
fold increase seen muscle fibre diameter in Akt-treated cells versus control fibres. These
studies strongly suggest the involvement of downstream-signalling molecules in the Akt
pathway with respect to muscle hypertrophy. Additional c.a.-Akt experiments identify a
possible down-stream effector as p70s6 kinase (p70s6K), by showing that increased
levels of Akt activity resulted in concurrent increases in phosphorylation and activity of
p70s6K (Burgering and Coffer, 1995).
Activation of p70s6K contributes to protein synthetic pathways via up-regulation
of specific components of the translation process. A number of phosphorylation sites
have been identified within multiple functional domains in p70s6K. Phosphorylation of
residues such as T421 and S424, contained in the autoinhibitory domain, are required for
sequential phosphorylation of T389 and T229, two key residues involved in complete
activation of p70s6K (Jefferies et al., 1997, Pullen and Thomas, 1997). Activated
p70s6K then functions to phosphorylate multiple serine residues on the 40s ribosomal
protein, S6. The activated S6 protein stimulates the translation of a specific group of
mRNAs - the 5' TOP (terminal oligopyrimidine tract) mRNAs (Jefferies et al., 1997).
These mRNAs primarily encode for ribosomal proteins and components of the
translational machinery (Alessi and Cohen, 1998, Schmelzle and Hall, 2000). Further
examination of the regulation of 5' TOP mRNA translation led to the finding that
treatment of mammalian cells with rapamycin, a blocker of mTOR (mammalian target of
rapamycin), not only suppressed translation of 5' TOP rnRNAs, but also blocked the
activation and phosphorylation of p70s6K at T2291T389 (Jefferies et al., 1997),
implicating mTOR as an upstream modulator of p70s6K. Importantly, where T389 itself
is mitogen-activated, mTOR exerts its effects via mediating the interaction between the
autoinhibitory domain (T421lS424) and T389. mTOR is therefore required to relieve
T389 inhibition prior to its phosphorylation and full activation of p70s6K (Pullen and
Thomas, 1997). Compensatory hypertrophy experiments expanded upon these findings
by demonstrating, in vivo, that treatment with rapamycin not only resulted in a 95%
blockage of hypertrophy, but also prevented phosphorylation and activation of p70s6K
(Bodine et al., 2001). Taken together, these studies suggest a protein synthetic pathway
whereby Akt activates p70s6K via mTOR. Evidence that Akt directly phosphorylates
mTOR [(Scott et al., 1998, Nave et al., 1999) as reviewed in (Shah et al., 2000)l offers
additional support to this theory.
Detailed in vitro and in vivo experiments have contributed to findings implicating
the Akt/mTORlp70s6K signalling cascade as an important and necessary pathway for
protein synthesis and hypertrophy. Induction of myotube hypertrophy via IGF-1
occurred in conjunction with phosphorylation and activation of Akt and downstream
targets including p70s6K (Rommel et al., 2001). Inhibiting the pathway at the level of
PI3-K resulted in a complete blockage of not only Akt activation, but also the IGF-1
induced hypertrophy, suggesting a necessity of the P13-KlAkt pathway for growth factor-
mediated hypertrophy. Additionally, treatment with rapamycin not only blocked p70s6K
activation, but also diminished the hypertrophic response, implicating mTORIp70s6K
signalling to be an important downstream event as well. Incorporation of constitutively
active Akt and p70s6K confirmed these findings by demonstrating that both were
sufficient to cause hypertrophy in the myotubes. However increases due to p70s6K were
less pronounced than those of Akt, indicating involvement of an alternate downstream
effector of Akt.
These findings are substantiated with in vivo studies, demonstrating that Akt
content and phosphorylation levels, as well as p70s6K phosphorylation, are increased
during compensatory hypertrophy. Furthermore, inhibition of mTOR resulted in a
complete blockage of p70s6K phosphorylation in conjunction with a prevention of
hypertrophy (Bodine et al., 2001). Atrophy resulting from hindlimb suspension
correlated with decreases in Akt protein content/phosphorylation, as well as downstream
decreases in p70s6K phosphorylation; activation of Akt and p70s6K were recovered upon
muscle re-loading. Again, treatment with rapamycin (mTOR inhibitor) effectively
blocked muscle growth from occumng during suspension recovery (Bodine et al., 2001).
Taken together, these findings suggest that hypertrophic adaptations are not only
mediated by, but are regulated by the Akt/mTOR pathway, and specifically its
downstream targets of protein synthesis such as p70s6K (Glass, 2003a).
1.3.3 Akt and BAD - Cell Survival
1.3.3.1 Apoptosis - Programmed Cell Death
The balance between cell death and survival is partially governed by apoptosis,
the process of programmed cell death. Cells that are injured or no longer functionally
necessary, activate mechanisms to self-destroy in a manner that will be most energy-
efficient for the organism, thereby retaining the chemical components of the dying cell
(Alberts, 1994). The process is characterized by morphological and biochemical changes
distinct from those exhibited by necrotic cells. Morphological features include cell
shrinkage, alteration of membrane phospholipids, chromatin condensation and membrane
Additionally, with respect to only the G93A mice, the levels of Akt in both the SS and ES
groups were significantly higher than in the PS group (p < 0.05), indicating that Akt
content becomes elevated with ongoing disease progression No significant differences
were observed between W/T groups.
Analysis of p-Akt levels indicated a non-significant interaction effect between
mouse type and symptomatology (p = 0.0606). Comparative blots and graphs for p-Akt
values are shown in Figure 3. Individual differences among groups were similar to
patterns seen with Akt. No significant difference was observed between the PS group
and its age-matched WEps. Levels of p-Akt in SO (0.92 + 0.19 AU), SS (2.03 + 0.37
AU) and ES (2.12 + 0.23 AU) were significantly higher than respective W/T groups
(W/Tso 0.23 + 0.05; W/Tss 0.26 + 0.04; WITEs 0.29 + 0.08 AU) (p 5 0.05). Both SS and
ES groups also showed significant differences from the PS group (p 5 0.05), and no
significant differences in p-Akt were observed between W/T groups.
2.5.2.3 p70s6K and p-p70s6K
As can be seen in Figures 4 and 5, no significant differences in either p70s6K or
p-p70s6K levels were observed between the G93A groups and their age-matched
controls, and no differences were seen across symptomatology in the G93A mice or
across W/T groups. Additionally, no interaction effect between mouse type and
symptomatology was observed.
2.5.2.4 BAD and p-BAD
Upon collection and analysis of preliminary data for BAD and p-BAD (n = 2-4
per group: PS, SO, SS, ES, and age-matched W/T), no significant differences were seen
between W/T samples and either BAD or p-BAD. Therefore, no further data was
collected or analyzed with respect to these proteins (Appendix B).
2.5.3 Immunohistochemistry
2.5.3.1 NCAM as a Marker of Denervation
Table 3 demonstrates changes in NCAM appearance with disease progression in
the G93A mice. Stage of symptomatology of the mice was found to significantly affect
the mean percentage of NCAM positive muscle fibres present (p < 0.001). As can be
seen in Figure 6, NCAM immunofluorescence was primarily restricted to the
neuromuscular junction in W/T animals (Figures 6A-C) with similar staining patterns in
pre-symptomatic G93A mice (Figures 6D-F). However, severely symptomatic mice
exhibited extensive levels of NCAM imrnunoreactivity, with the majority of cells
labelling positively for NCAM around most or all of the cell membrane (Figures 6G-I).
Specifically, a significant difference in the percentage of NCAM was found between the
W/T group (4 2 1%) and both SS (44 + 10%) and ES groups (26 + 6%) (p < 0.001).
While no significant difference was found between W/T and either the PS (8 + 3%) or SO
(12 + 2%) groups, the difference between W/T and SO groups did result in a p-value of
0.053. Additionally, the mean percentage of SS fibres that were NCAM positive was
significantly different than that of the PS group (p < 0.05).
Representative images of cells with low, moderate and extensive NCAM
immunoreactivity are demonstrated in Figure 7. While NCAM positive cells in PS and
SO groups appeared to consist of a relatively even distribution of all three levels of
NCAM, NCAM labelling in W/T tissue was comprised primarily of low levels of NCAM
immunofluorescence (75% of NCAM positive fibres), with no extensive labelling being
present at all (Table 3). However, out of the 44 + 10% of total fibres considered to be
NCAM positive in the SS group, 28 + 7% (64% of NCAM positive fibres) were
classified as extensive, with only 5 + 2% and 11 + 3% categorized as low and moderate
respectively. This trend tends to be observed in the ES group as well, although not to the
same extent, whereby 14 + 6% of total fibres were scored as extensively labelled (54% of
NCAM positive cells), with low NCAM in 5 + 2% of fibres and moderate levels of
NCAM in 7 + 1 fibres.
2.5.3.2 Akt and NCAM
As shown in Figure 8, observation of Akt sections suggested varying levels of Akt
immunofluorescence, potentially indicating differential levels of Akt protein. Cells were
therefore categorized as previously discussed in the Methodology section. Findings from
Akt and NCAM double and single-labelling experiments suggest that while increased
levels of intracellular Akt immunoreactivity are occurring in both NCAM positive
(denervated) and NCAM negative (innervated) cells, the elevated intensities are observed
predominantly in areas with a high concentration of denervated cells (Figure 9). The
graph shown in Figure 10 reveals the percentages of weak, moderate and strong Akt
immunofluorescence within NCAM positive (NCAM+) and NCAM negative (NCAM-)
cells. Findings suggest that of those cells determined to be positive for weak levels of
intracellular Akt immunofluorescence, 49% were NCAM+, while the remaining 51 %
were NCAM-, suggesting no difference in Akt content between innervated (NCAM-) and
denervated (NC AM+) cells. However, when examining proportions of both NC AM
positive and negative cells, almost 2x more NCAM+ (41.4%) than NCAM- cells (23.3%)
were immunolabelled for Akt. Additionally, myofibres with moderate and strong Akt
immunofluorescence were predominantly categorized as denervated cells, with 59% and
73% of these cells respectively, also staining positive for NCAM. At these intensities of
Akt, a 3-fold (8.1% vs. 3.0%) and 5-fold (8.1% vs. 1.6%) difference was observed when
comparing proportions of total NCAM+ and NCAM- cells exhibiting Akt signal.
Analysis via Chi-square for linearity found a significant association (p < 0.05)
between Akt intensity and NCAM immunoreactivity of the cell, which supports findings
indicating that increasing intensity of Akt immunofluorescence becomes progressively
constricted to denervated (NCAM+) cells.
Examination of Akt distribution within NCAM+ cells clearly suggests that Akt is
predominantly observed in cells with extensive NCAM labelling, independent of
intensity of Akt. Specifically, 63% (weak), 69% (moderate) and 75% (strong) of
Akt+/NCAM+ cells were extensively labelled for NCAM. Of the remaining
Akt+/NCAM+ cells, only 10-12% was classified as having low NCAM and 10-24%
showed moderate levels of NCAM (Figure 11).
2.6 Discussion
Akt and phospho-Akt are elevated in G93A mice
Alterations in protein kinase signalling have been shown to play roles in the
neurodegeneration associated with diseases such as amyotrophic lateral sclerosis (ALS).
Specifically, perturbations have been seen in the P13-K pathway in neural tissue of both
human and murine models of ALS (Wagey et al., 1998, Hu et al., 2003a, Hu et al.,
2003b). The severe and progressive muscle wasting resulting from ongoing denervation
is a key clinical feature of ALS, yet very few studies have examined biochemical or
molecular changes occurring within the muscle itself. It is possible that intracellular
signalling in the compromised skeletal muscle could reflect similar alterations to those
occurring in nervous tissue. I therefore chose to examine skeletal muscle from a murine
model of progressive denervation to determine if signalling proteins downstream of PI3-
K were affected in the diseased muscle.
As hypothesized, a significant up-regulation of Akt was found in the skeletal
muscle of G93A mice (Figures 2 and 3). At symptom onset, throughout severe
symptomatology and at end-stage, levels of both Akt protein and its phosphorylated form
were significantly higher in G93A mice than values observed in age-matched wild-type
controls. P13-KIAkt signalling has been shown to be involved in multiple cellular
functions, including muscle growth and cell survival and it is possible that these changes
in Akt may reflect an attempt by the muscle to target downstream effectors responsible
for these functions.
The observed increases in Akt and phospho-Akt appear in conjunction with
disease progression in the G93A mice. Content of Akt and phospho-Akt are comparable
to levels observed in WIT animals until symptom onset is observed. The lack of
elevation in Akt prior to any symptomatology suggests that abnormal levels of Akt are
not responsible for triggering disease progression. Although levels of both Akt and
phospho-Akt show a gradual increase as symptomatology progresses, no significant
differences were observed from pre-symptomatic animals until mice became severely
affected. This dramatic elevation in Akt coincides with significant increases in
denervation, suggesting that the muscle may be up-regulating Akt in response to
continual denervation. Additionally, significant soleus atrophy was not observed until
end-stage of the disease, where a plateau effect is seen in both Akt and phospho-Akt.
These events coincide with a decline in the number of denervated cells, as indicated by
decreases in end-stage myofibre NCAM. This reduction in the number of NCAM
positive fibres could reflect a "dying off' of cells that have become chronically
denervated, thereby contributing to the significant atrophy observed. Together, these
findings could imply functionality with regard to Akt elevations, such that the rise in Akt
may contribute to maintenance of muscle mass until the point where excessive
denervation and resultant myofibre death overpowers its function; Akt content and
phosphorylation then begin to plateau as the mass of the increasingly atrophic muscle is
unable to be maintained.
The elevation in phosphorylated Akt implies that factors upstream in the
signalling cascade may be altered as well. Significant increases in P13-K activity have
been found in short-term denervated rat hind limb (Bertelli et al., 2003). Various trophic
factors have also been shown to be elevated in muscle in a number of models of
denervation. Nerve crush experiments demonstrated increases in IGF-I / I1 mRNA in
denervated rat gastrocnemius when compared to contra-lateral intact muscle (Glazner and
Ishii, 1995). Elevated levels of a number of neurotrophins have been observed in muscle
biopsies and post-mortem tissue of patients with ALS (Stuerenburg and Kunze, 1998,
Kust et al., 2002) and in situ experiments were able to confirm that the muscle fibres
themselves were the source of the trophic elevations (Kust et al., 2002). An up-
regulation of local growth factors such as IGF-1, resultant from the progressive
denervation, could be responsible for triggering the P13-K signalling cascade, thereby
targeting Akt. However, Bertelli and colleagues (2003) found that phosphorylated levels
of Akt were reduced in the denervated muscle when compared to control tissue, even
with increased P13-K activation. Other experiments also revealed decreased Akt protein
and phosphorylation content in denervated rat hind limb, versus sham-operated controls
(Wilkes and Bonen, 2000). These results appear to contradict our current findings, but
differences could exist due to different models of denervation. Both studies examined
changes in rat skeletal muscle at only 3 minutes (Wilkes and Bonen, 2000) and 4 hours
(Bertelli et al., 2003) after acute denervation via removal of a portion of sciatic nerve. At
such immediate time-points, and with inability of axonal sprouting due to nerve
dissection, it is possible that the findings could represent a temporal sequence. P13-K
activity appears to have been stimulated directly upon denervation (Bertelli et al., 2003),
but a 4 hour window may not allow enough time to observe commensurate results
downstream at Akt.
Alternately, in the G93A model of neurodegenerative disease, myofibre
denervation and axonal sprouting are ongoing processes which could result in continual
signalling to up-regulate P13-K and downstream targets such as Akt. Examination of
NCAM data revealed a pattern of progressive denervation in G93A skeletal muscle.
Levels of NCAM in the pre-symptomatic G93A mice remained comparable to W/T.
While not statistically significant, a larger number of NCAM positive (denervated) fibres
were observed in G93A mice at symptom onset, when compared to age-matched controls.
Once mice began to exhibit severe symptoms, almost half of the fibres counted were
characterized as denervated, a value significantly higher than that observed in both WIT
and the pre-symptomatic G93A mice. As more fibres become denervated with disease
progression, an increased release of trophic factors could occur, resulting in increased
PI3-K activity and gradual elevations in downstream Akt and phospho-Akt, as our
findings suggest.
Elevations in Akt protein occur primarily in denervated muscle cells
To further explore the elevations in Akt revealed through Western blotting
protocols, alterations were examined at a cellular level. To qualitatively assess whether
increases in Akt were occurring primarily in innervated or denervated cells,
immunohistochemical techniques were used on soleus muscle to stain for both Akt and
NCAM, a neural cell adhesion molecule used as a marker of skeletal muscle denervation.
As can be seen in Figure 9, soleus sections reveal prominent Akt staining patterns in
areas with high concentrations of denervated cells, although Akt immunofluorescence
was evident in both innervated and denervated fibres. Interestingly, while weak levels of
Akt immunoreactivity were observed in both innervated and denervated fibres, intense
Akt immunofluorescence was exhibited primarily in denervated fibres.
Variations in Akt staining could reflect differential protein content within the
cells. The low Akt levels observed could be an indication of basal up-regulation of Akt
within the cells, which would explain the even distribution of Akt in both innervated and
denervated cells. However, the more vivid, "hot spots" of Akt being localized
predominantly in denervated cells may suggest an up-regulation of Akt-mediated
processes pertinent to the denervated myofibre. Indeed, it is important to note that the
percentage of denervated cells labelled positively for Akt was consistently higher across
all levels of Akt immunofluorescence when compared to the percentage of innervated
cells exhibiting signal for Akt. A respective 2-fold, 3-fold and 5-fold increase was
observed in the proportion of total NCAM+ versus NCAM- cells that were
immunoreactive for Akt at weak, moderate and strong signal intensities. Together, these
findings not only demonstrate that "hot spots" of intensely fluorescent Akt were
preferentially localized to denervated fibres, but also that a higher proportion of
denervated cells exhibited the observed levels of Akt immunofluorescence, when
compared to the remaining innervated fibres.
A fibre was classified as denervated if the cell membrane displayed NCAM
immunoreactivity on sites separate from the neuromuscular junction. Appearance of
NCAM immunofluorescence was varied throughout the tissue, with either partial or full
membrane staining, as well as some intracellular labelling. Therefore, NCAM positive
cells were qualitatively categorized as exhibiting low, moderate or extensive levels of
NCAM (Table 3, Figure 7). The variation observed is typical of findings from previous
literature (Covault and Sanes, 1985, Cashman et al., 1987, Figarella-Branger et al., 1990,
Hayatsu and De Deyne, 2001) and while all NCAM positive cells were scored as
denervated, independent of the extent of NCAM immunoreactivity, it is possible that the
varied levels of expression could reflect different stages of myofibre denervation or re-
innervation, which could potentially impact biochemical or molecular changes resulting
from diminished neural input. A study examining NCAM expression in human
denervation disorders describes a "reflected mirror" relationship between NCAM
intensity and denervationlre-innervation patterns, whereby as denervation progresses, a
parallel increase in NCAM intensity is observed. Upon onset of re-innervation, intensity
of NCAM begins to diminish, disappearing completely once re-innervation has been
achieved (Gosztonyi et al., 2001). If the extent of NCAM immunoreactivity in the
current study is related to this intensity model, the extensive levels of NCAM could be
interpreted as an indication of fully denervated fibres. Interestingly, examination of the
distribution of Akt within NCAM+ cells clearly suggests that Akt irnmunofluorescence,
independent of its intensity, is predominantly observed in cells with extensive NCAM
labelling, as opposed to low or moderate NCAM, suggesting that increases i'n Akt are
occurring primarily in fully denervated cells (Figure 11).
These results, suggestive of a relationship between elevated Akt and myofibre
denervation, correspond to data from Western blot analyses which demonstrated
increases in Akt with progression of motor neuron degeneration and skeletal muscle
denervation. Although BAD-mediated cell survival does not seem to be affected in this
model, it is possible that other Akt-regulated cell survival or anti-atrophic pathways could
be up-regulated in the denervated cell. Apoptosis has been shown to be a component of
denervation-induced atrophy (Allen et al., 1997, Schoser et al., 2001) and Akt has been
shown to phosphorylate proteins involved in both apoptotic and atrophic signalling
pathways, such as caspase 9 or FKHR (FOXOI) (Toker, 2000, Sandri et al., 2004, Stitt et
al., 2004). Phosphorylation of these proteins results in their de-activation, thereby
contributing to the suppression of both programmed cell death and catabolic pathways
simultaneously.
Levels of Akt and phospho-Akt could also be elevated in an attempt to regulate
muscle mass, as the role of Akt in protein synthesis has also been substantially
documented (Bodine et al., 2001, Rommel et al., 2001, Pallafacchina et al., 2002).
Pallafacchina and colleagues (2002), who were able to demonstrate that differential Akt
content and activity can exist between individual muscle cells, also found that during
muscle regeneration, endogenous Akt phosphorylation and activity were up-regulated
only in innervated, not denervated muscles. It has also been stated that singular, non-
denervated myofibres tend to undergo compensatory hypertrophy (Banker, 1994).
Although intensive Akt appeared to be preferentially localized to denervated fibres in the
current study, there were still a proportion of innervated cells that stained positively for
Akt across all intensities, as can be seen in Figure 10. The slow-twitch soleus muscle
examined has been shown to not only be resistant to denervation, but the small, slow
motor neurons supplying it have also demonstrated enhanced sprouting capabilities (Frey
et al., 2000). As such, the absence of NCAM staining of some cells could indicate re-
innervated, regenerating fibres. The previous literature suggests that alterations in Akt
observed in innervated cells may be of distinct consequence to that seen in denervated
cells and therefore could indicate that the Akt irnrnunofluorescence present in the
innervated fibres may be reflective of regenerative muscle growth specifically within
those fibres.
Alternately, it is possible that paracrine action from a local release of growth
factors could affect all fibres in a surrounding area, thereby resulting in non-discriminate
increases in Akt. If so, the innervated cells shown to have moderate and strong levels of
Akt immunofluorescence could represent a small number of innervated fibres remaining
within a localized cluster of denervated cells. This could represent an up-regulation of
processes in an attempt to regulate losses within specific motor units, targeting not only
denervated but remaining innervated or re-innervated fibres as well. Although increases
up-stream in Akt may occur non-discriminately, its downstream targets may differ
dependent upon specific requirements of the cell at that time, potentially cell survival
pathways in denervated fibres versus muscle growth in re-innervated cells.
Downstream targets of Akt do not reflect up-stream alterations
The increases observed in Akt protein in the current study are not only reflected
by parallel elevations in phospho-Akt (indicative of a comparable activation of Akt), but
are also occurring throughout the progression of the disease; not solely at one time-point,
or at a post-mortem state. This is suggestive of ongoing alterations occurring in the Akt
pathway in response to, or as a consequence of, the denervation state. Significant atrophy
of soleus muscle does not occur until end-stage of disease, which could indicate a role for
Akt in maintaining muscle mass via protein synthetic or anti-apoptotic pathways.
However, no concurrent changes were observed in the downstream effectors, p70s6K and
BAD (Figures 4-5, Appendix B). This raises the question as to whether or not the
observed up-regulation of Akt is actually functional, or if the elevations are solely a
consequence of impaired signalling regulation within the diseased muscle. There are a
number of possible explanations for these results.
Changes observed in Akt may still be targeting proteins downstream, such as
p70s6K, without any increases in their protein contents or phosphorylation relative to
wild-type animals. A study examining the regulation of translation factors during muscle
denervation in rats found that phosphorylation of p70s6K is significantly decreased at
both 12 hours and 7 days post-denervation of soleus muscle, compared to non-
denervated control muscle (Hornberger et al., 2001). Additionally, desIGF-I-mediated
elevations in Akt phosphorylation resulted in concurrent increases of phosphorylated
p70s6K in young mice only, where no change in p70s6K phosphorylation was observed
in aged mice, relative to controls (Li et al., 2003b). The aged muscle appears to show
changes in fibre innervation that are very similar to the process of progressive
denervation occurring in neuromuscular disease. A preferential denervation of fast
myofibres is complimented with axonal sprouting and re-innervation by slow motor
neurons. When denervation finally supersedes re-innervation, the muscle fibres become
atrophic and lose functionality [reviewed in (Delbono, 2003)l. It appears that
mechanisms may be up-regulated with progressive denervation in an attempt to counter-
balance the decline in p70s6K phosphorylation that is observed with acute denervation.
It is possible then that the increases in Akt protein and phosphorylation may function to
retain p70s6K levels comparable to those of healthy control muscle, perhaps in an effort
to maintain the mass of the diseased muscle. Additionally, the number of fibres
potentially up-regulating p70s6K may not be numerous enough to reflect changes in
Western blotting analysis of whole muscle lysates. The percent of innervated fibres
containing elevated Akt is few compared to denervated cells. As discussed, Akt-
mediated muscle growth may be regulated primarily in innervated cells as opposed to
denervated cells, which could result in potential p70s6K increases not being sensitive
enough to be observed in gross measures of muscle protein.
An alternate possibility is that the use of mixed hindlimb muscle for analysis may
have acted to mask any effects that may have been seen if individual muscles were
examined. Hornberger and colleagues (2001) also determined that denervation-
dependent alterations in p70s6K phosphorylation were differential with respect to muscle
type. More specifically, where they saw decreases in p70s6K phosphorylation in slow-
type soleus muscle, fast-type extensor digitorum longus muscle showed no difference
compared to controls at 12 hours post-denervation and increases in phosphorylation at 7
days. Dissimilarity across muscle type was also observed in other translation factors such
as eIF-2a (eukaryotic initiation factor-2-alpha) and eEF-2 (eukaryotic elongation factor-
2). These are very dramatic variations based solely on muscle differences. The mixed
muscle used to assess protein content and phosphorylation levels in the current study was
comprised of a mixture of muscle types, including all anterior and lateral compartment
leg muscles, as well as thigh. This, in addition to individual animal differences, could
have contributed to the large amount of variability seen within each group with respect to
p70s6K values.
Previous studies have implicated pro-apoptotic BAD as a direct substrate of Akt
(Datta et al., 1997, del Peso et al., 1997), demonstrating that cell-survival effects of Akt
are exerted through de-activation of BAD via phosphorylation at serine residue 136
(Datta et al., 1997). Only preliminary experiments were conducted on BAD in the
current study, but initial findings indicate no change in phosphorylation of BAD at serine
136 in the G93A mouse, suggesting that elevations seen up-stream in Akt are not
resulting in de-activation of BAD. Many studies demonstrating Akt-mediated
phosphorylation of BAD have employed the use of cell lines expressed with
constitutively active, wild-type or inactive Akt andlor BAD constructs (Datta et al., 1997,
del Peso et al., 1997). Examination of cultured cardiomyocytes (Kuwahara et al., 2000)
and vascular smooth muscle cells (Vantler et al., 2005) also used either transfected BAD
or mutant growth factor receptors respectively. Since endogenous Akt and BAD were
examined in the current animal model, it is possible that the levels of Akt reached may
not be effective in phosphorylating BAD to an observable level. Interestingly, Maroni
and colleagues (2003) were able to demonstrate that Akt activation coincided with
increased phosphorylation of serl36BAD in hindlimb muscle of C57BL16J mice, which
appears to contradict our current findings. Although both studies examined effects
within mouse tissue, the models were very different which could explain the discrepancy
between results. The previous study investigated the effects of leptin administration on
intracellular signalling and mice were only 5-6 weeks old (younger than the vast majority
of mice in the current study), both factors which could contribute to the disagreement of
our findings.
Initial findings with respect to BAD protein are also in contradiction to findings in
nervous tissue of G93A symptomatic mice (Vukosavic et al., 1999). However, although
markers of apoptosis have been shown to be elevated in neurodegenerative muscle in a
number of studies (Tews et al., 1997a, Schoser et al., 2001, Tews et al., 2004), these
studies did not examine the presence of BAD itself. It is possible that BAD may not be a
key player in G93A skeletal muscle, with apoptosis being primarily regulated by other
proteins. A potential decreased reliance on BAD in the current study also supports the
lack of Akt-induced phosphorylation. However, it is important to note that the present
findings reflect only preliminary data involving BAD and therefore are representative of
only a very small number of samples. Although no differences were apparent,
examination of additional samples may offer further answers.
The possibility exists that in the G93A model of progressive denervation, the up-
regulation of Akt protein and phosphorylation may indeed be non-functional, potentially
resulting from a de-regulation in intracellular signalling associated with ongoing
denervation. This is substantiated by the lack of activation of downstream proteins such
as p70s6K. However, elevations in Akt and phospho-Akt may still serve a functional
purpose in the denervated muscle, though not specifically with respect to those proteins
examined. Studies demonstrating Akt/mTOR,p70s6K-dependent prevention of
denervation atrophy examined the effects of constitutively active Akt on acutely
denervated hindlimb (Bodine et al., 2001, Pallafacchina et al., 2002), results which again
may not be transferable to studying endogenous levels of molecules within a progressive
model of denervation. Studies examining phosphorylation of endogenous BAD found
that stimulation of MC/9 cells with a number of cytokines always resulted in activation of
Akt, yet not all cytokines induced phosphorylation of BAD (Scheid and Duronio, 1998).
This suggests that activation of endogenous Akt does not necessarily result in BAD
phosphorylation and that Akt-mediated BAD phosphorylation may be dependent upon
the type of growth factor or cytokine involved. Therefore, the effects of increased Akt
may be reflected in downstream effectors other than those studied. Proteins downstream
of Akt have been shown to be phosphorylated independently of each other in cardiac and
skeletal muscle, where desIGF-I-induced phosphorylation of Akt resulted in
phosphorylation of forkhead (FKHR) but not p70s6K in cardiac muscle with
phosphorylation of p70s6K but not FKHR in skeletal muscle (Li et al., 2002). These
findings support the theory that alternate Akt-mediated factors may be targeted
downstream.
Akt has been shown to phosphorylate a number of known substrates involved in
many biological functions. Glucose metabolism is partly regulated by Akt via
phosphorylation of GSK-3 and PFK-2, resulting in increased glycogen synthesis and
glycolysis respectively [reviewed in (Coffer et al., 1998, Toker, 2000)l. The action of the
cell cycle regulator E2F has also been shown to be mediated by Akt (Coffer et al., 1998).
While phosphorylation of p70s6K and BAD have been shown to be linked to muscle
hypertrophy and cell survival, the elevated levels of Akt observed in the G93A mouse do
not appear to target these proteins. However, the role of Akt in muscle maintenance and
cell survival has been shown to be mediated by a number of other downstream effectors,
suggesting that the increases observed in Akt may result in regulation of these processes
through other target proteins. Phosphorylation of 4E-BPlJPHASl has been shown to be
mediated by the P13-KIAkt pathway, potentially through mTOR. This results in the
dissociation of 4E-BPI from eIF-4E, leading to increased mRNA translation and
increased protein synthesis [reviewed in (Coffer et al., 1998)l. Cell death has also been
shown to be ameliorated by a number of Akt-regulated factors, including NF-KB which
controls transcription of anti-apoptotic genes such as Bcl-xL [reviewed in (Downward,
2004)l. However, of particular interest are Akt's downstream targets caspase-9 and the
FOX0 family of transcription factors as their roles in both apoptotic and atrophic
pathways could be pertinent within the progressively denervated muscle.
The process of apoptosis is partially regulated by the action of caspases, a family
of proteases broken down into initiators and effectors of the apoptotic signalling cascade.
Akt has been shown to phosphorylate the initiator protease caspase 9, thereby inhibiting
its proteolytic activity and promoting cell survival (Cardone et al., 1998). Studies
examining the expression of various caspases within muscle of patients with neurogenic
muscular atrophy found increased content of caspase 9 in atrophic muscle, as well as in
some areas of normotrophic fibres (Tews et al., 2004). This evidence suggests that the
up-regulation of apoptotic cascades may contribute to the process of progressive atrophy
in a model of long-term denervation. As such, caspase 9 is an intriguing potential target
for the elevated levels of Akt and phospho-Akt observed in this study.
Akt has also recently been shown to phosphorylate members of the FOXO family
of transcription factors (Brunet et al., 1999, Rena et al., 1999), a sub-group of the
Forkhead family of transcription factors. Upon phosphorylation, FOXO proteins bind to
14-3-3 resulting in the translocation of FOXO from the nucleus to the cytosol, thereby
inhibiting transcription of target genes, such as the pro-apoptotic Fas ligand gene (FasL)
(Brunet et al., 1999). IGF-1-induced activation of Akt was shown to phosphorylate
FOXOl (FKHR) (Rena et al., 1999) and FOX03 (FKHRLl) (Brunet et al., 1999) in cell
culture experiments. Additionally, in vitro experiments demonstrated that activated Akt
was able to induce phosphorylation of FOXOl at a faster rate than that observed with
BAD (Rena et al., 1999). In this respect, phosphorylation of FOXO proteins by Akt
contributes to increased cell survival via inhibition of apoptotic gene transcription.
Maintenance of muscle mass requires a balance between hypertrophic and
atrophic pathways. While Akt has previously been shown to activate protein synthetic
pathways, recent evidence suggests a role for Akt in the suppression of atrophy through
FOXO. During muscle atrophy, increased transcription of the ubiquitin ligases MAFbx
(Atrogin 1) and MURFl (muscle ring finger 1) occurs, thereby up-regulating the
ubiquitin-proteasome degradation pathway (Jackman and Kandarian, 2004).
Transcription of these genes has been shown to be induced by the FOXO family of
transcription factors (Sandri et al., 2004). Studies have recently demonstrated that
inhibition of FOXO factors via Akt-mediated phosphorylation results in a down-
regulation of MAFbx and MURFl (Sandri et al., 2004, Stitt et al., 2004) with subsequent
suppression of atrophic protein degradation (Sacheck et al., 2004).
It is unclear whether the elevated Akt and phospho-Akt contents seen in the G93A
skeletal muscle are operating to target imperative biological processes, or if they are
instead occurring only as a result of the diseased state of the muscle. The lack of
observed alterations in the downstream proteins p70s6K and BAD does not necessarily
indicate de-regulation of signalling. Rather, Akt may be targeting alternate substrates as
a compensatory mechanism to promote cell survival or muscle maintenance. Its role in
the phosphorylation of caspase 9 and FOX0 proteins provides potential alternatives for
future study.
G93A mutant SOD mouse - a model of progressive denervation and atrophy
The development of transgenic mice has been invaluable to the study of
neurodegenerative and other diseases. The G93A mutant SOD mouse is now commonly
used as a model of ALS and therefore has been characterized quite thoroughly. Findings
from the current study with respect to G93A symptomatology progression are
comparable to those of previous studies. Although a substantial amount of variability
presented with respect to the age range of animals in each group, the mean age of
symptomatology onset was similar to values seen in literature (Gurney et al., 1994, Chiu
et al., 1995, Millecamps et al., 2001, Guegan and Przedborski, 2003). However, the
range of ages could potentially be accounted for by gender differences, as investigators
have documented an earlier onset of disease in male G93A mice compared to females
(Veldink et al., 2003). Ages of severe (122 days) and end-stage mice (136 days) were
also in accordance with G93A characterization studies, citing mobility difficulties at
approximately 125 days of age and end-stage of the disease being reached at 136 days
(Chiu et al., 1995).
Mean body mass of G93A mice was comparable to wild-type until severe
symptomatology, at which point animals began to show significant declines. This
corroborates findings in literature indicating a 20% higher body mass in control mice
compared to G93A at 120 days of age (Derave et al., 2003). Specifically, the body mass
of the G93A mice appeared to plateau throughout disease progression, with a dramatic
decrease being observed only at end-stage (Table 2). These findings are in agreement
with Chiu et al. (1995) who document comparable mouse weights between the G93A and
controls up to approximately 75 days of age, with a plateau in G93A weight and a
subsequent loss of up to 10% of body weight being observed within the last two weeks.
Notably, while body mass of wild-type animals appears to be consistent at early ages,
increases are observed at approximately 122 days of age which, in addition to the
declines being seen in G93A mass, exacerbate the differences beginning to be observed
between the G93A and wild-type animals.
There is a clear lack of differentiation between G93A and W/T soleus mass until
quite late in disease progression, at which point the G93A soleus finally begins to decline
in size. This finding is similar to that of Derave et al. (2003) who found the weight of
G93A and control soleus muscles to be equal at 120 days of age. Yet, they observed
extensive atrophy of the extensor digitorum longus (EDL) muscle at the same timepoint.
This apparent discrepancy can explained by studies that demonstrated not only muscle
weakness (Chiu et al., 1995, Frey et al., 2000), but loss of neuromuscular synapses (Frey
et al., 2000) much earlier in fast-twitch muscles (e.g. EDL) compared to primarily
oxidative, slow-twitch muscles (e.g. soleus). Frey et al. (2000) found that axonal
sprouting was much more pronounced in the G93A soleus compared even with regions of
type I fibres in the gastrocnemius muscle, indicative of denervation resistance in slow-
twitch type muscles such as soleus. Additionally, they showed that while denervation of
fast-twitch fibres arose as early as day 50, denervation of the soleus muscle did not occur
until 120 days of age. These findings support not only previous studies but the current
results as well, in that soleus muscle atrophy is not seen until end-stage (136 days), a
function of muscle denervation being initiated at a prior time, potentially once severe
symptomatology is being exhibited at the 120 day mark. Additionally, the eventual
decline in soleus muscle mass suggests that potential compensatory mechanisms
regulated by Akt throughout disease were ultimately insufficient to counter-balance the
effects of progressive denervation.
Neural cell adhesion molecule (NCAM), a molecule that is absent from the
sarcolemma in adult muscle cells, has been shown to re-appear around the membrane of
denervated cells (Covault and Sanes, 1985, Cashman et al., 1987, Tews et al., 1997b),
potentially acting as a mediator between muscle and nerve in an attempt to regulate the
re-innervation process. Therefore, immunohistochemical staining with an antibody
against NCAM was used to determine the extent and location of muscle denervation with
progression of the disease. As expected, we found that the state of symptomatology of
the mice significantly affected the percentage of NCAM positive fibres present, with
increases in NCAM being observed as the disease progressed (Table 3, Figure 6). By the
time the mice were exhibiting severe syrnptomatology (1 22 days of age), almost half of
the fibres counted were characterized as denervated, a value significantly higher than that
observed in both WIT and the pre-symptomatic G93A mice. These results are in
accordance with previous literature identifying pronounced denervation of soleus muscle
at 120 days (Frey et al., 2000). As well, the dramatic increase in denervation observed in
the severely symptomatic group aids in explaining the decline in soleus muscle mass of
end-stage mice, as muscle atrophy would occur in response to the severe denervation.
The decline observed in the number of NCAM positive cells is similar to findings
where denervation of rat (Tews et al., 1997b) and human (Gosztonyi et al., 2001) muscle
showed decreases in NCAM expression in the later stages of denervation (Tews et al.,
1997b) with losses being observed in severely atrophied muscle fibres (Gosztonyi et al.,
2001). A possible explanation for this finding is the potential up-regulation of
compensatory re-innervation. One study examining denervation patterns of G93A and
other mouse models found a partial recovery of end-plate innervation at the 120 day mark
(Fischer et al., 2004). The current findings indicate instead a large increase in
denervation at the same time-point, with loss of NCAM at more advanced stages of
disease. However, the assessment by Fisher and colleagues was inclusive of numerous
varied muscle types (tibialis anterior, medial gastrocnemius and soleus) acquired from a
number of mouse models, whereas the current study examined only slow-twitch soleus
muscle. While Fischer et al. found an overall "recovery" at 120 days, they also observed
denervation as early as 47 days (most-likely indicative of a predominance of type I1
fibres). I did not observe the onset of denervation until approximately 85 days, which
could account for a phase of compensatory re-innervation shifting to occur at a later time-
point.
An alternate, more probable explanation, for the decline in NCAM seen at end-
stage of the disease could simply reflect a "dying off' of those fibres which have
becoming chronically denervated. An increase in cell death would therefore contribute to
the decline in soleus muscle weight observed at the same end-stage of the disease. These
end-stage fibres may also no longer be able to facilitate NCAM production, or perhaps
simply act to down-regulate its appearance due to the futility of its function in the dying
myofibre.
While NCAM positive cells in pre-symptomatic and symptom onset groups
appeared to consist of a relatively even distribution of low, moderate and extensive
NCAM levels, tissue from severe and end-stage mice revealed a predominance of
extensively labelled fibres. Under the premise that varying levels of NCAM could
indicate differential states of denervation, these findings could indicate a larger
proportion of fully denervated fibres at later stages of disease. The small number of
fibres with low NCAM immunoreactivity is most likely indicative of fibres beginning to
undergo denervation as opposed to becoming re-innervated, due to the advanced stage of
the disease. Interestingly, although no extensive NCAM imrnunoreactivity was observed
in wild-type sections, a small amount of staining was present, comprised mainly of low
levels of NCAM (Table 3, Figure 7). It is possible that some myofibres in the control
mice could have been damaged, with the low NCAM staining potentially being indicative
of fibres at either an early phase of denervation or a late phase of re-innervation
(Gosztonyi et a]., 2001). However, normal adult myofibres are normally devoid of
NCAM staining and these findings could instead be reflective of a small population of
activated satellite cells (Covault and Sanes, 1986, Cashman et al., 1987, Figarella-
Branger et al., 1990).
Overall, the differences observed in NCAM across G93A symptomatology
indicate an ongoing progression of skeletal muscle denervation, with dramatic increases
as mice reach severe symptomatology, which is consistent with previous literature.
NCAM levels show a moderate decline at end-stage, which could be indicative of either
an increase in fibre death, or a down-regulation of a protein whose function may be
redundant in a dying cell.
The current findings regarding G93A denervation and atrophy not only
substantiate, but also tie together characteristic features observed in neuromuscular
diseases such as ALS. Small, slow-type motor neurons have been shown to be not only
more resilient with respect to denervation, but more capable of effectively sprouting in
response to progressive denervation, as compared to large, fast-type neurons (Frey et al.,
2000). The preferential loss of fast-type neurons observed in diseases such as ALS will
be counter-balanced by axonal sprouting of the remaining slow, stress-resilient motor
neurons, which explains observed fibre-type shifting from type I1 to type I in ALS muscle
(Gordon et a]., 2004). Soleus muscle, supplied primarily by slow motor neurons, will
exhibit not only resiliency to early denervation, as is confirmed by our results, but also an
enhanced ability to rescue fibres supplied initially by large, fast motor neurons, through
axonal sprouting. However, eventually the increased demands being placed on the
remaining motor neurons and the ongoing decline in neural signalling will result in a
failure to effectively sprout, with increases in muscle denervation and subsequent muscle
atrophy being observed. Any potential role of elevated Akt protein and phosphorylation
in mediating cell survival or muscle maintenance appears to ultimately be overcome by
significant and irreversible muscle denervation.
2.7 Conclusion
Results from this study demonstrate that both Akt protein and its phosphorylated
form become increasingly elevated in skeletal muscle of a murine model of progressive
denervation. Although elevations were observed in both innervated and denervated cells,
higher levels of Akt immunofluorescence were localized primarily to denervated
myofibres, suggesting that these increases reflect a compensatory mechanism of the
muscle in response to the denervation. Pathways involved in both cell survival and
muscle growth have been shown to be mediated via Akt signalling and as such could
represent cellular processes targeted by the current elevations in Akt protein and
phosphorylation. Interestingly, alterations observed in Akt were not accompanied by
changes in the downstream proteins p70s6K and BAD. This may suggest an impairment
in Akt-mediated signalling within the muscle. However, the lack of commensurate
increases in these proteins may indicate that Akt function is being exerted via other
targets.
There are a number of potential Akt substrates such as FOX0 proteins or caspase
9 that have been shown to be involved in neurodegenerative skeletal muscle. Their roles
in atrophy and apoptosis suggest that elevated Akt may still be regulating these processes
via alternate downstream effectors than the ones examined. However, the potential
compensatory effects induced by Akt are eventually superseded by the severe, continual
denervation, as observed by the increased muscle atrophy in the final stages of disease.
Future studies will aid to further understand the role of Akt in the progressively
denervated muscle, potentially via identification of relevant downstream targets.
Table 1 G93A Disease Progression Characteristics
Pre-symptomatic (PS)
Symptom Onset (SO)
Severe Symptoms (SS)
End-stage (ES)
DISEASE PROGRESSION CHARACTERISTICS
-
-
-
-
Animals possess the transgene, but are not yet exhibiting symptoms Splay test results normal Unable to splay legs properly Flexion of at least one hindlimb Rolling gait (whole body moves with step) Muscle atrophy evident in hips/hindlimb(s) Hunched posture evident Hindfoot knuckling of one or both feet (dragging of feet) Decreased mobility Rough coat (males) Severe flexion in hindlimbs Severe atrophy in back and hindlimbs Partial or complete paralysis of one or both hindlimbs Balance loss; lateral recumbency for at least 10 seconds
Gro
up
Tab
le 2
M
ouse
Cha
ract
eris
tics
: G
93A
vs.
age
-mat
ched
wild
-typ
e co
ntro
l mic
e. V
alue
s ar
e re
port
ed a
s m
eans
+ SE
Bod
y M
ass
(d
Mea
n M
ass
Dif
fere
nce
(Wm
-G93
A) (
g)
Sole
us M
ass
Mea
n So
leus
D
iffe
renc
e (W
T-G
93A
) (m
g)
WR
= a
ge-m
atch
ed w
ild-
type
con
trol
(n
= id
enti
cal t
o re
spec
tive
G93
A);
PS
= G
93A
, pre
-sym
ptom
atic
(B
ody
Mas
s n
= 1
0; S
oleu
s n
= 7
); S
O =
G93
A,
sym
ptom
ons
et (
Mas
s n
= 5
; Sol
eus
n =
3);
SS
= G
93A
, sev
ere
sym
ptom
s (M
ass
n =
8; S
oleu
s n
= 4
), E
S =
G93
A, e
nd-s
tage
(M
ass
n=10
; S
oleu
s n
= 9
). M
ean
mas
s di
ffer
ence
bet
wee
n th
e G
93A
and
rel
ativ
e W
R co
ntro
l w
as s
igni
fica
ntly
dif
fere
nt a
cros
s sy
mpt
omat
olog
y (p
< 0
.001
). N
o si
gnif
ican
t dif
fere
nces
in
Mea
n S
oleu
s D
iffe
renc
e w
ere
obse
rved
acr
oss
sym
ptom
atol
ogy.
* S
igni
fica
nt d
iffe
renc
e fr
om a
ge-m
atch
ed w
ild-
type
con
trol
s (*
p <
0.0
1; *
*p <
0.0
01).
'Si
gnif
ican
t di
ffer
ence
fro
m P
S ('
p <
0.0
5; *
p <
0.0
01).
' Sig
nifi
cant
dif
fere
nce
from
SO
(p <
0.0
01).
' Sig
nifi
cant
dif
fere
nce
from
SS
(p <
0.0
5).
Table 3 NCAM Expression: Wild-type controls vs. G93A mice. Values are reported as means + SE
Mean # of Fibres
:per animal)
Mean NCAM Positive
( % of Fibres)
Extent of NCAM Expression ( % of Fibres)
Low Moderate
Mean NCAM Negative
( % of Fibres)
Extensive
WIT = age-matched wild-type control; PS = G93A, pre-symptomatic; SO = G93A, symptom onset; SS = G93A, severe symptoms, ES = G93A, end-stage. (Some totals may not add up to 100% due to rounding). There was a significant effect of disease progression on the mean number of NCAM positive fibres (p<0.001). * Significant difference from WIT (p<0.001); t Significant difference from PS (p<0.05).
J CELL SURVIVAL
PROTEIN SYNTHESIS
Figure 1 PI3-KIAkt signalling and downstream effectors
Cell Cycle
Metabolism
Once activated via PI3-K-dependent mechanisms, Akt is able to phosphorylate downstream targets involved in a number of biological processes including cell survival, protein synthesis, glucose metabolism and cell cycle regulation. In particular, phosphorylation of BAD at serine residue 136 results in its de- activation and subsequent suppression of apoptosis with a shift toward cell survival. Phosphorylation of p70s6K via mTOR up-regulates translational machinery, thereby contributing to increased protein synthesis.
A
WIT Ctrls , Affected ( A , SO SS ES Ctrls
Figure 2 Akt Protein Content (Mixed Hindlimb Skeletal Muscle): G93A vs. W/T Ctrls
Representative blot (Figure 1A) and graphed values (Figure 1B). Values are reported as means + SE (n=6 per group). W/T Ctrl = age-matched wild-type control; PS = G93A, pre-symptomatic; SO = G93A, symptom onset; SS = G93A, severe symptoms; ES = G93A, end-stage. A significant interaction effect was found between symptomatology and mouse type (pe0.0001). * Significant difference from respective age- matched WIT controls (p<0.05); t Significant difference from G93A PS (p<0.05).
A
WfI' Ctrls
Affected (G93A)
- - -I- PS SO SS ES Ctrls
G93A
E l W/T Ctrl
Figure 3 p-Akt Protein Content (Mixed Hindlimb Skeletal Muscle): G93A vs. WIT Ctrls
Representative blot (Figure 2A) and graphed values (Figure 2B). Values are reported as means + SE (n=6 per group). W/T Ctrl = age-matched wild-type control; PS = G93A, pre-symptomatic; SO = G93A, symptom onset; SS = G93A, severe symptoms; ES = G93A, end-stage. Interaction effect between symptomatology and mouse type was non-significant (p = 0.0606). * Significant difference from respective age-matched W/T controls ( ~ ~ 0 . 0 5 ) . t Significant difference from G93A PS (p<0.05).
A
WIT Ctrls
Affected (G93A)
- -
G93A
H WIT Ctrl
- I- SS ES Ctrls
Figure 4 p70s6K Protein Content (Mixed Hindlimb Skeletal Muscle): G93A vs. WIT Ctrls
Representative blot (Figure 3A) and graphed values (Figure 3B). Values are reported as means + SE (n=6 per group). W/T Ctrl = age-matched wild-type control; PS = G93A, pre-symptomatic; SO = G93A, symptom onset; SS = G93A, severe symptoms; ES = G93A, end-stage. No significant differences were found.
A WIT Ctrls
Affected (G93A)
fill WIT Ctrl r
J I J
ES Ctrls
SO SS
S ymptornatolog y
Figure 5 p-p70s6K Protein Content (Mixed Hindlimb Skeletal Muscle): G93A vs. WIT Ctrls
Representative blot (Figure 4A) and graphed values (Figure 4B). Values are reported as means + SE (n=6 per group). WIT Ctrl = age-matched wild-type control; PS = G93A, pre-symptomatic; SO = G93A, symptom onset; SS = G93A, severe symptoms; ES = G93Aend-stage. No significant differences were found.
Figure 6 NCAM-Immunolabelled Soleus Muscle: G93A vs. WIT (20x mag.)
Sections were immunolabelled for both NCAM, a marker of skeletal muscle denervation (A, D, G - Red) and post-synaptic AchR, for identification of the neuromuscular junction (B, E, H - Green). Image overlay (C, F, I) allows for visualization of association of NCAM with the neuromuscular junction. G93A mice that are pre-symptomatic (D-F) exhibit a high level of NCAM localization to the neuromuscular junction (asterisks), indicating that the majority of muscle cells remain innervated. Some cells appear to express NCAM in small proportion around the cell membrane in the absence of AchR (arrows), potentially indicating that the cell is beginning to undergo denervation. Staining patterns between the pre-symptomatic G93A mice and wild-type control mice (A-C) are comparable. Tissue from severely symptomatic G93A mice ((3-1) labels strongly for the presence of NCAM, either partially or entirely around the cell membrane, impIying that a large number of cells are denervated.
Figs. A-C represent cells expressing varying levels of NCAM. All cells expressing NCAM around the cell membrane in the absence ofiotal association with AchR (neuromuscular junction) were classified as denervated, regardless of extent of the staining pattern. Cells classified as denervated were further categorized as having low (L), moderate (M) or extensive (E) levels of NCAM immunoreactivity. Cells were considered to have low levels of NCAM (Fig.7A) if cell surface NCAM was minimal, with staining occurring up to approximately % of the distance around the cell. Moderate level of NCAM immunofluorescence (Fig. 7B) was indicated by cell membrane staining from approximately % to % of the cell surface. Cells with staining occurring completely around the cell membrane andlor intracellularly were considered to have extensive NCAM immunoreactivity (Fig. 7C).
Variable Akt staining was observed in sections, as shown above. To qualitatively assess which cells were exhibiting higher levels of fluorescence than others (potentially reflecting differential Akt content), signal sensitivity was increased by consistent, arbitrary units. Cells were then categorized and counted as exhibiting weak, moderate or strong irnrnunofluorescent signalling. Representative cell with fluorescence categorized as weak; A Representative cell categorized as moderate: * Representative cell categorized as strong.
Sections were double-labelled for both NCAM (Figure A - red) and Akt (Figure B - green). Image overlay suggests that increased levels of intracellular Akt occur predominantly in areas with a high concentration of denewated cells, as represented by those cells with membrane-bound NCAM.
Weak Moderate Strong
Ak t Imrnunofluores cence (AU)
Figure 10 Akt Distribution - NCAM positive vs. NCAM negative cells
Bars represent the percentage of total Akt positive cells at each of the stated increments: Weak, Moderate and Strong immunofluorescence. Black bars indicate NCAM positive cells; hatched bars indicate NCAM negative cells. The percentage of Akt within NCAM positive cells increased as immunofluorescence intensity increased, with 49%, 59% and 73% of cells with weak, moderate and strong Akt immunoreactivity respectively, also labelling positive for NCAM. Chi-square for linearity was found to be significant (p < 0.05), indicating an association between intensity of Akt immunofluorescence and innervation status of the cell (NCAM+ vs. NCAM-).
NCAM+ Low
B i NCAM+ Moderate
NCAM+ Mensive
Weak Moderate Strong
Ak t Irnrnunofluores cence (AU)
Figure 11 Akt Distribution - Low, Moderate and Extensive NCAM
Bars represent the percentage of total AktlNCAM positive cells at each of the stated increments of Akt imrnunofluorescence: Weak, Moderate and Strong. White bars represent those cells that are labelled with low NCAM; grey bars = moderate NCAM; black bars = extensive NCAM. Akt is predominantly observed in cells with extensive NCAM labelling, regardless of strength of Akt signal. Specifically, 63%, 69% and 75% of cells with weak, moderate and strong Akt immunofluorescence respectively were also categorized as exhibiting extensive levels of NCAM, versus low or moderate NCAM.
APPENDIX A
KinetworkP KPKS-1.2 Protein Kinase Screen
Representative immunoblot comparing WIT vs G93A (mSOD) mice (upper panel) and chart demonstrating gender specific results from wild-type, pre-symptomatic and end-stage G93A mice (lower panel). Arrows indicate Akt (PKB) findings.
BAD and p-BAD Protein Content (Mixed Hindlimb Skeletal Muscle): G93A vs. WIT Ctrls
Representative blots (A, C) and graphed values (B, D) for BAD and phospho-BAD. Values are reported as means + SE (n=2-4 per group). W/T Ctrl = age-matched wild-type control; PS = G93A. pre-symptomatic; SO = G93A. symptom onset; SS = G93A, severe symptoms; ES = G93A, end-stage.
APPENDIX C
Cryosectioning and Immunohistochernical Staining
OCT Mounting
1. Immerse bottom of mould (tip of 50 rnL falcon tube) into liquid nitrogen to keep cold; fill bottom of tube with OCT medium (Tissue Tek) and let partially set.
2. Mount frozen sample length-wise into partially set OCT, and then completely cover sample with OCT - ensure that mold is immersed in liquid nitrogen until OCT is completely set and you can no longer see the sample (approx. 1-2 minutes). Ensure sample remains frozen.
3. After letting sample sit for approx. 1 minute, remove OCT mold from tube (tap gently on lab-top), wrap tightly in parafilm, and store at -80 degrees.
Cryosectioning
Cryostat settings as follows: Section thickness: 12-14 pm Box temperature: -23 degrees Celsius Object temperature: -17 degrees Celsius ** these settings may need to be adjusted, dependent upon tissue used etc. Ensure all apparatus is clean; wipe down with ethanol (especially blade). Pour enough acetone into plastic dishes to cover slides completely. Place dishes into cryostat chamber in order to keep ice-cold. Place a small amount of OCT onto ice-cold stage and quickly mount sample onto stage. Use extra OCT if needed to ensure that the sample is adhered securely to stage. Place stage onto block and align sample with blade. Using a razor blade, carefully trim any excess OCT around sample -too much OCT will cause samples not to stick to slides; slice a number of sample sections prior to mounting on slides to ensure that conditions are appropriate. Place poly-L-lysine coated (Sigma) slides into chamber approximately 30 seconds prior to mounting sections - slides must be chilled, but samples will not adhere if slides are too cold. Carefully and quickly mount individual sections onto slide - once slide is full (approximately 6 sections), immediately immerse in ice-cold acetone for 10 minutes for tissue fixation. Drain slides and wash 3x2 minutes in 1X PBS. Place slides in rack to air-dry.
10. Proceed with IHC or store slides at 4OC until use.
87
Immunohistochemical Staining
Place filter paper on floor of humidifier and soak with water - ensure that humidifier is placed on an even surface. Place slides in humidifier and re-hydrate sections by washing with lx PBS (3x2 minutes). Prepare blocking buffer in 15-50 mL falcon tube, depending upon desired volume (see recipes). Blocking - 30 minutes at room temperature. Drain all PBS, immerse sections completely in blocking buffer and check after 15 minutes to ensure that blocking buffer has not evaporated. Drain blocking buffer. Prepare primary antibodies at appropriate dilutions in 15 mL falcon tube (see recipes). Primary antibody - 90 minutes at room temperature. Ensure all sections are completely immersed. Check often for evaporation. Control slide(s) to be used for background levels of immunofluorescence should m b e incubated with primary antibody - incubate with lx PBS only for 90 minutes. Wash sections with l x PBS (3x5 minutes). Prepare secondary antibodies in dark to desired concentrations, in 1.5 rnL eppendorf tubes covered in tin foil. If using 2 separate secondary antibodies (double labelling), they may be made up to appropriate concentrations in the same tube (see recipes).
10. Secondary antibody - 30 minutes at room temperature (DARK). While incubating with secondary antibodies, keep room dark and place tin foil over sections.
11. Secondary antibody can be applied to control slide(s) as per protocol. 12. Wash with lx PBS (3x5 minutes). Place slides in rack and air dry. 13. Add a small drop of Vectashield Mounting Medium (Vector Laboratories) to the
centre of each slide. Carefully lower cover slip over Vectashield, making sure to avoid bubbles.
14. Once Vectashield has evenly dispersed under cover slip, seal with clear nail polish and let dry.
15. Store at 4OC.
** Note: once secondary antibody step has been reached, all further steps should be completed in the dark and slides should not be left out in light. This will cause secondary antibody to fade.
Imaging
1. Always log into UV Lamp book - make sure to log hours used at start of session, and hours on clock when session is complete.
2. IN ORDER, turn on UV lamp, followed by camera (top of camera), followed by software. (When finished turn off equipment in reverse order).
3. Open software package MetaVue (note: the camera must be turned on in order for MetaVue to open).
4. Ensure shutter is closed, and eye-piece view is selected (side of microscope). 5. Place slide under lens and select appropriate filter cube:
U-MNIBA narrow-band cube filter: Fluorescein (FITC) (peak excitation 490nm; emission at 520nm - green). Note: the visible light hitting the sections will appear blue; sections will immunofluoresce green U-MWIG wide-band cube filter: cy-3 (peak excitation 550nm; emission at 570nm -red). Note: the visible light hitting the sections will appear green; sections will immunofluoresce red.
6. Select appropriate lens, focus slides through eye-piece, and then switch view to camera.
7. Through MetaVue, select "Acquire" + "Acquire from Coolsnap" + set conditions: Acquire Menu: a) Select "Intensity Image"
b) Adjust "Exposure Time" (100 ms to start - if strong signal, decrease exposure time; weak signal, increase exposure time)
Region Menu: Select "Entire Chip" Colour Balancing: Select "Image Type" + "Fluorescence" Preferences: No need for adjustment
8. Select "Start Focusing" 9. Camera will be taking images every 100 ms (selected exposure time). Adjust
the following settings prior to acquiring final image: a) Select "pseudo colour" on side menu bar of image - if
you are imaging a cy3 secondary, you may want to choose red; fluorescein - choose green
b) Adjust exposure time if necessary c) Acquire Menu: click on "Adjust Digital Contrast Icon"
- adjust brightness and contrast to suitable levels 10. Once image parameters are set, select "Stop Focus" + "Acquire Image";
close shutter. * ALWAYS ENSURE THAT SHUTTER IS CLOSED WHEN NOT IN USE - EXPOSURE TO THE U.V. LIGHT WILL FADE SIGNAL OVER TIME.
11. For double labelling of secondary antibodies (e.g. cy3 and FITC), ensure that slide is not moved, and repeat steps 5-10 for the alternate secondary antibody.
Note: Once optimal settings have been decided for Exposure Time, Brightness and Contrast, these values should remain constant when all further imaging is conducted using the corresponding fluorophore-conjugated secondary antibody. This contributes to consistency for comparison of sections throughout the experiment.
Image Overlay
1. On main menu, select "Display" + "Overlay Images" 2. In "Overlay Images Window": a) number of images should read 3
b) select correct source image for each colour of overlay e.g. FITC image for green source, cy3 image for red source c) select "Apply Overlay"
3. A new window will appear with your overlaid image.
Saving an Image
1. Save as TIFF file for use within MetaVue software 2. Save a copy as an 8-bit TIFF to use with other software packages
On main menu, select "Display" + "Scale Image" + copy to 8-bit
Removing Background
1. Ensure that settings for exposure time, brightness/contrast are adjusted appropriately.
2. On main menu, select "Measure" + "Threshold Image" 3. Adjust lower limit of threshold to remove background imrnunofluorescence as per
levels removed in slides with secondary antibody only.
Recipes
Blocking Buffer
For 10 mL blocking buffer: 0.4 mL 100% donkey serum (since donkey secondary ab's) 0.4 mL 10% BSA 9.2 mL l x PBS
Primary Antibody
Make up to appropriate concentration in blocking buffer
For example:
1 mL / 1:100 = 10 pL of Ab; 990 pL of blocking buffer 1 mL / 1:200 = 5 pL of Ab; 995 pL of blocking buffer 1 mL / 1:400 = 2.5 pL of Ab; 997.5 pL of blocking buffer
Secondary Antibody (Fluorophore-conjugated)
Make up to appropriate concentration in l x PBS, in dark room
REFERENCES
Alberts, B., Bray, D., Lewis, J., Raff, M., Roberts, K. and Watson, J.D., 1994. Molecular Biology of the Cell. Garland Publishing Inc., New York, pp. 1 174-1 175.
Alessi, D. R., Andjelkovic, M., Caudwell, B., Cron, P., Morrice, N., Cohen, P. and Hemmings, B. A., 1996. Mechanism of activation of protein kinase B by insulin and IGF-1. Embo J. 15,6541-6551.
Alessi, D. R. and Cohen, P., 1998. Mechanism of activation and function of protein kinase B. Curr Opin Genet Dev. 8, 55-62.
Allen, D. L., Linderman, J. K., Roy, R. R., Bigbee, A. J., Grindeland, R. E., Mukku, V. and Edgerton, V. R., 1997. Apoptosis: a mechanism contributing to remodeling of skeletal muscle in response to hindlimb unweighting. Am J Physiol. 273, C579- 587.
Alway, S. E., Degens, H., Krishnamurthy, G. and Chaudhrai, A., 2003. Denervation stimulates apoptosis but not Id2 expression in hindlimb muscles of aged rats. J Gerontol A Biol Sci Med Sci. 58,687-697.
Andjelkovic, M., Alessi, D. R., Meier, R., Fernandez, A., Lamb, N. J., Frech, M., Cron, P., Cohen, P., Lucocq, J. M. and Hemrnings, B. A., 1997. Role of translocation in the activation and function of protein kinase B. J Biol Chem. 272, 3 15 15-3 1524.
Appel, S. H., Beers, D., Siklos, L., Engelhardt, J. I. and Mosier, D. R., 2001. Calcium: the Darth Vader of ALS. Amyotroph Lateral Scler Other Motor Neuron Disord. 2 Suppl 1, S47-54.
Banker, B. Q., and Engel A.G., 1994. Basic reactions of muscle. In: Engel, A. G., and Franzini-Armstrong, C. (Ed.), Myology: basic and clinical. McGraw-Hill, New York, pp. 832-888.
Barton, E. R., Morris, L., Musaro, A., Rosenthal, N. and Sweeney, H. L., 2002. Muscle- specific expression of insulin-like growth factor I counters muscle decline in mdx mice. J Cell Biol. 157, 137-148.
Bertelli, D. F., Ueno, M., Amaral, M. E., Toyama, M. H., Carneiro, E. M., Marangoni, S., Carvalho, C. R., Saad, M. J., Velloso, L. A. and Boschero, A. C., 2003. Reversal of denervation-induced insulin resistance by SHIP2 protein synthesis blockade. Am J Physiol Endocrinol Metab. 284, E679-687.
Bodine, S. C., Stitt, T. N., Gonzalez, M., Kline, W. O., Stover, G. L., Bauerlein, R., Zlotchenko, E., Scrimgeour, A., Lawrence, J. C., Glass, D. J. and Yancopoulos, G. D., 2001. AktJmTOR pathway is a crucial regulator of skeletal muscle hypertrophy and can prevent muscle atrophy in vivo. Nat Cell Biol. 3, 1014-1019.
Borisov, A. B., Dedkov, E. I. and Carlson, B. M., 2001. Interrelations of myogenic response, progressive atrophy of muscle fibers, and cell death in denervated skeletal muscle. Anat Rec. 264, 203-21 8.
Brackenbury, R., Thiery, J. P., Rutishauser, U. and Edelman, G. M., 1977. Adhesion among neural cells of the chick embryo. I. An immunological assay for molecules involved in cell-cell binding. J Biol Chem. 252,6835-6840.
Brown, M. C., Holland, R. L. and Hopkins, W. G., 1981. Motor nerve sprouting. Annu Rev Neurosci. 4, 17-42.
Brown, R. H., Jr., 1995. Superoxide dismutase in familial amyotrophic lateral sclerosis: models for gain of function. Curr Opin Neurobiol. 5, 841-846.
Brunet, A., Bonni, A., Zigmond, M. J., Lin, M. Z., Juo, P., Hu, L. S., Anderson, M. J., Arden, K. C., Blenis, J. and Greenberg, M. E., 1999. Akt promotes cell survival by phosphorylating and inhibiting a Forkhead transcription factor. Cell. 96, 857- 868.
Burgering, B. M. and Coffer, P. J., 1995. Protein kinase B (c-Akt) in phosphatidylinositol-3-OH kinase signal transduction. Nature. 376, 599-602.
Cardone, M. H., Roy, N., Stennicke, H. R., Salvesen, G. S., Franke, T. F., Stanbridge, E., Frisch, S. and Reed, J. C., 1998. Regulation of cell death protease caspase-9 by phosphorylation. Science. 282, 13 18-1321.
Cashman, N. R., Covault, J., Wollman, R. L. and Sanes, J. R., 1987. Neural cell adhesion molecule in normal, denervated, and myopathic human muscle. Ann Neurol. 21, 481-489.
Chiu, A. Y., Zhai, P., Dal Canto, M. C., Peters, T. M., Kwon, Y. W., Prattis, S. M. and Gurney, M. E., 1995. Age-dependent penetrance of disease in a transgenic mouse model of familial amyotrophic lateral sclerosis. Mol Cell Neurosci. 6, 349-362.
Coffer, P. J., Jin, J. and Woodgett, J. R., 1998. Protein kinase B (c-Akt): a multifunctional mediator of phosphatidylinositol3-kinase activation. Biochem J. 335 ( Pt I), 1-13.
Covault, J. and Sanes, J. R., 1985. Neural cell adhesion molecule (N-CAM) accumulates in denervated and paralyzed skeletal muscles. Proc Natl Acad Sci U S A. 82, 4544-4548.
Covault, J. and Sanes, J. R., 1986. Distribution of N-CAM in synaptic and extrasynaptic portions of developing and adult skeletal muscle. J Cell Biol. 102,716-730.
Crowder, R. J. and Freeman, R. S., 1998. Phosphatidylinositol 3-kinase and Akt protein kinase are necessary and sufficient for the survival of nerve growth factor- dependent sympathetic neurons. J Neurosci. 18,2933-2943.
Datta, S. R., Dudek, H., Tao, X., Masters, S., Fu, H., Gotoh, Y. and Greenberg, M. E., 1997. Akt phosphorylation of BAD couples survival signals to the cell-intrinsic death machinery. Cell. 91, 23 1-241.
Day, C. S., Buranapanitkit, B., Riano, F. A., Tomaino, M. M., Somogyi, G., Sotereanos, D. G., Kuroda, R. and Huard, J., 2002. Insulin growth factor-1 decreases muscle atrophy following denervation. Microsurgery. 22, 144-15 1.
del Peso, L., Gonzalez-Garcia, M., Page, C., Herrera, R. and Nunez, G., 1997. Interleukin-3-induced phosphorylation of BAD through the protein kinase Akt. Science. 278,687-689.
Delbono, O., 2003. Neural control of aging skeletal muscle. Aging Cell. 2, 21-29.
Derave, W., Van Den Bosch, L., Lemmens, G., Eijnde, B. O., Robberecht, W. and Hespel, P., 2003. Skeletal muscle properties in a transgenic mouse model for amyotrophic lateral sclerosis: effects of creatine treatment. Neurobiol Dis. 13, 264-272.
Dobrowolny, G., Giacinti, C., Pelosi, L., Nicoletti, C., Winn, N., Barberi, L., Molinaro, M., Rosenthal, N. and Musaro, A., 2005. Muscle expression of a local Igf-1 isoform protects motor neurons in an ALS mouse model. J Cell Biol. 168, 193- 199.
Downward, J., 1998. Mechanisms and consequences of activation of protein kinase BIAkt. Curr Opin Cell Biol. 10, 262-267.
Downward, J., 1999. How BAD phosphorylation is good for survival. Nat Cell Biol. 1, E33-35.
Downward, J., 2004. PI 3-kinase, Akt and cell survival. Semin Cell Dev Biol. 15, 177- 182.
Dudek, H., Datta, S. R., Franke, T. F., Birnbaum, M. J., Yao, R., Cooper, G. M., Segal, R. A., Kaplan, D. R. and Greenberg, M. E., 1997. Regulation of neuronal survival by the serine-threonine protein kinase Akt. Science. 275,661-665.
Figarella-Branger, D., Nedelec, J., Pellissier, J. F., Boucraut, J., Bianco, N. and Rougon, G., 1990. Expression of various isoforms of neural cell adhesive molecules and their highly polysialylated counterparts in diseased human muscles. J Neurol Sci. 98, 21-36.
Fischer, L. R., Culver, D. G., Tennant, P., Davis, A. A., Wang, M., Castellano-Sanchez, A., Khan, J., Polak, M. A. and Glass, J. D., 2004. Amyotrophic lateral sclerosis is a distal axonopathy: evidence in mice and man. Exp Neurol. 185, 232-240.
Franke, T. F., Kaplan, D. R., Cantley, L. C. and Toker, A., 1997. Direct regulation of the Akt proto-oncogene product by phosphatidylinositol-3,4-bisphosphate. Science. 275,665-668.
Frey, D., Schneider, C., Xu, L., Borg, J., Spooren, W. and Caroni, P., 2000. Early and selective loss of neuromuscular synapse subtypes with low sprouting competence in motoneuron diseases. J Neurosci. 20,2534-2542.
~ f a s s , D. J., 2003a. Molecular mechanisms modulating muscle mass. Trends Mol Med. 9, 344-350.
Glass, D. J., 2003b. Signalling pathways that mediate skeletal muscle hypertrophy and atrophy. Nat Cell Biol. 5, 87-90.
Glazner, G. W. and Ishii, D. N., 1995. Insulinlike growth factor gene expression in rat muscle during reinnervation. Muscle Nerve. 18, 1433-1442.
Glazner, G. W., Morrison, A. E. and Ishii, D. N., 1994. Elevated insulin-like growth factor (IGF) gene expression in sciatic nerves during IGF-supported nerve regeneration. Brain Res Mol Brain Res. 25,265-272.
Goldberg, A. L., 1969. Protein turnover in skeletal muscle. 11. Effects of denervation and cortisone on protein catabolism in skeletal muscle. J Biol Chem. 244,3223-3229.
Gordon, T., Hegedus, J. and Tam, S. L., 2004. Adaptive and maladaptive motor axonal sprouting in aging and motoneuron disease. Neurol Res. 26, 174-185.
Gosztonyi, G., Naschold, U., Grozdanovic, Z., Stoltenburg-Didinger, G. and Gossrau, R., 2001. Expression of Leu-19 (CD56, N-CAM) and nitric oxide synthase (NOS) I in denervated and reinnervated human skeletal muscle. Microsc Res Tech. 55, 187-197.
Guegan, C. and Przedborsh, S., 2003. Programmed cell death in amyotrophic lateral sclerosis. J Clin Invest. 11 1, 153-161.
Gurney, M. E., Pu, H., Chiu, A. Y., Dal Canto, M. C., Polchow, C. Y., Alexander, D. D., Caliendo, J., Hentati, A,, Kwon, Y. W., Deng, H. X. and et al., 1994. Motor neuron degeneration in mice that express a human Cu,Zn superoxide dismutase mutation. Science. 264, 1772-1775.
Hayatsu, K. and De Deyne, P. G., 2001. Muscle adaptation during distraction osteogenesis in skeletally immature and mature rabbits. J Orthop Res. 19, 897- 905.
Hill, M. M., Andjelkovic, M., Brazil, D. P., Ferrari, S., Fabbro, D. and Hemrnings, B. A., 2001. Insulin-stimulated protein hnase B phosphorylation on Ser-473 is independent of its activity and occurs through a staurosporine-insensitive kinase. J Biol Chem. 276,25643-25646.
Hornberger, T. A., Hunter, R. B., Kandarian, S. C. and Esser, K. A., 2001. Regulation of translation factors during hindlimb unloading and denervation of skeletal muscle in rats. Am J Physiol Cell Physiol. 281, C179- 187.
Houenou, L. J., McManaman, J. L., Prevette, D. and Oppenheim, R. W., 1991. Regulation of putative muscle-derived neurotrophic factors by muscle activity and innervation: in vivo and in vitro studies. J Neurosci. 11,2829-2837.
Hu, J. H., Chernoff, K., Pelech, S. and Krieger, C., 2003a. Protein kinase and protein phosphatase expression in the central nervous system of G93A mSOD over- expressing mice. J Neurochem. 85,422-43 1.
Hu, J. H., Zhang, H., Wagey, R., Krieger, C. and Pelech, S. L., 2003b. Protein kinase and protein phosphatase expression in amyotrophic lateral sclerosis spinal cord. J Neurochem. 85,432-442.
Ito, Y., Sakagami, H. and Kondo, H., 1996. Enhanced gene expression for phosphatidylinositol3-kinase in the hypoglossal motoneurons following axonal crush. Brain Res Mol Brain Res. 37,329-332.
Jackrnan, R. W. and Kandarian, S. C., 2004. The molecular basis of skeletal muscle atrophy. Am J Physiol Cell Physiol. 287, (2834-843.
James, S. R., Downes, C. P., Gigg, R., Grove, S. J., Holmes, A. B. and Alessi, D. R., 1996. Specific binding of the Akt-1 protein kinase to phosphatidylinositol 3,4,5- trisphosphate without subsequent activation. Biochem J. 315 ( Pt 3), 709-713.
Jefferies, H. B., Fumagalli, S., Dennis, P. B., Reinhard, C., Pearson, R. B. and Thomas, G., 1997. Rapamycin suppresses 5'TOP mRNA translation through inhibition of p70s6k. Embo J. 16,3693-3704.
Kalliainen, L. K., Jejurikar, S. S., Liang, L. W., Urbanchek, M. G. and Kuzon, W. M., Jr., 2002. A specific force deficit exists in skeletal muscle after partial denervation. Muscle Nerve. 25, 3 1-38.
Kandel, E. S. and Hay, N., 1999. The regulation and activities of the multifunctional serinelthreonine b a s e AktPKB. Exp Cell Res. 253, 210-229.
Kang, H., Tian, L. and Thompson, W., 2003. Terminal Schwann cells guide the reinnervation of muscle after nerve injury. J Neurocytol. 32,975-985.
Kapeller, R. and Cantley, L. C., 1994. Phosphatidylinositol3-kinase. Bioessays. 16, 565- 576.
Kern, H., Boncompagni, S., Rossini, K., Mayr, W., Fano, G., Zanin, M. E., Podhorska- Okolow, M., Protasi, F. and Carraro, U., 2004. Long-term denervation in humans causes degeneration of both contractile and excitation-contraction coupling apparatus, which is reversible by functional electrical stimulation (FES): a role for myofiber regeneration? J Neuropathol Exp Neurol. 63,9 19-93 1.
Kust, B. M., Copray, J. C., Brouwer, N., Troost, D. and Boddeke, H. W., 2002. Elevated levels of neurotrophins in human biceps brachii tissue of amyotrophic lateral sclerosis. Exp Neurol. 177,419-427.
Kuwahara, K., Saito, Y., Kishimoto, I., Miyamoto, Y., Harada, M., Ogawa, E., Hamanaka, I., Kajiyama, N., Takahashi, N., Izumi, T., Kawakarni, R. and Nakao, K., 2000. Cardiotrophin-1 phosphorylates akt and BAD, and prolongs cell survival via a PI3K-dependent pathway in cardiac myocytes. J Mol Cell Cardiol. 32, 1385-1394.
Lai, K. M., Gonzalez, M., Poueyrnirou, W. T., Kline, W. O., Na, E., Zlotchenko, E., Stitt, T. N., Econornides, A. N., Yancopoulos, G. D. and Glass, D. J., 2004. Conditional activation of akt in adult skeletal muscle induces rapid hypertrophy. Mol Cell Biol. 24,9295-9304.
Langenbach, K. J. and Rando, T. A., 2002. Inhibition of dystroglycan binding to laminin disrupts the PBKIAKT pathway and survival signaling in muscle cells. Muscle Nerve. 26,644-653.
Lawlor, M. A., Feng, X., Everding, D. R., Sieger, K., Stewart, C. E. and Rotwein, P., 2000. Dual control of muscle cell survival by distinct growth factor-regulated signaling pathways. Mol Cell Biol. 20, 3256-3265.
Li, B., Xu, W., Luo, C., Gozal, D. and Liu, R., 2003a. VEGF-induced activation of the P13-WAkt pathway reduces mutant SOD1-mediated motor neuron cell death. Brain Res Mol Brain Res. 11 1, 155-164.
Li, M., Li, C. and Parkhouse, W. S., 2002. Differential effects of des IGF-1 on Erks, AKT-1 and P70 S6K activation in mouse skeletal and cardiac muscle. Mol Cell Biochem. 236, 115-122.
Li, M., Li, C. and Parkhouse, W. S., 2003b. Age-related differences in the des IGF-I- mediated activation of Akt-1 and p70 S6K in mouse skeletal muscle. Mech Ageing Dev. 124,771-778.
Love, F. M., Son, Y. J. and Thompson, W. J., 2003. Activity alters muscle reinnervation and terminal sprouting by reducing the number of Schwann cell pathways that grow to link synaptic sites. J Neurobiol. 54,566-576.
Lyons, G. E., Moore, R., Yahara, O., Buckingham, M. E. and Walsh, F. S., 1992. Expression of NCAM isoforms during skeletal myogenesis in the mouse embryo. Dev Dyn. 194,94-104.
Maroni, P., Bendinelli, P. and Piccoletti, R., 2003. Early intracellular events induced by in vivo leptin treatment in mouse skeletal muscle. Mol Cell Endocrinol. 201, 109- 121.
McComas, A. J., 1998. 1998 ISEK Congress Keynote Lecture: Motor units: how many, how large, what kind? International Society of Electrophysiology and Kinesiology. J Electromyogr Kinesiol. 8, 391-402.
Menzies, F. M., Ince, P. G. and Shaw, P. J., 2002. Mitochondria1 involvement in amyotrophic lateral sclerosis. Neurochem Int. 40, 543-55 1.
Migheli, A., Mongini, T., Doriguzzi, C., Chiado-Piat, L., Piva, R., Ugo, I. and Palmucci, L., 1997. Muscle apoptosis in humans occurs in normal and denervated muscle, but not in myotonic dystrophy, dystrophinopathies or inflammatory disease. Neurogenetics. 1, 81-87.
Millecamps, S., Nicolle, D., Ceballos-Picot, I., Mallet, J. and Barkats, M., 2001. Synaptic sprouting increases the uptake capacities of motoneurons in amyotrophic lateral sclerosis mice. Proc Natl Acad Sci U S A. 98,7582-7587.
Moscoso, L. M., Merlie, J. P. and Sanes, J. R., 1995. N-CAM, 43K-rapsyn, and S-laminin mRNAs are concentrated at synaptic sites in muscle fibers. Mol Cell Neurosci. 6, 80-89.
Mulder, D. W., 1982. Clinical limits of amyotrophic lateral sclerosis. Adv Neurol. 36, 15- 22.
Nagano, I., Murakami, T., Manabe, Y. and Abe, K., 2002. Early decrease of survival factors and DNA repair enzyme in spinal motor neurons of presymptomatic transgenic mice that express a mutant SOD1 gene. Life Sci. 72, 541-548.
Nave, B. T., Ouwens, M., Withers, D. J., Alessi, D. R. and Shepherd, P. R., 1999. Mammalian target of rapamycin is a direct target for protein lunase B: identification of a convergence point for opposing effects of insulin and amino- acid deficiency on protein translation. Biochem J. 344 Pt 2,427-43 1.
Pachter, B. R. and Eberstein, A., 1992. Long-term effects of partial denervation on sprouting and muscle fiber area in rat plantaris. Exp Neurol. 116, 246-255.
Pallafacchina, G., Calabria, E., Serrano, A. L., Kalhovde, J. M. and Schiaffino, S., 2002. A protein kinase B-dependent and rapamycin-sensitive pathway controls skeletal muscle growth but not fiber type specification. Proc Natl Acad Sci U S A. 99, 9213-9218.
Pelech, S. and Zhang, H., 2002. Plasticity of the lunomes in monkey and rat tissues. Sci STKE. 2002, PE50.
Pullen, N. and Thomas, G., 1997. The modular phosphorylation and activation of p70s6k. FEBS Lett. 410,78-82.
Rena, G., Guo, S., Cichy, S. C., Unterman, T. G. and Cohen, P., 1999. Phosphorylation of the transcription factor forkhead family member FKHR by protein lunase B. J Biol Chem. 274, 17179-17183.
Rieger, F., Grumet, M. and Edelman, G. M., 1985. N-CAM at the vertebrate neuromuscular junction. J Cell Biol. 101,285-293.
Rommel, C., Bodine, S. C., Clarke, B. A., Rossman, R., Nunez, L., Stitt, T. N., Yancopoulos, G. D. and Glass, D. J., 2001. Mediation of IGF-1-induced skeletal myotube hypertrophy by PI(3)K/Akt/mTOR and PI(3)K/Akt/GSK3 pathways. Nat Cell Biol. 3, 1009-1013.
Rosen, D. R., Siddique, T., Patterson, D., Figlewicz, D. A., Sapp, P., Hentati, A., Donaldson, D., Goto, J., O'Regan, J. P., Deng, H. X. and et al., 1993. Mutations in CuIZn superoxide dismutase gene are associated with familial amyotrophic lateral sclerosis. Nature. 362, 59-62.
Sacheck, J. M., Ohtsuka, A., McLary, S. C. and Goldberg, A. L., 2004. IGF-I stimulates muscle growth by suppressing protein breakdown and expression of atrophy- related ubiquitin ligases, atrogin- 1 and MuRFl. Am J Physiol Endocrinol Metab. 287, E591-601.
Sandri, M., 2002. Apoptotic signaling in skeletal muscle fibers during atrophy. Curr Opin Clin Nutr Metab Care. 5,249-253.
Sandri, M. and Carraro, U., 1999. Apoptosis of skeletal muscles during development and disease. Int J Biochem Cell Biol. 3 1, 1373-1390.
Sandri, M., Sandri, C., Gilbert, A., Skurk, C., Calabria, E., Picard, A., Walsh, K., Schiaffino, S., Lecker, S. H. and Goldberg, A. L., 2004. Foxo transcription factors induce the atrophy-related ubiquitin ligase atrogin-1 and cause skeletal muscle atrophy. Cell. 117,399-412.
Sartorelli, V. and Fulco, M., 2004. Molecular and cellular determinants of skeletal muscle atrophy and hypertrophy. Sci STKE. 2004, re1 1.
Sathasivam, S., Ince, P. G. and Shaw, P. J., 2001. Apoptosis in amyotrophic lateral sclerosis: a review of the evidence. Neuropathol Appl Neurobiol. 27,257-274.
Scheid, M. P. and Duronio, V., 1998. Dissociation of cytolune-induced phosphorylation of Bad and activation of PKBIakt: involvement of MEK upstream of Bad phosphorylation. Proc Natl Acad Sci U S A. 95,7439-7444.
Scheid, M. P. and Woodgett, J. R., 2001. PKBIAKT: functional insights from genetic models. Nat Rev Mol Cell Biol. 2,760-768.
Schmalbruch, H. and Lewis, D. M., 1994. A comparison of the morphology of denervated with aneurally regenerated soleus muscle of rat. J Muscle Res Cell Motil. 15,256-266.
Schmelzle, T. and Hall, M. N., 2000. TOR, a central controller of cell growth. Cell. 103, 253-262.
Schoser, B. G., Wehling, S. and Blottner, D., 2001. Cell death and apoptosis-related proteins in muscle biopsies of sporadic amyotrophic lateral sclerosis and polyneuropathy. Muscle Nerve. 24, 1083-1089.
Scott, P. H., Brunn, G. J., Kohn, A. D., Roth, R. A. and Lawrence, J. C., Jr., 1998. Evidence of insulin-stimulated phosphorylation and activation of the mammalian target of rapamycin mediated by a protein b a s e B signaling pathway. Proc Natl Acad Sci U S A. 95,7772-7777.
Shah, 0 . J., Anthony, J. C., Kimball, S. R. and Jefferson, L. S., 2000.4E-BP1 and S6K1: translational integration sites for nutritional and hormonal information in muscle. Am J Physiol Endocrinol Metab. 279, E715-729.
Simpson, E. P., Mosier, D. and Appel, S. H., 2002. Mechanisms of disease pathogenesis in amyotrophic lateral sclerosis. A central role for calcium. Adv Neurol. 88, 1-19.
Singleton, J. R. and Feldman, E. L., 2001. Insulin-like growth factor-I in muscle metabolism and myotherapies. Neurobiol Dis. 8, 541-554.
Stitt, T. N., Drujan, D., Clarke, B. A., Panaro, F., Timofeyva, Y., Kline, W. O., Gonzalez, M., Yancopoulos, G. D. and Glass, D. J., 2004. The IGF-llPI3WAkt pathway prevents expression of muscle atrophy-induced ubiquitin ligases by inhibiting FOX0 transcription factors. Mol Cell. 14, 395-403.
Stuerenburg, H. J. and Kunze, K., 1998. Tissue nerve growth factor concentrations in neuromuscular diseases. Eur J Neurol. 5,487-490.
Tews, D. S., 2002. Apoptosis and muscle fibre loss in neuromuscular disorders. Neuromuscul Disord. 12,6 13-622.
Tews, D. S., Behrhof, W. and Schindler, S., 2004. Expression patterns of initiator and effector caspases in denervated human skeletal muscle. Muscle Nerve. 3 1, 175- 181.
Tews, D. S., Goebel, H. H. and Meinck, H. M., 1997a. DNA-fragmentation and apoptosis-related proteins of muscle cells in motor neuron disorders. Acta Neurol Scand. 96,380-386.
Tews, D. S., Goebel, H. H., Schneider, I., Gunkel, A., Stennert, E. and Neiss, W. F., 1997b. Expression profile of stress proteins, intermediate filaments, and adhesion molecules in experimentally denervated and reinnervated rat facial muscle. Exp Neurol. 146, 125-134.
Theys, P. A,, Peeters, E. and Robberecht, W., 1999. Evolution of motor and sensory deficits in amyotrophic lateral sclerosis estimated by neurophysiological techniques. J Neurol. 246,438-442.
Toker, A., 2000. Protein kinases as mediators of phosphoinositide 3-kinase signaling. Mol Pharmacol. 57,652-658.
Toker, A. and Newton, A. C., 2000. Akt/protein kinase B is regulated by autophosphorylation at the hypothetical PDK-2 site. J Biol Chem. 275, 8271- 8274.
Urbanchek, M. G., Picken, E. B., Kalliainen, L. K. and Kuzon, W. M., Jr., 2001. Specific force deficit in skeletal muscles of old rats is partially explained by the existence of denervated muscle fibers. J Gerontol A Biol Sci Med Sci. 56, B191-197.
Vantler, M., Caglayan, E., Zimmermann, W. H., Baumer, A. T. and Rosenkranz, S., 2005. Systematic evaluation of anti-apoptotic growth factor signaling in vascular smooth muscle cells: Only phosphatidylinositol3'-kinase is important. J Biol Chem.
Veldink, J. H., Bar, P. R., Joosten, E. A., Otten, M., Wokke, J. H. and van den Berg, L. H., 2003. Sexual differences in onset of disease and response to exercise in a transgenic model of ALS. Neuromuscul Disord. 13,737-743.
Vukosavic, S., Dubois-Dauphin, M., Romero, N. and Przedborski, S., 1999. Bax and Bcl- 2 interaction in a transgenic mouse model of familial amyotrophic lateral sclerosis. J Neurochem. 73,2460-2468.
Wagey, R., Pelech, S. L., Duronio, V. and Krieger, C., 1998. Phosphatidylinositol3- kinase: increased activity and protein level in amyotrophic lateral sclerosis. J Neurochem. 71,7 16-722.
Warita, H., Manabe, Y., Murakami, T., Shiro, Y., Nagano, I. and Abe, K., 2001. Early decrease of survival signal-related proteins in spinal motor neurons of presymptomatic transgenic mice with a mutant SOD1 gene. Apoptosis. 6,345- 352.
Wilkes, J. J. and Bonen, A., 2000. Reduced insulin-stimulated glucose transport in denervated muscle is associated with impaired Akt-alpha activation. Am J Physiol Endocrinol Metab. 279, E9 12-9 19.
Woscholski, R. and Parker, P. J., 1997. Inositol lipid 5-phosphatases--traffic signals and signal traffic. Trends Biochem Sci. 22,427-43 1.
Yang, E., Zha, J., Jockel, J., Boise, L. H., Thompson, C. B. and Korsmeyer, S. J., 1995. Bad, a heterodimeric partner for Bcl-XL and Bcl-2, displaces Bax and promotes cell death. Cell. 80, 285-291.
Yao, R. and Cooper, G. M., 1995. Requirement for phosphatidylinositol-3 kinase in the prevention of apoptosis by nerve growth factor. Science. 267,2003-2006.
Yim, M. B., Kang, J. H., Yim, H. S., Kwak, H. S., Chock, P. B. and Stadtman, E. R., 1996. A gain-of-function of an amyotrophic lateral sclerosis-associated Cu,Zn- superoxide dismutase mutant: An enhancement of free radical formation due to a decrease in Krn for hydrogen peroxide. Proc Natl Acad Sci U S A. 93,5709-5714.
Zha, J., Harada, H., Yang, E., Jockel, J. and Korsmeyer, S. J., 1996. Serine phosphorylation of death agonist BAD in response to survival factor results in binding to 14-3-3 not BCL-X(L). Cell. 87,619-628.


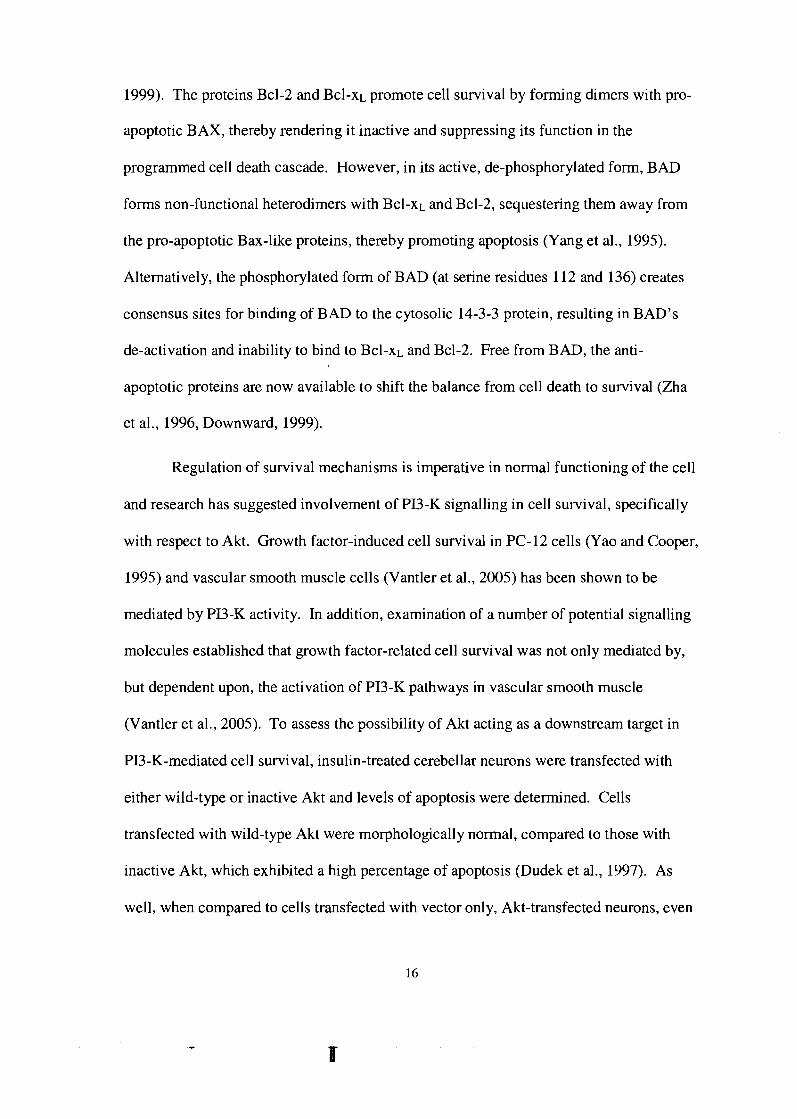


![Rewiring cellular metabolism via the AKT/mTOR pathway ... · glycolysis is an important component of host defence in murine models of tuberculosis [7, 8]. Taking these studies further,](https://static.documents.pub/doc/80x56/5fd4840ddd0f73539b6a8448/rewiring-cellular-metabolism-via-the-aktmtor-pathway-glycolysis-is-an-important.jpg)


![REVIEW Open Access Regulation of skeletal muscle growth by ... · IGF1-Akt pathway was not investigated [14]. Activa-tion of IRS types is inhibited by phosphorylation of serine residues](https://static.documents.pub/doc/80x56/6081215dbbc1e17f4e2fb13d/review-open-access-regulation-of-skeletal-muscle-growth-by-igf1-akt-pathway.jpg)


