INCREASING MOBILITY IN THE HOSPITAL SETTING Cynthia J. Brown, MD, MSPH Gwen McWhorter, Ed.D., Endowed Chair in Geriatric Medicine Director, Division of Gerontology, Geriatrics, and Palliative Care Director, Comprehensive Center for Healthy Aging Vice Chair, Faculty and Staff Development, Dept of Medicine
Transcript
INCREASING MOBILITY IN THE HOSPITAL SETTING
Cynthia J. Brown, MD, MSPHGwen McWhorter, Ed.D., Endowed Chair in Geriatric Medicine
Director, Division of Gerontology, Geriatrics, and Palliative CareDirector, Comprehensive Center for Healthy Aging
Vice Chair, Faculty and Staff Development, Dept of Medicine
OBJECTIVES/ DISCLOSURES
After attendance at this lecture, participants will be able to:1. Describe prevalence and outcomes of hospital-associated
disability.2. Summarize interventions that have been successfully used in
the hospital setting to increase mobility.3. Define elements needed to create the necessary culture
change to promote hospital mobility
No disclosures to report
SCOPE OF THE PROBLEM
CONSEQUENCES OF LOW MOBILITY
• Many observed geriatric syndromes related to bed rest and low mobility during hospitalization:• Delirium• Pressure Ulcers• ADL Decline• Incontinence• Falls
CONSEQUENCES OF BED REST AND HOSPITALIZATION
Creditor MC Ann Intern Med 1995
STUDY OF MOBILITY: THE EARLY YEARS
Pre-2005, limited methods to measure mobility• Chart review of physician activity orders1
• Brief surveys of patient location2
• Periodic nursing reports3
• Direct observation of hallways4
In 2009, first paper published using accelerometers5
1 Lazarus BA, et al. Arch Intern Med, 1991; 2 Warshaw G, et al. JAMA 1982; 3 Brown CJ, et al. J Am Geriatr Soc, 2004;4 Callen BL, et al. Geriatr Nurs 2004; 5 Brown CJ, et al. J Am Geriatr Soc, 2009
DEFINITION AND FREQUENCY OF LOW MOBILITY
• Low mobility, defined as bed rest or bed to chair activity, common during hospitalization.
• 83% of hospital stay spent in bed• 43 min/day spent standing/walking; Results
Environment encourages bed restLack of ambulatory devices
Treatment-related factorsHospital devices
Admitting diagnosisSide effects of medications
Attitudinal factorsAttitude toward mobility
Expectation of hospital stayConcern about falls
PATIENT
MODEL OF POTENTIAL BARRIERS
Brown CJ, et al. J Hosp Med, 2009
BARRIER: ENVIRONMENT
“I think it is just that patients, when they are in the hospital, they feel they are supposed to be in bed. And they are more comfortable there and a lot of times they can see the TV better.”
- a Doctor
BARRIERS TO HOSPITAL MOBILITY
PREVALENCE AND OUTCOMES
• 498 hospitalized medical patients, age ≥ 70 years• Mobility scale based on nurse report:
–degree of assistance needed –number of times transferred and ambulated
• Average of mobility observations for each patient, scores trichotomized–Low mobility: bed rest or bed to chair– Intermediate mobility–High mobility
Brown CJ, Friedkin RJ, Inouye SK. J Am Geriatr Soc. 2004.
RISK OF ADVERSE OUTCOMES BY MOBILITY LEVEL
Brown CJ, et al. JAGS 2004
IMPACT OF 10 DAYS OF BED REST IN HEALTHY OLDER ADULTS
• Showed provision of mobility by techs feasible and safe.• 3 in-hospital falls, all in control group
• No change in ADLs; community mobility maintained in MP, and declined in UC.
Usual CareMobility Program P value
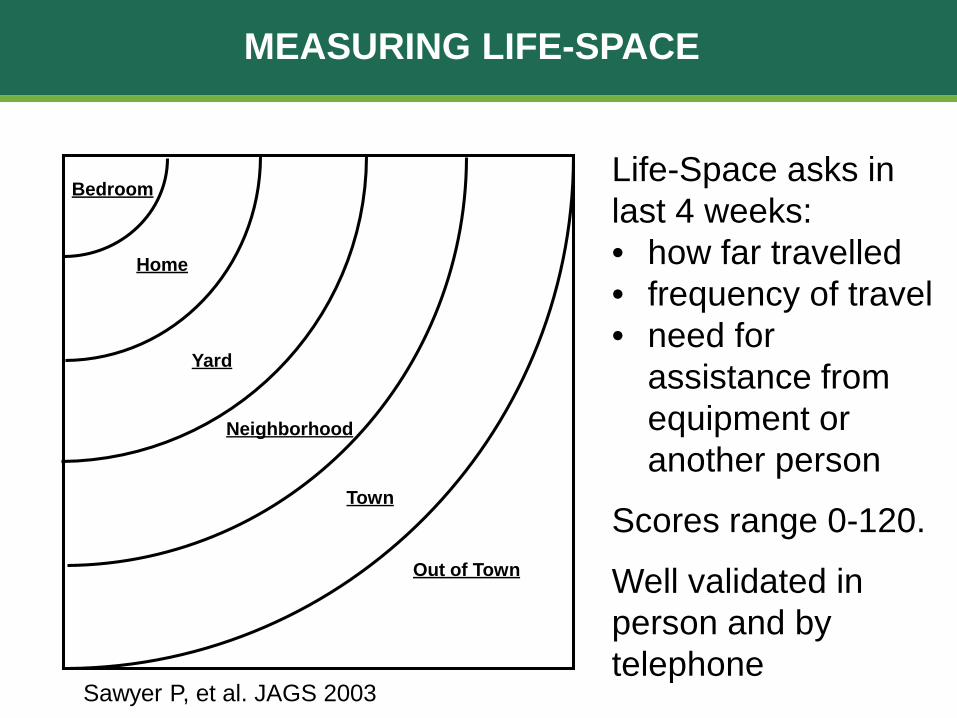
Baseline LSA 51.5 (21.1) 53.9 (29.4) 0.4
Post-Hospital LSA 41.6 (21.5) 52.5 (29.0) .0096
P-values for group differences between pre and post hospital outcomes adjusted for baseline, age, gender, race
MOVE TOWARD PRAGMATIC TRIALS
MOBILITY ASSESSMENTS
Attaching monitors not practical due to time and expense.Need method to measure mobility on all hospitalized patients.One available assessment relies on nurse observation of patient mobility. Johns Hopkins Highest Level of Mobility Scale
Hoyer E, J Hosp Med, 2016
VALIDATION OF THE ACUTE CARE MOBILITY ASSESSMENT (ACMA)
• Study Purpose: validate brief self-reported mobility assessment to measure frequency of out-of-bed activity during hospitalization.
• Recruitment:• Cognitively intact hospitalized adults age ≥ 65 years• Able to walk prior to admission
• 63 consented, 12 not used in analysis • lack of at least 22 hours of StepWatch data (n=10) • lack of patient data due to transfer to higher level of
care (n=2)• Accelerometer (StepWatch) worn for 24 hours • Assessments completed after accelerometer data
collected
ASSESSMENTS
Patients• Age• Self-identified gender &
race/ethnicity• Acute Care Mobility
Assessment
Medical Records• Charlson Comorbidity Index
Nurses• Katz index (prior to
admission; current)• Johns Hopkins Highest Level
of Mobility Scale
AnalysisUsed Spearman correlation coefficient comparing steps taken and time spent walking with ACMA and JH-HLM scale
ACUTE CARE MOBILITY ASSESSMENT (ACMA)
BASELINE CHARACTERISTICS
Characteristics (N=51) Mean (SD) or N (%)
Age, years, mean (SD) 74.3 (6.2)Self-identified Gender
FemaleMale
32 (63%)19 (37%)
Self-identified RaceAfrican-American WhiteAsian
29 (57%)20 (39%)2 (4%)
Katz ADL Score Prior to Admission, mean (SD), n=49 11.4 (2.0)Katz ADL Score at Study Entry, mean (SD), n=49 10.3 (2.9)Charlson Comorbidity Index, mean (SD) 1.98 (1.9)Steps Taken, mean (SD)
Range660 (662) 10 - 2831
Johns Hopkins-Highest Level of Mobility Score (n=43) 6.0 (1.3)
PROPORTION OF PATIENTS ACHIEVING EACH LEVEL
N (%) 1X 2X 3X ≥4XSat in chair or side of bed 51
(100%)4
(8%)4
(8%)5
(10%)38
(74%)
Walked in room 51 (100%)
2 (4%)
6 (12%)
4 (8%)
39 (76%)
Walked in hallway 25 (49%)
9 (18%)
4 (8%)
6 (12%)
6 (12%)
Walked off the unit 6 (12%)
2 (4%)
2 (4%)
2 (4%)
0
SPEARMAN CORRELATION
ACMA r p-value JH-HLM r p-valueTotal # of Steps 0.84 <.0001 0.64 <.0001
Total Time Walking 0.67 <.0001 0.54 0.0002
JH-HLM scale 0.59 <.0001
• Most highly correlated included only levels with walking;
• Did not include sitting or need for help.
POTENTIAL REVISION OF ACMA
STRENGTHS/ LIMITATIONS
Strengths:• Done in general medical population, not limited by
disease. • Representation of both genders and white/black (but
not other race/ethnicities). • Easy to complete, takes less than 3 minutes to get
information. Limitations:• Patients have to be cognitively intact enough to
complete scale• Not perfect correlation. • Not tied to outcomes (yet).
HOSPITAL CULTURE CHANGE
CULTURE CHANGE AROUND MOBILITY
Three key elements to culture change:• Team members must be able to articulate
what being proposed.• Team members need to understand the
Physical Therapy: • Too few PTs to walk hospitalized patients; often not
skilled needNursing:
• Responsibilities increased significantly; more documentation, less patient care time.
• Many report not feeling comfortable walking patientsFamily:
• Need education and trainingVolunteers:
• Successful in programs like HELP; need robust training program
Transporters: • Successful in small pilot study; have other job
responsibilities
ENVIRONMENT ENCOURAGES LOW MOBILITY
• Not well studied
RE-ENVISIONING HOSPITAL ROOM DESIGN
2017 Environment for Aging (EFA) ConferenceBarbara Miszkiel OAA, MRAIC, LEED AP, EDAC and colleagues
GLOBAL POLICIES ENCOURAGE LOW MOBILITY
• Safety/ Fall Prevention• Falls with injury a “Never Event” per CMS in 20081
• Hospitals responded with robust Fall Prevention programs
• Key components of most fall prevention programs:• Patient to call for assistance prior to out of bed• Patient education regarding fall
prevention• Patient identification as fall risks• Bed and chair alarms
1Inouye, Brown, Tinetti. NEJM 2009
MOBILITY AS QUALITY INDICATOR
• Change focus from Fall Prevention to Safe Mobility• AGS published white paper recommending mobility
as QI measure• Centers for Medicare and Medicaid Innovation
project targets mobility in 300+ hospitals
• John A. Hartford Foundation’s Age-Friendly Health System includes Mobility as one of 4 M’s
UAB MOBILITY INITIATIVE
• Phase 1: Staff education via UAB Learning System• Phase 2: Train-the-Trainers; Focused on coaching• Phase 3: Unit coaching by trainers/championso Address gaps identified by nurse managero 1:1 or group coaching on addressing barrierso Mobility leaders spot check, provide feedback
• Phase 4: Sustainmento “Booster” education provided by mobility teamo Accountability monitoring by Directors, Managerso Mobility in Nursing/PCT orientationo Gait Belt training as part of annual comps
Slides courtesy of Helen Matthews, PT and Kellie Flood, MD
46 DAY MOBILITY TECH PILOT
PILOT: INTERVENTIONS PROVIDED
TAKE HOME POINTS
• Older adults spend significant proportion of hospital stay in bed.
• Many barriers to hospital mobility modifiable.
• Mobility programs have been shown to be feasible, safe and efficacious.
• Culture change is required to integrate hospital mobility as a best practice.
INCREASING MOBILITY IN THE HOSPITAL SETTING
Cynthia J. Brown, MD, MSPHGwen McWhorter, Ed.D., Endowed Chair in Geriatric Medicine
Director, Division of Gerontology, Geriatrics, and Palliative CareDirector, Comprehensive Center for Healthy Aging
Vice Chair, Faculty and Staff Development, Dept of [email protected]