Division of Pharmaceutical Technology Faculty of Pharmacy University of Helsinki Finland Increasing process understanding of wet granulation by spectroscopic methods and dimension reduction tools by Anna Cecilia Jørgensen Academic dissertation To be presented, with the permission of the Faculty of Pharmacy of the University of Helsinki, for public criticism in Auditorium 1 at Viikki Infocentre (Viikinkaari 11) on October 9 th , 2004, at 12 noon Helsinki 2004
Transcript
Division of Pharmaceutical Technology Faculty of Pharmacy
University of Helsinki Finland
Increasing process understanding of wet granulation by
spectroscopic methods and dimension reduction tools
by
Anna Cecilia Jørgensen
Academic dissertation
To be presented, with the permission of the Faculty of Pharmacy of the University of Helsinki,
for public criticism in Auditorium 1 at Viikki Infocentre (Viikinkaari 11) on October 9th, 2004, at 12 noon
Helsinki 2004
Supervisors: Docent Jukka Rantanen Viikki Drug Discovery Technology Center Division of Pharmaceutical Technology Faculty of Pharmacy University of Helsinki Finland Prof. Jouko Yliruusi Division of Pharmaceutical Technology Faculty of Pharmacy University of Helsinki Finland
Reviewers: Prof. Jari Yli-Kauhaluoma Division of Pharmaceutical Chemistry Faculty of Pharmacy University of Helsinki Finland Dr. Poul Bertelsen Nycomed Danmark ApS Roskilde Denmark
Opponent: Prof. Kenneth R. Morris Department of Industrial and Physical Pharmacy Purdue University West Lafayette
2 Theory and literature survey _________________________________________ 3
2.1 Solid-state of drugs __________________________________________________ 3 2.1.1 Definitions ______________________________________________________________3 2.1.2 Relative stability of the solid states ___________________________________________4 2.1.3 Impact of different solid states on the properties of solids _________________________7
2.2 Techniques for analysing the solid state of drugs _________________________ 9 2.2.1 X-ray diffraction _________________________________________________________9 2.2.2 Infrared spectroscopy ____________________________________________________10 2.2.3 Near-infrared spectroscopy ________________________________________________11 2.2.4 Raman spectroscopy _____________________________________________________13 2.2.5 Nuclear magnetic resonance spectroscopy ____________________________________14 2.2.6 Microscopy ____________________________________________________________15 2.2.7 Thermal methods ________________________________________________________16
2.3 Wet agglomeration _________________________________________________ 17 2.3.1 Agglomeration mechanisms _______________________________________________17 2.3.2 Process monitoring of agglomeration in high-shear mixers _______________________18
2.4 Approaches to increase process understanding __________________________ 21 2.4.1 Anticipation of processing-induced transformations _____________________________21 2.4.2 Regulatory perspectives___________________________________________________23 2.4.3 Process analytical technology tools __________________________________________24
3 Aims of the study _________________________________________________ 29
4.4 Characterization of wet masses and granules ___________________________ 33
4.5 Data analysis ______________________________________________________ 35 4.5.1 Combination of process data to a process vector________________________________35 4.5.2 Principal components analysis______________________________________________35 4.5.3 Self-organizing maps_____________________________________________________35
5 Results and discussion_____________________________________________ 36
5.1 Hydrate formation during wet granulation _____________________________ 36 5.1.1 Detection of hydrate formation during granulation ______________________________36 5.1.2 Comparison of Raman and near-infrared spectroscopy___________________________37 5.1.3 Differences between theophylline and caffeine_________________________________39 5.1.4 Effect of excipients on hydrate formation _____________________________________40 5.1.5 Effect of hydrate formation mechanism on liquid requirement of wet granulation______41
5.2 Monitoring wet granulation in a high-shear mixer _______________________ 42 5.2.1 Near-infrared spectroscopy versus impeller torque ______________________________42 5.2.2 Effect of hydrate formation on impeller torque _________________________________44
5.3 Projections of wet granulation processes _______________________________ 44 5.3.1 Principal components analysis in visualising an anhydrous to hydrate transition _______44 5.3.2 Comparison of principal components analysis and self-organizing map______________45
This study was carried out at the Division of Pharmaceutical Technology, Faculty of
Pharmacy, University of Helsinki, Finland, during the years 2000-2004. The
experimental work was performed at the above mentioned institution; at the Department
of Pharmaceutics at the Danish University of Pharmaceutical Sciences, Copenhagen,
Denmark; and at Product Development, AstraZeneca R&D Mölndal, Sweden.
This thesis is based on original publications listed on page v. Some readers may
find it useful to read those before reading the experimental and results & discussion
sections of the thesis. The terms granule and agglomerate are used interchangeably in
this thesis, although it is recognized that the definition of agglomerate is usually
broader.
iii
List of abbreviations and acronyms
API Active pharmaceutical ingredient
DSC Differential scanning calorimetry
EMEA European Agency for the Evaluation of Medicinal Products
FDA Food and Drug Administration (in the United States)
ICH International Conference on Harmonization
IR Infrared
MCC Microcrystalline cellulose
MTR Mixer torque rheometry or mixer torque rheometer
NIR Near-infrared
NMR Nuclear magnetic resonance
PAC Process analytical chemistry
PAT Process analytical technology
PCA Principal components analysis or principal component analysis
Ph.Eur. European Pharmacopoeia
PITs Processing-induced transformations
PLS Partial least squares or projection to latent structures
SMCC Silicified microcrystalline cellulose
SOM Self-organizing map
Tf Temperature of fusion, melting temperature
Tt Transition temperature
TG Thermogravimetry
USP United States Pharmacopeia
XRPD X-ray powder diffraction
iv
List of original publications
This thesis is based on the following original papers, which are referred to in the text by
the Roman numerals I-VI.
I Räsänen, E., Rantanen, J., Jørgensen, A., Karjalainen, M., Paakkari, T. and
Yliruusi, J., 2001. Novel identification of pseudopolymorfic changes of
theophylline during wet granulation using near infrared spectroscopy. Journal of
Pharmaceutical Sciences 90 389-396.
II Jørgensen, A., Rantanen, J., Karjalainen, M., Khriachtchev, L., Räsänen, E. and
Yliruusi, J., 2002. Hydrate formation during wet granulation studied by
spectroscopic methods and multivariate analysis. Pharmaceutical Research 19
1285-1291.
III Airaksinen, S., Luukkonen, P., Jørgensen, A., Karjalainen, M., Rantanen, J. and
Yliruusi, J., 2003. Effects of excipients on hydrate formation in wet masses
containing theophylline. Journal of Pharmaceutical Sciences 92 516-528.
IV Jørgensen, A.C., Airaksinen, S., Karjalainen, M., Luukkonen, P., Rantanen, J. and
Yliruusi, J., 2004. Role of excipients in hydrate formation kinetics of theophylline
in wet masses studied by near-infrared spectroscopy. European Journal of
Pharmaceutical Sciences (accepted).
V Jørgensen, A.C., Luukkonen, P., Rantanen, J., Schæfer, T., Juppo, A.M. and
Yliruusi, J., 2004. Comparison of torque measurements and near-infrared
spectroscopy in characterization of a wet granulation process. Journal of
Pharmaceutical Sciences 93 2232-2243.
VI Jørgensen, A.C., Rantanen, J., Luukkonen, P., Laine, S. and Yliruusi, J., 2004.
Visualization of a pharmaceutical unit operation: wet granulation. Analytical
Chemistry (accepted).
v
1 INTRODUCTION
The ability to deliver a consistent quality is a prerequisite for remaining in business in
an industry as highly regulated and quality critical as the pharmaceutical sector (Miller,
2003). However, it is not easy to achieve the quality required. It has been estimated that
5-10% of pharmaceutical product batches have to be reworked or discarded, because
they do not meet their specifications (Abboud and Hensley, 2003). Additionally, in the
research based pharmaceutical field, the top 16 companies spent in 2001 36% of their
costs on manufacturing, whereas the research and development expenses were below
the half of this (16%). Thus, there is an increasing focus on making the manufacturing
more effective and optimizing processes to deliver consistent quality. In order to
achieve this, the level of process understanding has to be increased. The pharmaceutical
industry has been hesitant to implement new methods for process analysis and quality
control due to strict regulatory requirements. The picture has now changed, because the
U.S. regulatory agency encourages in implementing new technologies (FDA, 2003a,b).
Wet granulation is a commonly used unit operation in the pharmaceutical
industry. Granulation is mainly performed to produce suitable feed material for
tabletting or capsule filling. The objective of granulation is to improve powder flow and
handling, decrease dustiness, and prevent segregation of the constituents of the product.
Wet granulation is often carried out utilizing a high-shear mixer. The high-shear
granulation process is a rapid process which is susceptible for over-wetting. Thus, the
liquid amount added is critical and the optimal amount is affected by the properties of
the raw materials. Some of the excipients used in pharmaceutical solid dosage forms are
of natural origin and their properties vary in a way that has an impact on the granulation
process (Parker and Rowe, 1991; Rowe and Sadeghnejad, 1987). Power consumption of
the impeller motor and the impeller torque have been applied to monitor the rheological
properties of the wet mass during agglomeration and, thereby, have been used to
determine the end-point of water addition. However, these methods are affected by the
equipment variables. Hence, additional process monitoring techniques would be
valuable.
During the processing of pharmaceutical raw materials into drug products, the
materials are often exposed to rather harsh conditions. This can lead to processing-
1
- Introduction -
induced transformations (PITs), where the active pharmaceutical ingredient or the
excipients undergo a phase transition or transitions during the process (York, 1983;
Morris et al., 2001). Wet granulation is an example of a process where processing-
induced transformations may take place. Wet granulation, with the consecutive drying
process, involves increased temperatures, a significant amount of moisture and
mechanical stress, all being able to induce a phase transition. In order to state that a wet
granulation process is understood and fully under control, one should also be able to
monitor the processing-induced transformations. The problems encountered due to
processing-induced transformations during wet agglomeration can be solved by
replacing the wet agglomeration with dry agglomeration or by passing the
agglomeration step using direct compression. Nevertheless, these processes have their
own difficulties. All drugs are not suitable for dry agglomeration or direct compression
due to poor compactibility, bad flow or segregation. Wet agglomeration is commonly
used because it genuinely adds value in terms of flowability and compactibility, and it
improves the drug homogeneity. It has even been reported that wet granulation has been
used to deliberately induce a phase transformation in order to achieve better
compactibility of chlorpromazine hydrochloride (Wong and Mitchell, 1992).
Hydrate formation is a PIT that may take place during wet granulation. The
dissolution rates of hydrates and the anhydrous counterparts often differ (Shefter and
Higuchi, 1963). Thus, a different hydration state may lead to a different dissolution
profile of the active and may also potentially affect the bioavailability of the drug.
Variations in dissolution due to hydrate formation has been reported, e.g.
carbamazepine (Kahela et al., 1983), theophylline (Herman et al., 1989) and
nitrofurantoin (Otsuka et al., 1991). As noted above, wet granulation may cause hydrate
formation. During the next step in processing, drying of the granules, the hydrate may
transform into a metastable form, whose dissolution also differs from the dissolution of
the stable anhydrous form, e.g. theophylline (Phadnis and Suryanarayanan, 1997).
Hence, it would be valuable to monitor the solid-state of drugs during processing.
2
2 THEORY AND LITERATURE SURVEY
2.1 Solid-state of drugs
2.1.1 Definitions
Drug compounds can usually exist as crystalline or amorphous solids. A crystalline
material has a defined three dimensional structure, so called crystal lattice, in which
structural units (unit cells) are repeated in a regular manner. In the amorphous state,
such order cannot be found, and therefore, these materials do not posses any
distinguishable crystal lattice. However, some short-range order can be present. The
different ways of producing of amorphous glasses may result in amorphous phases with
distinctive properties (Hancock et al., 2002). It has been suggested that these phases
should be called pseudo-polyamorphs (Hancock et al., 2002).
Many drug substances can exist in different crystal packing arrangements. This
phenomenon is called polymorphism. Analogously, the different crystal forms are
termed polymorphs. In some cases, the difference in crystal packing arises from
different conformations of the molecules. Solvent molecules can be incorporated in the
crystal lattice in either stoichiometric or nonstoichiometric proportions. These forms are
called solvates or pseudopolymorphs. If the adduct is water, the form is termed a
hydrate. The water molecule is, due to its small size and hydrogen bonding capacity,
suited to fill voids in crystal structures and to bond organic molecules into stable
structures (Byrn et al., 1999). In addition, the hydrates are of special interest due to the
abundance of water in the atmosphere and its widespread use in the final crystallization
step and processing of pharmaceuticals.
Hydrates are sometimes classified structurally by dividing them into classes that
are discernible by commonly available analytical techniques (Morris, 1999; Morris and
Rodríguez-Hornedo, 1993). In isolated site hydrates, the water molecules are isolated
from direct contact to other water molecules by drug molecules. The hydrates in this
class are characterized by sharp differential scanning calorimetry (DSC) endotherms,
and the dehydration product may be amorphous and unstable. In channel hydrates, the
water molecules construct chains along an axis of the lattice. In some cases, these
hydrates take up additional moisture when exposed to high relative humidity in non-
3
- Theory and literature survey -
stoichometric proportions (expanded channels), or the water forms a two dimensional
structure in the lattice (planar hydrates). The channel hydrates are often characterized
by an early onset of dehydration. Dehydrated hydrates arise from dehydration of usually
channel hydrates that leaves an intact anhydrous structure similar to the hydrated
structure. Some consider dehydrated hydrates as a hydrate class, while others regard
these as a polymorph. Ion associated hydrates contain metal ion coordinated water.
Dehydration at high temperatures is distinctive for this class due to the relatively strong
metal-water interaction.
2.1.2 Relative stability of the solid states
Only one polymorph can be stable under defined conditions of temperature and pressure
(Grant, 1999). The difference in Gibbs free energy (G) acts as the driving force for a
polymorphic transformation at constant temperature and pressure, and is given by
G H T S∆ = ∆ − ∆ (1)
where H is enthalpy, T is temperature and S is entropy. The total energy of a system is
represented by the enthalpy at a constant pressure. The T⋅S term represents the energy
of the system that is associated with the disorder of the molecules. The stable form has
the lowest Gibbs free energy and, therefore, the lowest vapour pressure, thermodynamic
activity and solubility. If an unstable phase transforms at a very low rate, it can be
termed metastable. The relative stability of polymorphs can be described by concepts of
enantiotropy and monotropy. For enantiotropes the relative thermodynamic stability is a
function of temperature and pressure. Thus, a definitive transition temperature exists
and the transition is
reversible. The free energy
curves of the polymorphs
cross at the transition
temperature (Fig. 1a). In a
monotropic system, one
polymorph is stable at all
temperatures below the
melting point and the other
polymorph is unstable. In
a b G G
Form I Form IForm II Form II
Tf Tt Tf T T Monotropic Enantiotropic
Fig. 1. Schematic graphs of Gibbs free energy (G) versus temperature for a) an enantiotropic and b) a monotropic system. The form having the lowest free energy is the most stable. Modified from Byrn et al. (1999) and Grant (1999).
4
- Theory and literature survey -
this case, the free energy curves do not cross (Fig. 1b) and thus a reversible transition
cannot be observed below the melting point.
How do then the unstable polymorphs come into being, if the energetics favours
the most stable form? When a drug is crystallised, e.g. by cooling down a supersaturated
solution, the form initially formed is not the one with the lowest free energy, but the one
lying nearest in free energy to the original state. This empirical rule based on kinetics is
known as the Ostwald’s step rule (Grant, 1999). This rule is however not always
obeyed. Moreover, the kinetics of different polymorphs is not governed solely by a
reduction of free energy, but structural factors may play a part as well (Brittain and
Byrn, 1999).
The amorphous state exhibits a higher molar enthalpy than the crystalline state
due to the lack of stabilizing lattice energy (Grant, 1999; Hancock and Zografi, 1997).
In addition, the molar entropy of the amorphous form exceeds that of the crystalline
state, because there is no long-range order. Thus, the amorphous state may have some
advantages such as higher solubility (Hancock and Parks, 2000) than the crystalline
counterpart, but then again, the chemical and physical stability are lower than those of
the crystalline state. The processing history of amorphous glasses may result in different
kinetic properties (Hancock et al., 2002).
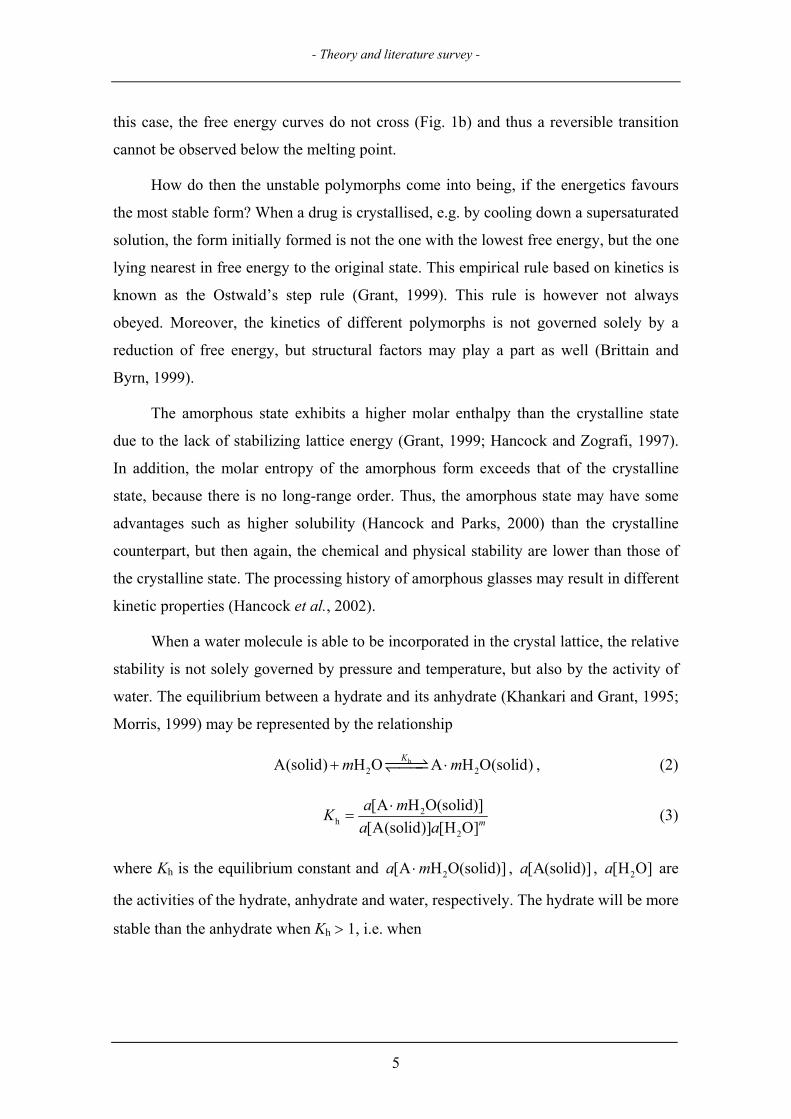
When a water molecule is able to be incorporated in the crystal lattice, the relative
stability is not solely governed by pressure and temperature, but also by the activity of
water. The equilibrium between a hydrate and its anhydrate (Khankari and Grant, 1995;
Morris, 1999) may be represented by the relationship
h2 2A(solid) H O A H O(solid)Km m+ ⋅ , (2)
2h
2
[A H O(solid)][A(solid)] [H O]m
a mKa a
⋅= (3)
where Kh is the equilibrium constant and 2[A H O(solid)]a m⋅ , , are
the activities of the hydrate, anhydrate and water, respectively. The hydrate will be more
stable than the anhydrate when K
[A(solid)]a 2[H O]a
h > 1, i.e. when
5
- Theory and literature survey -
1/
22
h
[A H O(solid)][H O][A(solid) ]
ma ma
a K ⋅
>
. (4)
If the pure solids are taken as the standard states (i.e. the states with unit activity) for the
hydrate and anhydrate, then Eq. (3) simplifies to give Eq. (5).
h 2[H O] mK a −= (5)
Thus, the stability of a hydrate relative to the anhydrate, or a higher hydrate relative to a
lower hydrate, depends on the activity of water in the surrounding medium, e.g. the
vapour phase or the crystallization medium. In addition to this basic rule, the amount of
crystal defects affects the stability of hydrates (Byrn and Lin, 1976; Irwin and Iqbal,
1991; Kitamura et al., 1989; Otsuka and Kaneniwa, 1984).
The model drugs applied in
this thesis, theophylline and caffeine,
have related structures, caffeine
having an additional methyl group
compared to theophylline (Fig 2).
Theophylline is known to exist in
two enantiotropically related
anhydrous forms, I and II where the
form II is stable at room temperature (Suzuki et al., 1989). In addition, a metastable
form that is monotropically related to form II has been reported (Phadnis and
Suryanarayanan, 1997). Moreover, theophylline exists as a monohydrate in elevated
humidities (Otsuka et al., 1990) or aqueous solutions (Bogardus, 1983). The hydrate has
been reported to be the stable form at a water activity above 0.25 (25 °C) (Zhu et al.,
1996) or 0.64 (30 °C) (Ticehurst et al., 2002). Anhydrous caffeine exists as low and
high temperature forms (Suzuki et al., 1985). Moreover, caffeine has been reported to
exist as a 4/5-hydrate (Bothe and Cammenga, 1980; Sutor, 1958b). The 4/5-hydrate is
the stable form at relative humidities above approx. 75% (Griesser and Burger, 1995).
The hydrates of theophylline and caffeine are channel hydrates (Sun et al., 2002; Sutor,
1958a,b), and their dehydration starts at the ends of the water tunnels of the crystals
with a threshold temperature of 47 and 44 °C, respectively (Byrn and Lin, 1976; Perrier
and Byrn, 1982).
O
NN
N NHO
N
N N
N
O
Oa b
Fig. 2. Structural formulas of a) theophylline and b) caffeine.
6
- Theory and literature survey -
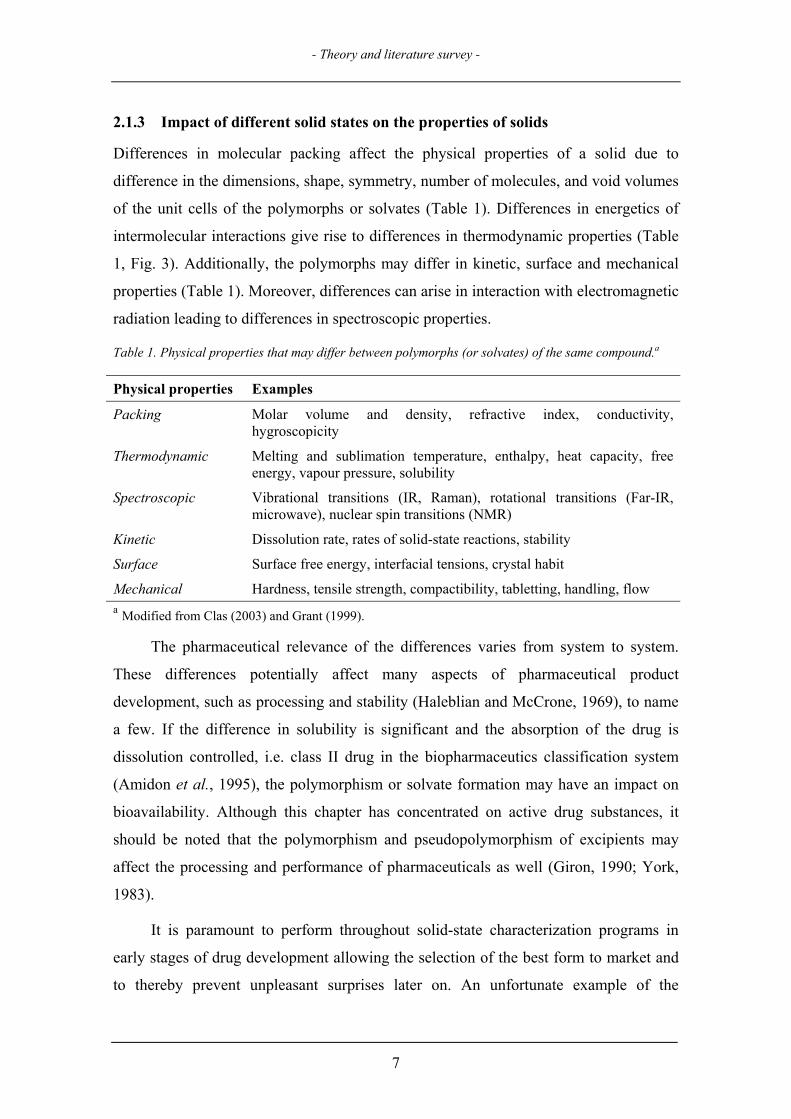
2.1.3 Impact of different solid states on the properties of solids
Differences in molecular packing affect the physical properties of a solid due to
difference in the dimensions, shape, symmetry, number of molecules, and void volumes
of the unit cells of the polymorphs or solvates (Table 1). Differences in energetics of
intermolecular interactions give rise to differences in thermodynamic properties (Table
1, Fig. 3). Additionally, the polymorphs may differ in kinetic, surface and mechanical
properties (Table 1). Moreover, differences can arise in interaction with electromagnetic
radiation leading to differences in spectroscopic properties.
Table 1. Physical properties that may differ between polymorphs (or solvates) of the same compound.a
Physical properties Examples
Packing Molar volume and density, refractive index, conductivity, hygroscopicity
Mechanical Hardness, tensile strength, compactibility, tabletting, handling, flow a Modified from Clas (2003) and Grant (1999).
The pharmaceutical relevance of the differences varies from system to system.
These differences potentially affect many aspects of pharmaceutical product
development, such as processing and stability (Haleblian and McCrone, 1969), to name
a few. If the difference in solubility is significant and the absorption of the drug is
dissolution controlled, i.e. class II drug in the biopharmaceutics classification system
(Amidon et al., 1995), the polymorphism or solvate formation may have an impact on
bioavailability. Although this chapter has concentrated on active drug substances, it
should be noted that the polymorphism and pseudopolymorphism of excipients may
affect the processing and performance of pharmaceuticals as well (Giron, 1990; York,
1983).
It is paramount to perform throughout solid-state characterization programs in
early stages of drug development allowing the selection of the best form to market and
to thereby prevent unpleasant surprises later on. An unfortunate example of the
7
- Theory and literature survey -
difficulties encountered during characterization, is the case of ritonavir, where
emergence of a new, less soluble polymorph led to the withdrawal of a formulation
from the market (Bauer et al., 2001; Clas, 2003). Some characterization approaches are
presented in literature (Byrn et al., 1995; Yu et al., 1998). The regulatory authorities
have also recognized the importance of polymorphism and require polymorphism
screening for new chemical drug substances (ICH, 1999).
Changes or solvate molecules in the crystal structure
affect
Interactions between the molecules within the solid
Internal energy Disorder due to thermal motions and spatial locations
Internal energy + PV = Enthalpy Entropy
Free energy = Enthalpy – T ⋅ Entropy
Partial molar free energy = Chemical potential
THERMODYNAMIC ACTIVITY
Thermodynamic activity SOLUBILITY = Thermodynamic activity of the solid ∝ rate of reaction
activity coefficient of dissolved solute
STABILITY DISSOLUTION RATE
BIOAVAILABILITY AND PRODUCT PERFORMANCE
Fig. 3. Effect of polymorph conversion or solvate formation on the thermodynamic properties of a drug. Modified from Khankari and Grant (1995).
8
- Theory and literature survey -
2.2 Techniques for analysing the solid state of drugs
In this chapter, the most common methods for characterization of the solid state are
overviewed. In general, for effective characterization, the different characterization
techniques have to be used in a multi-approach fashion combining results obtained by
different methods.
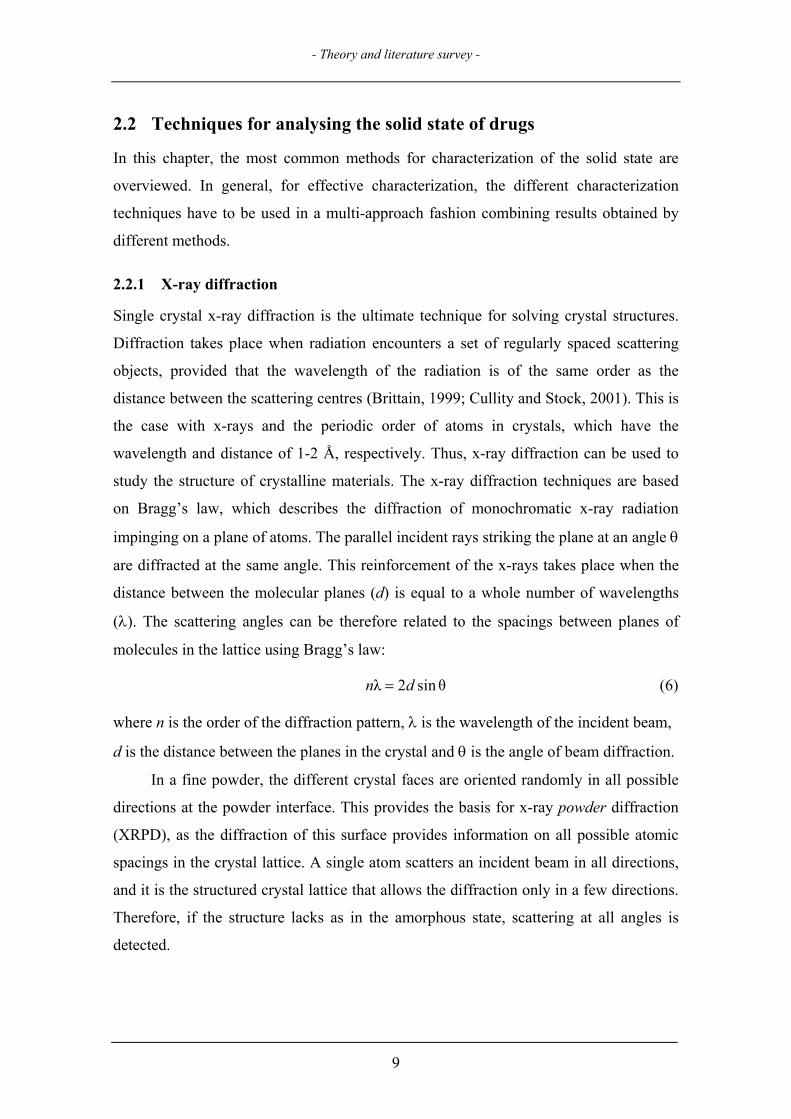
2.2.1 X-ray diffraction
Single crystal x-ray diffraction is the ultimate technique for solving crystal structures.
Diffraction takes place when radiation encounters a set of regularly spaced scattering
objects, provided that the wavelength of the radiation is of the same order as the
distance between the scattering centres (Brittain, 1999; Cullity and Stock, 2001). This is
the case with x-rays and the periodic order of atoms in crystals, which have the
wavelength and distance of 1-2 Å, respectively. Thus, x-ray diffraction can be used to
study the structure of crystalline materials. The x-ray diffraction techniques are based
on Bragg’s law, which describes the diffraction of monochromatic x-ray radiation
impinging on a plane of atoms. The parallel incident rays striking the plane at an angle θ
are diffracted at the same angle. This reinforcement of the x-rays takes place when the
distance between the molecular planes (d) is equal to a whole number of wavelengths
(λ). The scattering angles can be therefore related to the spacings between planes of
molecules in the lattice using Bragg’s law:
λ 2 sinθn d= (6)
where n is the order of the diffraction pattern, λ is the wavelength of the incident beam,
d is the distance between the planes in the crystal and θ is the angle of beam diffraction.
In a fine powder, the different crystal faces are oriented randomly in all possible
directions at the powder interface. This provides the basis for x-ray powder diffraction
(XRPD), as the diffraction of this surface provides information on all possible atomic
spacings in the crystal lattice. A single atom scatters an incident beam in all directions,
and it is the structured crystal lattice that allows the diffraction only in a few directions.
Therefore, if the structure lacks as in the amorphous state, scattering at all angles is
detected.
9
- Theory and literature survey -
XRPD is commonly used in identification and quantification of polymorphs
(Stephenson et al., 2001). It can also be used to quantify the amorphous content. With
specialized techniques, high-quality powder diffraction patterns can also be used for
solving crystal structures. XRPD is usually applied off-line, although a pharmaceutical
in-line application has been published (Davis et al., 2003). A disadvantage of x-ray
diffraction in in-line use is the hazardous nature of the radiation.
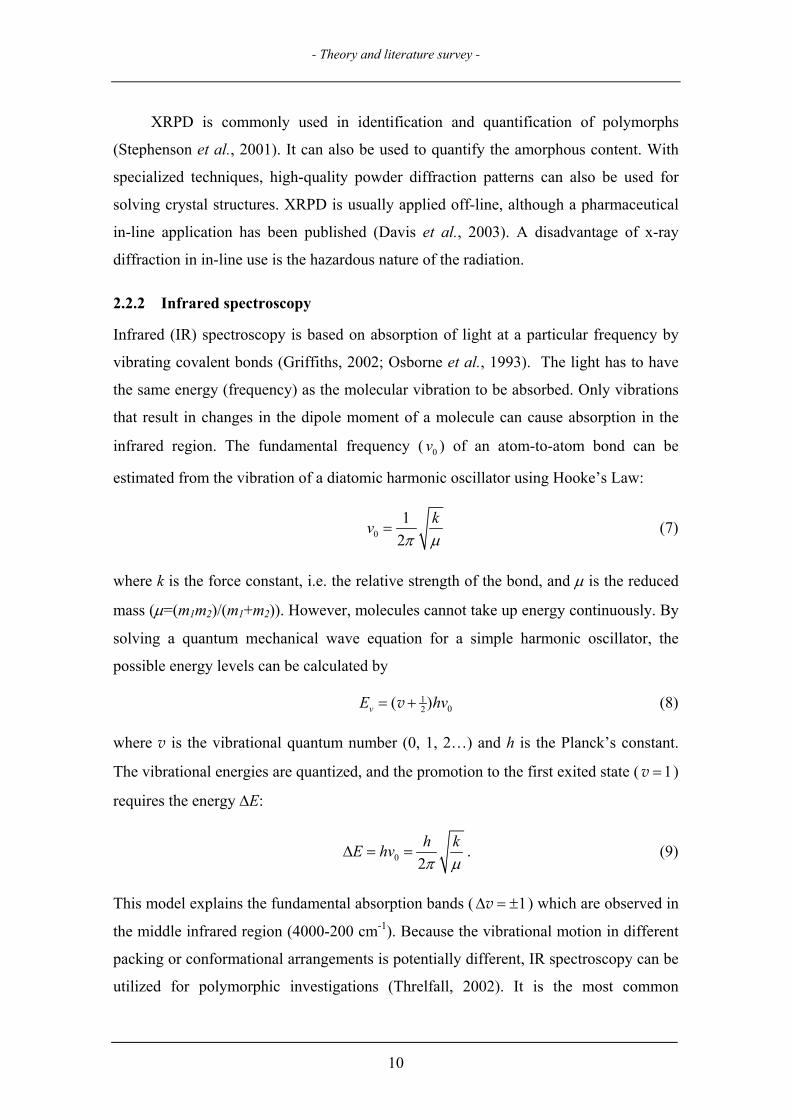
2.2.2 Infrared spectroscopy
Infrared (IR) spectroscopy is based on absorption of light at a particular frequency by
vibrating covalent bonds (Griffiths, 2002; Osborne et al., 1993). The light has to have
the same energy (frequency) as the molecular vibration to be absorbed. Only vibrations
that result in changes in the dipole moment of a molecule can cause absorption in the
infrared region. The fundamental frequency ( v ) of an atom-to-atom bond can be
estimated from the vibration of a diatomic harmonic oscillator using Hooke’s Law:
0
01
2kv
π µ= (7)
where k is the force constant, i.e. the relative strength of the bond, and µ is the reduced
mass (µ=(m1m2)/(m1+m2)). However, molecules cannot take up energy continuously. By
solving a quantum mechanical wave equation for a simple harmonic oscillator, the
possible energy levels can be calculated by
102( )vE hv= +v (8)
where v is the vibrational quantum number (0, 1, 2…) and h is the Planck’s constant.
The vibrational energies are quantized, and the promotion to the first exited state ( )
requires the energy ∆E: 1=v
0 2h kE hvπ µ
∆ = = . (9)
This model explains the fundamental absorption bands ( 1∆ = ±v ) which are observed in
the middle infrared region (4000-200 cm-1). Because the vibrational motion in different
packing or conformational arrangements is potentially different, IR spectroscopy can be
utilized for polymorphic investigations (Threlfall, 2002). It is the most common
10
- Theory and literature survey -
spectroscopic technique in the analysis of solid state. Earlier, the sample preparation to
alkali halide (KBr, KCl) pellets has compromised the solid-state characterization but
this can be avoided by using the diffuse reflectance technique (Bugay, 2001).
2.2.3 Near-infrared spectroscopy
Absorbance in the near-infrared region (700-2500 nm or 14300-4000 cm-1) originates
from overtones ( , ±3, …) and combinations of fundamental vibrations observed
in the middle infrared region (Osborne et al., 1993). Real molecules do not obey exactly
the laws of simple harmonic oscillator, Eq. (8), and the Hooke’s law, Eq. (7), due to
coulombic repulsion between two nuclei in one end of the vibration and dissociation in
the other extreme.
2∆ = ±v
Vibration can be described as either stretching or bending. A change in the
interatomic distance is called stretching and a change in the bond angle is called
bending. The intensities of overtone and combination bands depend on the degree of
anharmonicity. The stretching vibrations of bonds involving hydrogen have large
amplitude, and therefore, this motion deviates most from harmonic. Thus, the majority
of absorption bands observed in the near-infrared originate from stretching vibrations of
XH groups, X being O, C, N or S, or combinations involving stretching and bending of
these groups.
NIR spectroscopy is often conducted in reflectance mode which allows the
measurement of solid samples (Osborne et al., 1993). Reflectance spectroscopy
measures the light reflected by the sample surface. This can be divided to specular and
diffuse reflectance. The diffuse reflectance component contains the chemical
information and is the component mainly employed in NIR spectroscopy. Many
workers apply a relationship similar to the Beer-Lambert’s law:
1logAR
= (10)
where A is apparent absorbance and R is the reflectance relative to a non-absorbing
standard. The concentration is expected to be relative to the apparent absorbance (c∝
log 1/R).
11
- Theory and literature survey -
Like in mid-IR, the absorption bands in NIR spectra are sensitive to changes in
hydrogen bonding and packing in the crystal lattice. Due to this NIR can be applied to
analysis of the solid state. It has been used in identification of the desired polymorph
(Aldridge et al., 1996), polymorph quantitation (Luner et al., 2000; Patel et al., 2000)
and the determination of crystallinity (Hogan and Buckton, 2001). In addition, hydrate
water bands are sharper than other water bands, because the energic distribution of the
OH vibrations is rather uniform, when the water molecules are bound into the crystal
lattice. Bulk water has NIR absorption bands at around 760, 970, 1190, 1450 and 1940
nm (Curcio and Petty, 1951) having increasing absorptivity with increasing wavelength.
The bands at around 760, 970 and 1450 nm are the third, second and first overtone,
respectively. The 1190 nm band has been assigned to be a combination of symmetric
stretching, bending and asymmetric stretching (Buijs and Choppin, 1963). Further, the
1940 nm band has been assigned to a combination of bending and asymmetric
stretching (Choppin and Downey, 1972). The bands shift towards higher wavelength
with increasing hydrogen bonding (Buijs and Choppin, 1963; Choppin and Violante,
1972; Fornés and Chaussidon, 1978; Iwamoto et al., 1987; Maeda et al., 1995).
Although NIR is a rather new method compared to mid-IR, it is beginning to be an
established technique especially in identification of raw materials. The method has been
recently adopted to pharmacopoeias (Ph.Eur., 2004a; USP 27, 2003).
An advantage of NIR spectroscopy is that it can be applied in reflectance mode
enabling non-invasive measurements due to the low molar absorptivities in the NIR
region. Sample preparation in the traditional sense is not necessary, as spectra can be
measured directly from solid materials. Moreover, glass is relatively transparent for NIR
radiation. The measurements are non-destructive and fast. Systems performing 12 000
measurements per minute have been reported (Herkert et al., 2001). However, the line
widths of NIR are broad resulting in overlapping bands and making assignment of the
different features of the spectra difficult. Moreover, the spectra are strongly influenced
by factors that affect the path length of light propagating in the sample such as particle
size and packing density of the sample. This phenomenon can, on the other hand, be
considered as an advantage of NIR because it can be used to gather physical information
(Dreassi et al., 1995; Frake et al., 1998; Ilari et al., 1988; Kirsch and Drennen, 1999;
Morisseau and Rhodes, 1997; O'Neil et al., 1998).
12
- Theory and literature survey -
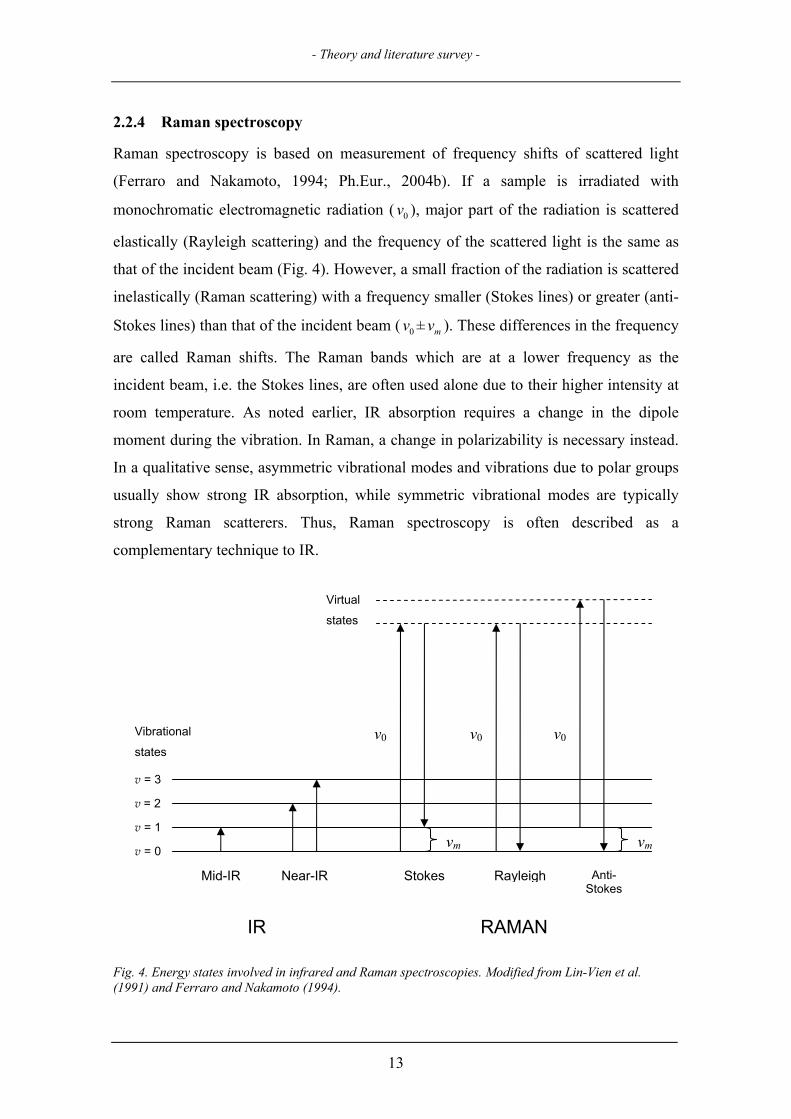
2.2.4 Raman spectroscopy
Raman spectroscopy is based on measurement of frequency shifts of scattered light
(Ferraro and Nakamoto, 1994; Ph.Eur., 2004b). If a sample is irradiated with
monochromatic electromagnetic radiation ( ), major part of the radiation is scattered
elastically (Rayleigh scattering) and the frequency of the scattered light is the same as
that of the incident beam (Fig. 4). However, a small fraction of the radiation is scattered
inelastically (Raman scattering) with a frequency smaller (Stokes lines) or greater (anti-
Stokes lines) than that of the incident beam ( v ± ). These differences in the frequency
are called Raman shifts. The Raman bands which are at a lower frequency as the
incident beam, i.e. the Stokes lines, are often used alone due to their higher intensity at
room temperature. As noted earlier, IR absorption requires a change in the dipole
moment during the vibration. In Raman, a change in polarizability is necessary instead.
In a qualitative sense, asymmetric vibrational modes and vibrations due to polar groups
usually show strong IR absorption, while symmetric vibrational modes are typically
strong Raman scatterers. Thus, Raman spectroscopy is often described as a
complementary technique to IR.
0v
0 mv
Virtual
states
v0 v0 v0 Vibrational
states
v = 3
v = 2
v = 1 vm vm
v = 0
Mid-IR Near-IR Stokes Rayleigh Anti-Stokes
IR
RAMAN
Fig. 4. Energy states involved in infrared and Raman spectroscopies. Modified from Lin-Vien et al. (1991) and Ferraro and Nakamoto (1994).
13
- Theory and literature survey -
Raman spectroscopy has been utilized for distinguishing solid-state forms of
drugs in bulk drug (Bolton and Prasad, 1981; Neville et al., 1992; Szelagiewicz et al.,
1999), in slurries (Anquetil et al., 2002; Starbuck et al., 2002) during crystallization
(Wang et al., 2001) and in tablets (Taylor and Langkilde, 2000). In addition, it has been
used for quantitation of polymorphs (Langkilde et al., 1997; Pratiwi et al., 2002) and
crystallinity (Taylor and Zografi, 1998). Moreover, it has been utilized for granulation
process development in order to find the process conditions that do not cause
dissociation of a hydrochloride salt drug to its base (Williams et al., 2004).
The major advantages (Vankeirsbilck et al., 2002) of Raman spectroscopy are that
measurements can be performed fast, directly from powders and spectra can be obtained
through plastics and glass, i.e. products can be measured directly in their packages.
Raman spectrometers can be coupled with fibre optic probing which enables on-line and
non-invasive measurements. Water is a weak Raman scatter, and therefore, Raman can
be applied for analysis of aqueous suspensions. In contrast to NIR, the Raman bands are
well resolved. Some of the Raman instruments enable measurement of lattice vibrations
(Bugay, 2001), so called phonons, which occur at low frequencies (400-50 cm-1).
The lasers applied in Raman spectroscopy present some advantages and
disadvantages. On one hand, the area excited by the lasers is small (Williams, 2001), so
Raman measurements can be performed on relatively small sample amounts or can be
used to study small particles in a matrix. On the other hand, the small area studied can
lead to unrepresentative data, if the samples are inhomogeneous and care is not taken.
The particle size of the samples affect the Raman spectra in some extent, but
contradictory reports have been published on the direction of the effect (Pellow-Jarman
et al., 1996). Fluorescence, which overlays the Raman bands, is a problem connected to
the use of lasers operating at the visible region. This can be in most cases avoided by
using lasers in the NIR region. In addition, the samples may decompose thermally, if
high excitation intensities are employed.
2.2.5 Nuclear magnetic resonance spectroscopy
Solid-state nuclear magnetic resonance (NMR) spectroscopy can be used to probe the
chemical environment of specific nuclei within molecules (Bugay, 1993). In NMR
spectroscopy, the sample is exposed to a magnetic field that splits the energy levels of
14
- Theory and literature survey -
nuclei having a net spin other than zero. The lower energy level nuclei are excited to the
higher level by electromagnetic radiation at a specific frequency depending on the type
of nucleus. The energy needed to excite the nuclei to the higher energy level is
proportional to the magnetic field experienced by the nuclei, which is again dependent
on the chemical environment of the nuclei. This causes a so called chemical shift in the
absorbed frequency due to the shielding by electrons around the nucleus. The nucleus
studied in the solid state is usually 13C. The lack of random, averaging motion
encountered in the liquid state and the long relaxation times of 13C results in the need of
various signal enhancing techniques in the solid-state applications (Bugay, 1993, 1995,
2001).
The solid-state NMR spectra show the differences in spatial positions of nuclei in
different packing arrangements as a change in the isotropic chemical shift of the
corresponding nuclei in each structure (Bugay, 2001). Hence, solid-state NMR
spectroscopy can be applied to study polymorphism and amorphism. In addition, the
technique provides information about the molecular motions occurring at the nuclei
studied (Tishmack et al., 2003). The pharmaceutical applications of solid-state NMR
have been recently reviewed by Tishmack et al. (2003). It has been found more useful
for the study of the amorphous state than X-ray diffraction (Tishmack et al., 2003). An
advantage of the technique is that the particle size has a very minor, if any, effect on the
analysis (Bugay, 2001). The fact that it is not trivial to obtain high-quality spectra may
be considered as a disadvantage (Tishmack et al., 2003).
2.2.6 Microscopy
Optical and electron microscopy give information of the morphology of the crystals
under study (Brittain, 1999). The morphology is of interest because the observable
habits of different crystal structures are different. Polarization microscopy is based on
the way the analyte crystal affects polarized light that is transmitted through the crystal
at different angles (Newman and Brittain, 1995). The method can be utilized for the
study of crystal systems (Emons et al., 1982). There are seven different crystal systems:
cubic, hexagonal, tetragonal, orthorhombic, monoclinic, triclinic and trigonal. The
classification is based on relative lengths of lattice axes and the angles between the
axes. The refractive index of the crystal in the direction of the different crystal axes is
15
- Theory and literature survey -
dependent on the class the crystal belongs to. In some cases, the method can be also
used to differ between amorphous and crystalline material. A distinctive advantage of a
microscopic method is the extremely small sample amount necessary, thus, it can be a
valuable technique in the early development stages.
2.2.7 Thermal methods
In thermal methods of analysis, a property of an analyte is studied as function of
externally applied temperature (Giron, 1986). The two most common thermal methods
applied in pharmaceutical sciences are differential scanning calorimetry (DSC) and
thermogravimetry (TG). DSC records the heat flow in and out the sample. Thus, it can
be used to analyse endothermic (melting, boiling, sublimation, vaporization,
desolvation, glass transitions, chemical degradation, etc.) and exothermic
(crystallization, oxidative decomposition) events (Brittain, 1999; Clas et al., 1999). In
addition, stability relationships (enantiotropy and monotropy) between different
polymorphic forms can be studied using this method (Giron, 1995). In TG, the
measured parameter is the weight loss of the material. This method is useful in the
characterization of desolvation processes of hydrates and other solvates. For example,
the stoichiometry of a solvate may be determined by this method.
Thermal microscopy is a technique which enables the visual inspection of changes
in crystals as function of temperature (Kuhnert-Brandstätter, 1982). It can be used to
investigate melting points and the desolvation of solvates. For example, thermal
microscopy has been applied for the identification of channel hydrates (Byrn and Lin,
1976; Perrier and Byrn, 1982).
Mircocalorimetry is the measurement of heat flow (power, W) with time or
temperature in micro-Watt scale (Gaisford and Buckton, 2001). In isothermal
microcalorimetry, the power is measured as function of time at a specified temperature,
whereas in scanning microcalorimetry, the power is measured as function of
temperature. The latter is actually the same as DSC, but the instruments are highly
sensitive, and thus, the method is referred to as high-sensitivity DSC. Low levels (1-
2%) of amorphous material can be detected by isothermal microcalorimetry (Giron,
2001). The method is based on inducing crystallisation of the amorphous part in the
chamber by moisture and measuring the heat of crystallisation. A limitation of this
16
- Theory and literature survey -
method is that it can only be applied for amorphous materials which crystallise
spontaneously under certain relative humidities or organic vapours (Gao and Rytting,
1997).
Processes involving enthalpy changes can also be investigated applying solution
calorimetry (Giron, 1995). The difference in the heats of solution in any solvent will be
equal to the difference in enthalpy of the solids, provided that the dissolution is rapid
and no association or complexation takes place. It is possible to make quantitative
determinations of the degree of disorder by this method (Gao and Rytting, 1997; Hogan
and Buckton, 2000; Pikal et al., 1978), but the method requires 100% crystalline and
amorphous standards. The method allows also the quantification of polymorphs. An
increasingly popular trend has been to combine the thermoanalytical techniques with
microscopy, spectroscopy, XRPD or mass spectrometry (Giron, 2001).
2.3 Wet agglomeration
2.3.1 Agglomeration mechanisms
Agglomeration, also termed granulation, is a process where particles are brought
together into larger semi-permanent aggregates, so called agglomerates or granules,
where the original particles are still distinguishable (Snow et al., 1997). In wet
agglomeration, this process is facilitated by a liquid. The liquid binds the particles by a
combination of capillary and viscous forces in the wet state (Iveson et al., 2001). More
permanent bonds are formed during subsequent drying. The aim of agglomeration is to
improve powder flow and handling, decrease dustiness and prevent segregation of the
API.
According to Iveson et al. (2001) there are fundamentally only three rate processes
determining wet agglomeration behaviour: (1) wetting and nucleation; (2) consolidation
and growth; and (3) breakage and attrition. These phenomena often take place
simultaneously in the granulation equipment, making the investigation of the effect of
an individual phenomenon on the agglomerate properties difficult.
Wetting of the particles is necessary for nucleation, i.e. the formation of initial
agglomerates. The nucleation rate is governed by wetting thermodynamics and drop
penetration kinetics (Hapgood et al., 2002), as well as the binder dispersion. The binder
17
- Theory and literature survey -
dispersion in the powder mass depends on the liquid delivery parameters (Knight et al.,
1998) and powder mixing (Litster et al., 2001).
Agglomerate growth takes place whenever material in the granulation equipment
collides and remains together. This is referred to as coalescence, when the colliding
parties are two agglomerates, or as layering, when fine particles stick to the pre-existing
agglomerates. The ability of two agglomerates to coalesce is dependent on many factors
(Ennis et al., 1991; Tardos et al., 1997) including the strength and deformability of the
agglomerates, and the availability of liquid in the proximity of their surfaces. Hence,
liquid saturation is an important factor effecting agglomerate growth (Kristensen et al.,
1984). Liquid saturation can be increased either by increasing the liquid content or by
consolidation of the agglomerates. The extent of consolidation depends on formulation
properties and process variables. Moreover, the consolidation affects the strength and
deformability of the agglomerates. The agglomerate strength is controlled by three
factors: capillary, viscous and frictional forces, which are inter-related in a complex way
(Iveson et al., 2001). The relative importance of these forces can vary considerably with
strain rate and formulation properties. On the other hand, deformation and breakage will
take place, when the agglomerates reach a certain critical size, which depends on the
applied kinetic energy and on the agglomerate strength (Tardos et al., 1997). Summing
up, agglomerate growth is dependent on many interrelated phenomena and determined
by the balance between coalescence and breakage (Schaefer, 2001).
As noted above, breakage of wet agglomerates will affect and may control the final
agglomerate mean size and size distribution (Iveson et al., 2001; Tardos et al., 1997).
Breakage influences also the binder dispersion in the wetting and nucleation phase.
Furthermore, attrition of dry granules leads to generation of dusty fines, which is
undesirable.
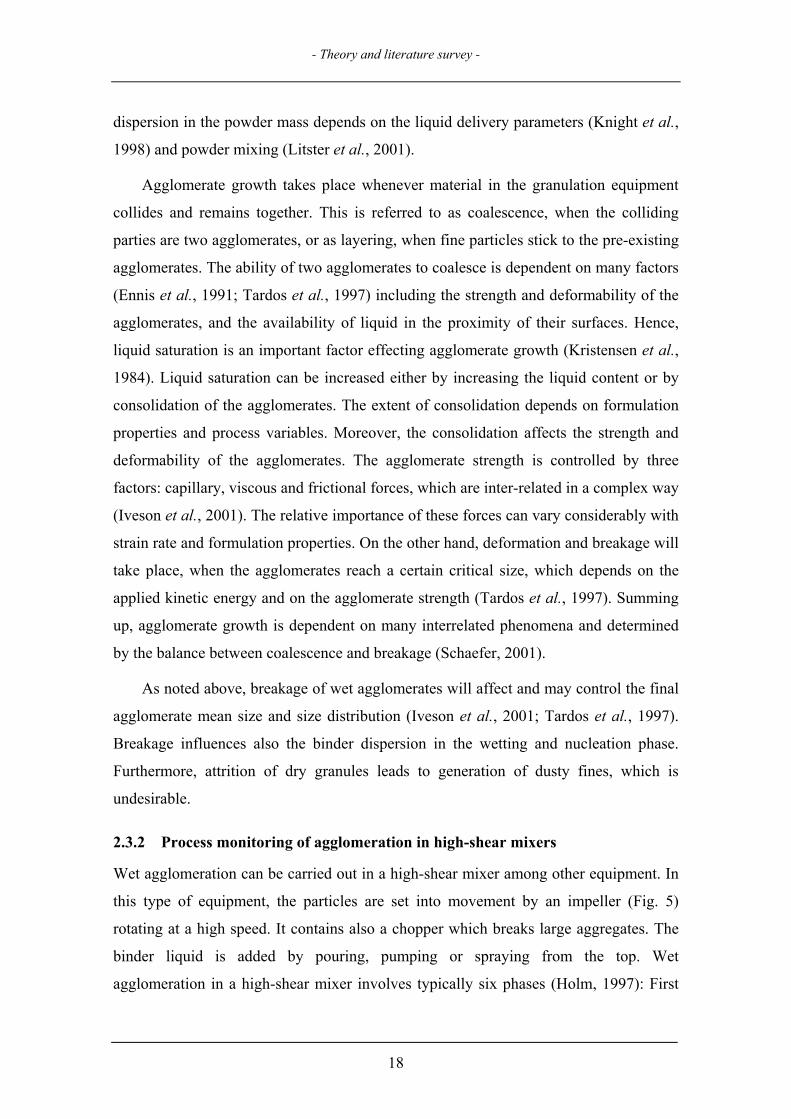
2.3.2 Process monitoring of agglomeration in high-shear mixers
Wet agglomeration can be carried out in a high-shear mixer among other equipment. In
this type of equipment, the particles are set into movement by an impeller (Fig. 5)
rotating at a high speed. It contains also a chopper which breaks large aggregates. The
binder liquid is added by pouring, pumping or spraying from the top. Wet
agglomeration in a high-shear mixer involves typically six phases (Holm, 1997): First
18
- Theory and literature survey -
a)
Mot
or
Mot
or b)
Liquid addition IR probe
Chopper Liquid
addition Chopper
Impeller Impeller
Fig. 5. Schematic diagrams of high-shear mixers: a) the main parts of a vertical high-shear mixer and
b) the changeable bowl mixer used in the thesis.
the materials are dry mixed, where after liquid is added during mixing. Then the moist
mass is wet massed in order to achieve a narrow particle size distribution. Thereafter the
granules are wet sieved, dried and sieved again. The liquid amount is critical, because
the process is susceptible for over-wetting, which leads to uncontrollable agglomerate
growth. Variations in raw materials may affect the liquid requirement.
Impeller torque, (Lindberg, 1977) and power consumption (Bier et al., 1979;
Leuenberger et al., 1979) of mixers have been used to monitor the properties of wet
masses during agglomeration. The methods give a measure of the amount of resistance
the impeller experiences to keep a certain rotational speed. It has been shown that these
measurement techniques give the same information (Bier et al., 1979; Corvari et al.,
1992; Mackaplow et al., 2000), but
direct torque measurements have
been found to be the most sensitive
(Kopcha et al., 1992).
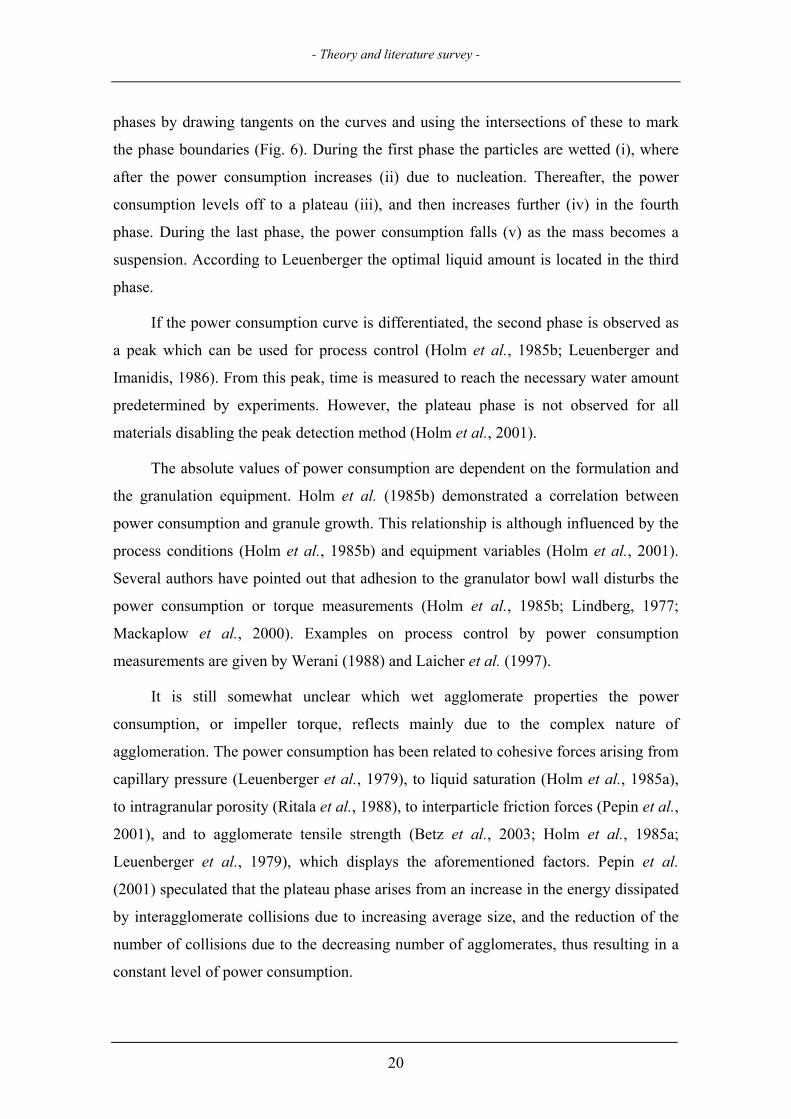
Leuenberger and co-workers
(Bier et al., 1979; Leuenberger et al.,
1979) used the power consumption
curve during the liquid addition
phase to find the optimal liquid
amount for agglomeration. They
divided the curve into different
v iv iii i ii
Liquid amount
Pow
er c
onsu
mpt
ion
or
impe
ller t
orqu
e
Fig. 6. A schematic presentation of a power consumption or impeller torque curve with the division to phases (see text for explanation).
19
- Theory and literature survey -
phases by drawing tangents on the curves and using the intersections of these to mark
the phase boundaries (Fig. 6). During the first phase the particles are wetted (i), where
after the power consumption increases (ii) due to nucleation. Thereafter, the power
consumption levels off to a plateau (iii), and then increases further (iv) in the fourth
phase. During the last phase, the power consumption falls (v) as the mass becomes a
suspension. According to Leuenberger the optimal liquid amount is located in the third
phase.
If the power consumption curve is differentiated, the second phase is observed as
a peak which can be used for process control (Holm et al., 1985b; Leuenberger and
Imanidis, 1986). From this peak, time is measured to reach the necessary water amount
predetermined by experiments. However, the plateau phase is not observed for all
materials disabling the peak detection method (Holm et al., 2001).
The absolute values of power consumption are dependent on the formulation and
the granulation equipment. Holm et al. (1985b) demonstrated a correlation between
power consumption and granule growth. This relationship is although influenced by the
process conditions (Holm et al., 1985b) and equipment variables (Holm et al., 2001).
Several authors have pointed out that adhesion to the granulator bowl wall disturbs the
power consumption or torque measurements (Holm et al., 1985b; Lindberg, 1977;
Mackaplow et al., 2000). Examples on process control by power consumption
measurements are given by Werani (1988) and Laicher et al. (1997).
It is still somewhat unclear which wet agglomerate properties the power
consumption, or impeller torque, reflects mainly due to the complex nature of
agglomeration. The power consumption has been related to cohesive forces arising from
capillary pressure (Leuenberger et al., 1979), to liquid saturation (Holm et al., 1985a),
to intragranular porosity (Ritala et al., 1988), to interparticle friction forces (Pepin et al.,
2001), and to agglomerate tensile strength (Betz et al., 2003; Holm et al., 1985a;
Leuenberger et al., 1979), which displays the aforementioned factors. Pepin et al.
(2001) speculated that the plateau phase arises from an increase in the energy dissipated
by interagglomerate collisions due to increasing average size, and the reduction of the
number of collisions due to the decreasing number of agglomerates, thus resulting in a
constant level of power consumption.
20
- Theory and literature survey -
Other process monitoring approaches have also been described for high-shear
mixers. Vibrations of a probe located in the granulator have been related to the mass
median diameter of granules (Ohike et al., 1999; Staniforth et al., 1986). The moisture
distribution and packing of the mass has been followed by conductivity (Spring, 1983)
and capacitive sensors (Corvari et al., 1992; Fry et al., 1984, 1987). By acoustic
emission, sound produced by the process is detected and analysed. A correlation
between the acoustic emission from a high-shear granulator and agglomerate size was
found (Whitaker et al., 2000). In a very different approach, Watano et al. (2001)
introduced an image processing system for in-line measurement and control of the
agglomerate size. Further, in an approach similar to torque measurements, stress
fluctuations were used as input instead of average stresses (Talu et al., 2001). However,
the materials and methods used in that study were of model character and it is uncertain
how applicable this technique is in monitoring the agglomeration of real materials.
2.4 Approaches to increase process understanding
2.4.1 Anticipation of processing-induced transformations
Many of the pharmaceutical unit-operations subject the active pharmaceutical
ingredients to rather harsh conditions (Brittain and Fiese, 1999; Morris et al., 1998,
2001; York, 1983). Examples of such unit-operations are milling, wet agglomeration,
tabletting and lyophilization. Zhang et al. (2004) reviewed recently the potential phase
transformations associated with common unit operations.
The unit-operations introduce some stress into the system (Morris et al., 2001).
The stress in this context is a physical change that moves the system from or towards
equilibrium. The stress may be thermal, mechanical or a result from interaction with
another factor like moisture. The system may be trapped in another equilibrium under
the stress conditions producing a metastable form when the stress ceases or it may be
kinetically formed to an everywhere metastable form. The stresses disturb the
propagation of lattice vibrations in a crystal lattice. At low levels of stress, local strains
develop in the lattice. If the local strain fields increase in number and size, they create
larger and larger domains of strain until the lattice undergoes a global transformation,
and a new phase is created with an own set of lattice vibrations.
21
- Theory and literature survey -
Phase diagrams may be used to be able to overview the possible phase transitions
which may take place during a process (Morris et al., 2001). The physical conditions
(temperature, pressure, humidity) the system encounters during the unit-operation and
storage should be covered. The phase diagrams do however not show the probability of
these possible transitions. The resulting phase after processing is governed not only by
the most stable state in equilibrium but also by the kinetics of the transition and the time
scale of the applied stress.
The kinetics of the transformation is governed by the activation energy associated
with the transition (Giron, 1995). The rate of transition changes as function of
temperature. The rate is minimal near the transition temperature (Tt) of two
enantiotropic polymorphs and increases on both sides of the Tt. At low temperatures the
rate decreases again. If the transition requires a major reorganisation of the structure, the
metastable form may be stable in practice (e.g. diamond). One should be aware of that
the presence of excipients (Airaksinen et al., 2003) may affect the transition kinetics. In
addition, the formulation matrix (Giron, 1995) or impurities (Bauer et al., 2001) may
induce the transformation into a more stable form, which does not otherwise take place.
Changes in the time scale of the process due to scale-up should also be considered.
Wet agglomeration, with the subsequent drying process, is a unit-operation that
includes several stresses, such as humidity, mechanical stress, and elevated
temperatures, which may lead to processing-induced transformations. The granulation
liquid used may take part in solution-mediated transformations (sometimes referred to
as solvent-mediated), where the starting material transforms to a more stable
polymorphic form or to a solvate (Morris et al., 2001). In the drying process that
follows wet agglomeration, the solvate may transform to a metastable or amorphous
form. This can also be the case, if an ingredient has completely dissolved in the
granulation liquid and precipitates during the drying process.
In this thesis, the solution-mediated transformations of theophylline and caffeine
to their respective hydrates were under study. Wet granulation using water exposes
these drugs to conditions where the hydrate is the stable form, because the water activity
is increased remarkably by the granulation liquid. A solution-mediated transformation
involves several steps. First, the metastable phase, in this context the anhydrous phase,
22
- Theory and literature survey -
starts to dissolve. The solubility of the stable phase, in this context the hydrate, is lower
than the solubility of the metastable phase, and, thus, the granulation liquid becomes
supersaturated with respect to the stable phase. Thereafter, nucleation of the stable
phase has to take place. It has been shown that the anhydrous theophylline crystals act
as heterogeneous nucleation substrates for the hydrate phase, i.e. the hydrate crystals
nucleate on the anhydrous phase (Rodríguez-Hornedo et al., 1992). Heterogeneous
nucleation lowers the free energy barrier compared to homogeneous nucleation, and this
form for nucleation can occur at low driving forces (Rodríguez-Hornedo and Murphy,
1999). After the nucleation the stable phase continues to grow. This growth causes the
concentration of the solution to fall. This leads to that the solution becomes under-
saturated with respect to the metastable phase, which dissolves further. Therefore, the
growth of the stable phase is maintained by the supersaturation created by the
dissolution of the metastable phase. The process continues until the metastable phase
has disappeared (Cardew and Davey, 1985).
The kinetics of solution-mediated transformations is governed by dissolution of
the unstable phase and nucleation and growth of the stable phase. The dissolution of the
metastable phase creates a supersaturation respect to the less soluble stable form and
then acts as the driving force for the nucleation and growth of the stable phase. As the
metastable phase and the excipients in the formulation act as nucleation sites for the
stable phase, rapid nucleation can be assumed relative to the granulation time (Davis et
al., 2003). The overall kinetics can be either controlled by the dissolution of the
metastable phase or by the growth of the stable phase (Cardew and Davey, 1985). Davis
et al. (2003) presented a conceptual model for solution-mediated transformations during
wet granulation.
2.4.2 Regulatory perspectives
The US Food and Drug Administration (FDA) has launched a Process Analytical
Technology (PAT) initiative in order to encourage the industry to implement new
technologies in the manufacture of drug products (FDA, 2003a,b). They define PAT as
follows: “PAT is considered to be a system for designing, analyzing, and controlling
manufacturing through timely measurements (i.e., during processing) of critical quality
and performance attributes of raw and in-process materials and processes with the goal
23
- Theory and literature survey -
of ensuring final product quality.” In the construction of this framework, different
parties such as pharmaceutical manufacturers and academia have been actively involved
(FDA, 2003b).
In the initiative, the need for increased process understanding is stressed. A
process can be generally considered well understood when all critical sources of
variability are identified and explained, variability is managed by the process and the
outcome of the process can be predicted over the ranges of material variability, process
parameters and manufacturing conditions. PAT includes the optimal application of
process analytical chemistry (PAC) tools, feed-back process-control strategies,
information management tools, and product-process optimisation strategies to the
manufacture of pharmaceuticals (Balboni, 2003). Advantages of implementing PAT
would be reduced cycle times, prevention of rejects, reduction of human errors by
automation, and facilitation of continuous processing to improve efficiency. Another
gain of applying PAT would be that laborious testing of the finished product is avoided
because the product can be released based on the in-process documentation. The
European guidelines offer also this possibility calling the concept parametric release
(EMEA, 2001). The benefits of implementation of PAT will vary depending on the
product. Manufacturing of complex dosage forms as tablets will probably gain most
(Balboni, 2003). The application of PAT to crystallization processes has been discussed
recently (Yu et al., 2004).
2.4.3 Process analytical technology tools
The main tools in the process analytical technology framework can be categorized as
multivariate data analysis tools; process analytical chemistry tools; process monitoring
and control tools; and continuous improvement and knowledge management tools
(FDA, 2003a).
Multivariate data analysis tools To effectively use the large body of data
collected during a development program, means are needed in order to extract the
relevant information from the large amount of data collected. In addition, traditional
one-factor-at-a-time experiments do not effectively reveal interactions between product
and process variables. Chemometric techniques can be applied for multivariate data
analysis and design of experiments. Chemometrics can be defined as the science of
24
- Theory and literature survey -
relating measurements made on a chemical system to the state of the system via
application of mathematical and statistical methods and computer sciences (Geladi and
Dåbakk, 1995; Wise and Kowalski, 1995). There is a myriad of chemometric methods
available. The methods can be roughly divided into (Beebe et al., 1998; Brereton, 2003)
experimental design frameworks; signal pre-processing techniques; dimension reduction
tools, such as principal components analysis (PCA); and multivariate calibration and
prediction methods, such as partial least squares (PLS). The chemometric tools in
conjunction with knowledge management tools can be used to define the product and
process variables that are critical to product performance. In the following, the
chemometric tools used in this thesis are presented.
The most popular linear projection method in chemistry is principal components
analysis (PCA). It allows projection of multivariate data into a few new variables, which
maximize the capture of data variance. The original data matrix, X (I x J matrix) is
decomposed to scores, T (I x A matrix) and loadings, PT (A x J matrix) (Fig. 7). The
scores describe the variation in the data and the loadings describe how the principal
components are related to the original variables. The residual matrix, E, contains the
part not modelled by the scores and loadings i.e. the noise.
Fig. 7. A schematic description ofprincipal components analysis.The original data matrix (X) is decomposed to scores (T) and loadings (PT). The residual matrix (E) is the part of X which the scores and loadings do not explain. The arrows present the dimensions of the matrixes and A is the number of principal components extracted. Modified from Grung (1996) and Brereton(2003).
J JJ A
PT A
+ X = T E I I I
The decomposition can be written as
1 1 2 2' ' ... 'A AX t p t p t p E= + + + + (11)
where t denotes the score vector, p the loading vector, A the number of principal
components extracted and E the residuals which are not described by the model.
Another projection method, which is conceptually close to PCA, is the self-
organizing map (SOM). The main difference between these methods is that the SOM is
25
- Theory and literature survey -
non-linear. The SOM is a map of nodes bound to their neighbours by elastic bonds. The
trained SOM is ordered in such a way that data clusters with similar properties are
located near each other. In an n-dimensional data space, if the input vector is denoted by T
1 2[ , ,..., ]nx x x x= and the location vector of a mapping node by ,
the algorithm describing the self-organizing operation can be written as follows
(Kohonen, 1997):
T1 2[ , ,..., ]i i i inm m m m=
I Initiate the locations of nodes with random values.
II For each vector of the training data compute steps IIIa and IIIb,
IIIa find the SOM node mc best matching to the data vector x(t) by searching
all nodes mi
{ }( ) ( ) min ( ) ( )c iix t m t x t m t− = − (12)
IIIb adjust the locations of the nodes
{ }( ) ( ) ( ) ( ) , for ( 1)
( ), for all other indicesi i
ii
m t t x t m t i Nm t
m tα + − ∈
+ =
c . (13)
In Eq. (13) Nc refers to a neighbourhood set of array points around the node c. The
Euclidean metric can be used as the distance measure in Eqs. (12) and (13). The
parameter α(t) in eq. (13) defines the learning rate, i.e. how much the winning node and
its neighbourhood are moved to the direction of the data vector x(t), and it should
decrease slowly with time. A diagram on the architecture of the map is presented in Fig.
8.
Fig. 8. The self-organising map architecture. The black neuron depicts a best matching unit and the dark neurons around it show the neighbourhood.
node
…1 2 n input layer
n-dimensional input signal
26
- Theory and literature survey -
Process analytical chemistry tools The objective of process analytical chemistry
(PAC) is to obtain quantitative and qualitative information about a chemical process
(Callis et al., 1987). This information can be used to monitor, control and optimise
processes in terms of capacity, quality, cost, consistency and waste reduction
(McLennan, 1995). The available PAC tools have developed from simple process
measurements, such as pH, temperature and pressure, to ones that measure chemical and
physical attributes of the product.
Different possibilities exist to perform measurements from a process (Callis et al.,
1987; McLennan, 1995). These different ways of analysis can be defined as follows:
Off-line, manual sampling with transport to a centralised laboratory; at-line, the analyser
is located in close proximity of the process; on-line, the sampling and the analysis are
automated; in-line, the analyser probe is located in the process stream; and non-invasive,
the measurement is performed using a probe which is not in contact with the process
stream (Callis et al., 1987). Other authors treat the last three concepts as one group
(McLennan, 1995).
Process monitoring and control tools Process monitoring and control strategies
offer the possibility to monitor the state of the process and to actively change the
process variables to maintain a desired state. After identifying the critical material and
process attributes related to product quality, systems enabling the real-time or near real-
time measurement of these should be designed. Mathematical relationships between
these measurements and the product quality attributes should then be developed.
Further, process controls that actively adjust the process in order to achieve the desired
process outcome should be created. Then, it should be possible to determine process
end-points by achievement of the desired product or in-process material attributes.
Spectroscopic methods such as diffuse reflectance NIR and Raman can be applied
for real-time measurements. NIR has been applied to process monitoring of production
of API (Norris et al., 1997; Norris and Aldridge, 1996), nanoparticle production
(Higgins et al., 2003), powder blending (Hailey et al., 1996; Sekulic et al., 1996; Ufret
and Morris, 2001), fluid bed granulation (Frake et al., 1997; Goebel and Steffens, 1998;
Rantanen et al., 1998), coating (Andersson et al., 1999; Andersson et al., 2000; Kirsch
and Drennen, 1996), drying (Harris and Walker, 2000; Zhou et al., 2003) and
27
- Theory and literature survey -
lyophilization (Brülls et al., 2003; Last and Prebble, 1993). Raman spectroscopy has
been utilized in in-line synthesis monitoring (Svensson et al., 2000) and in-situ
monitoring of polymorph conversion (Starbuck et al., 2002) of APIs, and in end-point
detection of blending (Vergote et al., 2004).
Continuous improvement and knowledge management tools It is emphasized in
the PAT strategy, that continuous learning throughout the life-time of a product is
important. This can be achieved through continuous data collection and analysis using
information technology systems that allow knowledge acquisition from process and
other databases. Continuous improvement also requires increasing cooperation between
formulation, process development and manufacturing organisations. In addition, the
information technology systems should be designed in a way that allows all these
organisations an access to the PAT data and already existing data systems, and enables
the compilation of data in a straight forward manner (Neway, 2003). Otherwise the full
potential of the large amounts of data gathered by PAT will be lost. The lack of real-
time data availability with a connection to the end-point user may be one of the largest
obstacles to better compliance and operation efficiencies.
28
3 AIMS OF THE STUDY
The overall aim of the present study was to elucidate the use of spectroscopic methods
as means to gain process understanding in wet agglomeration. The wet agglomeration
process was studied from two different aspects. On one hand, the impact of the process
on the solid-state of the active pharmaceutical ingredient was studied and, on the other
hand, the progress of agglomeration itself was looked into in high-shear mixers. As the
spectroscopic and other process analytical methods produce a large amount of data,
dimension reduction tools were studied as well. The specific aims were:
- to study anhydrous to hydrate transformations of two structurally related
model drugs during wet agglomeration using near-infrared and Raman
spectroscopy
- to investigate the effect of excipients on hydrate formation of theophylline
- to compare near-infrared spectroscopy with an established method,
impeller torque measurement, in the characterization of wet agglomeration
- to get fundamental understanding by combing information obtained by
different measurement techniques in the visualisation of wet massing
phase of high-shear granulation
- to investigate two visualisation approaches, a linear and a non-linear, in
the visualisation of the combined granulation process data.
29
4 EXPERIMENTAL
Detailed descriptions of the materials and methods can be found in the respective papers
(I-VI).
4.1 Materials
Anhydrous theophylline (form II) from BASF (Ludwigshafen, Germany) (I, II, V, VI)
and Orion Pharma (Espoo, Finland) (III, IV) and anhydrous caffeine (low temperature
form) from Orion Pharma (Espoo, Finland) (II) were used as model drugs. α-Lactose
monohydrate (Pharmatose 200M, DMV International, Veghel, the Netherlands) (III-
The heating rate was 10 °C min-1 over a temperature range of 25-300 °C.
34
- Experimental -
4.5 Data analysis
4.5.1 Combination of process data to a process vector
Vectors were constructed from the process and spectral data (VI) describing the state of
the process at each sampling time point. Data logged by the high-shear mixer was used:
added water amount, impeller torque and increase in product temperature. The baseline-
corrected water absorbance peak height at 1930 nm was used to follow the water
amount. Ratios (D) of two second-derivative spectral wavelengths were used:
( )( )
1
2
2
2
log 1/
log 1/
d RD
d Rλ
λ
=
(14)
where the wavelength of interest was divided by another wavelength normalizing
scattering effects (Luner et al., 2000). The second derivative wavelengths were chosen
by performing a principal component analysis (Simca-P 8.0, Umetrics AB, Umeå,
Sweden). The nominator wavelengths were chosen from wavelengths with high
loadings (explaining most of the variation in the data) and the denominators were
chosen from the wavelengths with loadings near zero. These ratios were as follows:
d1154/d1498, OH combination band of water; d1414/d1498, 1st overtone of OH; d1668/d1702,
CH stretch of theophylline; d1902/d2114, OH combination band of free water; d1970/d2114,
OH combination band of theophylline hydrate water. In addition, the slope of the
spectrum baseline was used in the vector. These combined data vectors were then
analysed using PCA and SOM.
4.5.2 Principal components analysis
The at-line NIR data from the water addition to theophylline (II) and the combined
process data (VI) was analysed using principal components analysis (Simca-P, 8.0,
Umetrics AB, Umeå, Swden).
4.5.3 Self-organizing maps
The combined process data (VI) was analysed also using self-organizing maps (SOM).
The SOM computation was run in Matlab (v. 5.3, MathWorks Inc., Natick, MA, USA)
using a public domain toolbox (SOM toolbox for Matlab, 2003) and default settings.
35
5 RESULTS AND DISCUSSION
5.1 Hydrate formation during wet granulation
In order to create better process understanding, the PITs possibly taking place should be
understood and under control. Therefore, means are needed which can detect these
phenomena and which can be used to follow the events real-time. Wet granulation is
probably one of the harshest processes used in the production of pharmaceuticals in
terms of moisture and heat and, therefore, offers conditions that favour PITs. Hydrate
formation is a PIT which can take place during this process. The model drugs used in
this thesis, theophylline and caffeine, are examples of substances that exhibit this kind
of behaviour (Bogardus, 1983; Herman et al., 1988). Many of the methods traditionally
used for the characterisation of hydrates do not enable real-time measurements as NIR
and Raman spectroscopy do. In this chapter, the use of NIR and Raman spectroscopy in
detecting hydrate formation and the effect of excipients on this is discussed. In addition,
the information obtained of the behaviour of the model drugs by these methods is
touched upon. Moreover, the effect of hydrate formation on the granulation liquid
requirement is discussed.
5.1.1 Detection of hydrate formation during granulation
The hydrate formation of theophylline (I) and caffeine (II) during granulation was
detected using near-infrared spectroscopy. With increasing water content, absorbance
maxima were observed at around 1475 and 1970 nm for theophylline and at around
1460 and 1960 nm for caffeine. These maxima could be related to the hydrate water. At
large water amounts, free water absorbances (Choppin and Violante, 1972; Fornés and
Chaussidon, 1978; Iwamoto et al., 1987) were observed at around 1410 and 1905 nm.
The hydrate water absorbance could be separated from the free water absorbance by
carrying out a second-derivative transformation. It was also possible to detect the
hydrate formation by Raman spectroscopy (II). Upon hydrate formation several bands
shifted in the Raman spectra of the model substances. However, the vibrations of water
were not generally detected as water is a weak Raman scatterer, but instead the changes
taking place in the vibrational state of the drug molecules.
36
- Results and discussion -
The kinetics of solution-mediated transformations are usually investigated by
measuring the concentration profile of the transforming drug in solution (Davey and
Garside, 2000; Davey et al., 1986). This is however difficult in wet masses where the
amount of liquid is small. It was possible to follow the rate of transformation by NIR
spectroscopy in wet masses of theophylline (IV).
When creating a process analytical method it is necessary to investigate how the
matrix, i.e. other substances in the product, affects the signal collected. Hence, the effect
of two common excipients was studied. α-Lactose monohydrate and silicified
microcrystalline cellulose (SMCC) did not interfere with the detection of hydrate
formation using either of the methods (III). The hydrate water of lactose and the
absorbed water in the SMCC were observed at different wavelengths in the 2nd
derivative spectra than the hydrate water of theophylline, thus not interfering with the
detection of theophylline hydrate water absorbance. The excipients had minor or no
Raman peaks at the regions of interest. In addition, the Raman intensity of theophylline
was much higher than that of the excipients.
According to the NIR results the conversion to monohydrate was completed at
lower water amounts (I) or at earlier time points (IV) than to XRPD results. These
discrepancies might be explained by differences in the effective sample sizes of the
methods. NIR spectroscopy is a surface method, whereas x-rays penetrate throughout
the sample. Various NIR information depths have been reported for pharmaceutical
materials ranging from 100 µm (Andersson et al., 1999) to 500 µm (Hammond et al.,
1999). Different materials exhibit different information depths due to variation in
particle size, chemical composition and degree of compaction (Berntsson et al., 1998;
MacDonald and Prebble, 1993). The effective sample size is also dependent on the
wavelength (Berntsson et al., 1998). The small effective sample size can impede the use
of NIR quantitatively.
5.1.2 Comparison of Raman and near-infrared spectroscopy
It was possible to follow the hydrate formation by both methods (II, III). The NIR
spectroscopy enables the determination of the state of water and has also been used for
quantitative determination of moisture (Osborne et al., 1993). However, the prominent
OH absorption may dominate the spectra, so that the changes in other vibrations
37
- Results and discussion -
originating from other constituents are obscured. In addition, if the water content is
high, such as in granulation with water absorbing excipients, the free water absorbance
may overlap the hydrate water absorbance (Fig. 9). In this case, the original, not
transformed water absorbance maximum (not shown) becomes so broad and blunt that it
seems in the second-derivative spectra that the hydrate amount would decrease instead
of increasing. A similar
observation has been reported
when studying hydrate
formation during extrusion-
spheronisation (Laitinen et
al., 2004). This problem is
not encountered using Raman
spectroscopy, as water does
nearly not affect the spectra
at all. Raman spectroscopy
has been successfully used in
quantitation of hydrates
during wet massing and in
aqueous slurries (Rantanen et
al., 2004).
1860 1880 1900 1920 1940 1960 1980 2000-2.5
-2
-1.5
-1
-0.5
0
0.5
1
1.5
2x 10⁻³
Wavelength (nm)
2nd d
eriva
tive
log(
1/R
)
Fig. 9. Second derivative NIR spectra of theophylline -microcrystalline cellulose (1:1, w/w) wet granules. The water content ranges from 0.17-0.86 ml g-1. Absorbance maxima are observed as troughs. Free water: 1905 nm, hydrate water: 1970 nm. Arrows indicate changes taking place with increasing water content. (Data from publication V).
Due to the broad and overlapping peaks and strong effect of the physical
appearance of the samples in NIR spectroscopy, multivariate calibration is necessary in
most cases, although univariate calibration models with adequate accuracy and
precision have also been presented (Patel et al., 2001). The peaks are better resolved in
Raman, making it easier to develop a univariate calibration model. Multivariate
calibration is often more straightforward to develop than univariate, but care has to be
taken to select a sufficient amount of calibration and validation samples displaying all
the possible variability encountered in the systems under study. If there is a slight
change in the raw materials (e.g. new impurities, different particle size), the probability
that this will affect the accuracy and precision of a multivariate method is greater than
for a univariate method.
38
- Results and discussion -
5.1.3 Differences between theophylline and caffeine
Theophylline and caffeine form similar channel hydrates (Sun et al., 2002; Sutor,
1958a,b), caffeine having a larger channel cross-sectional area (Perrier and Byrn, 1982).
There were smaller differences in the Raman spectra of caffeine and its hydrate than
between those of theophylline and its hydrate (II). This suggests that a larger
rearrangement takes place during hydrate formation of theophylline than during that of
caffeine. The OH combination band of caffeine 4/5-hydrate (1960 nm, II) was observed
at a shorter wavelength than that of theophylline monohydrate (1970 nm, I). The
respective force constants, calculated using Eq. (7), are 1454 and 1439 Nm-1. This
indicates that the average strength of caffeine 4/5-hydrate OH bonds is greater than that
of theophylline monohydrate. The caffeine hydrate is less stable than the theophylline
hydrate, caffeine having lower activation energy of dehydration (Perrier and Byrn,
1982). It has been suggested that only a fraction of the water molecules located in the
caffeine hydrate channel are hydrogen bonded to the caffeine, whereas the water
molecules in theophylline hydrate are firmly linked to the theophylline molecules
(Edwards et al., 1997; Sutor, 1958b). This is probably reflected in the force constants.
Anhydrous theophylline transformed to a hydrate at smaller water amounts than
anhydrous caffeine (I, II), indicating that anhydrous caffeine is more stable during wet
granulation. The caffeine 4/5-hydrate is unstable at ambient conditions, and its
dehydration rate increases when the particle size is small (Griesser and Burger, 1995).
The vigorous mixing during granulation does probably not allow growth of large
crystals. Therefore, caffeine 4/5-hydrate crystals are likely to partially dehydrate,
although there would theoretically be enough water for all the caffeine to transform into
hydrate. The DSC dehydration endotherm of theophylline was located at a lower
temperature for the granules than for the long crystals crystallized from water (I),
indicating that the hydrate formed during wet granulation is more likely to dehydrate
than one crystallised from water. Moreover, it cannot be ruled out that the difference
might be partially related to the kinetics of the transformation; the kinetics of caffeine
being slower (Rantanen et al., 2004).
39
- Results and discussion -
5.1.4 Effect of excipients on hydrate formation
The API is usually present in an excipient matrix in pharmaceutical solid dosage forms.
The excipients that exhibit water absorbing capability might have an effect on the
hydrate formation of drugs. For example, it has been found that MCC affects the
hydrate formation of anhydrous lactose (Angberg et al., 1991) and polyvinylpyrrolidone
protects theophylline against hydrate formation (Kesavan and Peck, 1996) in different
relative humidities. Thus, the effect of excipients on the extent and kinetics of hydrate
formation was studied. Two physico-chemically different excipients were chosen for the
study: SMCC and α-lactose monohydrate.
MCC1 is a porous material capable of taking up significant amounts of moisture
(Fielden et al., 1988; Zografi and Kontny, 1986). The absorbed water may exist in at
least three different thermodynamic states in the amorphous region of MCC: directly
bound to hydroxyl groups, as free water and in (an) intermediate state(s) (Zografi, 1988;
Zografi and Kontny, 1986). SMCC was able to inhibit the formation of theophylline
monohydrate in wet masses with low water contents (III). However, the inhibitory
effect was not observed at water contents ≥ 0.1 g g-1 in the samples equilibrated
overnight (III). SMCC slowed down the hydrate formation rate of theophylline at a
water content of 0.1 g g-1 (IV). The absorbing process of SMCC might be faster than the
hydrate formation, but then again, the hydrate formation might be thermodynamically
favoured. This would explain the lag time and the retarding effect of SMCC, and the
lack of the inhibiting effect at the end, respectively. Airaksinen et al. (2003) studied the
effect of a wide range of excipients on hydrate formation of nitrofurantoin in wet
masses. They found that low-substituted hydroxylpropyl cellulose inhibited totally the
hydrate formation even at relatively high moisture contents (4 g g-1 of added water).
α-Lactose monohydrate is a crystalline material, characterized by its high aqueous
solubility. The presence of α-lactose monohydrate in the wet masses increased the
amount of hydrate formed (III) and seemed to increase the kinetics of the hydrate
formation (IV) as well at a low water content. The origin of this slight, enhancing effect
was not found, although it was speculated that it might be due to faster wetting (III, IV). 1 The interactions of MCC and SMCC with water have shown to be similar (Buckton et al., 1999;
Luukkonen et al., 2001); hence, literature concerning MCC is used to explain the results.
40
- Results and discussion -
5.1.5 Effect of hydrate formation mechanism on liquid requirement of wet
granulation
It was observed that theophylline monohydrate, which was prepared by hydration in
high relative humidity, became over-granulated with a smaller quantity of water than
anhydrous theophylline (V). The difference in liquid requirement was approximately
0.1 ml g-1, when the theoretical amount of water taking part in the hydrate formation of
anhydrous theophylline was taken into account. The difference observed using the high-
shear granulation equipment was confirmed by mixer torque rheometry. A similar
difference was perceived in the liquid amount needed for reaching the maximum torque
value of the two forms. The product temperatures of anhydrous theophylline in the
high-shear mixer were about 4 °C higher than that of theophylline monohydrate,
suggesting that more evaporation could have taken place in the anhydrous theophylline
masses. However, the temperature difference was minor (0.6 ± 0.1 °C) in the MTR
measurements, indicating that this was probably not the explanation.
Different powder properties, which are related to the granulation liquid
requirement, were evaluated, in order to explain the observed difference (V). Particle
size affects the liquid requirement, as smaller particles having a larger surface area
require more liquid. Although problems were encountered with the particle size
measurements, the particle sizes of the two powders were evaluated to be so similar,
that it is unlikely that this would have such a large impact on the liquid requirement.
Moreover, the liquid requirement is increased by poor wetting. The smaller contact
angle of anhydrous theophylline indicated a smaller liquid requirement in contrast to the
results. Furthermore, attempts were made to measure the specific surface area of the two
theophyllines. Unfortunately, the monohydrate dehydrated during the sample
preparation, making the measurements of theophylline monohydrate impossible.
Thus, it was assumed that the phase transition occurring during granulation might
cause the difference. The MTR mean torque curves were almost identical when the
experiments were performed using fractionated coconut oil instead of water as the liquid
(V). This result indicates that the phase transition from anhydrous theophylline to
theophylline monohydrate during granulation was the cause of the increased liquid
requirement.
41
- Results and discussion -
5.2 Monitoring wet granulation in a high-shear mixer
The only high-shear granulation process monitoring strategies, which have won wider
popularity, are power consumption and impeller torque measurements. These
techniques have although some drawbacks. They are affected by equipment and process
variables (Holm et al., 2001). In addition, adhesion to the bowl wall may create
irreproducible results (Lindberg, 1977; Mackaplow et al., 2000). It has been also
mentioned that hydrate formation during granulation disturbs the measurements (Bier et
al., 1979), but it has not been presented how. Hence, new methods would be desirable.
NIR spectroscopy is a fast method, which is capable of detecting both chemical and
physical changes in powder samples. Thus, it may be a potential method for process
monitoring of high-shear granulation. In this chapter, one of the standard methods
describing the state of wet agglomerates, namely the impeller torque, is compared to
data obtained by at-line NIR measurements. In addition, the effect of hydrate formation
on the impeller torque is discussed.
5.2.1 Near-infrared spectroscopy versus impeller torque
The use of the NIR spectra in reflecting agglomerate properties was investigated from
two different aspects: using baseline corrected water absorbances, which expressed the
water amount in the system, and the slope of the spectrum baseline, which reflected
changes in the physical properties of the samples. These outputs were compared to the
impeller torque, which use is well described in the literature. The impeller torque curves
of the different materials and their mixtures had the typical shape reported earlier (Bier
et al., 1979), save α-lactose monohydrate (V).
Non-linearity was observed in the baseline corrected water absorbances (V). The
hydrate formation of theophylline resulted in an increasing slope of the water
absorbances at the used wavelengths. The slope of the baseline corrected water
absorbance at 1930 nm of MCC and the MCC mixtures declined at the torque plateau,
i.e. at the optimal water amount region stated by Leuenberger and co-workers (Bier et
al., 1979). The baseline corrected water absorbance at the shorter wavelength (1450 nm)
showed also similar non-linearity, but at higher water amounts. Earlier, it has been
proposed that non-linearity of the output of a near-infrared moisture analyser, measuring
at 1940 nm, could be used to estimate the optimal water amount for granulation (Miwa
42
- Results and discussion -
et al., 2000). It is difficult to compare those results to the present ones, as the water
amount ranges used are different, and because the restricted amount of sampling points
in the present study does not allow observing subtle changes as in that work.
As discussed previously, it has been stated that the optimal liquid amount is
located at the power consumption/torque plateau (Bier et al., 1979). This plateau can
however be rather wide, wherefore the torque measurement cannot be used alone to set
the precise end-point. The slope of the spectrum baseline increased linearly in the water
amount region where the impeller torque had a plateau (V). The SEM images indicated
that the agglomerates changed during this period (V). If this is the case, the impeller
torque fails to display changes taking place during the plateau stage, whereas changes
are observed in the slope of the spectrum baseline. The slope increases due to changes
in the path length of the NIR radiation. The main factors responsible for this change are
the particle size and the consolidation of the powder mass. Additional studies,
w/w) mixtures (V). This might have been because the presence of water absorbing
MCC delays the hydrate formation (IV). Therefore, it may be possible to use impeller
torque measurements in process control, if the amount of hydrate forming API is small
in the formulation and it contains water absorbing excipients.
5.3 Projections of wet granulation processes
The amount of data obtained by timely measurements from a process, especially when
using spectroscopic methods, is large and the data is often multidimensional. In
addition, the relation of the different factors affecting the process is often complex, as in
wet granulation. Visualisation is an efficient way to present data, as can be seen in the
scientific literature where plotting data is common. Multivariate data is however
difficult to grasp by this method, because the highest amount of dimensions that can be
used is three. Projection methods may be applied to compress large data sets to a few
new features and thereby enabling the visualization of the data (Daszykowski et al.,
2003). In this chapter, principal components analysis (PCA) is used to visualize hydrate
formation during wet granulation. In addition, principal components analysis is
compared to self-organizing map (SOM) in the visualisation of a wet granulation
process.
5.3.1 Principal components analysis in visualising an anhydrous to hydrate
transition
The at-line NIR measurements of the wet masses of theophylline (II) were represented
by three principal components explaining 99.9% of the variation in the data. These
components created a 3-dimensional space, where the scores depicted a path. The
44
- Results and discussion -
corresponding loadings showed that the first two principal components represented
hydrate formation, observed as a OH-hydrate water band (1970 nm) and changes in CH
vibrations (1600-1700 nm). The third principal component was affected by free water
absorbance (1905 nm). Thus, the hydrate formation and the increase in free water may
be monitored using NIR and PCA.
In addition to merely visualizing events taking place during a process, PCA can
be applied for process monitoring and control. Earlier, PCA has been applied to process
monitoring in other fields (Kourti and Macgregor, 1995; Wise and Kowalski, 1995) and
recently, to process monitoring of a pharmaceutical synthesis (Svensson et al., 2000). In
addition, PCA has been proposed for monitoring the opposite event, dehydration, taking
place during drying of API (Zhou et al., 2003). PCA can be used to create a process
signature, and is sensitive to all variation in the data, including also variations which
may not have an influence on the product quality. If more focus on product variables is
desired, PLS may be a better choice, as it takes in account those process variables that
have an impact on the product variables (Nomikos and Macgregor, 1995).
5.3.2 Comparison of principal components analysis and self-organizing map
Despite of the potential of the spectroscopic methods, the traditional process monitoring
techniques should not be forgotten but combined with the others by multivariate tools.
In this work, this was conducted creating a process vector where all the different
information available was included (VI). These vectors were then visualised using two
different dimension reduction techniques. None of the measurement techniques were
able to describe the state of the process alone at all stages (VI). The visualisation
methods applied were however able to discriminate the different states of the process
from each others.
The principal components analysis (PCA) provided a three-dimensional picture of
the process (VI). However, all the principal components were influenced by almost all
of the individual variables, making the interpretation of movement along a single
principal component using of the loadings plot difficult. The self-organizing map
(SOM) enabled the presentation of data on a two dimensional plane on which the
progress of the process was depicted (VI). The SOM was not superior to the PCA but
had some advantages. It could be used to investigate the relationships of the variables in
45
- Results and discussion -
a simple manner using the component plots. These plots allowed the study of the
original variables during the process and revealed non-linearities and global and local
correlations of the variables. The SOM locates close data points in the same SOM
element, whereas PCA conserves the minute differences in the data structure. In
addition to merely studying a process and the relationships of different variables, the
SOM have also been proposed for real-time process monitoring (Simula and Kangas,
1995). Examples have been presented from the chemical (Tryba and Goser, 1991) and
metallurgical (Jämsa-Jounela et al., 2003) industries.
46
6 CONCLUSIONS
Near-infrared (NIR) and Raman spectroscopy could be used to study hydrate formation
in wet masses. The presence of two common excipients did not disable the
measurements. It was observed that silicified microcrystalline cellulose retarded the
hydrate formation of theophylline.
The NIR outputs showed changes at the impeller torque plateau i.e. at the optimal
water amount. When granulating substances that require large liquid amounts, the slope
of the baseline corrected water absorbance declined at the impeller torque plateau. In
addition, the slope of the spectrum baseline increased at the plateau indicating that
granule growth and consolidation took place also in this phase. The results suggested
that NIR spectroscopy is applicable to process end-point monitoring of wet granulation
in high-shear mixers.
The combination of process data made it possible to follow the wet granulation
process in a manner which none of the individual process measurements enabled.
Principal components analysis (PCA) and self-organizing maps (SOM) provided a way
to visualise the progress of the process. The PCA reflected minute differences in the
data whereas the SOM provided a more generalised picture. The study of the effect of
the original variables to the state of the process was more straightforward using the
SOM. When using only NIR data, the PCA was able to differentiate between hydrate
formation and the increase of free water in the system.
The spectroscopic methods studied were able to give information of a solid-state
transformation in wet masses and NIR reflected changes taking place during wet
granulation. These methods could be used to elucidate physical changes induced due to
wet granulation deliberately or unintentionally, such as increase in size and
consolidation of agglomerates or processing-induced transformations. This kind of data,
combined with other process data and analysed by dimension reduction tools can supply
picture of the state of the process. Thus, the methods can be used to provide information
which may contribute in creation of better process understanding. These methods can
also be applied in real-time, enabling the development of process control tools that
monitor several aspects of the process at the same time.
47
7 PERSPECTIVES
The results presented in this thesis showed that various kinds of information can be
derived from wet granules by spectroscopic methods. In the future, it should be
investigated, if the NIR and Raman methods presented in this thesis can be performed
by non-invasive measurements delivering real-time data. The off- and at-line
measurements used in the thesis are not fast enough to allow the gathering of real-time
or near real-time data of the process, because granulation processes, especially high-
shear granulation, are relatively fast. The creation of a non-invasive process interface is
a science of its own, where different aspects, such as movement of the material in the
process vessel, material and placement of the interface as well as temperature changes
during the process, have to be considered. Successful non-invasive NIR measurements
have been performed from fluid bed granulators, but there has not been published any
non-invasive NIR measurements from high-shear mixers to date.
From a process analytical technology point of view, it would be desirable to
measure and control all different aspects of a process that have an effect on the product
performance. If real-time measurement of these would be possible, the self-organizing
map would allow the monitoring and control of the desired process state. The state of
the process could be displayed by a cursor indicating the node which represents each
process state on the SOM. If fault situations and undesired process runs are introduced
in the training of the SOM, it could also be used for fault diagnostics.
In the papers V and VI of this thesis, the focus was on the water addition phase of
high-shear granulation. In the future, it would be interesting to investigate if NIR
spectroscopy could be use to monitor the wet massing phase as well. At the moment, the
wet massing phase is usually controlled by running the process a certain period of time
determined by experiments. The slope of the NIR spectrum baseline might permit a
more flexible process control than the present way.
48
ACKNOWLEDGEMENTS
I wish to thank all the persons who have contributed to this work in Finland, in
Denmark and abroad.
First of all, I wish to express my deep and sincere gratitude to my supervisor
Docent Jukka Rantanen for inviting me to this exiting journey into the realm of science
and helping me along the way. Without his knowledge, enthusiasm and encouragement,
this project would not have been possible. Furthermore, I am deeply grateful to my co-
supervisor Professor Jouko Yliruusi for his guidance and support.
I am most grateful to Associate Professor Torben Schæfer at the Danish
University of Pharmaceutical Sciences for his kind guidance. His never-lacking
attention, infallible eye for errors and accurate comments taught me a lot of scientific
thinking and writing.
I wish to express my warmest gratitude to my former colleague Dr. Pirjo
Luukkonen for her tireless optimism and enthusiasm, and for the scientific and other
discussions we had in Helsinki and in Gothenburg. In addition, I wish to thank her for
welcoming me to her home on my visits to Gothenburg. I wish also to thank Adjunct
Professor Anne Juppo for making my stay at AstraZeneca R&D Mölndal possible, for
sharing her expertise and for her valuable comments.
I wish to express my appreciation to Professor Jari Yli-Kauhaluoma and Dr. Poul
Bertelsen, the reviewers of the thesis, for their constructive comments on the
manuscript.
I am most grateful to my co-authors at the Division of Pharmaceutical
Technology, M.Sc. Sari Airaksinen, Dr. Milja Karjalainen and Dr. Eetu Räsänen, for
fruitful co-operation. I wish to thank my co-author Dr. Sampsa Laine at the Laboratory
of Computer and Information Science, Helsinki University of Technology for his help
with the self-organizing maps and for the colourful (sic!) discussions on chemometrics.
I express my appreciation to Docent Leonid Khriachtchev at the Laboratory of Physical
Chemistry, University of Helsinki for his co-operation in the field of Raman
spectroscopy.
49
- Acknowledgements -
Special thanks belong to my colleagues at the Division of Pharmaceutical
Technology for creating a pleasant atmosphere at work and for having lots of fun after
work, as well as for discussing science and other issues with me. I wish especially to
thank M.Sc. Marja Savolainen for her positive view on all aspects of life, for her
friendship and for shearing the moments of excitement and despair.
I would like to thank the staff at the Department of Pharmaceutics, The Danish
University of Pharmaceutical Sciences for welcoming me to the Department and to
Denmark. Special thanks belong to my colleagues on the “7 floor” for their scientific
help, for the relaxed atmosphere and for showing me that scientists, and even PhD
students, can have life outside the university as well. I wish to thank especially Dr.
Anette Seo Torstenson and M.Sc. Anne Flachs Nielsen, who have shared the ups and
downs of the later part of my PhD study with me.
th
Dr. Janne Suhonen and Dr. Pentti Niemelä at VTT Electronics, Finland are
gratefully thanked for their help with Raman measurements. Dorrit Johnsen at the
Danish University of Pharmaceutical Sciences is heartily thanked for her help with
particle size measurements and scanning electron microscopy.
The National Technology Agency in Finland (TEKES), The Nordic Academy for
Advanced Study (NorFA) and The Finnish Cultural Foundation are acknowledged for
financial support. The Danish University of Pharmaceutical Sciences and AstraZeneca
R&D Mölndal are thanked for giving the opportunity to use their facilities. Pharmia Oy
is thanked for providing measurement time at the FT-NIR instrument.
My warmest thanks belong to my beloved parents, brother and sister for their
loving support and encouragement. The warm support of my family-in-law is heartily
acknowledged, as well.
Finally, I want to thank my dear husband and best friend, Flemming, for listening
to my endless talk on work issues, for valuable comments on the thesis and, especially,
for always being there for me.
Copenhagen, June 2004
50
REFERENCES
Abboud, L. and Hensley, S., 3-9-2003. New prescription for drug makers: update the plants. Wall Street Journal.
Airaksinen, S., Kivikero, N., Karjalainen, M., Räsänen, E., Rantanen, J., and Yliruusi, J., 2003. Effect of formulation on the hydrate formation of nitrofurantoin in wet masses. AAPS Pharm.Sci. 5 (4) T2236.
Aldridge, P.K., Evans, C.L., Ward, H.W., II, Colgan, S.T., Boyer, N., and Gemperline, P.J., 1996. Near-IR Detection of Polymorphism and Process-Related Substances. Anal.Chem. 68 997-1002.
Amidon, G.L., Lennernäs, H., Shah, V.P., and Crison, J.R., 1995. A theoretical basis for a biopharmaceutic drug classification: the correlation of in vitro drug product dissolution and in vivo bioavailability. Pharm.Res. 12 (3) 413-420.
Andersson, M., Folestad, S., Gottfries, J., Johansson, M.O., and Wahlund, K.-G., 2000. Quantitative Analysis of Film Coating in a Fluidized Bed Process by In-line NIR Spectrometry and Multivariate Batch Calibration. Anal.Chem. 72 2099-2108.
Andersson, M., Josefson, M., Langkilde, F.W., and Wahlund, K.-G., 1999. Monitoring of a film coating process for tablets using near infrared reflectance spectrometry. J.Pharm.Biomed.Anal. 20 27-37.
Angberg, M., Nyström, C., and Castensson, S., 1991. Evaluation of heat-conduction microcalorimetry in pharmaceutical stability studies. IV. The influence of microcrystalline cellulose on the hydration rate of anhydrous lactose. Int.J.Pharm. 77 269-277.
Anquetil, P.A., Brenan, C.J.H., Marcolli, C., and Hunter, I.W., 2002. Laser Raman Spectroscopic Analysis of Polymorphic Forms in Microliter Fluid Volumes. J.Pharm.Sci. 92 149-160.
Balboni, M.L., 2003. Process Analytical Technology. Concepts and principles. Pharm.Technol. 27 (10) 54, 56, 58, 60, 62, 64, 66, 254.
Barnes, R.J., Dhanoa, M.S., and Lister, S.J., 1989. Standard Normal Variate Transformation and De-trending of Near-Infrared Diffuse Reflectance Spectra. Appl.Spectrosc. 43 (5) 772-777.
Bauer, J., Spanton, S., Henry, R., Quick, J., Dziki, W., Porter, W., and Morris, J., 2001. Ritonavir: An Extraordinary Example of Conformational Polymorphism. Pharm.Res. 18 859-866.
Beebe, K.R., Pell, R.J., and Seasholtz, M.B., 1998. Chemometrics. A practical guide. John Wiley & Sons, Inc., New York, 348 p.
Berntsson, O., Danielsson, L.G., and Folestad, S., 1998. Estimation of effective sample size when analysing powders with diffuse reflectance near-infrared spectrometry1. Anal.Chim.Acta 364 (1-3) 243-251.
Betz, G., Junker Bürgin, P., and Leuenberger, H., 2003. Power consumption profile analysis and tensile strength measurements during moist agglomeration. Int.J.Pharm. 252 11-25.
Bier, H.P., Leuenberger, H., and Sucker, H., 1979. Determination of the Uncritical Quantity of Granulating Liquid by Power Measurements on Planetary Mixers. Pharm.Ind. 41 (4) 375-380.
Bogardus, J.B., 1983. Crystalline to Anhydrous-Hydrate Phase Changes of Caffeine and Theophylline in Solvent-Water Mixtures. J.Pharm.Sci. 72 837-838.
Bolton, B.A. and Prasad, P.N., 1981. Laser Raman Investigation of Pharmaceutical Solids: Griseofulvin and Its Solvates. J.Pharm.Sci. 70 (7) 789-793.
51
- References -
Bothe, H. and Cammenga, H.K., 1980. Compostion, properties, stability and thermal dehydration of crystalline caffeine hydrate. Thermochim.Acta 40 29-39.
Brereton, R.G., 2003. Chemometrics. Data analysis for the laboratory and chemical plant. John Wiley & Sons, Inc., Chichester, West Sussex, England, UK, 489 p.
Brittain, H.G., 1999. Methods for the characterization of polymorphs and solvates. In Polymorphism in Pharmaceutical Solids, Brittain, H.G. (Ed.), Marcel Dekker, Inc., New York, pp. 227-278.
Brittain, H.G. and Byrn, S.R., 1999. Structural aspects of polymorphism. In Polymorphism in Pharmaceutical Solids, Brittain, H.G. (Ed.), Marcel Dekker, Inc., New York, NY, USA, pp. 73-124.
Brittain, H.G. and Fiese, E.F., 1999. Effects of pharmaceutical processing on drug polymorphs and solvates. In Polymorphism in Pharmaceutical Solids, Brittain, H.G. (Ed.), Marcel Dekker, Inc., Ney York, pp. 331-361.
Brülls, M., Folestad, S., Sparén, A., and Rasmuson, A., 2003. In-situ Near-Infrared Spectroscopy Monitoring of the Lyophilization Process. Pharm.Res. 20 494-499.
Buckton, G., Yonemochi, E., Yoon, W.L., and Moffat, A., 1999. Water sorption and near IR spectroscopy to study the differences between microcrystalline cellulose and silicified microcrystalline cellulose before and after wet granulation. Int.J.Pharm. 181 41-47.
Bugay, D.E., 1993. Solid-State Nuclear-Magnetic-Resonance Spectroscopy - Theory and Pharmaceutical Applications. Pharm.Res. 10 (3) 317-327.
Bugay, D.E., 1995. Magnetic resonance spectrometry. In Physical Characterization of Pharmaceutical Solids, Brittain, H.G. (Ed.), Marcel Dekker, Inc., New York, pp. 93-125.
Bugay, D.E., 2001. Characterization of the solid-state: spectroscopic techniques. Adv.Drug Deliv.Rev. 48 43-65.
Buijs, K. and Choppin, G.R., 1963. Near-infrared Studies of the Structure of Water. I. Pure Water. J.Chem.Phys. 39 (8) 2035-2041.
Byrn, S., Pfeiffer, R., Ganey, M., Hoiberg, C., and Poochikian, G., 1995. Pharmceutical Solids: A Strategic Approach to Regulatory Conciderations. Pharm.Res. 12 945-954.
Byrn, S.R. and Lin, C.-T., 1976. The effect of crystal packing and defects on desolvation of hydrate crystals of caffeine and L-(-)-1,4-cyclohexadiene-1-alanine. J.Am.Chem.Soc. 98 (13) 4004-4005.
Byrn, S.R., Pfeiffer, R.R., and Stowell, J.G., 1999. Solid-State Chemistry of Drugs. SSCI, Inc., West Lafayette, IN, USA, 574 p.
Callis, J.B., Illman, D.L., and Kowalski, B.R., 1987. Process Analytical Chemistry. Anal.Chem. 59 (9) 624A-626A, 628A, 630A, 632A, 635A, 637A.
Cardew, P.T. and Davey, R.J., 1985. The kinetics of solvent-mediated phase transformations. Proc.R.Soc.Lond.A 398 415-428.
Choppin, G.R. and Downey, J.R., 1972. Near-Infrared Studies of the Structure of Water. IV. Water in Relatively Nonpolar Solvents. J.Chem.Phys. 56 (12) 5899-5904.
Choppin, G.R. and Violante, M.R., 1972. Near-Infrared Studies of the Structure of Water. III. Mixed solvent systems. J.Chem.Phys. 56 (12) 5890-5898.
52
- References -
Clas, S.D., 2003. The importance of characterizing the crystal form of the drug substance during drug development. Current Opinion in Drug Discovery & Development 6 (4) 550-560.
Clas, S.D., Dalton, C.R., and Hancock, B.C., 1999. Differential scanning calorimetry: applications in drug development. Pharm.Sci.Technol.Today 2 (8) 311-320.
Corvari, V., Fry, W.C., Seibert, W.L., and Augsburger, L., 1992. Instrumentation of a High-Shear Mixer: Evaluation and Comparison of a New Capacitive Sensor, a Watt Meter, and a Strain-Gage Torque Sensor for Wet Granulation Monitoring. Pharm.Res. 9 (12) 1525-1533.
Cullity, B.D. and Stock, S.R., 2001. Elements of X-ray Diffraction. Prentice Hall, Inc., Upper Saddle River, New Jersey, 664 p.
Curcio, J.A. and Petty, C.C., 1951. The Near Infrared Absorption Spectrum of Liquid Water. J.Optic.Soc.Am. 41 (5) 302-304.
Daszykowski, M., Walczak, B., and Massart, D.L., 2003. Projection methods in chemistry. Chem.Intell.Lab.Syst. 65 97-112.
Davey, R. and Garside, J., 2000. From Molecules to Crystallizers. An Introduction to Crystallization. Davies, S.G. (Ed.) Oxford University Press, 81 p.
Davey, R.J., Cardew, P.T., Mcewan, D., and Sadler, D.E., 1986. Rate Controlling Processes in Solvent-Mediated Phase-Transformations. J.Cryst.Growth 79 (1-3) 648-653.
Davis, T.D., Morris, K.R., Huang, H., Peck, G.E., Stowell, J.G., Eisenhauer, B.J., Hilden, J.L., Gibson, D., and Byrn, S.R., 2003. In situ monitoring of wet granulation using online x-ray powder diffraction. Pharm.Res. 20 (11) 1851-1857.
Dreassi, E., Ceramelli, G., Corti, P., Lonardi, S., and Perruccio, P.L., 1995. Near-infrared Reflectance Spectrometry in the Determination of the Physical State of Primary Materials in Pharmaceutical Production. Analyst 120 1005-1008.
Edwards, H.G.M., Lawson, E., deMatas, M., Shields, L., and York, P., 1997. Metamorphosis of caffeine hydrate and anhydrous caffeine. J.Chem.Soc., Perkin Trans. 2 (10) 1985-1990.
EMEA, 2001. Note for guidance on parametric release. http://www.emea.eu.int/pdfs/human/qwp/301599en.pdf, European Agency for the Evaluation of Medicinal Products, London, UK.
Emons, H.-H., Keune, H., and Seyfarth, H.-H., 1982. Chemical Microscopy. In Wilson and Wilson's Comprehensive Analytical Chemistry, Vol. XVI, Svehla, G. (Ed.), Elsevier, Amsterdam, The Netherlands, pp. 1-327.
Ennis, B.J., Tardos, G., and Pfeffer, R., 1991. A microlevel-based characterization of granulation phenomena. Powder Technol. 65 257-272.
FDA, 2003a. Guidance for industry. PAT - A framework for innovative pharmceutical manufacturing and quality assurance. Draft guidance. http://www.fda.gov/cder/guidance/5815dft.pdf, U.S. Food and Drug Administration.
FDA, 2003b. Process analytical Technology (PAT) initiative. http://www.fda.gov/cder/OPS/PAT.htm, U.S. Food and Drug Administration.
Ferraro, J.R. and Nakamoto, K., 1994. Introductory Raman spectroscopy. Academic Press, Inc., San Diego, CA, USA, 370 p.
53
- References -
Fielden, K.E., Newton, J.M., O'Brien, P., and Rowe, R.C., 1988. Thermal Studies on the Interaction of Water and Microcrystalline Cellulose. J.Pharm.Pharmacol. 40 674-678.
Fornés, V. and Chaussidon, J., 1978. An interpretation of the evolution with temperature of the v2 and v3 combination band in water. J.Chem.Phys. 68 (10) 4667-4671.
Frake, P., Gill, I., Luscombe, C.N., Rudd, D.R., Waterhouse, J., and Jayasooriya, U.A., 1998. Near-infrared mass median particle size determination of lactose monohydrate, evalutating several chemometric approaches. Analyst 123 2043-2046.
Frake, P., Greenhalgh, D., Grierson, S.M., Hempenstall, J.M., and Rudd, D.R., 1997. Process control and end-point determination of a fluid bed granulation by application of near infra-red spectroscopy. Int.J.Pharm. 151 75-80.
Fry, W.C., Stagner, W.C., and Wichman, K.C., 1984. Computer-Interfaced Capacitive Sensor for Monitoring the Granulation Process. J.Pharm.Sci. 73 (3) 420-421.
Fry, W.C., Wu, P.P., Stagner, W.C., Wichman, K.C., and Anderson, N.R., 1987. Computer-interfaced capacitive sensor for monitoring the granulation process II: System response to process variables. Pharm.Technol. 11 (10) 30-42.
Gaisford, S. and Buckton, G., 2001. Potential applications of microcalorimetry for the study of physical processes in pharmaceuticals. Thermochim.Acta 380 (2) 185-198.
Gao, D. and Rytting, J.H., 1997. Use of solution calorimetry to determine the extent of crystallinity of drugs and excipients. Int.J.Pharm. 151 (2) 183-192.
Geladi, P. and Dåbakk, E., 1995. An overview of chemometrics applications in near infrared spectrometry. J.Near Infrared Spectrosc. 3 119-132.
Giron, D., 1986. Applications of thermal analysis in the pharmaceutical industry. J.Pharm.Biomed.Anal. 4 (6) 755-770.
Giron, D., 1990. Le polymorphisme des excipients. S.T.P.Pharma 6 (hors-série) 87-98.
Giron, D., 1995. Thermal analysis and calorimetric methods in the characterisation of polymorphs and solvates. Thermochim.Acta 248 1-59.
Giron, D., 2001. Investigations of polymorphism and pseudo-polymorphism in pharmaceuticals by combined thermoanalytical techniques. J.Therm.Anal.Calorim. 64 37-60.
Goebel, S.G. and Steffens, K.-J., 1998. Online-Messung der Produktfeuchte und Korngröβe in der Wirbelschicht mit der Nah-Infrarot-Spektroskopie. Pharm.Ind. 60 889-895.
Grant, D.J.W., 1999. Theory and Origin of Polymorphism. In Polymorphism in Pharmaceutical Solids, Brittain, H.G. (Ed.), Marcel Dekker, Inc., New York, NY, USA, pp. 1-33.
Griesser, U.J. and Burger, A., 1995. The effect of water vapor pressure on desolvation kinetics of caffeine 4/5-hydrate. Int.J.Pharm. 120 83-93.
Griffiths, P.R., 2002. Introduction to vibrational spectroscopy. In Handbook of Vibrational Spectroscopy. Theory and Instrumentation, Chalmers, J.M. and Griffiths, P.R. (Eds.), John Wiley & Sons, Ldt., Chichester, UK, pp. 33-43.
Grung, B., 1996. Det matematiske grunnlaget for latent variabel metoder. In Anvendelse av kjemometri innen forskning og industri, Nordtvedt, R., Brakstad, F., Kvalheim, O.M., and Lundstedt, T. (Eds.), Tidsskriftforlaget Kjemi AS, Bergen, Norway, pp. 121-128.
54
- References -
Hailey, P.A., Doherty, P., Tapsell, P., Oliver, T., and Aldridge, P.K., 1996. Automated system for the on-line monitoring of powder blending processes using near-infrared spectroscopy. Part I. System development and control. J.Pharm.Biomed.Anal. 14 551-559.
Haleblian, J. and McCrone, W., 1969. Pharmaceutical Applications of Polymorphism. J.Pharm.Sci. 58 911-929.
Hammond, J., Jee, R.D., and Moffat, A.C., 1999. A simple method for estimating the effctive sample volume of pharmaceutical powders measured by near-infrared spectroscopy. AAPS Pharm.Sci. 1 S119.
Hancock, B.C. and Parks, M., 2000. What is the true solubility advantage for amorphous pharmaceuticals? Pharm.Res. 17 (4) 397-404.
Hancock, B.C., Shalaev, E.Y., and Shamblin, S.L., 2002. Polyamorphism: a pharmaceutical science perspective. J.Pharm.Pharmacol. 54 1151-1152.
Hancock, B.C. and Zografi, G., 1997. Characteristics and Significance of the Amorphous State in Pharmaceutical Systems. J.Pharm.Sci. 86 1-12.
Hapgood, K.P., Litster, J.D., Biggs, S.R., and Howes, T., 2002. Drop Penetration into Porous Powder Beds. J.Colloid Interf.Sci. 253 353-366.
Harris, S.C. and Walker, D.S., 2000. Quantitative real-time monitoring of dryer effluent using fiber optic near-infrared spectroscopy. J.Pharm.Sci. 89 (9) 1180-1186.
Herkert, T., Prinz, H., and Kovar, K.-A., 2001. One hundred percent online identity check of pharmaceutical products by near-infrared spectroscopy on the packaging line. Eur.J.Pharm.Biopharm. 51 9-16.
Herman, J., Remon, J.P., Visavarungroj, N., Schwartz, J.B., and Klinger, G.H., 1988. Formation of theophylline monohydrate during the pelletisation of microcrystalline cellulose-anhydrous theophylline blends. Int.J.Pharm. 42 15-18.
Herman, J., Visavarungroj, N., and Remon, J.P., 1989. Instability of drug release from anhydrous theophylline-microcrystalline cellulose formulations. Int.J.Pharm. 55 143-146.
Higgins, J.P., Arrivo, S.M., Thurau, G., Green, R.L., Bowen, W., Lange, A., Templeton, A.C., Thomas, D.L., and Reed, R.A., 2003. Spectroscopic Approach for On-Line Monitoring of Particle Size during the Processing of Pharmaceutical Nanoparticles. Anal.Chem. 75 1777-1785.
Hogan, S.E. and Buckton, G., 2000. The quantification of small degrees of disorder in lactose using solution calorimetry. Int.J.Pharm. 207 (1-2) 57-64.
Hogan, S.E. and Buckton, G., 2001. The application of near infrared spectroscopy and dynamic vapor sorption to quantify low amorphous contents of crystalline lactose. Pharm.Res. 18 (1) 112-116.
Holm, P., 1997. High Shear Mixer Granulators. In Handbook of Pharmaceutical Granulation Technology, Parikh, D.M. (Ed.), Marcel Dekker Inc., New York, pp. 151-204.
Holm, P., Schæfer, T., and Kristensen, H.G., 1985a. Granulation in High-Speed Mixers. Part V. Power Consumption and Temperature Changes During Granulation. Powder Technol. 43 213-223.
Holm, P., Schæfer, T., and Kristensen, H.G., 1985b. Granulation in High-Speed Mixers. Part VI. Effects of Process Conditions on Power Consumption and Granule Growth. Powder Technol. 43 225-233.
Holm, P., Schæfer, T., and Larsen, C., 2001. End-point Detection in a Wet Granulation Process. Pharm.Dev.Technol. 6 (2) 181-192.
55
- References -
ICH, 1999. Q6A Guideline. Specifications for New Drug Substances and Products: Chemical Substances International Conference on Harmonization.
Ilari, J.L., Martens, H., and Isaksson, T., 1988. Determination of Particle Size in Powders by Scatter Correction in Diffuse Near-Infrared Reflectance. Appl.Spectrosc. 42 (5) 722-728.
Irwin, W.J. and Iqbal, M., 1991. Solid-state stability: effect of grinding solvated excipients. Int.J.Pharm. 75 211-218.
Iveson, S.M., Litster, J.D., Hapgood, K., and Ennis, B.J., 2001. Nucleation, growth and breakage phenomena in agitated wet granulation processes: a review. Powder Technol. 117 3-39.
Iwamoto, M., Uozumi, J., and Nishinari, K., 1987. Preliminary investigation of the state of water in foods by near infrared spectroscopy. In Proc.Int. NIR/NIT Conference 12-16 May 1986, Holló, J., Kaffka, K.J., and Gönczy, J.L. (Eds.), Akadémiai Kiadó, Budapest, Hungary.
Jämsa-Jounela, S.L., Vermasvuori, M., Endén, P., and Haavisto, S., 2003. A process monitoring system based on the Kohonen self-organizing maps. Control Engineering Practice 11 (1) 83-92.
Kahela, P., Aaltonen, R., Lewing, E., Anttila, M., and Kristoffersson, E., 1983. Pharmacokinetics and dissolution of two crystalline forms of carbamazepine. Int.J.Pharm. 14 103-112.
Kesavan, J.G. and Peck, G.E., 1996. Solid-State Stability of Theophylline Anhydrous in Theophylline Anhydrous - Polyvinylpyrrolidone Physical Mixtures. Drug Dev.Ind.Pharm. 22 189-199.
Kirsch, J.D. and Drennen, J.K., 1996. Near-Infrared Spectroscopic Monitoring of the Film Coating Process. Pharm.Res. 13 (2) 234-237.
Kirsch, J.D. and Drennen, J.K., 1999. Nondestructive tablet hardness testing by near-infrared spectroscopy: a new and robust spectral best-fit algorithm. J.Pharm.Biomed.Anal. 19 351-362.
Kitamura, S., Miyamae, A., Koda, S., and Morimoto, Y., 1989. Effect of grinding on the solid-state stability of cefixime trihydrate. Int.J.Pharm. 56 125-134.
Knight, P.C., Instone, T., Pearson, J.M.K., and Hounslow, M.J., 1998. An investigation into the kinetics of liquid distribution and growth in high shear mixer agglomeration. Powder Technol. 97 246-257.
Kohonen, T., 1997. The basic SOM. In Self-Organizing Maps, Kohonen, T. (Ed.), Spinger-Verlag, Berlin, pp. 86-90.
Kopcha, M., Roland, E., Bubb, G., and Vadino, W.A., 1992. Monitoring the granulation process in a high shear mixer/granulator: an evaluation of three approaches to instrumentation. Drug Dev.Ind.Pharm. 18 (18) 1945-1968.
Kourti, T. and Macgregor, J.F., 1995. Process Analysis, Monitoring and Diagnosis, Using Multivariate Projection Methods. Chem.Intell.Lab.Syst. 28 (1) 3-21.
Kristensen, H.G., Holm, P., Jægerskou, A., and Schæfer, T., 1984. Granulation in High Speed Mixers. Part 4: Effect of liquid saturation on the agglomeration. Pharm.Ind. 46 (7) 763-767.
Kuhnert-Brandstätter, M., 1982. Thermomicroscopy of organic compounds. In Wilson and Wilson's Comprehensive Analytical Chemistry, Vol. XVI, Svehla, G. (Ed.), Elsevier, Amsterdam, The Netherlands, pp. 330-498.
56
- References -
Laicher, A., Profitlich, T., Schwitzer, K., and Ahlert, D., 1997. A modified signal analysis system for end-point control during granulation. Eur.J.Pharm.Sci. 5 7-14.
Laitinen, N., Rantanen, J., and Yliruusi, J., 2004. Phase transitions in nitrofurantoin and theophylline pellets during an extrusion-spheronisation process. In Proc. International Meeting on Pharmaceutics, Biopharmaceutics & Pharmaceutical Technology, 15-18 March 2004, ADRITELEF, APS, APV, EAPB, GSIA, HPS, PPS, VDI, Nuremberg.
Langkilde, F.W., Sjöblom, J., Tekenbergs-Hjelte, L., and Mrak, J., 1997. Quantitative FT-Raman analysis of two crystal forms of a pharmaceutical compound. J.Pharm.Biomed.Anal. 15 687-696.
Last, I.R. and Prebble, K.A., 1993. Suitability od near-infrared methods for the determination of moisture in a freeze-dried injection product containing different amounts of the active ingredient. J.Pharm.Biomed.Anal. 11 (11/12) 1071-1076.
Leuenberger, H., Bier, H.P., and Sucker, H., 1979. Theory of the granulating-liquid requirement in the conventional granulation process. Pharm.Technol. 3 (6) 60-68.
Leuenberger, H. and Imanidis, G., 1986. Monitoring mass transfer processes to control moist agglomeration. Pharm.Technol. 10 (3) 56, 58, 60, 62, 64, 66, 68, 72, 73.
Lin-Vien, D., Colthup, N.B., Fateley, W.G., and Grasselli, J.G., 1991. The Handbook of Infrared and Raman Characteristic Frequencies of Organic Molecules. Academic Press, Inc., San Diego, CA, USA, 503 p.
Lindberg, N.-O., 1977. Studies on granulation in a small planetary mixer. II. Granulation of lactose and an antacid mixture. Acta Pharm.Suec. 14 197-204.
Litster, J.D., Hapgood, K.P., Michaels, J.N., Sims, A., Roberts, M., Kameneni, S.K., and Hsu, T., 2001. Liquid distribution in wet granulation: dimensionless spray flux. Powder Technol. 114 (1-3) 32-39.
Luner, P.E., Majuru, S., Seyer, J.J., and Kemper, M.S., 2000. Quantifying Crystalline Form Composition in Binary Powder Mixtures Using Near-Infrared Reflectance Spectroscopy. Pharm.Dev.Technol. 5 (2) 231-246.
Luukkonen, P., Maloney, T., Rantanen, J., Paulapuro, H., and Yliruusi, J., 2001. Microcrystalline Cellulose-Water Interaction - A Novel Approach Using Thermoporosimetry. Pharm.Res. 18 (11) 1562-1569.
MacDonald, B.F. and Prebble, K.A., 1993. Some applications of near-infrared reflectance analysis in the pharmaceutical industry. J.Pharm.Biomed.Anal. 11 1077-1085.
Mackaplow, M.B., Rosen, L.A., and Michaels, J.N., 2000. Effect of primary particle size on granule growth and endpoint determination in high-shear wet granulation. Powder Technol. 108 32-45.
Maeda, H., Ozaki, Y., Tanaka, M., Hayashi, N., and Kojima, T., 1995. Near infrared spectroscopy and chemometrics studies of temperature-dependent spectral variations of water: relationship between spectral changes and hydrogen bonds. J.Near Infrared Spectrosc. 3 191-201.
McLennan, F., 1995. Process analytical chemistry in perspective. In Process analytical chemistry, McLennan, F. and Kowalski, B.R. (Eds.), Blackie Academic and Professional, Glasgow, UK, pp. 1-13.
Miller, G., 2003. Manufacturing Role Evolves with Pharmaceutical Business. Pharm.Technol. 27 (7) 20, 22, 104.
Miwa, A., Yajima, T., and Itai, S., 2000. Prediction of suitable amount of water addition for wet granulation. Int.J.Pharm. 195 81-92.
57
- References -
Morisseau, K.M. and Rhodes, C.T., 1997. Near-Infrared Spectroscopy as a Nondestructive Alternative to Conventional Tablet Hardness Testing. Pharm.Res. 14 (1) 108-111.
Morris, K.R., 1999. Structural Aspects of Hydrates and Solvates. In Polymorphism in Pharmaceutical Solids, Brittain, H.G. (Ed.), Marcel Dekker, Inc., New York, NY, USA, pp. 125-181.
Morris, K.R., Griesser, U.J., Eckhardt, C.J., and Stowell, J.G., 2001. Theoretical approaches to physical transformations of active pharmaceutical ingredients during manufacturing processes. Adv.Drug Deliv.Rev. 48 91-114.
Morris, K.R., Nail, S.L., Peck, G.E., Byrn, S.R., Griesser, U.J., Stowell, J.G., Hwang, S.-J., and Park, K., 1998. Advances in pharmaceutical materials and processing. Pharm.Sci.Technol.Today 1 (6) 235-245.
Morris, K.R. and Rodríguez-Hornedo, N., 1993. Hydrates. In Encyclopedia of Pharmaceutical Technology, Swarbrick, J. and Boylan, J.C. (Eds.), Marcel Dekker, Inc., New York, pp. 393-440.
Neville, G.A., Beckstead, H.D., and Shurvell, H.F., 1992. Utility of Fourier Transform-Raman and Fourier Transform-Infrared Diffuse Reflectance Spectroscopy for Differentiation of Polymorph Spironolactone Samples. J.Pharm.Sci. 81 (12) 1141-1146.
Neway, J.O., 2003. Filling the void: PAT in a connected manufacturing environment. Pharm.Technol. 27 (10) 46,48,50,52.
Newman, A.W. and Brittain, H.G., 1995. Particle morphology: Optical and electron microscopies. In Physical Characterization of Pharmaceutical Solids, Brittain, H.G. (Ed.), Marcel Dekker, Inc., New York, pp. 134-137.
Nomikos, P. and Macgregor, J.F., 1995. Multi-way partial least squares in monitoring batch processes. Chem.Intell.Lab.Syst. 30 97-108.
Norris, T. and Aldridge, P.K., 1996. End-point Determination On-line and Reaction Co-ordinate Modelling of Homogeneous and Heterogeneous Reactions in Principal Component Space Using Periodic Near-infrared Monitoring. Analyst 121 1003-1008.
Norris, T., Aldridge, P.K., and Sekulic, S.S., 1997. Determination of End-points for Polymorph Conversions of Crystalline Organic Compounds Using On-line Near-infrared Spectroscopy. Analyst 122 549-552.
O'Neil, A.J., Jee, R.D., and Moffat, A.C., 1998. The application of multiple linear regression to the measurement of the median particle size of drugs and pharmaceutical excipients by near-infrared spectroscopy. Analyst 123 2297-2302.
Ohike, A., Ashihara, K., and Ibuki, R., 1999. Granulation monitoring by fast Fourier transform technique. Chem.Pharm.Bull. 47 (12) 1734-1739.
Osborne, B.G., Fearn, T., and Hindle, P.H., 1993. Practical NIR spectroscopy with applications in food and beverage analysis. Longman Group UK, Harlow, UK, 227 p.
Otsuka, M. and Kaneniwa, N., 1984. Effects of Grinding on the Physicochemical Properties of Cephalexin Powder. Chem.Pharm.Bull. 32 (3) 1071-1079.
Otsuka, M., Kaneniwa, N., Kawakami, K., and Umezawa, O., 1990. Effect of Surface Characteristics of Theophylline Anhydrate Powder on Hygroscopic Stability. J.Pharm.Pharmacol. 42 606-610.
Otsuka, M., Teraoka, R., and Matsuda, Y., 1991. Physicochemical Properties of Nitrofurantoin Anhydrate and Monohydrate and Their Dissolution. Chem.Pharm.Bull. 39 (10) 2667-2670.
58
- References -
Parker, M.D. and Rowe, R.C., 1991. Source Variation in the Wet Massing (Granulation) of Some Microcrystalline Celluloses. Powder Technol. 65 (1-3) 273-281.
Patel, A.D., Luner, P.E., and Kemper, M.S., 2000. Quantitative analysis of polymorphs in binary and multi-component powder mixtures by near-infrared reflectance spectroscopy. Int.J.Pharm. 206 (1-2) 63-74.
Patel, A.D., Luner, P.E., and Kemper, M.S., 2001. Quantitative analysis of polymorphs in binary and multi-component powder mixtures by near-infrared reflectance spectroscopy (vol 206, pg 63, 2000). Int.J.Pharm. 212 (2) 295-295.
Pellow-Jarman, M.V., Hendra, P.J., and Lehnert, R.J., 1996. The dependence of Raman signal intensity on particle size for crystal powders. Vib.Spectrosc. 12 257-261.
Pepin, X., Blanchon, S., and Couarraze, G., 2001. Power Consumption Profiles in High-Shear Wet granulation. I: Liquid distribution in Relation to Powder and Binder Properties. J.Pharm.Sci. 90 322-331.
Perrier, P.R. and Byrn, S.R., 1982. Influence of Crystal Packing on the Solid-State Desolvation of Purine and Pyrimidine Hydrates: Loss of Water of Crystallization from Thymine Monohydrate, Cytosine Monohydrate, 5-Nitrouracil Monohydrate, and 2´-Deoxyadenosine Monohydrate. J.Org.Chem. 47 4671-4676.
Ph.Eur., 2004a. 2.2.40. Near-infrared spectrophotometry. In European Pharmacopoeia, Council of Europe, Strasbourg, pp. 55-56.
Ph.Eur., 2004b. 2.2.48. Raman spectrometry. In European Pharmacopoeia, Council of Europe, Strasbourg, pp. 71-73.
Phadnis, N.V. and Suryanarayanan, R., 1997. Polymorphism in Anhydrous Theophylline - Implications on the Dissolution Rate of Theophylline Tablets. J.Pharm.Sci. 86 (11) 1256-1263.
Pikal, M.J., Lukes, A.L., Lang, J.E., and Gaines, K., 1978. Quantitative Crystallinity Determinations for Beta-Lactam Antibiotics by Solution Calorimetry - Correlations with Stability. J.Pharm.Sci. 67 (6) 767-772.
Pratiwi, D., Fawcett, J.P., Gordon, K.C., and Rades, T., 2002. Quantitative analysis of polymorphic mixtures of ranitidine hydrochloride by Raman spectroscopy and principal components analysis. Eur.J.Pharm.Biopharm. 54 337-341.
Rantanen, J., Lehtola, S., Rämet, P., Mannermaa, J.-P., and Yliruusi, J., 1998. On-line monitoring of moisture content in an instrumented fluidized bed granulator with a multi-channel NIR moisture sensor. Powder Technol. 99 163-170.
Rantanen, J., Räsänen, E., Antikainen, O., Mannermaa, J.-P., and Yliruusi, J., 2001. In-line moisture measurement during granulation with a four-wavelength near-infrared sensor: an evaluation of process-related variables and a development of non-linear calibration model. Chem.Intell.Lab.Syst. 56 51-58.
Rantanen, J., Wikström, H., Marsac, P., and Taylor, L.S., 2004. Towards an understanding of hydrate formation during wet granulation. In Proc. International Meeting on Pharmaceutics, Biopharmaceutics & Pharmaceutical Technology, 15-18 March 2004, ADRITELEF, APS, APV, EAPB, GSIA, HPS, PPS, VDI, Nuremberg.
Ritala, M., Holm, P., Schæfer, T., and Kristensen, H.G., 1988. Influence of liquid bonding strength on power consumption during granulation in a high shear mixer. Drug Dev.Ind.Pharm. 14 1041-1060.
59
- References -
Rodríguez-Hornedo, N., Lechuga-Ballesteros, D., and Wu, H.-J., 1992. Phase transition and heterogeneous / epitaxial nucleation of hydrated and anhydrous theophylline crystals. Int.J.Pharm. 85 149-162.
Rodríguez-Hornedo, N. and Murphy, D., 1999. Significance of Controlling Crystallization Mechanisms and Kinetics in Pharmaceutical Systems. J.Pharm.Sci. 88 651-660.
Rowe, R.C. and Sadeghnejad, G.R., 1987. The rheology of microcrystalline cellulose powder/water mixes - measurement using a mixer torque rheometer. Int.J.Pharm. 38 227-229.
Savitzky, A. and Golay, M.J.E., 1964. Smoothing and Differentiation of Data by Simplified Least Squares Procedures. Anal.Chem. 36 (8) 1627-1639.
Schaefer, T., 2001. Growth mechanisms in melt agglomeration in high shear mixers. Powder Technol. 117 (1-2) 68-82.
Sekulic, S.S., Ward, H.W., II, Brannegan, D.R., Stanley, E.D., Evans, C.L., Sciavolino, S.T., Hailey, P.A., and Aldridge, P.K., 1996. On-line Monitoring of Powder blend Homogenity by Near-Infrared Spectroscopy. Anal.Chem. 68 509-513.
Shefter, E. and Higuchi, T., 1963. Dissolution Behavior of Crystalline Solvated and Nonsolvated Forms of Some Pharmaceuticals. J.Pharm.Sci. 52 (8) 781-791.
Simula, O. and Kangas, J., 1995. Process monitoring and visualisation using self-organizing maps. In Neural Networks for Chemical Engineers, Bulsari, A.B. (Ed.), Elsevier Science, Amsterdam, pp. 371-384.
Snow, R.H., Allen, T., Ennis, B.J., and Litster, J.D., 1997. Size Reduction and Size Enlargement. In Perry's Chemical Engineer's Handbook, Perry, R. and Green, D. (Eds.), McGraw-Hill, New York, pp. 20-1-20-89.
SOM toolbox for Matlab, 2003. http://www.cis.hut.fi/projects/somtoolbox/
Spring, M.S., 1983. The Conductivity of the Damp Mass During the Massing Stage of the Granulation Process. Drug Dev.Ind.Pharm. 9 (8) 1507-1512.
Staniforth, J.N., Walker, S., and Flanders, P., 1986. Granulation Monitoring in A High-Speed Mixer Processor Using A Probe Vibration Analysis Technique. Int.J.Pharm. 31 (3) 277-280.
Starbuck, C., Spartalis, A., Wai, L., Wang, J., Fernandez, P., Lindemann, C.M., Zhou, G.X., and Ge, Z.H., 2002. Process optimization of a complex pharmaceutical polymorphic system via in situ Raman spectroscopy. Crystal Growth & Design 2 (6) 515-522.
Stephenson, G.A., Forbes, R.A., and Reutzel-Edens, S.M., 2001. Characterization of the solid state: quantitative issues. Adv.Drug Deliv.Rev. 48 67-90.
Sun, C., Zhou, D., Grant, D.J.W., and Young, V.G.Jr., 2002. Theophylline monohydrate. Acta Cryst. E58 o368-o370.
Sutor, D.J., 1958a. The Structures of the Pyrimidines and Purines. VI. The Crystal Structure of Theophylline. Acta Cryst. 11 83-87.
Sutor, D.J., 1958b. The Structures of the Pyrimidines and Purines. VII. The Crystal Structure of Caffeine. Acta Cryst. 11 453-458.
Suzuki, E., Shimomura, K., and Sekiguchi, K., 1989. Thermochemical Study of Theophylline and Its Hydrate. Chem.Pharm.Bull. 37 (2) 493-497.
60
- References -
Suzuki, E., Shirotani, K.-I., Tsuda, Y., and Sekiguchi, K., 1985. Water Content and Dehydration Behavior of Crystalline Caffeine Hydrate. Chem.Pharm.Bull. 33 (11) 5028-5035.
Svensson, O., Josefson, M., and Langkilde, F.W., 1999. Reaction monitoring using Raman spectroscopy and chemometrics. Chem.Intell.Lab.Syst. 49 49-66.
Svensson, O., Josefson, M., and Langkilde, F.W., 2000. The synthesis of metoprolol monitored using Raman spectroscopy and chemometrics. Eur.J.Pharm.Sci. 11 141-155.
Szelagiewicz, M., Morcolli, C., Cianferani, S., Hard, A.P., Vit, A., Burkhard, A., von Raumer, M., Hofmeier, U.Ch., Zilian, A., Francotte, A., and Schenker, R., 1999. In situ characterization of polymorphic forms. The potential of Raman techniques. J.Therm.Anal.Calorim. 51 (1) 23-43.
Talu, I., Tardos, G.I., and van Ommen, J.R., 2001. Use of stress fluctuations to monitor wet granulation of powders. Powder Technol. 117 149-162.
Tardos, G.I., Khan, M.I., and Mort, P.R., 1997. Critical parameters and limiting conditions in binder granulation of fine powders. Powder Technol. 94 (3) 245-258.
Taylor, L.S. and Langkilde, F.W., 2000. Evaluation of Solid-State Forms Present in Tablets by Raman Spectroscopy. J.Pharm.Sci. 89 (10) 1342-1353.
Taylor, L.S. and Zografi, G., 1998. The quantitative analysis of crystallinity using FT-Raman spectroscopy. Pharm.Res. 15 (5) 755-761.
Threlfall, T., 2002. Polymorphs, solvates and hydrates. In Handbook of Vibrational Spectroscopy. Applications in Life, Pharmaceutical and Natural Sciences, Chalmers, J.M. and Griffiths, P.R. (Eds.), John Wiley & Sons Ltd., Chichester, UK, pp. 3557-3573.
Ticehurst, M.D., Storey, R.A., and Watt, C., 2002. Application of slurry bridging experiments at controlled water activities to predict the solid-state conversion between anhydrous and hydrated forms using theophylline as model drug. Int.J.Pharm. 247 1-10.
Tishmack, P.A., Bugay, D.E., and Byrn, S.R., 2003. Solid-state nuclear magnetic resonance spectroscopy - pharmaceutical applications. J.Pharm.Sci. 92 (3) 441-474.
Tryba, V. and Goser, K., 1991. Self-organizing feature maps for process control in chemistry. In Artificial Neural Networks: International conference, ICANN, Espoo 1991. Proceedings 1-2., Elsevier Science Publishers, Amsterdam, Netherlands.
Ufret, C. and Morris, K., 2001. Modeling of powder blending using on-line near-infrared measurements. Drug Dev.Ind.Pharm. 27 (7) 719-729.
USP 27, 2003. <1119> Near-infrared spectrophotometry. In The United States Pharmacopeia, The United States Pharmacopeial Convention, Inc., Rockwille, MD, USA, pp. 2569-2573.
Vankeirsbilck, T., Vercauteren, A., Baeyens, W., Van der Weken, G., Verpoort, F., Vergote, G., and Remon, J.P., 2002. Applications of Raman spectroscopy in pharmaceutical analysis. Trac-Trends in Analytical Chemistry 21 (12) 869-877.
Vergote, G.J., De Beer, T.R.M., Vervaet, C., Remon, J.P., Baeyens, W.R.G., Diericx, N., and Verpoort, F., 2004. In-line monitoring of a pharmaceutical blending process using FT-Raman spectroscopy. Eur.J.Pharm.Sci. 21 (4) 479-485.
Wang, F., Wachter, J.A., Antoscz, F.J., and Berglund, K.A., 2001. An Investigation of Solvent-Mediated Polymorphic Transformation of Progesterone Using in Situ Raman Spectroscopy. Org.Process Res.Dev. 4 391-395.
61
- References -
62
Watano, S., Numa, T., Miyanami, K., and Osako, Y., 2001. A fuzzy control system of high shear granulation using image processing. Powder Technol. 115 124-130.
Werani, J., 1988. Production experience with end point control. Acta Pharm.Suec. 25 247-266.
Whitaker, M., Baker, G.R., Westrup, J., Goulding, P.A., Rudd, D.R., Belchamber, R.M., and Collins, M.P., 2000. Application of acoustic emission to the monitoring and end point determination of a high shear granulation process. Int.J.Pharm. 205 79-91.
Williams, A.C., 2001. Some pharmaceutical applications of Raman spectroscopy. In Handbook of Raman spectroscopy. From the research laboratory to the process line, Lewis, I.R. and Edwards, H.G.M. (Eds.), Marcel Dekker, Inc., New York, pp. 575-591.
Williams, A.C., Cooper, V.B., Thomas, L., Griffith, L.J., Petts, C.R., and Booth, S.W., 2004. Evaluation of drug physical form during granulation, tabletting and storage. Int.J.Pharm. 275 (1-2) 29-39.
Wise, B.M. and Kowalski, B.R., 1995. Process chemometrics. In Process analytical chemistry, McLennan, F. and Kowalski, B.R. (Eds.), Blackie Academic and Professional, Glasgow, UK, pp. 259-312.
Wong, M.W.Y. and Mitchell, A.G., 1992. Physicochemical Characterization of A Phase-Change Produced During the Wet Granulation of Chlorpromazine Hydrochloride and Its Effects on Tabletting. Int.J.Pharm. 88 (1-3) 261-273.
York, P., 1983. Solid-State Properties of Powders in the Formulation and Processing of Solid Dosage Forms. Int.J.Pharm. 14 (1) 1-28.
Yu, L., Reutzel, S.M., and Stephenson, G.A., 1998. Physical characterization of polymorphic drugs: an integrated characterization strategy. Pharm.Sci.Technol.Today 1 (3) 118-127.
Yu, L.X., Lionberger, R.A., Raw, A., D'Costa, R., Wu, H., and Hussain, A.S., 2004. Applications of process analytical technology to crystallization processes. Adv.Drug Deliv.Rev. 56 (3) 349-369.
Zhang, G.G.Z., Law, D., Schmitt, E.A., and Qiu, Y.H., 2004. Phase transformation considerations during process development and manufacture of solid oral dosage forms. Adv.Drug Deliv.Rev. 56 (3) 371-390.
Zhou, G.X., Ge, Z.H., Dorwart, J., Izzo, B., Kukura, J., Bicker, G., and Wyvratt, J., 2003. Determination and differentiation of surface and bound water in drug substances by near infrared spectroscopy. J.Pharm.Sci. 92 (5) 1058-1065.
Zhu, H., Yuen, C., and Grant, D.J.W., 1996. Influence of water activity in organic solvent + water mixtures on the nature of the crystallizing drug phase. 1. Theophylline. Int.J.Pharm. 135 151-160.
Zografi, G., 1988. States of water associated with solids. Drug Dev.Ind.Pharm. 14 (14) 1905-1926.
Zografi, G. and Kontny, M.J., 1986. The Interactions of Water with Cellulose- and Starch-Derived Pharmaceutical Excipients. Pharm.Res. 3 (4) 187-193.