Incredible Charts Pro 5.0 Help Manual Revision Number: 794 Last Modified: October 5, 2011 For more information see: http://www.incrediblecharts.com URL: http://www.incrediblecharts.com/help/quick_start_manual.pdf 1
Transcript
Incredible Charts Pro 5.0
Help Manual
Revision Number: 794
Last Modified: October 5, 2011
For more information see: http://www.incrediblecharts.com
2. Premium Data Service.....................................................................................................................5 2.1 Subscribing, Renewing & Canceling......................................................................................5 2.2 Activate the Premium Data Service........................................................................................5 2.3 30-Day Free Trial....................................................................................................................5 2.4 Features...................................................................................................................................6
3. Select a Stock..................................................................................................................................8 3.1 Enter a Stock Code..................................................................................................................8 3.2 Browse the Stock Menu........................................................................................................11 3.3 Search for a Stock.................................................................................................................12
4. Select a Time Period......................................................................................................................13 4.1 Zoom [Z]...............................................................................................................................13
9. Format Charts................................................................................................................................29 9.1 Format Charts [C].................................................................................................................29 9.2 Legend [L]............................................................................................................................30 9.3 Undo/Redo............................................................................................................................31
10. Watchlists....................................................................................................................................32 10.1 Create a New Watchlist......................................................................................................32 10.2 Using Watchlists.................................................................................................................33 10.3 Managing Watchlists..........................................................................................................33
2
11. Projects........................................................................................................................................35 11.1 Open a Project.....................................................................................................................35 11.2 Project Tabs........................................................................................................................36 11.3 Creating Projects.................................................................................................................36 11.4 Project Defaults [F6]...........................................................................................................36 11.5 Delete Project......................................................................................................................38
15. Appendices..................................................................................................................................53 15.1 Loading Data from Disk.....................................................................................................53 15.2 Loading Data from External Websites................................................................................54 15.3 Dilution Adjustments..........................................................................................................55 15.4 Keyboard Shortcuts.............................................................................................................57
3
1. Incredible Charts IntroductionThe Incredible Charts website was launched in 2001, offering free charting software, data, education and a traders forum.
1.1 Free SoftwareIncredible Charts Pro Software is free, and provides access to charting tools and delayed data. Subscribers also access the Premium Data Service through this software.
1.2 ServicesIncredible Charts offers two services:
• free end-of-day data suitable for students and weekend browsers rather than active traders; and
• a Premium Data Service, with more frequent updates, premium indicators and stock screen filters.
A 30-Day free trial of Incredible Charts premium service is available.
1.3 Free Market Analysis and Free EducationColin Twiggs' free Trading Diary newsletters now have over 130,000 subscribers. The newsletters provide weekly analysis of stock markets, gold, crude oil, currencies and the economy.
There are also over 100 online educational pages on technical analysis and trading.
Select Help >> Free Trial of Premium Data Service on the chart menu to activate a 30-day free trial of the Premium Service. When the free trial expires you can either subscribe or continue with free data.
2.2 Subscriptions and RenewalsSubscription details are used for maintaining your subscription and sending renewal notices and tax invoices. Please see our Privacy Policy.
Subscriptions are automatically renewed for your convenience. Please notify us if the service is no longer required.
2.3 Activate the Premium Data ServiceTo activate your account:
• Download and install the Free Incredible Charts Pro Software if not already installed on your computer.
• When you subscribe an activation key will be sent by email. Select Activate Premium Version on the chart toolbar.
• Copy and paste your activation key into the required field.
2.4 FeaturesIncredible Charts Premium Data Service has many benefits, including the ability to hide advertising on the charts, more frequent Data Updates and access to Premium Indicators and Premium Filters.
Data Updates
The Incredible Charts Premium Data Service offers more frequent updates:
Available Data* Updates: End Of Day Data
Continuous Data
Available Delay**
US StocksAMEX, NYSE, NASDAQ, OTCBB and OTC Markets. 15
US IndexesDow Jones 15S&P, NYSE, BONY, NASDAQ, CBOE, Wilshire, Russell, Value Line and more.
US Sector IndexesDow Jones US Sectors 15
World IndicesDow Jones global index series 15Almost 300 other world indices.
The last 30 securities loaded are also available from the drop-down list:
8
Set Startup Default Stock
You can set a default security via Securities >> Set Current Security as Startup Default.
Keep in mind that File >> Project Defaults >> Default Security takes precedence. If a Project Default Security is set for the Default Project (which always loads first at startup), that default will load instead of this Startup Default.
9
3.2 Browse the Stock MenuThe Securities menu identifies all available exchanges and each uploaded exchange lists all securities quoted on that exchange. To browse these lists:
• Click Securities on the main menu • Select an exchange that has been uploaded (e.g. NYSE) and browse for a security.
Exchanges
Exchanges that are uploaded at each session are indicated by , and if they are not.
Uploaded exchange menus are only required for browsing the stock menus, not for the securities toolbar or securities searches. Only set the auto-upload if you regularly chart a large number of securities from that exchange.
If you only chart a few securities, it is far more efficient to:
• Add securities that you regularly chart to a watchlist • Remove Autoload of exchanges that you seldom use • Use the search option to find securities.
Select an exchange and Upload ... Menu to import a listing of all quoted securities. Loading too many menus slows the application as these files are updated automatically at the start of each session. To reverse, select Securities >> Remove Autoload of... [exchange].
3.3 Search for a StockYou can search for securities by entering part of their name or code in the search box. Exchange menus do not have to be uploaded.
Search For Securities By Name
Search A Selected Exchange:
1. Select an Exchange 2. Select Search on the toolbar. 3. Enter whole or part of the security's name in the dialog box. 4. Click Find Name 5. Select a security by double-clicking the name in the list
(or right-click and select Chart the Selected Security).
Search All Exchanges:
To search all exchanges enter whole or part of the security's name in the dialog box, followed by a blank space and then an asterisk. Then click Find Name.
Search For Securities By Code [F3]
Click the drop-down arrow next to the Search button and select Search for Security Code Only or use the F3 shortcut key. This will then remain as the default search option until amended.
11
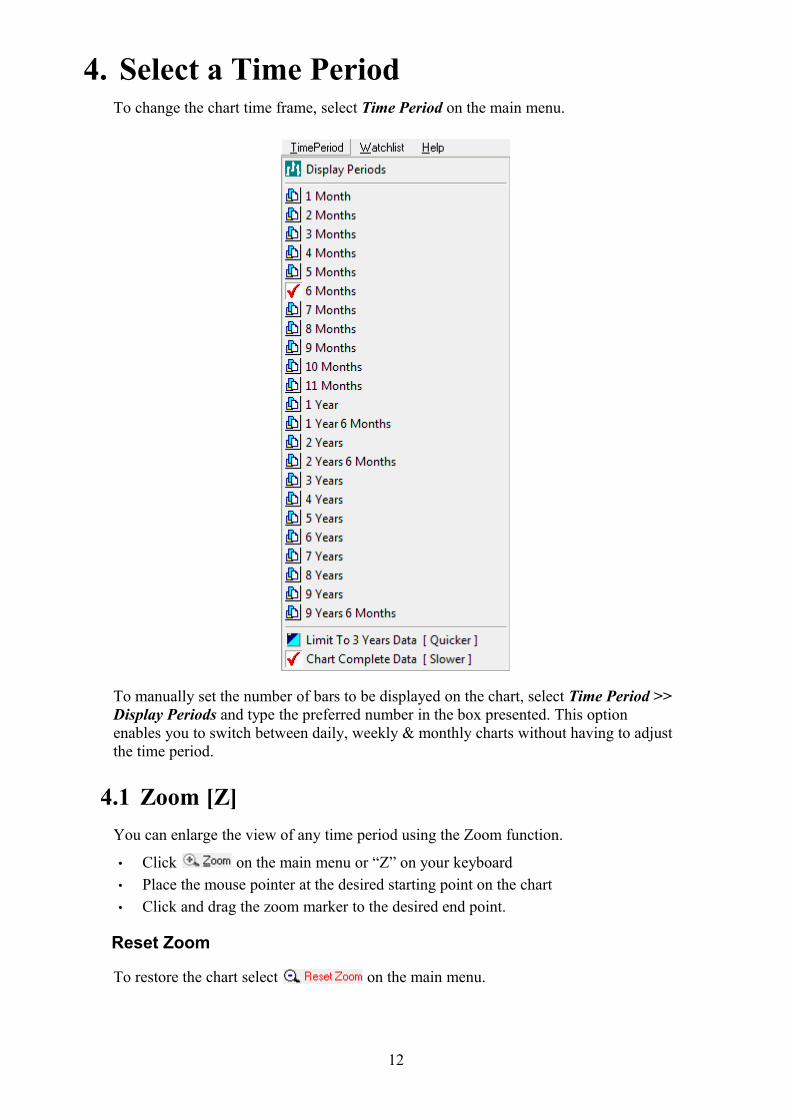
4. Select a Time PeriodTo change the chart time frame, select Time Period on the main menu.
To manually set the number of bars to be displayed on the chart, select Time Period >> Display Periods and type the preferred number in the box presented. This option enables you to switch between daily, weekly & monthly charts without having to adjust the time period.
4.1 Zoom [Z]You can enlarge the view of any time period using the Zoom function.
• Click on the main menu or “Z” on your keyboard • Place the mouse pointer at the desired starting point on the chart • Click and drag the zoom marker to the desired end point.
Reset Zoom
To restore the chart select on the main menu.
12
5. Select a Chart
Alternatively, use the Chart View toolbar to select a Chart Type and Daily, Weekly or Monthly bars. Normal or logarithmic view can also be chosen here.
The drop-down arrow next to the Point & Figure icon displays all loaded P&F options. Use the Indicator Panel to create additional Point And Figure chart settings.
5.1 Chart TypesThere are five basic chart types available on Incredible Charts software.
• Close plots a single line representing closing price • OHLC reflects price performance using bar charts with Open High Low and Close • C andle highlights the relationship between opening and closing prices • EquiVolume combines price and volume information to confirm price movements • Point And Figure focuses on price movements to identify chart patterns and support
& resistance levels.
Hint: Candle/Close and OHLC/Close Automatically display a closing price line if you select a lengthy chart time period — where the candles become too crowded.
See Chart Types (online) for further details.
5.2 Daily [F7], Weekly [F8] & Monthly [F9] ChartsDaily, weekly and monthly bars are offered on Incredible Charts. Daily bars chart the price per day, while weekly show the weeks overall price data as a single bar, and monthly summarizes each month as a single bar.
5.3 Price Scale Logarithmic scale is used to view charts with large price variation or longer time scales, to reduce the data to a more manageable range. Sometimes these are referred to as semi-logarithmic charts because the time scale is not logarithmic.
Logarithmic View
Use the Logarithmic button on the View menu to turn log scale on or off.
6. IndicatorsIndicators summarize the information already visible on the chart. While useful for highlighting patterns in price and volume behavior, they can never replace the depth of information on the original chart. Indicators have two main purposes:
1. To act as a filter when screening stocks; and2. To act as an executive summary before examining the price/volume chart in detail.
Always base decisions on the price/volume chart.
6.1 Indicator PanelThe Indicator Panel is used to add, edit and delete indicators in the open project. It is also used to change the settings for Point & Figure charts.
To open the Indicator Panel click Indicators on the main menu.
To close the Indicator Panel use the icon in the middle column.
6.2 Add An IndicatorTo add an indicator:
• Open the Indicator Panel• Select an indicator from the left column • Adjust the settings in the center panel using the up- or down- arrows or type over the
existing numbers• Save the indicator in the right column
Hint: Indicators are saved to your ProjectWhen you save an indicator it is saved in whichever project file is open on the Project Tabs. You do not need to save using File commands.
15
6.3 Edit An Indicator
Indicator Settings
All selected indicators for the open file are displayed in the right-hand column of the indicator panel. To edit an indicator's settings:
• Open the Indicator Panel• Select the indicator from the right column• Amend the settings in the center panel and save
Indicator Views
Use the legend to Amend Indicator Colors and to Hide Indicators.
6.4 Delete An IndicatorTo remove an indicator:
• Open the Indicator Panel• Select an indicator from the right column and remove
6.5 Preset IndicatorsTo select a preset trading system:
• Click File >> Open Project on the chart menu. • Select a [Preset] file, for example [Multiple Moving Averages]
Indicator GuideThe online Indicator Guide has a complete list of available indicators, with trading signals, trading examples, and details of construction. The indicator name in the center of the indicator panel links to the relevant page in the Guide.
1. A visible Caption Marker that identifies the Caption.2. A Caption that displays when your mouse pointer is over the Caption Marker.
Leave the Markers blank for sequential numbering. Captions use 256 characters or less.
Add A Caption
Click on the toolbar, then click on the chart at the point the Caption must be placed.
Modify Captions
Edit Caption• Right-click on the Caption Marker on the chart. A dialog box appears. • Edit the caption marker in the dialog box and then click OK. • A second dialog box appears. Edit the caption and click OK again.
Hide Captions
Right-click on the Caption icon and clear the box next to Show Captions.
To display hidden captions right-click on Captions and select Show Captions.
Move A Caption
Click and drag the anchor at the bottom end of the Caption Marker to a new position.
17
Delete Captions
To delete a specific caption click the Delete Caption icon on the toolbar, then click the caption that you want to delete. Alternatively double-click on the caption.
Delete All Captions
For a specific security first ensure that the correct security is open and then select Draw >> Delete All Captions. Click Yes at the prompt.
For a specific chart right-click on the chart and select Delete this Chart's Captions on the list that appears. Click Yes at the prompt.
7.2 TrendlinesA trendline measures the rate of increase in the share price over time and alerts you to any acceleration or deceleration of the trend. Trendlines can also be used to highlight support and resistance levels, trends, chart patterns and overbought/oversold levels. There are several trendline options on the Draw menu:
These are also found on the Draw toolbar for convenience:
Drawing trendlines is time-consuming so use stock screens to identify the most likely candidates and concentrate on these. See Trend Lines for basic trendline details.
To automatically fit a trendline to selected data:
1. Select Autofit Trendline on the toolbar2. Drag your mouse above (up-trend) or below (down-trend) the price bars for the period3. Select from Closing Price (long time periods) or Highs/Lows (short-term)4. Drag the right anchor if you want to manually re-position the trendline.
For an up-trend the trendline will automatically fit to the lowest point and the second lowest trough in the given time period. For a down-trend the trendline automatically fits to the highest point and the second highest peak in the given time period.
Manual Trendline
To manually fit a trendline to the data
1. Select Add Trendlines on the toolbar or type R on your keyboard 2. Click at the point on the chart to start the trendline and drag it into position.
Other Trendlines Available• Linear regression trendline • Horizontal trendline • Vertical trendline
Modify Trendlines
Auto-Extend Trendline
To automatically extend a trendline to the latest date (or right-edge of the chart):
• Right-click the trendline and select AutoExtend Trendline on the list of properties
To halt the AutoExtend, right-click on a trendline and uncheck AutoExtend Trendline.
Adjust Trendline
To drag one end of the trendline to a new position:
• Place your mouse over the end of the trendline and wait for the square to appear.
• Click the anchor at the end of the Trendline and drag to a new position.
19
Move Trendline
To move a trendline to a new position while retaining the existing angle:
• Place your mouse over the trendline (at any point except the anchors at the ends); • Wait for the trendline to be highlighted and the hand to appear.
• Click and drag to a new position
Hide Trendlines
Right-click on one of the trendline icons and clear the box next to Show Trendlines.
To display hidden trendlines right-click on a trendline icon and select Show Trendlines.
Delete Trendlines
To delete a specific trendline click Delete on the toolbar, then select the trendline. Alternately double-click on the anchor at the end of the trendline, or right-click on the anchor at the end of a trendline and select Delete Trendline.
Delete All Trendlines
For a specific security, in all projects, first ensure that the correct security is open, select Draw >> Delete All Trendlines on the list that appears. Click Yes at the prompt.
On a specific chart right-click on the chart and select Delete this Chart's Trendlines on the list that appears. Click Yes at the prompt.
7.3 Trend ChannelsTrend channels are used to track the momentum of a trend, with
• peaks (or highs) frequently respecting the upper trend channel; and • troughs (or lows) respecting the lower trend channel.
They are useful for setting stop loss orders and for swing trading. There are several different trend channel options on the Draw toolbar:
Automatically fits a trendline above or below the selected data (depending on where you drag the channel line), and draws a parallel line through the opposite extreme point.
To draw an auto-fit trend channel
• Select Trend Channel on the toolbar. • Click and drag above (down-trend) or below (up-trend) the selected data.
• Select Closing Price for long-term charts or Highs and Lows for short-term. • The trend channel will be drawn automatically:
21
Linear Regression Trend Channel
Automatically fits a linear regression line to the selected data, and draws parallel lines through the extreme points on each side of the linear regression line.
Follow the same sequence as for Auto-Fit Trend Channels, clicking on the toolbar. It makes no difference whether you drag your mouse above or below the selected data.
Raff Regression Channel
Automatically fits a linear regression line to the selected data, draws a parallel line through the most extreme point from the linear regression line, then draws a second parallel line at equal distance on the opposite side of the linear regression line.
Click on the toolbar and set up the same as for Linear Regression Trend Channels.
22
Standard Deviation Channel
Standard deviation channels are parallel lines drawn around a linear regression line at a set number of standard deviations.
Follow the same procedure as for Linear Regression Channels, clicking on the toolbar and selecting the number of standard deviations (usually 2).
Modifying Trend Channels
Trend Channels are saved as individual lines, and are edited or deleted independently.
23
8. Chart ViewsUse View on the main menu to adjust your chart view:
8.1 Screen Views
Split Screen View
To adjust the relative size of the two charts drag the shared border (between the chart and indicator/s) up or down with your mouse.
Full Screen View [ F4 ]
The Full Screen View hides the toolbars, allowing for a larger chart. This also applies to the stock screener.
To restore from Full Screen Mode use Restore Toolbars on the top menu:
When you add more than 3 indicators below a chart, the indicator displays may appear blank if too small to display meaningful information. Adjust the number of visible indicator slots by clicking View >> Visible Indicator Slots.
Scale
To expand the right-axis of the price chart or an indicator slot click the button to the left of the relevant slot.
• Use to obtain a full screen view of the price chart or one indicator.• Use to obtain a split screen view of the price chart and an indicator.
Use to return to the default view with all indicators displayed.
Hint: Users with the Chinese version of Windows (and possibly other special regional versions) may not be able to view the Screen View buttons as these are not in their ASCII character set. You will still get the mouse-over hints if you place your mouse pointer over the left margin in the indicator slot.
Re-Order
Click in the left indicator margin. Drag and drop indicators to change the order.
25
Display/Hide Values
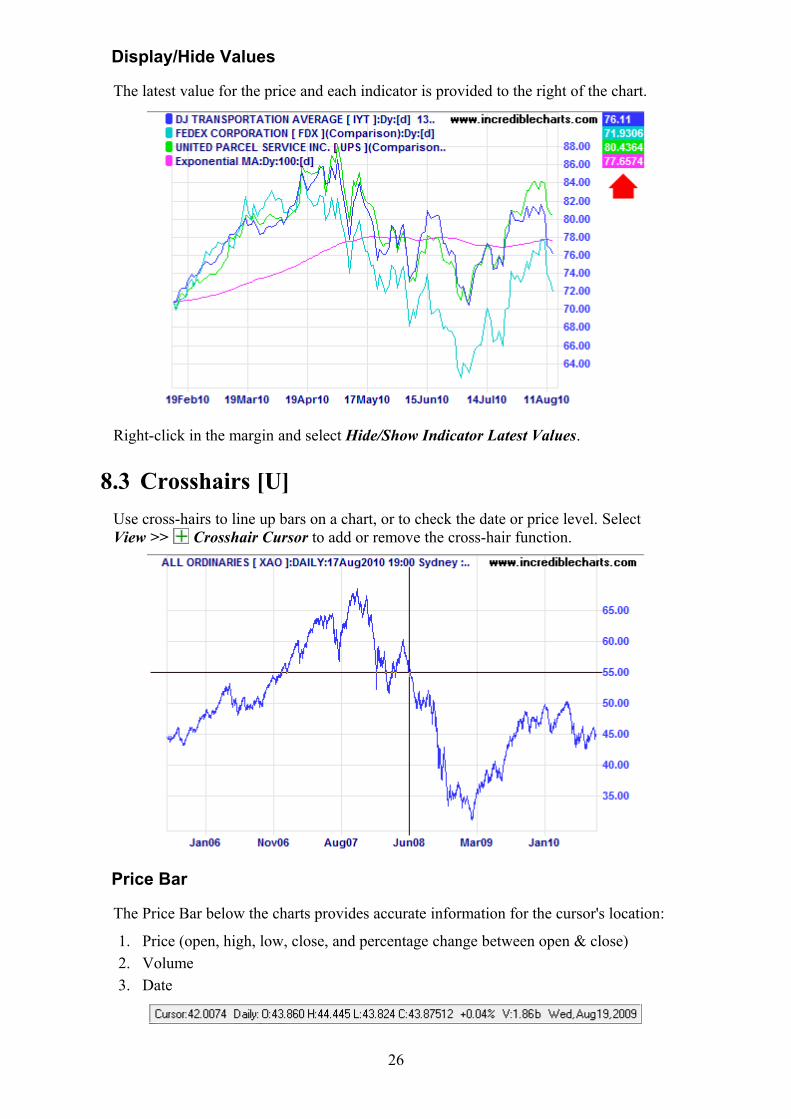
The latest value for the price and each indicator is provided to the right of the chart.
Right-click in the margin and select Hide/Show Indicator Latest Values.
8.3 Crosshairs [U] Use cross-hairs to line up bars on a chart, or to check the date or price level. Select View >> Crosshair Cursor to add or remove the cross-hair function.
Price Bar
The Price Bar below the charts provides accurate information for the cursor's location:
1. Price (open, high, low, close, and percentage change between open & close)2. Volume3. Date
26
8.4 Advanced Options View >> Advanced Options gives access to complex commands and infrequently used settings.
Enabling Advanced Options
When you enable advanced options they will continue to appear on your menus until you remove them.
To add one of the advanced features:
• Click View on the main menu, or right-click on the chart background. • Place your mouse pointer over Advanced Options on the drop-down menu. • A list of advanced options appears.
8.5 Hide Advertising The top banner and right margin advertising are automatically hidden on the Premium Version. They cannot be hidden on the Free Version.
Hide/Display Ads
Hide or display advertisements using View >> Advanced Options >> Hide/Show Top Advert and/or Hide/Show Right Panel.
27
9. Format Charts 9.1 Format Charts [C]
The Format Charts menu enables you to customize the appearance of your charts.
Color Schemes
Use Format Charts >> Color Scheme: Reset Project to ... to select a Color Scheme from the list.
Warning: Loading a color scheme overrides any color settings saved for the project.
Colors• Open Format Charts >> Colors. A drop-down list shows all the basic chart colors
(background, text, trendlines, etc.) and all the chart types included in the open file.• Select the item you wish to change, and a standard color palette is displayed.
• Click the new color from the palette, then OK to record your choice.
28
Altering A Basic Chart Color
For example to alter the background color:
• Open Format Charts >> Colors >> Background. • Select a color and click OK to record your choice.
Altering A Indicator Color • Open Format Charts >> Colors• Mouse-over the chart type (e.g. Price Daily) and a list of all indicators appears. • Select a indicator, the new color and click OK to record your choice.
Font Size
Open Chart Format >> Font Size and click on the required font size.
Grid Style
Open Format Charts >> Grid Style and select the required style.
Hint: Bright colors are not suitable against a dark background and vice versa.
Indicator Width
Open Format Charts >> Indicator Width and click on the required width. This will be applied to both the price and indicators.
9.2 Legend [L]The legend gives a brief description of each line, bar or candle displayed on the chart. To display or hide the chart legend, select View >> Legend.
Abbreviate The Legend
Use Format Charts >> Abbreviate Legend to reduce the space used on the chart. For example Exponential MA:Dy:60:[d] would become EMA:Dy:60:[d].
29
Legend Functions
Amend Indicator Colors
Use the Legend function to amend the indicator colors on a chart:
• Open the Legend and click the color block in front of an indicator• Select a new color and click OK.
Blank Indicators will appear if you change the color format so that the background and indicator are the same color.
To view the indicator change its color. If the color block is hard to find point your mouse to the normal position and look for the mouse-over hint.
Hide Indicators
Use the Legend function to temporarily hide an indicator or the price:
• Open the Legend • Clear the check box in front of an indicator
The indicator/price bar will remain hidden until you check the box or restart Incredible Charts. To hide the price, clear the box in front of the Security name.
Hide Security Name
Right-click on and clear the check box in front of Show Equity Name.
9.3 Undo/RedoThese buttons allow you to undo recent changes made to indicator settings or chart formats. They can be real time-savers.
The Undo and Redo buttons can be found on the toolbar or under File on the main menu.
• Use the Undo button to scroll back through the last 10 changes made to indicator settings or chart formats.
• Use Redo to scroll forward through the changes reversed by the Undo command.
30
10. WatchlistsWatchlists may be used for saving, listing & scrolling through a number of securities. Save time by adding your favorite securities to a Watchlist.
There are some preset watchlists available at Watchlist >> Watchlists.
10.1 Create a New Watchlist• Select Watchlist >> New Watchlist on the chart menu;• Enter a name for the watchlist and click OK.• See Managing Watchlists for how to manually add stocks to the watchlist.
Hint: Symbols to AvoidAvoid \ / : * ? " < > | % and [ ] when naming watchlists.
Create Watchlists Using The Stock Screener
Use the Find Stocks (Stock Screener) and save the results as a watchlist. For example: Screen for the S&P 500 and save as a watchlist.
The stock screener return toolbar offers the multiple options:
• Add Selected Security To WatchlistSelect a security and then click to add it to a chosen watchlist.
• Create Watchlist: Automatically adding Top 20 Securities [F7]Use to create a new watchlist with the top 20 securities on the stock screen list.
• Create Watchlist: Automatically adding All Securities [F8]Click to create a new watchlist with all the securities on the stock screen list.
31
10.2 Using Watchlists
Select A Stock From A Watchlist
Select Stock From The Active Watchlist [Shift + F5]• Select Watchlist on the chart menu; • Place your mouse over the name of the active watchlist. All securities in the active
watchlist will be displayed in a pop-up menu; • Select a security from the watchlist.
Alternatively right-click on to display the stocks in the active watchlist.
Select Stock From Any Watchlist [Shift + F6]• Select Watchlist >> Watchlists on the chart menu;• Place your mouse pointer over the required watchlist in the pop-up menu; and• Select a security
Set The Active Watchlist [Shift + F4]
To set the active watchlist select Watchlist >> Set Active Watchlist and choose a Watchlist from the list. Alternatively select and right-click to select a new active watchlist.
Scrolling Through Watchlists
Use and on the toolbar to scroll through the charts on your active watchlist.
10.3 Managing Watchlists
Add A Security To A Watchlist
To add a stock to a watchlist open the stock security and click Add to Watchlist. Then choose a watchlist from the list. To add to multiple watchlists repeat.
Remove A Security From A Watchlist
To remove a stock to a watchlist click Remove Security from Watchlist.
Save Active Watchlist
To save a Watchlist under a new name:
• Ensure that the existing Watchlist is open.• Select Watchlist >> Save Active Watchlist As on the chart menu; • Enter a new name and click OK.
Use this command to include all stocks from an existing watchlist into a new watchlist.
Delete Watchlist• Select Watchlist >> Delete Watchlist on the chart menu; • Then select a Watchlist from the list that appears. • Click Yes at the prompt.
Multiple Watchlists
Multiple Watchlists are useful if:
• you have more than one trading system, • you have more than one stock portfolio, • your portfolio is spread over more than one market, or • you want to analyze stocks in different sectors separately.
33
11. ProjectsA project is a file that contains its own indicators, trendlines, captions and chart settings. Data is stored in a central folder so that you can access securities from any open project.
Separate projects enable you to customize charts for specific purposes:
• Daily, weekly and monthly studies with default time periods and chart intervals;• More than one trading system;• Separate indicator studies; and• Studies specific to a key index or security (see My Favorites below).
Each project can be set with its own default view and indicator settings.
Preset Projects [in square brackets] contain example trading systems. These can save you time setting up complex indicators such as [Multiple Moving Averages].
11.1 Open a Project
Default Project
Incredible Charts always opens with the Default project file. If you only use one trading system, we suggest that you use the default file. Settings and trendlines are automatically saved to the file as you add them.
Tip: Select Securities >> Set Current Security as Startup Default to display whenever you start Incredible Charts.
Open A Project [F5]
Easily switch between different groups of pre-saved settings by opening an existing file:
• Select File >> Open Project. A list of all existing projects appears.
• Select the Project that you want.
Tip: Use the Project Tabs to quickly access recently used projects.
34
11.2 Project Tabs
Recently used project files are displayed as tabs below the price chart (and indicators), above the bottom price bar.
• Click on a tab, for example [Elder Ray Index], to display the project file.• Right-click on the tabs and select Hide Project Tabs to remove them.
Tip: Recently used projects are also displayed at the bottom of the file menu.
Hide Project Tabs
To hide the project tabs, right-click on one and select Hide Project Tabs. Or select View >> Advanced Options >> Hide Project Tabs.
11.3 Creating Projects
New Project
To create a new file:
• Select File >> New Project from the drop-down menu. A dialog box appears. • Enter a name for the new project and click OK. • Then add Indicators as required.
Save Project As
Before you modify the settings for an existing project, it is advisable to first save your existing settings under a different name or backup your projects to a removable disk. You can then recall them later.
To save an existing project under a new name:
• Open the existing project. • Select File >> Save Project As. A dialog box appears. • Enter a new name for the project and click OK.
Tip: Backup your project files regularly using the File >> Export Files command.
11.4 Project Defaults [F6]You may want to create more than one project, each with a different appearance.
• Format Charts allows you to create a separate color scheme for each project• Indicator Panel creates indicators for a specific project• Project Defaults controls how the project opens
35
Creating Your Own Project Defaults1. Set up a chart as you want it to appear on opening the project; 2. Select View >> Project Defaults or simply use the F6 shortcut key;
3. Existing defaults are displayed in [square brackets][simply chart] at the top of the above example is the project name;
4. Amend the settings by selecting either: • Use Current Chart Type to create a new default; or• Remove to clear an existing default;
5. Click OK when completed.
Options
Project Defaults controls how the project opens:
• On a specified security• The time period• Chart Interval - whether daily, weekly or monthly• Price Scale - whether normal or logarithmic• Chart Type - whether OHLC, Candles or Closing Price
Separate indicators can be added to each project.
Default Security
Set a default security for the project to open on a specific security every time. If you are creating separate Daily, Weekly and Monthly projects, or a specific study to be used in conjunction with other projects, leave the default security blank.
Time Period
Time period can be varied from 1 Month to 10 Years or longer.
36
Chart Interval
Daily, weekly or monthly are the available chart intervals. This option can also be used to set Equivolume or Point & Figure charts as the default.
Price Scale
Choose between Logarithmic or Normal price scale.
Chart Types
Select from OHLC, Candles or Closing Price.
Examples
Here are some of Colin's favorite projects defaults:
Project: Default* Weekly Monthly PnF PnF Index
Default Security none none none none none
Time Period 3 Months 3 Years 6 Years 3 Years 3 Years
Chart Interval Daily Daily** Daily**
Box 5Reversal 2Closing Price
Box 1***Reversal 2Closing Price
Price Scale Normal Log Log Normal Normal
Chart Type Candle Candle Candle
Notes:* The Default project doubles as the "Daily" project file** Colin prefers the Closing Price line graph but many will select weekly or monthly*** Use a smaller P&F box size of 1 for low volatility stocks and indices
11.5 Delete ProjectTo delete a project that you no longer require:
• Select File >> Delete Project. A list of all existing projects appears. • Select the Project that you want to delete and click Yes at the prompt.
Your project files, with indicators, trendlines and captions, and watchlists are saved on your computer. It is advisable to backup your watchlists and project files on a regular basis. Use the Export/Import Files functions to backup your files to a removable disk.
12.2 Importing and Exporting FilesThe Export/Import Files commands enable you to transfer your project files and watchlists between computers, and can provide a backup should something go wrong.
File Types: Project files have a .ini extension; Watchlists have .viz extensions; The folders can be ignored - these merely record Undo/Redo settings.
Export Files To A Removable Disk1. Insert a CD-RW disk, a USB (flash disk) or floppy disk into the computer2. Open Incredible Charts and select File >> Export Files.
3. Select the .ini and .viz files using your mouse and the shift key. Click Open.4. Select a removable drive (eg. D:) to save to and click OK.
Note The above steps may vary depending on your CD-burner software. A floppy disk will only work if your project files are reasonably small.
Import Files1. Insert the removable disk used above and open Incredible Charts2. Select File >> Import Files and choose the drive (eg. D:) to import from. 3. Highlight the .ini and .viz files to import and click OK.
38
13. Save, Print or Email Charts 13.1 Save Charts [F11]
You can save charts as image files for later recall. The images will not update with data that is added later.
To save a particular chart image:
1. Select the chart view that you require. 2. Select File >> Save Chart as Image 3. Select Yes / No when prompted: "Do you want to display the chart legend?" 4. Enter a filename and select a file type.5. Click Save.
Note: The default file type is PNG (*.png), or you can select Bitmap (*.bmp)
Set Image Size
The default image size is 651 x 395 pixels. To adjust the default image size:
• Select File >> Set Image Size • Enter the Bitmap Width, click OK; • Enter the Bitmap Height and click OK.
The selected image size is remembered between sessions.
View Saved Charts
Select File >> View Saved Charts and then select the image to view. File >> Explore My Saved Charts Folder lists all saved chart images.
13.2 Printing Charts [F12]
Print Basics
If you wish to print a copy of the chart on the screen
• Click File >> Print• Select your printer and click OK.
You will then be prompted as to whether you want to print the chart with a white background (and default color scheme). This is recommended for greater clarity and to save ink.
Default Settings • Landscape orientation; • High resolution; and • Single page output.
39
Advanced Printer Settings
Override Default Behavior
These options override the above default settings.
Don't Force Landscape Printing
When checked, this option refers to Printer Setup for page orientation, instead of forcing landscape orientation.
Don't Use Color Reduction
The default is to reduce to 256 colors - to speed up printing and reduce memory use. When checked, the application will use the color settings from your operating system (see Windows >> Control Panel >> Display >> Settings >> Color Quality). No color reduction will apply.
Printing Difficulties
If charts will not print, or do not print correctly, please try the Save Charts [F11] or Email Charts [M] functions. If they are not working, please Contact Support.
If they are working, then the problem is most likely caused by your hardware configuration. Experiment with the Advanced Settings for difficult printers.
13.3 Email Charts [M]Charts can be emailed as an image from within Incredible Charts.
1. Select the chart view that you wish to email; 2. Select Email Charts on the main menu or file menu; 3. A new message opens in your default email program and attaches the chart image; 4. Address the message and send.
View >> Advanced Options >> Send Email With Outlook sets Microsoft ® Outlook as the default email client for Incredible Charts.
Email Troubleshooting
No Chart Attached
If you send an email and the recipient does not receive any charts with the email, please check your Email software settings:
1. Open Outlook Express; 2. Select Tools >> Options >> Send 3. Click the HTML Settings button under Mail Sending Format; 4. Ensure that the Send pictures with messages box is checked; 5. Click OK twice.
No Email Message
If you see an error message "Class Not Registered" then check the Advanced Features settings:
1. Select File >> Advanced Features; 2. If you use Outlook Express, clear the Send Email with Outlook selection; 3. If you use Outlook, select Send Email with Outlook
If your default email program is not Outlook or Outlook Express the email function may not work correctly. Try selecting Send Email with Outlook. If this does not work, use the Save Charts [F11] as an image function and then attach to an email.
The Stock Screener is used to identify securities that warrant further analysis. It is not advisable to trade on the strength of the Stock Screen alone.
Start Stock Screening
To open the Stock Screening module select Stock Screen on the view menu or toolbar. This opens on the Input page.
Stock Screen Input
To list all stocks in an exchange select an Exchange and click the Run Screen button.
Tip: Use this feature to save all component securities (of an exchange or index) to a watchlist. Select the Index, click Run Screen and Create a Watchlist from the return.
Index Or Watchlists
To limit your search to securities in a particular index, or one of your watchlists, select an Index or Watchlist (e.g. W: Default) in the drop-down list.
42
To remove one of these criteria, select the blank space at the top of the drop-down list.
Tip: When screening watchlists it is important that stocks on the watchlist are from the selected exchange. Stocks from other exchanges, and indexes, will be ignored.
Sector
Sector will limit your choice to a particular sector or industry group. For example, select Materials >> Metals & Mining >> Gold for the Gold Mining industry.
• All Equities – all stocks or indexes; • Sector Indices - lists all sector indexes (not securities) that meet your search criteria; • Individual Sectors (e.g. Automotive) – filter for stocks in a specific sector.
Sort By
Sort the list of returned stocks by either:
• Stock - sorts results in alphabetical order by name; • Sector - groups results by sector; • Symbol - alphabetically by symbol• % Price Move - percentage price movement over the selected period.
Tip: Sort results by clicking the column headers on the results page.
43
Filters
To add a Filter:
1. Select a folder in the Filter section (e.g. Moving Average (Exponential)), 2. Input required data 3. Select Add
After the Filter has been added it can be deleted or edited by selecting Delete or Edit to the right of the filter.
Run Screen
Use the Run Screen button to start the search, when you have set all your filters. This will take you to the screen's Return.
44
14.2 Save ScreenTo save a stock screen (filters and settings):
1. Set the filters and settings as per Stock Screen Input. 2. Click the Save Screen button.
3. Create a unique name for your saved screen.
The saved screen will then be displayed on the Saved tab.
Tip: A descriptive name will be easy to find when you have saved multiple screens.
Tip: If you plan to share the screen, include a description. For example identify stocks starting an uptrend when the 10-day MA crossed above the 200-day MA.
Run Screen
After you have saved the screen, you can still click the Run Screen button in order to execute the screen you have just saved.
Edit Screen
Edit the Stock Screen Input (& add or delete filters) and run or save as a separate screen.
45
Saved Settings
The Save Screen button will save the displayed filters plus the following settings:
• Exchange • Index • Sector • Watchlist• Sort By and Sort Order• Results Per Page
14.3 Saved ScreensTo view your saved screens, select the Saved tab at the top of the Stock Screener.
The Saved tab offers you the option to either:
1. Run a saved screen; 2. Edit a saved screen; or 3. Delete a saved screen; or 4. Share a saved screen; or 5. Schedule a saved screen.
Run Screen
The Run command will run a screen with your Saved Settings and filters. If you are unsure of your settings, rather select Edit and check/adjust them, then Run Screen. It will take you to the screen's Return.
Edit Screen
The Edit command will take you back to the Create page, where you can adjust setting and Add or Delete filters.
Delete Screen
The Delete command should only be used if you do not want to later recall your saved settings. Deleted files cannot be retrieved.
Share Screen
The Share command will add your saved screen to the public domain where it can be viewed, copied or run by all users. Shared screens are highlighted in teal/green.
46
Schedule Screen
The Schedule command will send the results of a screen via email at regular intervals.
14.4 Share ScreenTo share a screen, select the Saved tab at the top of the Stock Screener. This tab offers you the option to Share or Hide your screens:
This will add your saved screen to the public domain where it can be viewed, copied or run by all users. Shared screens are highlighted in teal/green.
Hide Screen
The Hide command will remove your shared screen from the public domain, so it can no longer be viewed by other users.
14.5 Shared ScreensTo view shared screens from all users, in the public domain, select the Shared tab at the top of the Stock Screener. This offers the option to select a shared screen from the list or Search for a shared screen that meets specific criteria.
1. Select Run to run the shared screen;2. Select View to display or modify the shared screen filters;3. Select Search to open the search window; and4. Click on the left/right arrows to browse through the pages of shared screens.
Run
The Run command will run the selected Shared Screen, and display the screen's Return.
To return to the Shared Screen page, select on the toolbar.
47
View
The View command loads the selected stock screen in the Create tab, so you can
• Edit the Stock Screen Input (settings & filters) and/or Run Screen.• Save Screen as a new screen and/or Run Screen.
Search
We recommend that you use the Search function to find screens that meet your criteria. To do so you will need to select th search command on the Shared Screens page and input the known details of the saved stock screen. Search by using:
1. Using the drop down menus; or2. Typing in data.
• Enter the Screen ID number (e.g. 1890) if you know it;• To search by Date Saved, use the yyyy-mm-dd format (e.g. 2008-11-20);• Search by Author name (e.g. Colin) • Search for generic terms in the Title field (e.g. Trend); and/or• Search for specific filters using the drop-down list in the Screen Contains field.
Click the Search button and the results will be displayed below.
Search Results
The search results offer two options:
1. Run the shared screen to see the Return; or2. View opens the screen in the Create tab - display or modify the Stock Screen Input.
48
14.6 Schedule ScreenRegular stock screens can be scheduled on a daily, weekly, monthly or quarterly basis. The screen results are emailed. Active traders will find daily emails particularly useful but weekly emails are recommended for longer-term traders.
To schedule a saved screen:
1. Open the Saved tab at the top of the Stock Screener to view your saved stock screens2. Click the Sched link next to a saved screen
3. Select how often the screen must run: Never, Daily, Weekly, Monthly or QuarterlyIf daily screens are chosen, select which day/s of the week it is to be emailed.
The emailed link will open the screen results in your browser, identifying new additions and stocks carried over from the last screen. The results can also be downloaded to a spreadsheet.
Tip: For a weekly screen before the end of week, select e.g. Daily >> Wednesday.
Edit Schedule Frequency
To revise the screens frequency go to the Scheduled tab in the Stock Screener, and select the Sched link next to a Scheduled Screen.
49
Delete Scheduled Screen
To delete a scheduled screen go to the Scheduled tab in the Stock Screener, and select the Del link next to a Scheduled Screen. This also deletes the Saved Screen. Alternatively, Edit Schedule Frequency to Never. This will not delete the Saved Screen.
14.7 ReturnThe Stock Screen Return lists all securities that meet the search criteria in a spreadsheet.
Example
The results page for all securities on the Australian Stock Exchange (ASX) where:
• Closing price has increased by 20% or more over the last 6 months; • Closing price has increased by 150% or more over the last 3 years; and • Closing price is at least 90% of the highest price traded in the the last 3 years.
Number Of Securities
The number of securities returned on the page and the total number of securities that meet the search criteria are displayed at the top of the spreadsheet (e.g. 1 - 8 of 8). To display All Securities if only some of the return is displayed (e.g. 1 - 100 of 182), amend the Stock Screen Input. Alternately, scroll through the return pages.
Scroll Through Return Pages
If the return is not displayed on a single page, use the scroll arrows on the toolbar to navigate through the pages.
There are three scroll buttons:
1. scroll forward 2. return to original results page 3. scroll back
50
Sort Securities
Arrange the securities in order of any field on the spreadsheet by clicking on the column header. For example clicking on %PM(126D) will sort the securities from highest to lowest 6-Month Percentage price move.
To reverse the order click on the column header again. For example click on %PM(126D) a second time and the securities are sorted from lowest to highest.
To revert to the original order, click on the header above the first (bullets) column.
Chart A Security
To chart a security:
• Click on a security to select it. It will remain highlighted until another is selected.• Click on the toolbar.
Alternately, double-click on a security, or select a security then use F6 on you keyboard.
Tip: To scroll through all the charts in a stock screen, select Scroll Stock Screen on the charts toolbar, then use the yellow up/down arrows.
Create A Watchlist
Add Selected Security To Watchlist
Select a security and then click to add it to a chosen watchlist.
Create Watchlist: Automatically Adding Top 20 Securities [F7]
Use to create a new watchlist with the top 20 securities on the stock screen list.
Create Watchlist: Automatically Adding All Securities [F8]
Click to create a new watchlist with all the securities on the stock screen list.
51
15. Appendices 15.1 Loading Data from Disk
To import your own data, in ASCII format, directly from your hard disk:
1. Select Securities >> Load By Symbol From Disk, or use CTRL + D
2. Select ASCII Data Folder to choose where the data is loaded from3. Enter the file name 4. Click Load
To Enter a Stock Code and load from disk, preface the codes with d_, e.g. d_msft.
Data Format
Only Yahoo format is recognized at this stage. Download an example file (312KB).
Please note:
• The file must be a comma delimited file (.csv)• A header row is required• Column order must be Date, Open, High, Low, Close, Volume
A column for Adj Close can be included after Volume• Dates must be in descending order (latest date at the top)• The correct date format is 26-March-06. Other date formats that work are:
Incredible Charts remembers the extension of the last data file imported (e.g. .csv) and will use that on any subsequent file with no extension. Ideally, all data files should have the same extension (or no extension). The default folder and default extension are remembered between sessions.
Hint: To set the file extension to blank, use CTRL+D >> Select ASCII Data Folder and re-set the folder. The default extension will be restored to “”.
15.2 Loading Data from External WebsitesData can also be imported directly from Yahoo Finance:
Load A Symbol
Select Securities >> Load By Symbol From Yahoo, or use CTRL + Y, enter the stock code (e.g. msft) and select an exchange. Then click Load.
Enter a Stock Code prefaced with y_ to load from Yahoo, e.g. y_msft or y_^ftse.
Hint: Securities loaded from Yahoo are cached for 15 minutes. Use CTRL + F2 or CTRL + F5 to force the security to reload directly from the Yahoo server.
Symbol Lookup
To lookup a symbol on Yahoo, select Open Yahoo's "Symbol Lookup" web page from the toolbar Search menu.
53
Delayed Quotes
Click on the toolbar, or Q on your keyboard, to access delayed quotes from Yahoo.
Useful Links
The Yahoo pages load with an Incredible Charts header containing useful Quick Links.
15.3 Dilution AdjustmentsData from brokers or the Internet is not normally adjusted for stock splits, spinoffs, consolidations, capital returns, and name/code changes - which distort data history and cause false trading signals. This distorts the data history and can cause false trading signals. Incredible Charts Premium Data Service allows you to trade with confidence by providing data adjusted for the dilutions above, as well as reconstructions and merges.
Stock prices may be adjusted for the dilution effect of share splits, rights issues, special dividends (capital returns), spin-offs and reconstructions.
The purpose of a dilution adjustment is to remove the price gap after a diluting corporate action (e.g. a stock split) and to provide a price history consistent with the current number of shares in issue. Without this adjustment, indicators signals can become distorted – leading to incorrect trading decisions.
Share Splits
Share splits are the easiest to understand. In a 2:1 share split the number of shares is doubled, by issuing extra shares to existing shareholders for no consideration.
The dilution factor will be 0.5 as there are now two shares in place of one.
Special Dividends: Return Of Capital
Special dividends usually occur when a company sells a major asset or subsidiary; they are not paid out of current operating profits. If the company has cash surplus to its requirements, the surplus may be distributed to shareholders as a special dividend.
If you own 1,000 shares in a company, worth $10.00 each, and the company pays a special dividend of $2.00 per share from the proceeds of sale of a subsidiary:
Present value 1,000 * $ 10 = $10,000Less: Cash paid 1,000 * $ 2 = -$2,000New value $8,000
The new value per share is therefore $8,000 ÷ 1,000 = $8.00 The dilution factor is therefore $8.00 ÷ $10.00 = 0.80
If the chart is not adjusted, it will show a gap of $2.00 between the closing price and the opening price on the next day.
Spin-offs And Reconstructions
Spin-offs are where a company issues shares in a subsidiary to its shareholders for no consideration. Reconstructions cover a whole spectrum of arrangements that may affect the market value of issued shares. They are more complicated, but the same basic principles apply.
Rights Issues
Rights issues are where a company issues additional shares to existing shareholders, normally at a discount to the current market price.
Example
If you are the only shareholder in a company with 1000 shares, worth $10.00 each, and the company issues an extra 200 shares to you (a rights issue) at $7.00 each, the new value of each share can then be calculated:
Present value 1,000 * $ 10 = $10,000.00
Cash from issue 200 * $ 7 = $1,400.00New value $11,400.00
The new value per share is therefore $11,400 ÷ 1,200 = $9.50 The dilution factor is therefore $9.50 ÷ $10.00 = 0.95
If the chart is not adjusted for dilutions, it will show a gap of 50 cents between the closing price and the opening price on the next day.
55
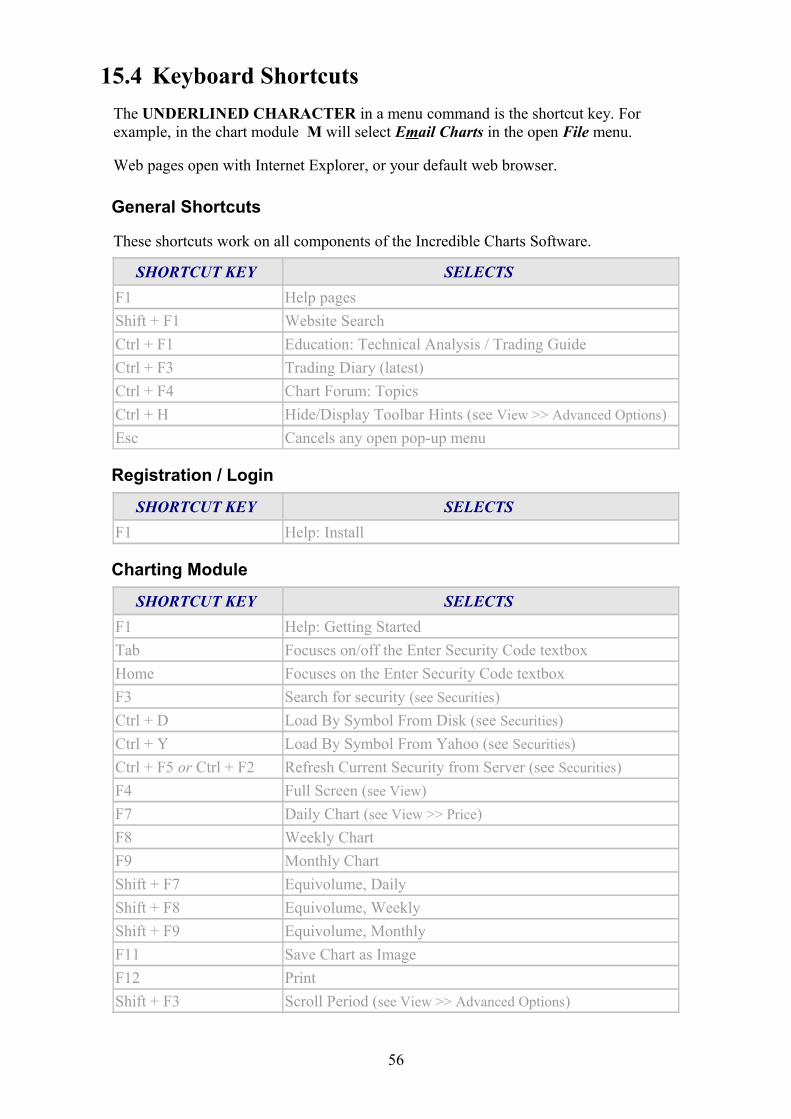
15.4 Keyboard ShortcutsThe UNDERLINED CHARACTER in a menu command is the shortcut key. For example, in the chart module M will select Email Charts in the open File menu.
Web pages open with Internet Explorer, or your default web browser.
General Shortcuts
These shortcuts work on all components of the Incredible Charts Software.
SHORTCUT KEY SELECTS F1 Help pagesShift + F1 Website SearchCtrl + F1 Education: Technical Analysis / Trading GuideCtrl + F3 Trading Diary (latest)Ctrl + F4 Chart Forum: TopicsCtrl + H Hide/Display Toolbar Hints (see View >> Advanced Options)Esc Cancels any open pop-up menu
Registration / Login
SHORTCUT KEY SELECTS F1 Help: Install
Charting Module
SHORTCUT KEY SELECTS F1 Help: Getting Started Tab Focuses on/off the Enter Security Code textboxHome Focuses on the Enter Security Code textboxF3 Search for security (see Securities)Ctrl + D Load By Symbol From Disk (see Securities)Ctrl + Y Load By Symbol From Yahoo (see Securities)Ctrl + F5 or Ctrl + F2 Refresh Current Security from Server (see Securities)F4 Full Screen (see View) F7 Daily Chart (see View >> Price)F8 Weekly ChartF9 Monthly ChartShift + F7 Equivolume, DailyShift + F8 Equivolume, WeeklyShift + F9 Equivolume, MonthlyF11 Save Chart as ImageF12 PrintShift + F3 Scroll Period (see View >> Advanced Options)
56
SHORTCUT KEY SELECTS Left Arrow Reverse Scroll Through ChartRight Arrow Forward Scroll through ChartShift + Left Arrow Scroll To BeginningShift + Right Arrow Scroll To EndUp Arrow or scroll Mouse Wheel upwards
1. Select Next Security on Active Watchlist2. Select Next Security on Stock Screen Results NB Select list first
Down Arrow or scroll Mouse Wheel downwards
1. Select Next Security on Active Watchlist2. Select Next Security on Stock Screen Results NB Select list first
Ctrl + C Hide/Display all CaptionsCtrl + T Hide/Display all TrendlinesCtrl + F Open Project (see File)F6 Project Defaults (see File)Shift + F4 Set Active Watchlist Shift + F5 Active WatchlistShift + F6 Watchlists sub-menu
MAIN KEYBOARD SELECTS B or double-click Mouse Center Key
Toggles between1. Active Watchlist scrolling and2. Stock Screen Result scrolling
R Toggles Draw Trendline button A Toggles Set Caption button L Toggles Legend on and off U Toggles Crosshair Cursor
X Opens Stock Screen InputToggles between Stock Screen Results and Charting
Y Toggles between Search Results and Charting Z Toggles Zoom active / inactive Q Access Delayed Quotes from Yahoo F File menu E Securities menu I Indicator panel V View menu C Format Charts menu T Time Period menu W Watchlist menu H Help menu M Email Charts S Stop loading (Security, Screening or Search)
57
Stock Screening
These shortcuts are for the Stock Screen results unless indicated otherwise.
SHORTCUT KEY SELECTS Enter or F6 Chart the selected securityF1 Help: Stock Screening F2 (on Input page) Refresh (reloads the Input Page) F3 Stock Screen Input Page F7 Create Watchlist automatically adding the top 20 securities F8 Create Watchlist automatically adding all visible securities Right Arrow Next page of stock screen results Left Arrow Previous page of stock screen results Shift + Left Arrow First page of stock screen results
MAIN KEYBOARD SELECTS C Chart module I Stock Screen Input page V View menu H Help menu X Toggles between Stock Screen Results and Charting S Stop Security from loading
Search Results
These shortcuts are for use on the Results page, after using Search for a Stock.
SHORTCUT KEY SELECTS Enter or F6 Chart the selected securityF3 or N New SearchF8 Create Watchlist automatically adding all securities
MAIN KEYBOARD SELECTS V View menu H Help menu L Close SearchY Toggles between Search Results and Charting