Incremental Analysis and Incremental Analysis and Capital Budgeting Capital Budgeting Chapter 27 Chapter 27 Accounting Principles, 7 Accounting Principles, 7 th th Edition Edition Weygandt Weygandt • Kieso Kieso • Kimmel Kimmel Prepared by Naomi Karolinski Prepared by Naomi Karolinski Monroe Community College Monroe Community College and and Marianne Bradford Marianne Bradford Bryant College Bryant College
Transcript
Incremental Analysis and Incremental Analysis and Capital BudgetingCapital Budgeting
Prepared by Naomi KarolinskiPrepared by Naomi KarolinskiMonroe Community CollegeMonroe Community College
andandMarianne BradfordMarianne Bradford
Bryant CollegeBryant College
CHAPTER 27INCREMENTAL ANALYSISAND CAPITAL BUDGETING
After studying this chapter, you should be able to:
1 Identify the steps in management’s decision-making process.
2 Describe the concept of incremental analysis.3 Identify the relevant costs in accepting an order at a
special price.4 Identify the relevant costs in a make-or-buy decision.5 Give the decision rule for whether to sell or process
materials further.6 Identify the factors to be considered in retaining or
replacing equipment.
CHAPTER 27INCREMENTAL ANALYSISAND CAPITAL BUDGETING
7 Explain the relevant factors in deciding whether to eliminate an unprofitable segment.
8 Determine which products to make and sell when a company’s resources are limited.
9 Contrast the annual rate of return and cash payback techniques in capital budgeting.
10 Distinguish between the net present value and internal rate of return methods.
After studying this chapter, you should be able to:
Management’s Decision-Making Process
Study Objective 1
Management's decision-making process frequently involves the following steps:
1) Identify the problem and assign responsibility
2) Determine and evaluate possible
courses of action
3) Make a decision
4) Review results of the decision
Incremental AnalysisStudy Objective 2
• Business decisions involve a choice among alternative courses of action.
• In making such decisions, management ordinarily considers both financial and nonfinancial information.
• The process used to identify the financial data that change under alternative courses of action is called incremental analysis.
Incremental Analysis
• Incremental analysis includes the probable effects of the decision on future earnings.
• Data for incremental analysis involves estimates and uncertainty.
• Gathering data may involve market analysts, engineers, and accountants.
• In incremental analysis, both costs and revenues may change. However, in some cases:
– (1) variable costs may not change under the alternative courses of action, and
– (2) fixed costs do change
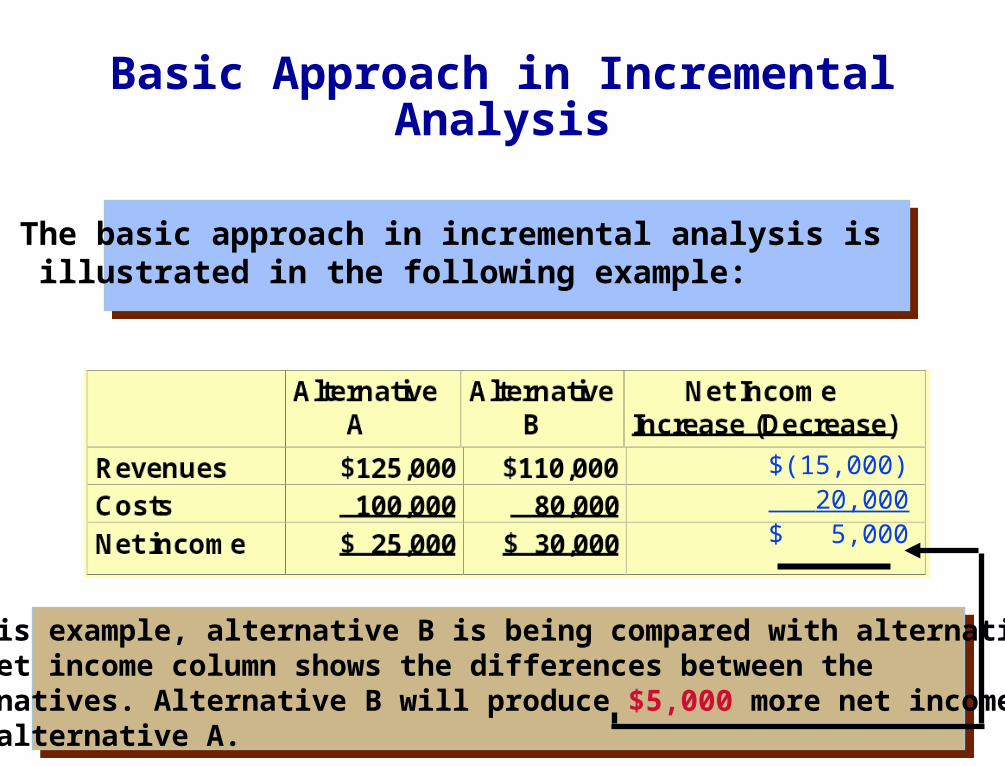
Basic Approach in Incremental Analysis
$(15,000) 20,000$ 5,000
The basic approach in incremental analysis is illustrated in the following example:
In this example, alternative B is being compared with alternative A.The net income column shows the differences between thealternatives. Alternative B will produce $5,000 more net incomethan alternative A.
Types of Incremental Analysis
A number of different types of decisions involve incremental analysis. The more common types of decisions are whether to:
1) Accept an order at a special price. 2) Make or buy. 3) Sell or process further. 4) Retain or replace equipment. 5) Eliminate an unprofitable business segment. 6) Allocate limited resources.
Accept an Order at a Special Price
Study Objective 3
• Sometimes, a company may have an opportunity to obtain additional business if it is willing to make major price concessions to a specific customer.
• An order at a special price should be accepted when the incremental revenue from the order exceeds the incremental costs.
• It is assumed that sales in other markets will not be affected by the special order.
• If the units can be produced within existing plant capacity, generally only variable costs will be affected.
Accept an Order at a Special Price
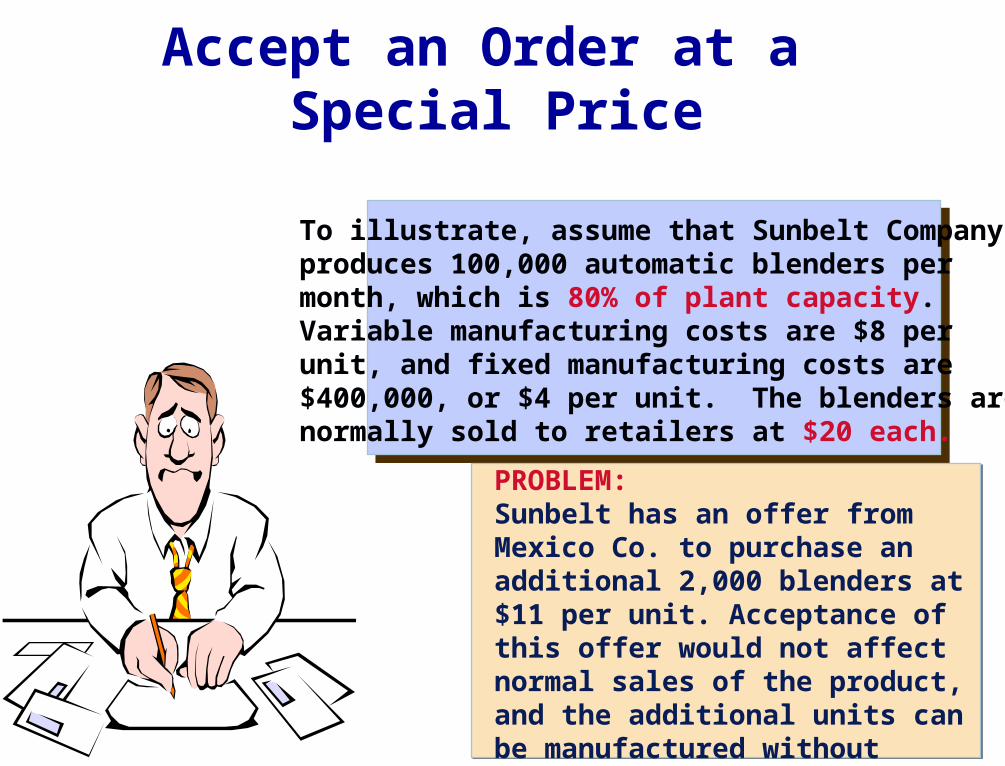
To illustrate, assume that Sunbelt Companyproduces 100,000 automatic blenders per month, which is 80% of plant capacity.Variable manufacturing costs are $8 perunit, and fixed manufacturing costs are$400,000, or $4 per unit. The blenders arenormally sold to retailers at $20 each.
PROBLEM:Sunbelt has an offer from Mexico Co. to purchase an additional 2,000 blenders at $11 per unit. Acceptance of this offer would not affect normal sales of the product, and the additional units can be manufactured without increasing plant capacity.
$22,000 (16,000)
$6,000
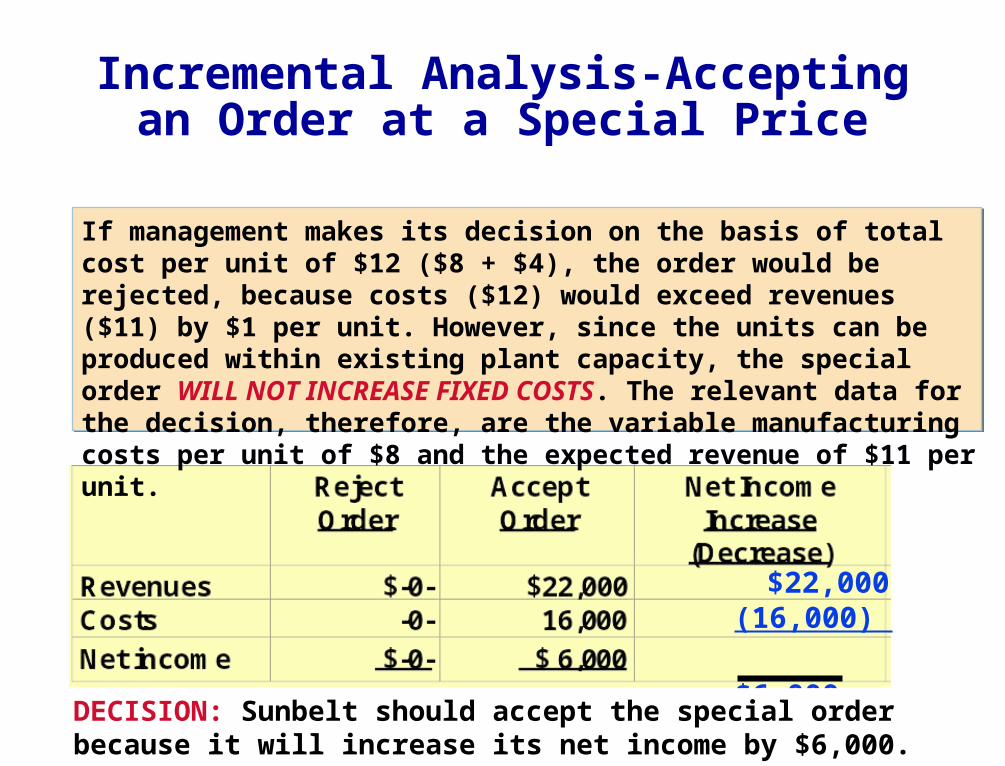
Incremental Analysis-Accepting an Order at a Special Price
If management makes its decision on the basis of total cost per unit of $12 ($8 + $4), the order would be rejected, because costs ($12) would exceed revenues ($11) by $1 per unit. However, since the units can be produced within existing plant capacity, the special order WILL NOT INCREASE FIXED COSTS. The relevant data for the decision, therefore, are the variable manufacturing costs per unit of $8 and the expected revenue of $11 per unit.
DECISION: Sunbelt should accept the special order because it will increase its net income by $6,000.
Make or BuyStudy Objective 4
• In a make or buy decision, management must determine the costs which are different under the two alternatives.
• If there is an opportunity to use the productive capacity for another purpose, opportunity cost should be considered.
• Opportunity cost is the potential benefit that may be obtained by following an alternative course of action. This cost is an additional cost of making the component.
To illustrate the analysis, assume that Baron Co.incurs the following annual costs in producing25,000 ignition switches for motor scooters.
Annual Product Cost Data
Total cost per unit ($225,000 / 25,000) $9.00
Alternatively, Baron may purchasethe ignition switches from Ignition,Inc. at a price of $8 per unit. PROBLEM:What should management do?
Incremental Analysis-Make or Buy
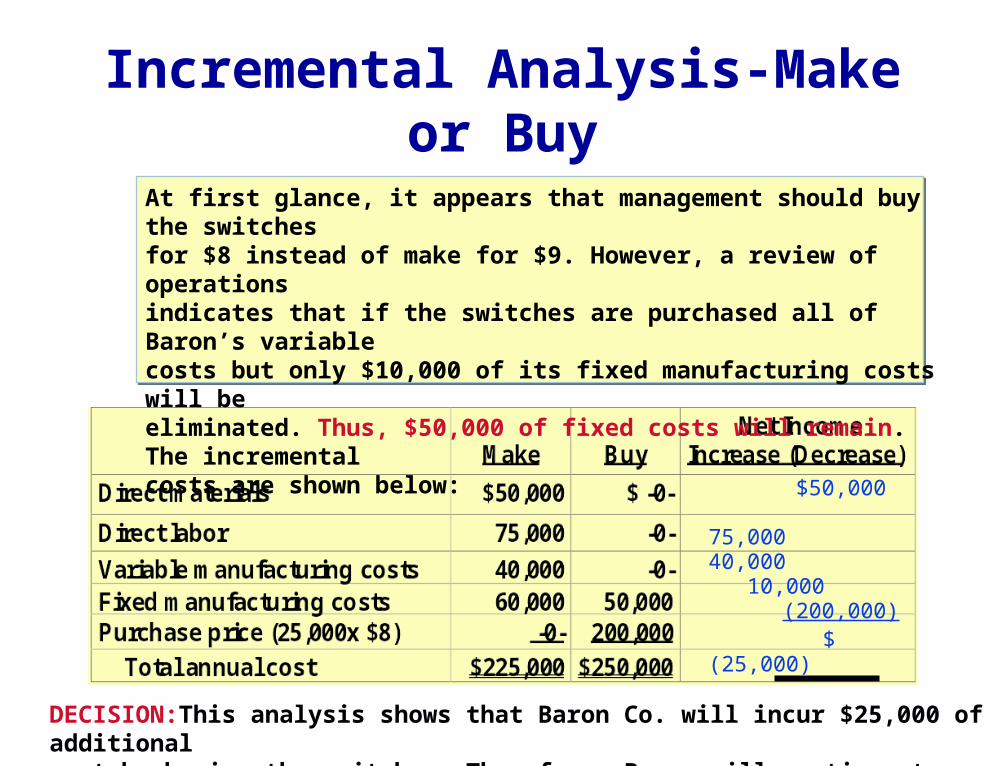
$50,000 75,000
40,000 10,000 (200,000)
$ (25,000)
At first glance, it appears that management should buy the switchesfor $8 instead of make for $9. However, a review of operationsindicates that if the switches are purchased all of Baron’s variablecosts but only $10,000 of its fixed manufacturing costs will beeliminated. Thus, $50,000 of fixed costs will remain. The incrementalcosts are shown below:
DECISION:This analysis shows that Baron Co. will incur $25,000 of additional cost by buying the switches. Therefore, Baron will continue to make the switches.
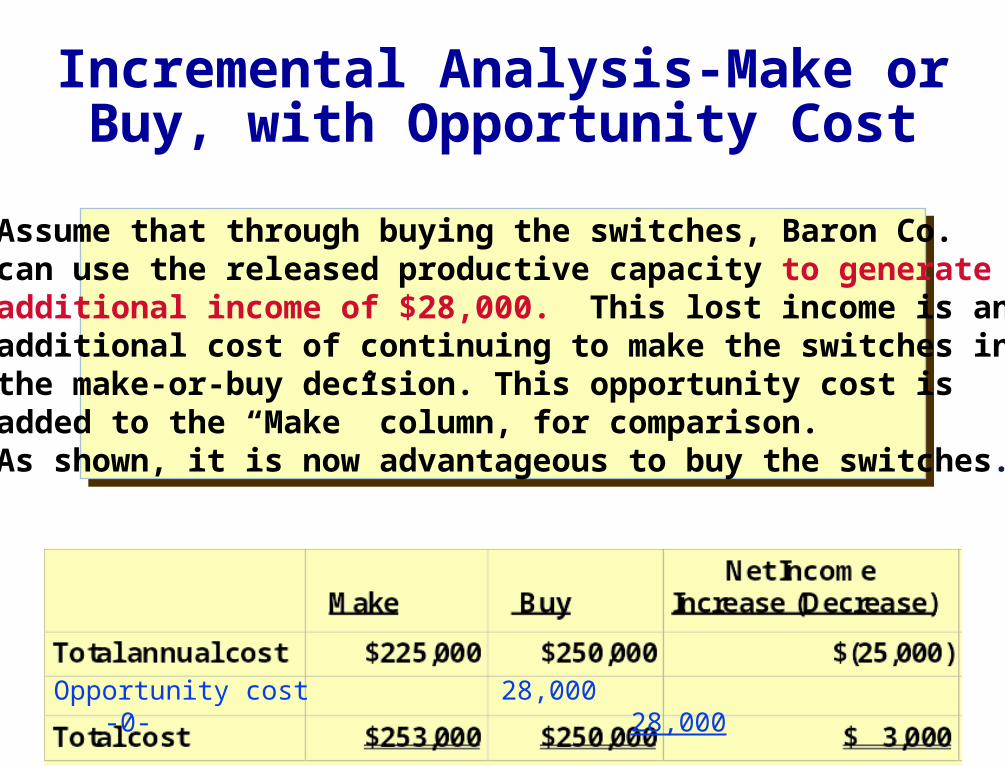
Assume that through buying the switches, Baron Co.can use the released productive capacity to generateadditional income of $28,000. This lost income is anadditional cost of continuing to make the switches inthe make-or-buy decision. This opportunity cost isadded to the “Make” column, for comparison.As shown, it is now advantageous to buy the switches.
Incremental Analysis-Make or Buy, with Opportunity Cost
Opportunity cost 28,000 -0- 28,000
In a make-or-buy decision, relevant costs are:
a. manufacturing costs that will be saved.
b. the purchase price of the units.
c. opportunity costs.
d. all of the above.
In a make-or-buy decision, relevant costs are:
a. manufacturing costs that will be saved.
b. the purchase price of the units.
c. opportunity costs.
d. all of the above.
Sell or Process FurtherStudy Objective 5
• The basic decision rule in a sell or process further decision is:
• Process further as long as the incremental revenue from such processing exceeds the incremental processing costs.
• Incremental revenue is the increase in sales which results from processing the product further.
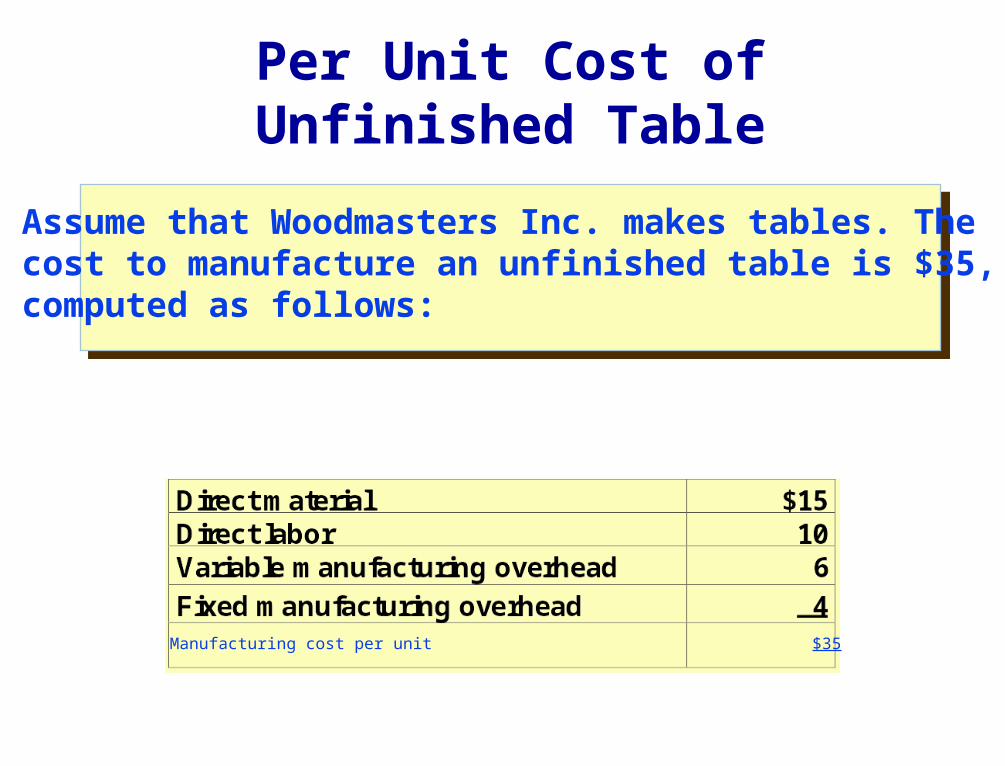
Assume that Woodmasters Inc. makes tables. The cost to manufacture an unfinished table is $35, computed as follows:
Per Unit Cost of Unfinished Table
Manufacturing cost per unit $35
Incremental Analysis-Sell or Process Further
The selling price per unfinished unit is $50. Woodmasters currently hasunused productive capacity that can be used to finish the tables and sell them for $60 each. For a finished table direct materials will increase $2 and direct labor costs will increase $4. Variable overhead will increase by $2.40 (60% of direct labor). There will be no increase in fixed overhead. The incremental analysis on a per unit basis is as follows:
DECISION: Woodmasters
should process the tables further because incremental revenue is higher than incremental processing costs.
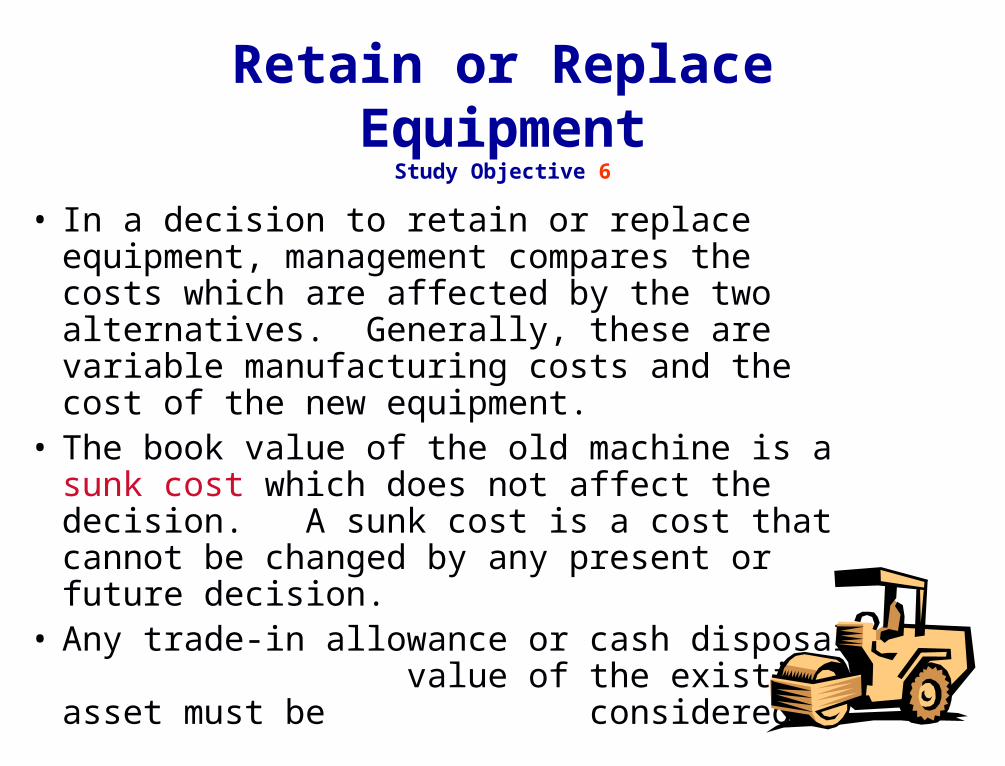
Retain or Replace Equipment
Study Objective 6
• In a decision to retain or replace equipment, management compares the costs which are affected by the two alternatives. Generally, these are variable manufacturing costs and the cost of the new equipment.
• The book value of the old machine is a sunk cost which does not affect the decision. A sunk cost is a cost that cannot be changed by any present or future decision.
• Any trade-in allowance or cash disposal value of the existing asset must be considered.
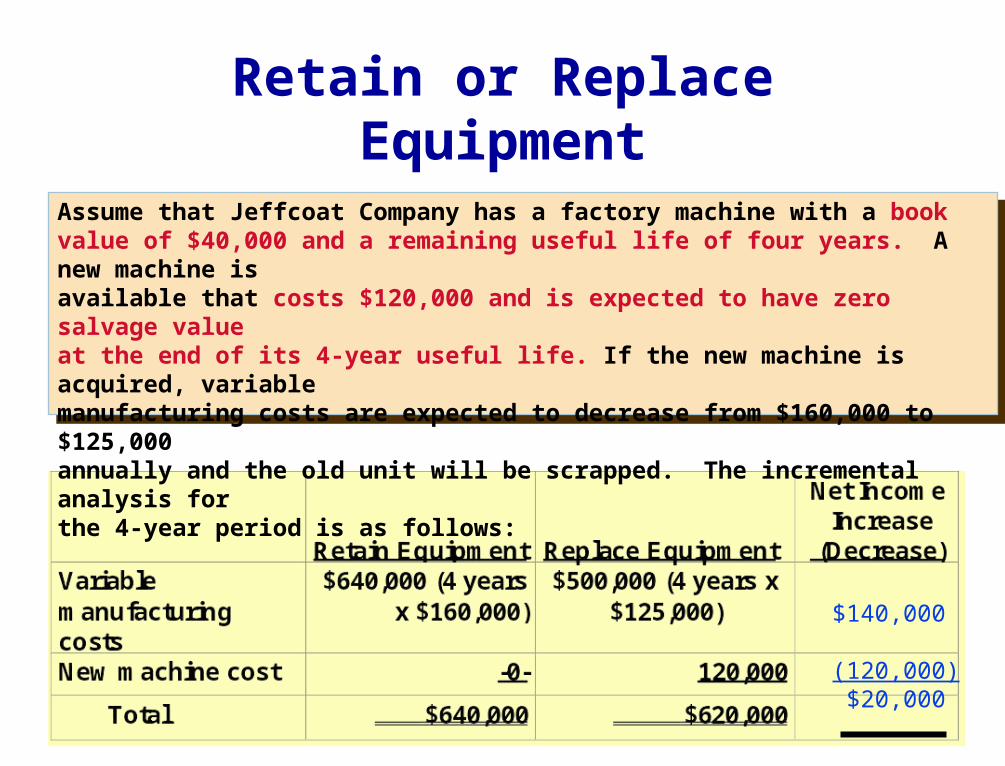
Retain or Replace Equipment
Assume that Jeffcoat Company has a factory machine with a book value of $40,000 and a remaining useful life of four years. A new machine is available that costs $120,000 and is expected to have zero salvage value at the end of its 4-year useful life. If the new machine is acquired, variablemanufacturing costs are expected to decrease from $160,000 to $125,000 annually and the old unit will be scrapped. The incremental analysis for the 4-year period is as follows:
$140,000
(120,000) $20,000
Retain or Replace Equipment
DECISION:• In this case, it would be to the company’s
advantage to REPLACE the equipment. • The lower variable manufacturing
costs due to replacement more than offset the cost of the new equipment.
• The sunk cost, the book value of the old machine does not affect the decision.
Eliminate an Unprofitable Segment
Study Objective 7
• In deciding whether to eliminate an unprofitable segment, management should choose the alternative which results in the highest net income.
• Often fixed costs allocated to the unprofitable segment must be absorbed by the other segments.
• It is possible, therefore, for net income to decrease when an unprofitable segment is eliminated.
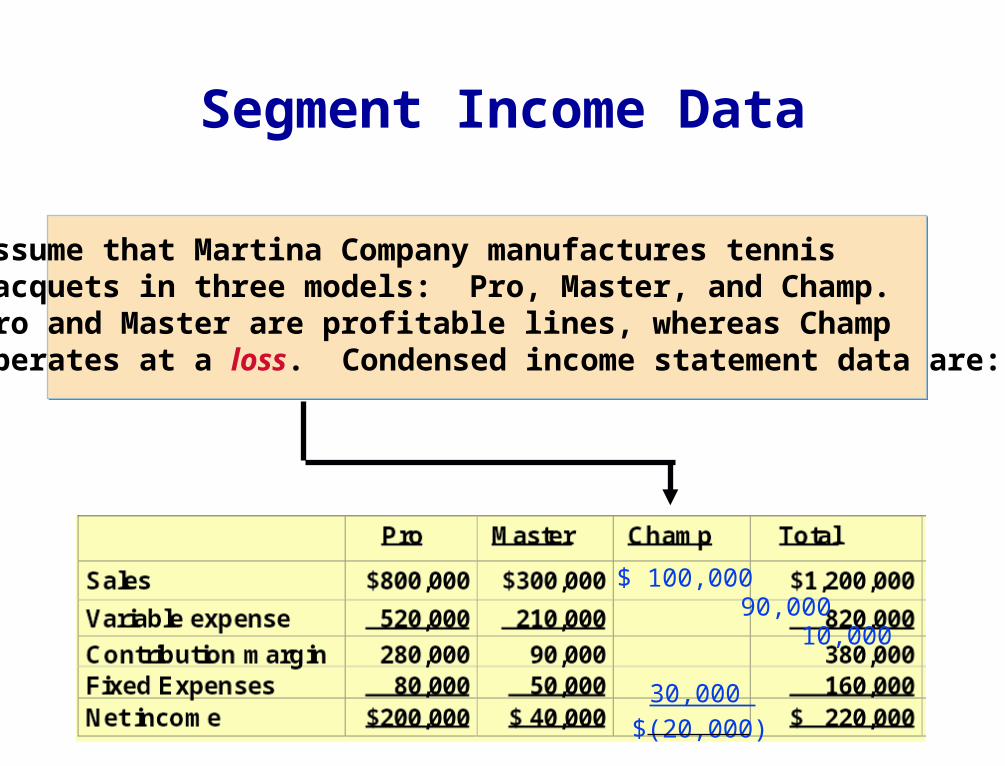
Assume that Martina Company manufactures tennis racquets in three models: Pro, Master, and Champ.Pro and Master are profitable lines, whereas Champoperates at a loss. Condensed income statement data are:
Segment Income Data
$ 100,000 90,000 10,000 30,000
$(20,000)
Income Data after Eliminating Unprofitable
Product Line
100,000 60,000 $210,000
Total net incomehas decreased$10,000:($220,000 - $210,000)
Although it appears that income wouldincrease if the Champ line was discontinued,it is possible for income to decrease ifChamp was discontinued. The reason is thatthe fixed expense allocated to Champ willhave to be absorbed by the other products.To illustrate, assume that the $30,000 of fixed costs are allocated 2/3 to Pro and 1/3to Master. The revised income statement is:
PROBLEM:
Incremental Analysis-Eliminating an Unprofitable
Segment
$(100,000) 90,000
(10,000) -0-
$(10,000)
The loss in net income is attributable to the contributionmargin ($10,000) that will not be realized if the segmentis discontinued.DECISION: In deciding on the future status of anunprofitable segment, management should consider the effect of elimination on related product lines. In this casetotal net income would have decreased if Champ iseliminated.
Allocate Limited ResourcesStudy Objective 8
• When a company has limited resources (floor space, raw materials, or machine hours), management must decide which products to make and sell.
• In an allocation of limited resources decision, it is necessary to find the contribution margin per unit of limited resource.
• This is obtained by dividing the contribution margin per unit of each product by the number of units of the limited resource required for each product.
• Production should be geared to the product with the highest contribution margin per unit of limited resource.
Contribution Margin per Unit of Limited Resource
• To illustrate, assume that Collins Co. manufactures deluxe and standard pen and pencil sets.
• The limited resource is machine capacity, which is 3,600 hours per month.
• Based on the data below, it would appear that deluxe is more profitable since they have a higher contribution margin.
• However, standard sets take fewer machine hours.
• Therefore, it is necessary to find the contribution margin per unit of limited resource.
Contribution Margin per Unit of Limited Resource
$2 $3
The computation shows that the standard sets have a higher contribution margin per unit of limited resource.
Incremental Analysis-Computation
of Total Contribution Margin• If Collins Co. can increase machine capacity from 3,600
hours to 4,200 hours, the additional 600 hours could be used to produce either the standard or deluxe pen and pencil sets.
• The total contribution margin under each alternative is found by multiplying the machine hours by the contribution margin per unit of limited resource as shown below:
DECISION:From this analysis,we can see that tomaximize net income,all of the increasedcapacity should be used to make and sellthe standard sets.
Capital Budgeting
• The process of making capital expenditure decisions is known as capital budgeting.
• The three most commonly used capital budgeting techniques are
(a) annual rate of return,
(b) cash payback, and
(c) discounted cash flow.
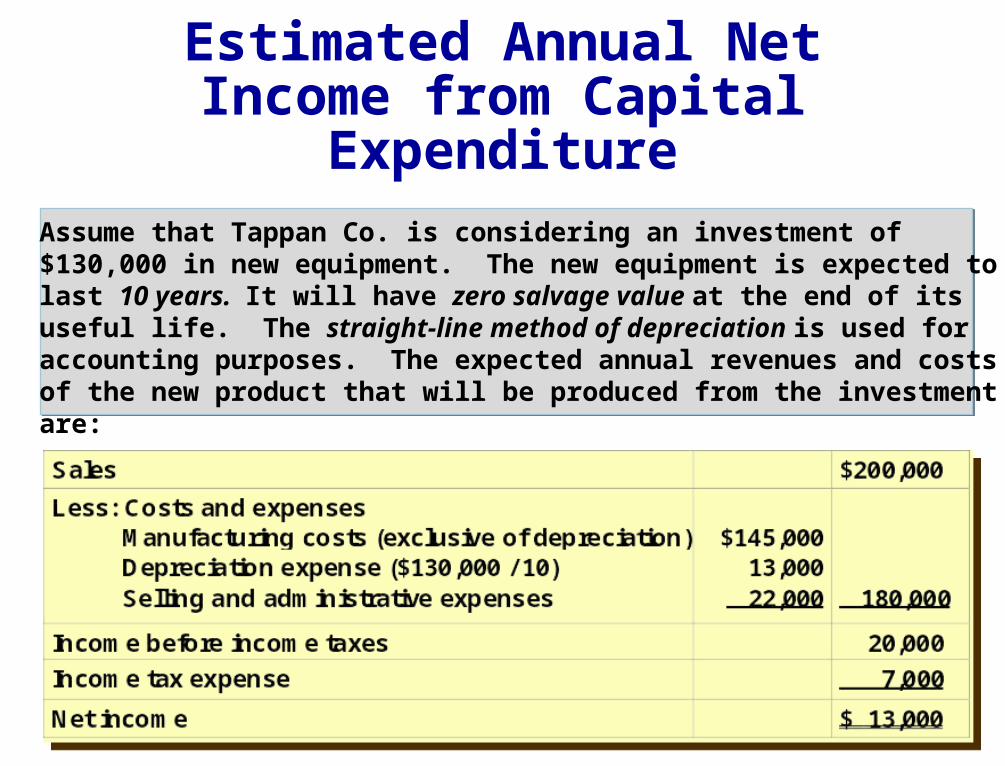
Estimated Annual Net Income from Capital
ExpenditureAssume that Tappan Co. is considering an investment of $130,000 in new equipment. The new equipment is expected to last 10 years. It will have zero salvage value at the end of its useful life. The straight-line method of depreciation is used for accounting purposes. The expected annual revenues and costs of the new product that will be produced from the investment are:
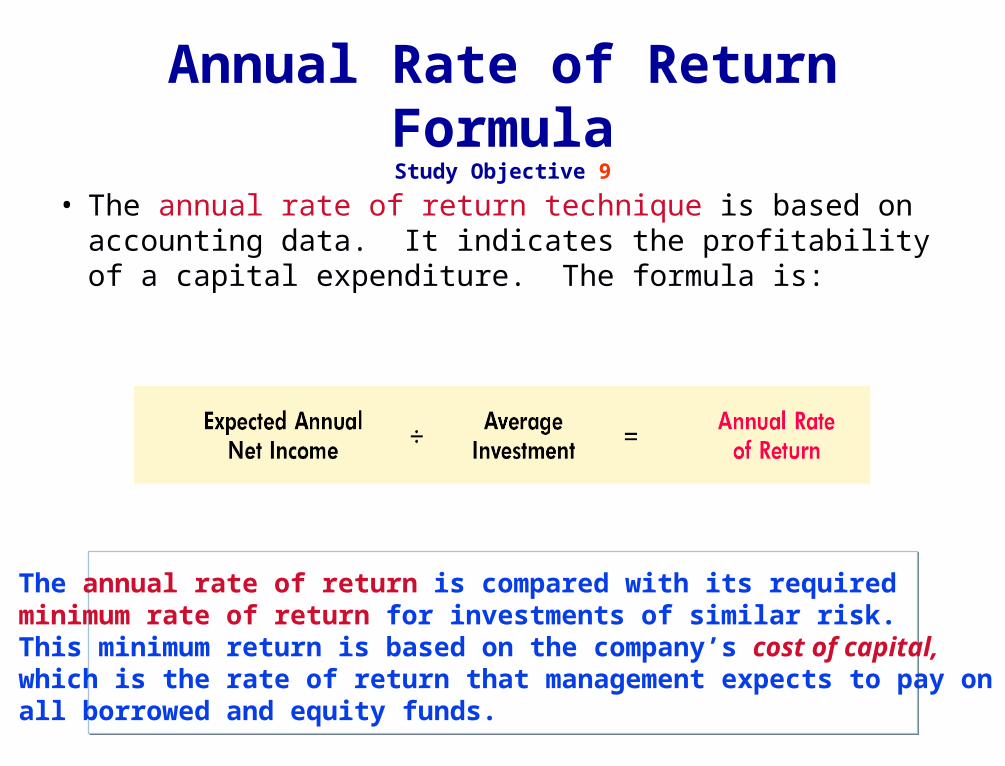
• The annual rate of return technique is based on accounting data. It indicates the profitability of a capital expenditure. The formula is:
Annual Rate of Return Formula
Study Objective 9
The annual rate of return is compared with its requiredminimum rate of return for investments of similar risk. This minimum return is based on the company’s cost of capital,which is the rate of return that management expects to pay onall borrowed and equity funds.
Formula for Computing Average Investment
For Tappan, average investment is $65,000: [($130,000 + $0)/ 2]
Expected annual net income ($13,000) is obtained fromthe projected income statement. Average investment isderived from the following formula:
Solution to Annual Rate of Return Problem
$13,000 / $65,000 = 20%
The expected annual rate of return for Tappan Company’s investment in new equipment is therefore 20%, computedas follows:
The decision rule is: A project is acceptable if its rate of return is greater than management’s minimum rate of return. It is unacceptable when the reverse is true. Whenchoosing among several acceptable projects, the higher the rate of returnfor a given risk, the more attractive the investment.
Cash Payback Formula
The cash payback technique identifies the time period required to recover the cost of the capital investment fromthe annual cash inflow produced by the investment. The formula for computing the cash payback period is:
Computation of Annual Cash Inflow
In the Tappan Company example, annual cash inflow is $26,000 as shown below:
Annual cash inflow $26,000
Annual (or net) cash inflow is approximated by taking net income and adding back depreciation expense. Depreciation expense is added back because depreciation on the capital expendituredoes not involve an annual outflow of cash.
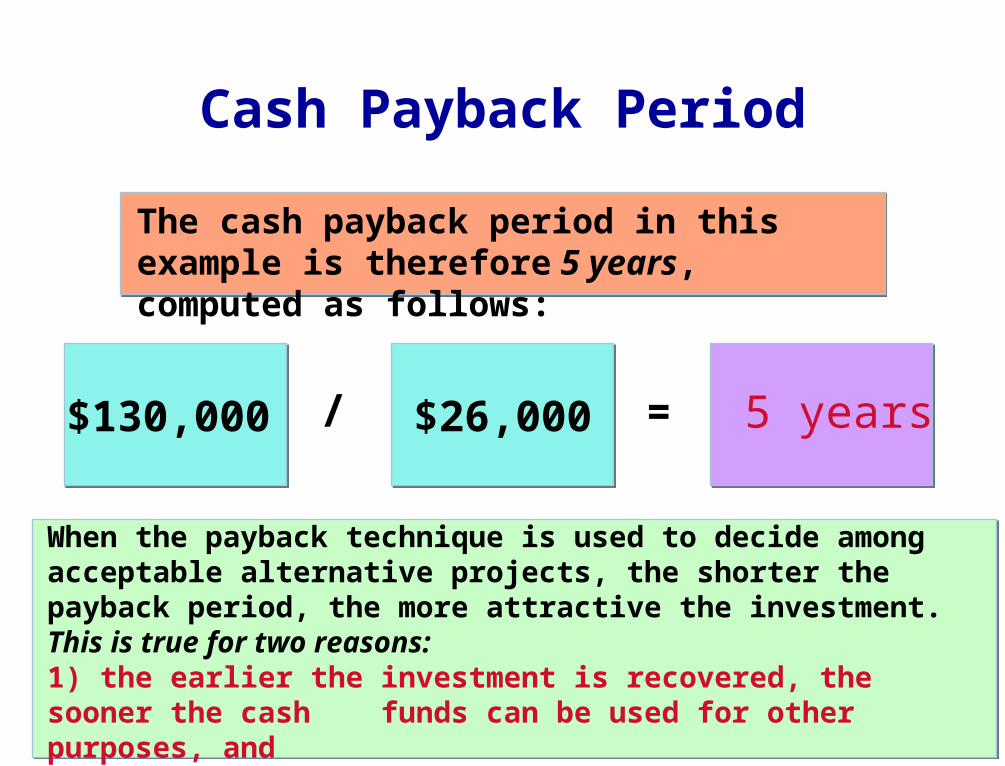
Cash Payback Period
$130,000 $26,000 5 years/ =
The cash payback period in this example is therefore 5 years, computed as follows:
When the payback technique is used to decide among acceptable alternative projects, the shorter the payback period, the more attractive the investment. This is true for two reasons:1) the earlier the investment is recovered, the sooner the cash funds can be used for other purposes, and2) the risk of loss from obsolescence and changed economic conditions is less in a shorter payback period.
Discounted Cash FlowStudy Objective 10
• The discounted cash flow technique is generally recognized as the best conceptual approach to making capital budgeting decisions.
• This technique considers both the estimated total cash inflows and the time value of money.
• Two methods are used with the discounted cash flow technique:
1) net present value and
2) internal rate of return
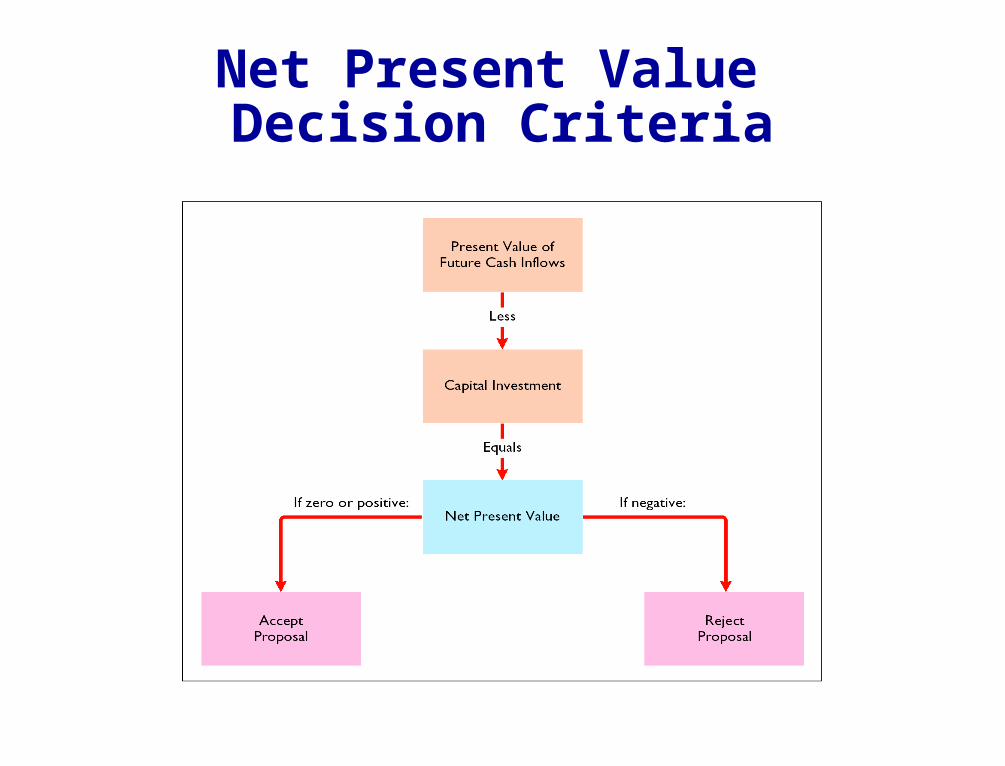
Net Present Value Method
• Under the net present value method, cash inflows are discounted to their present value and then compared with the capital outlay required by the investment.
• The interest rate used in discounting the future cash inflows is the required minimum rate of return.
• A proposal is acceptable when NPV is zero or positive.
• The higher the positive NPV, the more attractive the investment.
Net Present Value Decision Criteria
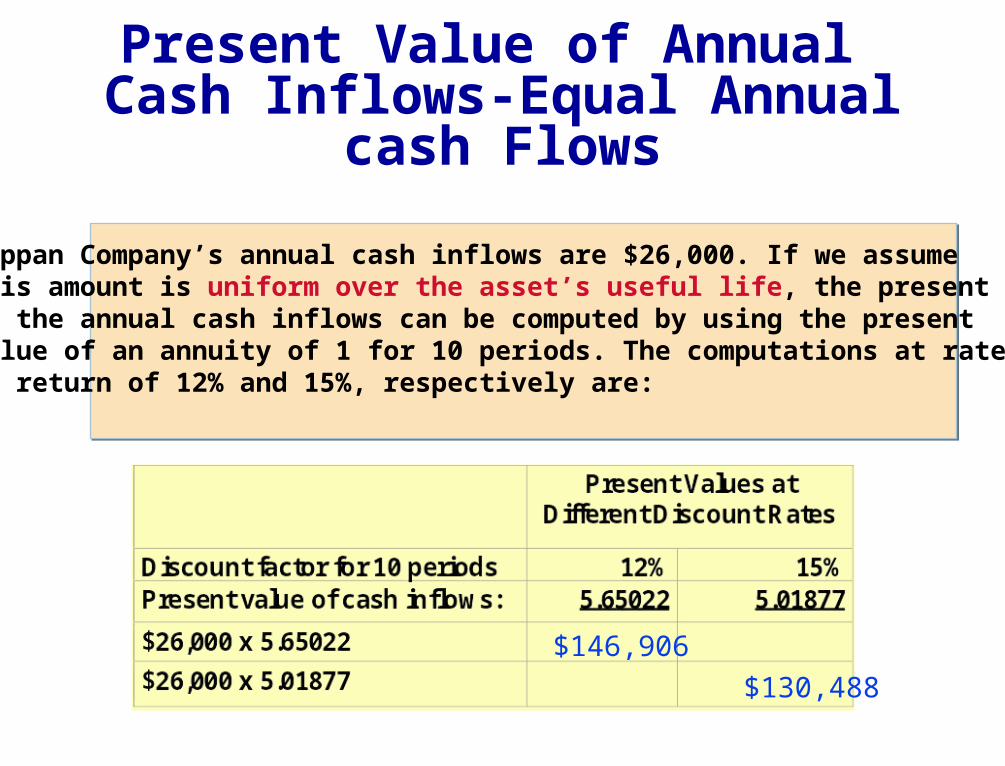
Present Value of Annual Cash Inflows-Equal Annual
cash Flows
$146,906
$130,488
Tappan Company’s annual cash inflows are $26,000. If we assumethis amount is uniform over the asset’s useful life, the present valueof the annual cash inflows can be computed by using the presentvalue of an annuity of 1 for 10 periods. The computations at ratesof return of 12% and 15%, respectively are:
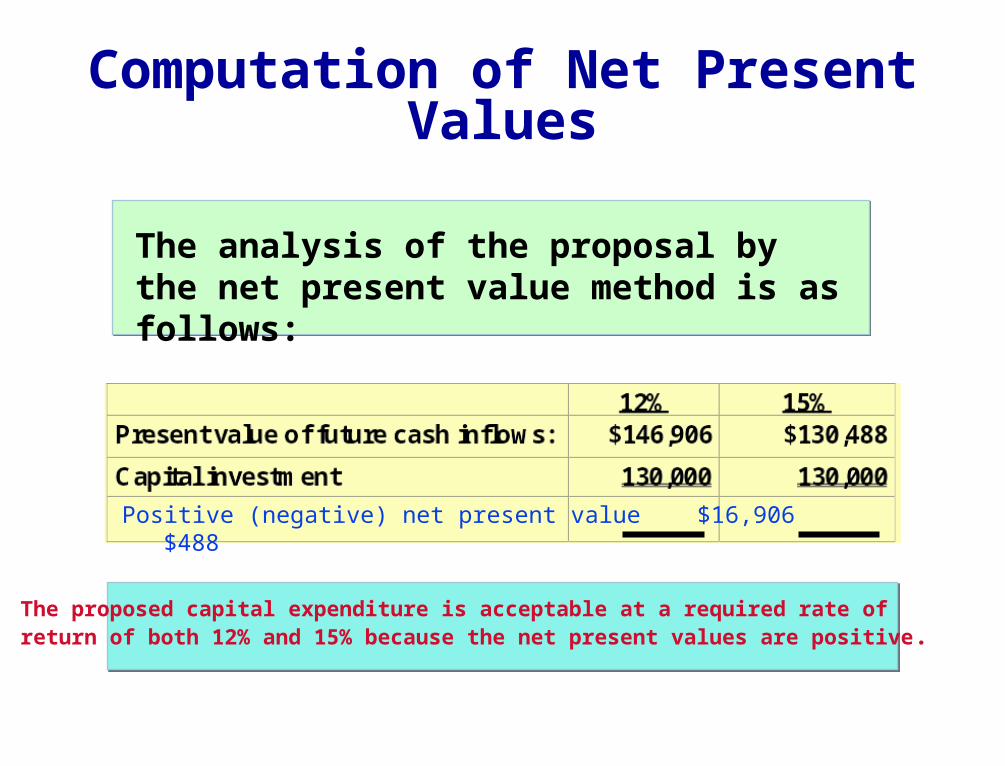
Computation of Net Present Values
Positive (negative) net present value $16,906 $488
The proposed capital expenditure is acceptable at a required rate of return of both 12% and 15% because the net present values are positive.
The analysis of the proposal by the net present value method is as follows:
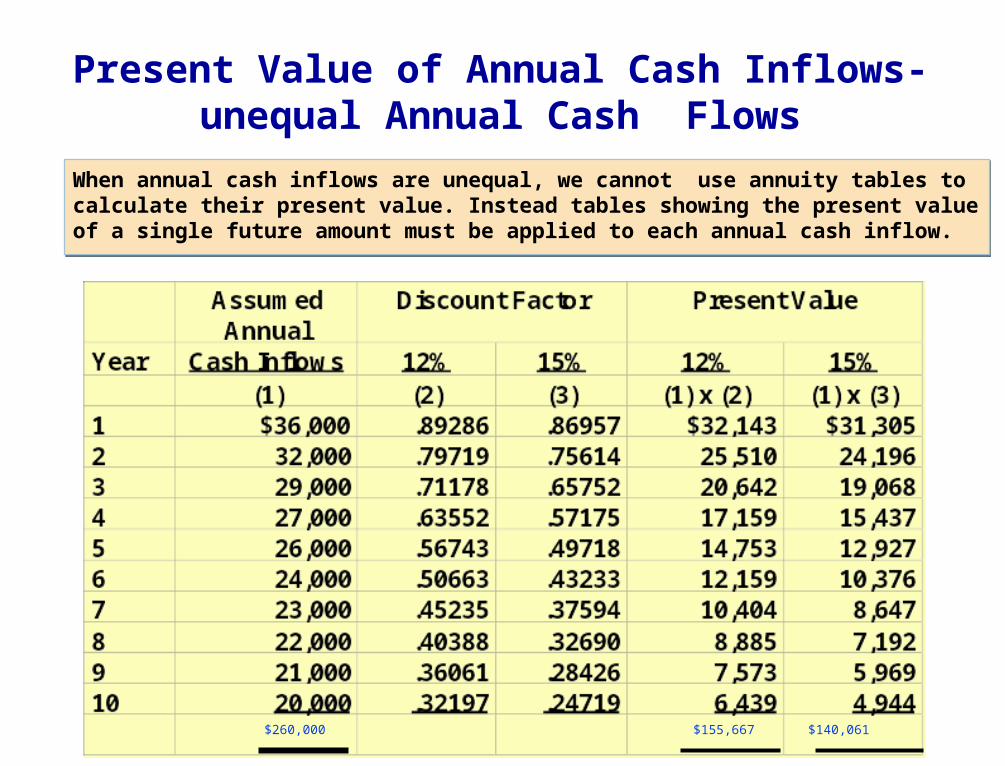
Present Value of Annual Cash Inflows-unequal Annual Cash Flows
When annual cash inflows are unequal, we cannot use annuity tables to calculate their present value. Instead tables showing the present value of a single future amount must be applied to each annual cash inflow.
$260,000 $155,667 $140,061
Analysis of Proposal Using Net Present Value Method
Positive (negative) net present value $ 25,667 $10,061
Therefore, the analysis of the proposal by the net present value method is as follows:
In this example, the present values of the cash inflowsare greater than the $130,000 capital investment. Thusthe project is acceptable at both a 12% and 15%required rate of return.
Formula for Internal Rate of Return Factor
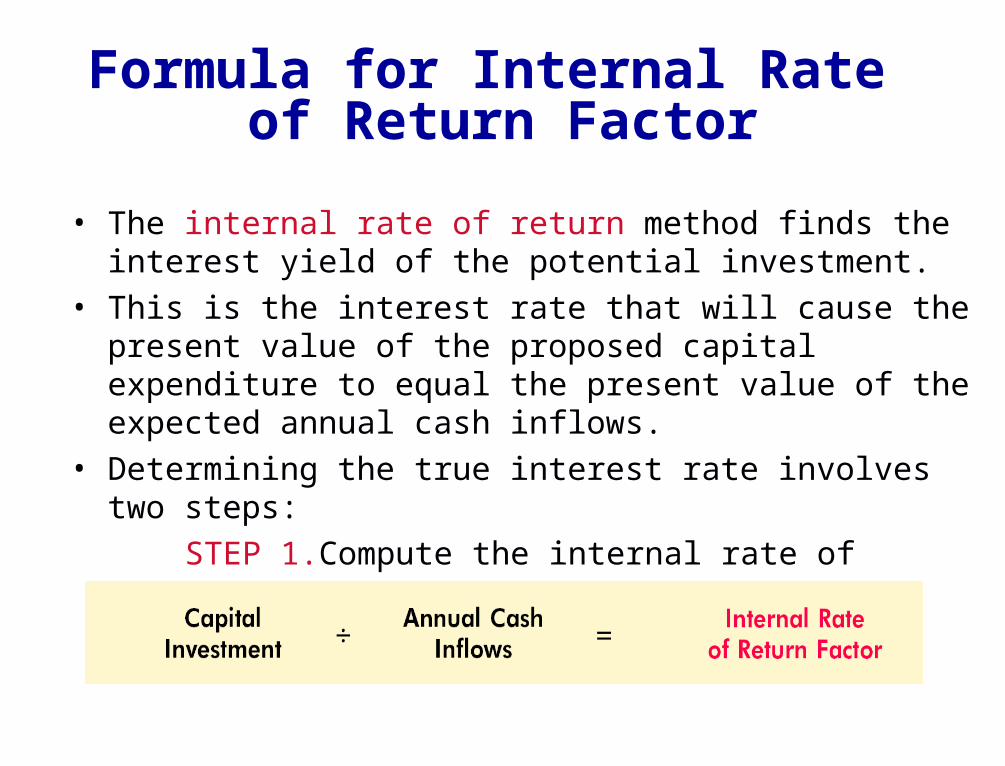
• The internal rate of return method finds the interest yield of the potential investment.
• This is the interest rate that will cause the present value of the proposed capital expenditure to equal the present value of the expected annual cash inflows.
• Determining the true interest rate involves two steps:
STEP 1.Compute the internal rate of return factor using this formula:
Internal Rate of Return Method
$130,000 / $26,000 = 5.0
The computation for the Tappan Company,assuming equal annual cash inflows is:
Internal Rate of Return Method
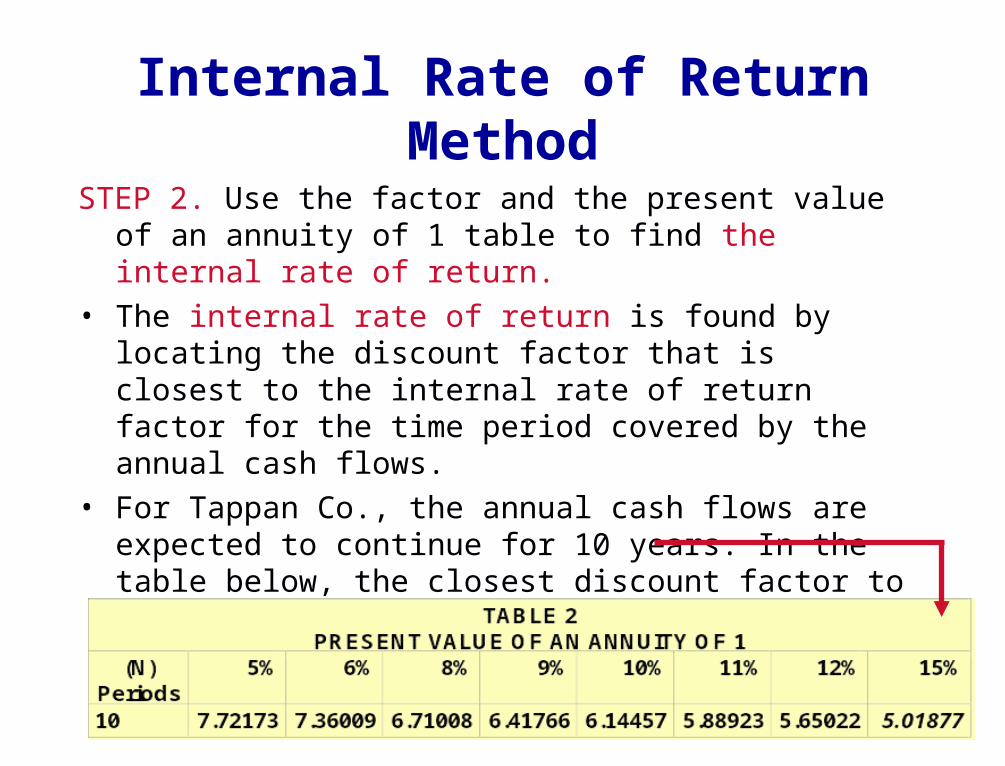
STEP 2. Use the factor and the present value of an annuity of 1 table to find the internal rate of return.
• The internal rate of return is found by locating the discount factor that is closest to the internal rate of return factor for the time period covered by the annual cash flows.
• For Tappan Co., the annual cash flows are expected to continue for 10 years. In the table below, the closest discount factor to 5.0 is 5.01877, which represents an interest rate of approximately 15%.
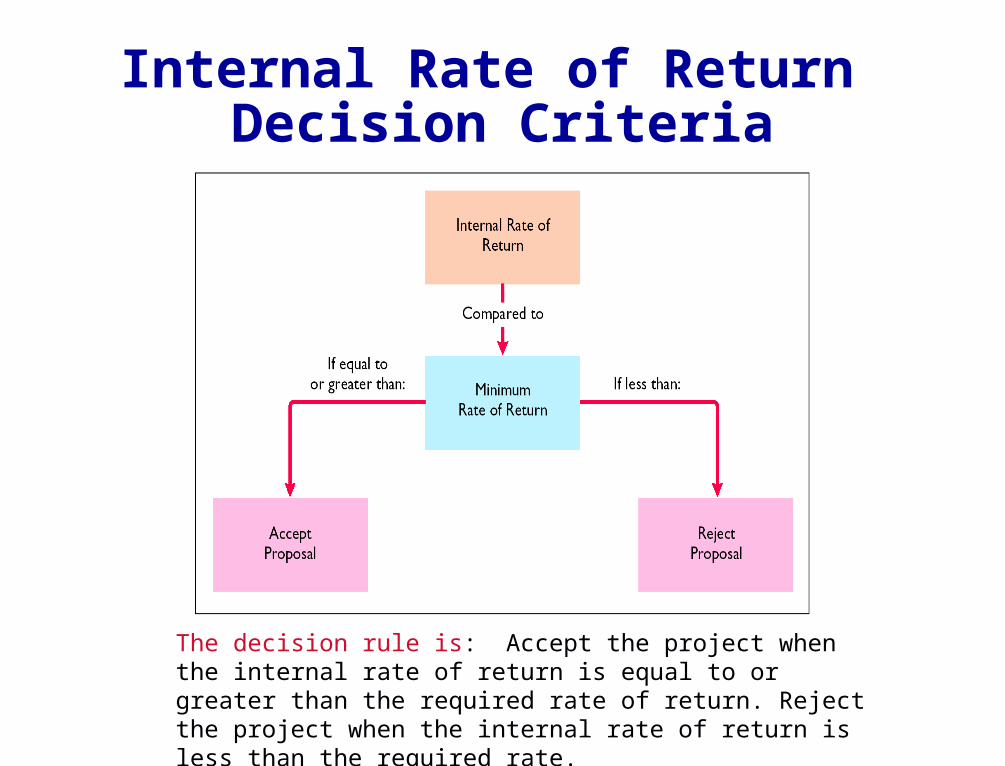
Internal Rate of Return Decision Criteria
The decision rule is: Accept the project when the internal rate of return is equal to or greater than the required rate of return. Reject the project when the internal rate of return is less than the required rate.
Comparison of Discounted Cash Flow Methods
• In practice, the internal rate of return and cash payback methods are most widely used.
• A comparative summary of the two discounted cash flow methods-net present value and internal rate of return- is presented below:
If the contribution margin per unit is $15 and it takes 3.0 machine hours to produce theunit, the contribution margin per unit of limited resource is:
a. $25.
b. $5.
c. $45.
d. No correct answer is given.
If the contribution margin per unit is $15 and it takes 3.0 machine hours to produce theunit, the contribution margin per unit of limited resource is: