SUN PHARMACEUTICAL INDUSTRIES LIMITED 170 TO THE MEMBERS OF SUN PHARMACEUTICAL INDUSTRIES LIMITED Report on the Consolidated Ind AS Financial Statements We have audited the accompanying consolidated Ind AS financial statements of Sun Pharmaceucal Industries Limited (hereinaſter referred to as "the Parent") and its subsidiaries (the Parent and its subsidiaries together referred to as "the Group"), its associates and its joint ventures, comprising the Consolidated Balance Sheet as at 31st March, 2017, the Consolidated Statement of Profit and Loss including other comprehensive income, the Consolidated Cash Flow Statement, the Consolidated Statement of Changes in Equity, for the year then ended, and a summary of the significant accounng policies and other explanatory informaon (hereinaſter referred to as "the consolidated Ind AS financial statements"). Management's Responsibility for the Consolidated Ind AS Financial Statements The Parent's Board of Directors is responsible for the preparaon of these consolidated Ind AS financial statements in terms of the requirements of the Companies Act, 2013 (hereinaſter referred to as "the Act") that give a true and fair view of the consolidated financial posion, consolidated financial performance including other comprehensive income, consolidated cash flows and statement of changes in equity of the Group including its associates and its joint ventures in accordance with the accounng principles generally accepted in India, including the Indian Accounng Standards (Ind AS) prescribed under Secon 133 of the Act. The respecve Board of Directors of the companies included in the Group and of its associates and of its joint ventures are responsible for maintenance of adequate accounng records in accordance with the provisions of the Act for safeguarding the assets of the Group and its associates and its joint ventures and for prevenng and detecng frauds and other irregularies; the selecon and applicaon of appropriate accounng policies; making judgments and esmates that are reasonable and prudent; and the design, implementaon and maintenance of adequate internal financial controls, that were operang effecvely for ensuring the accuracy and completeness of the accounng records, relevant to the preparaon and presentaon of the financial statements that give a true and fair view and are free from material misstatement, whether due to fraud or error, which have been used for the purpose of preparaon of the consolidated Ind AS financial statements by the Directors of the Parent, as aforesaid. Auditor's Responsibility Our responsibility is to express an opinion on these consolidated Ind AS financial statements based on our audit. In conducng our audit, we have taken into account the provisions of the Act, the accounng and auding standards and maers which are required to be included in the audit report under the provisions of the Act and the Rules made thereunder. We conducted our audit in accordance with the Standards on Auding specified under Secon 143(10) of the Act. Those Standards require that we comply with ethical requirements and plan and perform the audit to obtain reasonable assurance about whether the consolidated Ind AS financial statements are free from material misstatement. An audit involves performing procedures to obtain audit evidence about the amounts and the disclosures in the consolidated Ind AS financial statements. The procedures selected depend on the auditor's judgment, including the assessment of the risks of material misstatement of the consolidated Ind AS financial statements, whether due to fraud or error. In making those risk assessments, the auditor considers internal financial control relevant to the Parent's preparaon of the consolidated Ind AS financial statements that give a true and fair view in order to design audit procedures that are appropriate in the circumstances. An audit also includes evaluang the appropriateness of the accounng policies used and the reasonableness of the accounng esmates made by the Parent's Board of Directors, as well as evaluang the overall presentaon of the consolidated Ind AS financial statements. We believe that the audit evidence obtained by us and the audit evidence obtained by the other auditors in terms of their reports referred to in sub-paragraph (a) of the Other Maers paragraph below, is sufficient and appropriate to provide a basis for our audit opinion on the consolidated Ind AS financial statements. INDEPENDENT AUDITOR’S REPORT
Transcript
SUN PHARMACEUTICAL INDUSTRIES L IMITED170
TO THE MEMBERS OF SUN PHARMACEUTICAL INDUSTRIES LIMITED
Report on the Consolidated Ind AS Financial StatementsWe have audited the accompanying consolidated Ind AS financial statements of Sun Pharmaceutical Industries Limited (hereinafter referred to as "the Parent") and its subsidiaries (the Parent and its subsidiaries together referred to as "the Group"), its associates and its joint ventures, comprising the Consolidated Balance Sheet as at 31st March, 2017, the Consolidated Statement of Profit and Loss including other comprehensive income, the Consolidated Cash Flow Statement, the Consolidated Statement of Changes in Equity, for the year then ended, and a summary of the significant accounting policies and other explanatory information (hereinafter referred to as "the consolidated Ind AS financial statements").
Management's Responsibility for the Consolidated Ind AS Financial StatementsThe Parent's Board of Directors is responsible for the preparation of these consolidated Ind AS financial statements in terms of the requirements of the Companies Act, 2013 (hereinafter referred to as "the Act") that give a true and fair view of the consolidated financial position, consolidated financial performance including other comprehensive income, consolidated cash flows and statement of changes in equity of the Group including its associates and its joint ventures in accordance with the accounting principles generally accepted in India, including the Indian Accounting Standards (Ind AS) prescribed under Section 133 of the Act. The respective Board of Directors of the companies included in the Group and of its associates and of its joint ventures are responsible for maintenance of adequate accounting records in accordance with the provisions of the Act for safeguarding the assets of the Group and its associates and its joint ventures and for preventing and detecting frauds and other irregularities; the selection and application of appropriate accounting policies; making judgments and estimates that are reasonable and prudent; and the design, implementation and maintenance of adequate internal financial controls, that were operating effectively for ensuring the accuracy and completeness of the accounting records, relevant to the preparation and presentation of the financial statements that give a true and fair view and are free from material misstatement, whether due to fraud or error, which have been used for the purpose of preparation of the consolidated Ind AS financial statements by the Directors of the Parent, as aforesaid.
Auditor's ResponsibilityOur responsibility is to express an opinion on these consolidated Ind AS financial statements based on our audit. In conducting our audit, we have taken into account the provisions of the Act, the accounting and auditing standards and matters which are required to be included in the audit report under the provisions of the Act and the Rules made thereunder.
We conducted our audit in accordance with the Standards on Auditing specified under Section 143(10) of the Act. Those Standards require that we comply with ethical requirements and plan and perform the audit to obtain reasonable assurance about whether the consolidated Ind AS financial statements are free from material misstatement.
An audit involves performing procedures to obtain audit evidence about the amounts and the disclosures in the consolidated Ind AS financial statements. The procedures selected depend on the auditor's judgment, including the assessment of the risks of material misstatement of the consolidated Ind AS financial statements, whether due to fraud or error. In making those risk assessments, the auditor considers internal financial control relevant to the Parent's preparation of the consolidated Ind AS financial statements that give a true and fair view in order to design audit procedures that are appropriate in the circumstances. An audit also includes evaluating the appropriateness of the accounting policies used and the reasonableness of the accounting estimates made by the Parent's Board of Directors, as well as evaluating the overall presentation of the consolidated Ind AS financial statements.
We believe that the audit evidence obtained by us and the audit evidence obtained by the other auditors in terms of their reports referred to in sub-paragraph (a) of the Other Matters paragraph below, is sufficient and appropriate to provide a basis for our audit opinion on the consolidated Ind AS financial statements.
OpinionIn our opinion and to the best of our information and according to the explanations given to us and based on the consideration of reports of the other auditors on separate financial statements/ financial information of the subsidiaries, associates and joint ventures referred to below in the Other Matters paragraph, the aforesaid consolidated Ind AS financial statements give the information required by the Act in the manner so required and give a true and fair view in conformity with the accounting principles generally accepted in India, of the consolidated state of affairs of the Group, its associates and its joint ventures as at 31st March, 2017, and their consolidated profit, consolidated total comprehensive income, consolidated cash flows and consolidated statement of changes in equity for the year ended on that date.
Emphasis of MatterWe draw attention to Note 64 to the consolidated Ind AS financial statements. As referred to in the said Note: Remuneration to the Managing Director and the Whole-time Director(s) of the Parent for the years ended 31st March, 2015, 31st March, 2016 and 31st March, 2017 are higher by ` 49.6 Million, ` 29.6 Million and ` 44.7 Million respectively than the amounts approved by the Central Government of India (Ministry of Corporate Affairs) on applications made by the Parent to approve the maximum remuneration as approved by the members of the Parent for the three years ended 31st March, 2017, in excess of the limits specified under Schedule V to the Act, in case of inadequacy of profits. The Management of the Parent have re-represented to the office of the Ministry of Corporate Affairs for approval of remuneration within the overall limits approved by the members of the Parent for the years ended 31st March, 2015 and 31st March, 2016, and for the year ended 31st March, 2017, applications for revision in the remuneration, as approved by the members of the Parent, has been made to the Ministry of Corporate Affairs. The responses in respect of the foregoing re-representation / applications for revision are awaited from the Ministry of Corporate Affairs.
Our opinion is not modified in respect of this matter.Other Matters(a) We did not audit the financial statements / financial information of 79 subsidiaries, whose financial statements / financial information
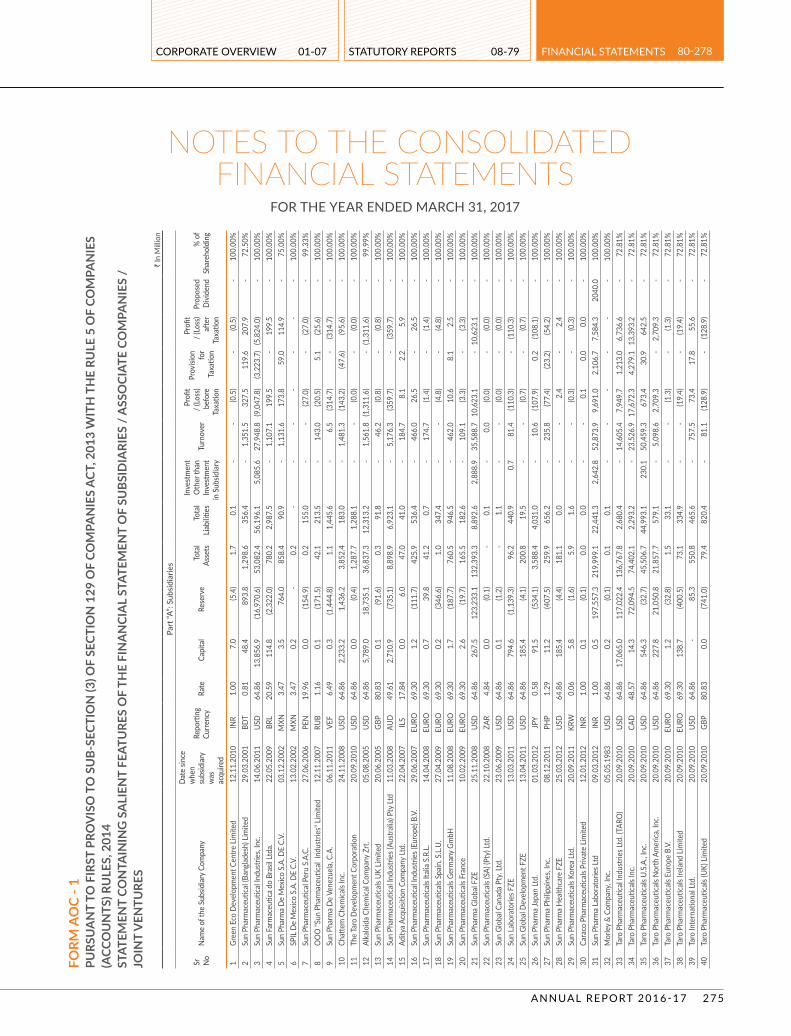
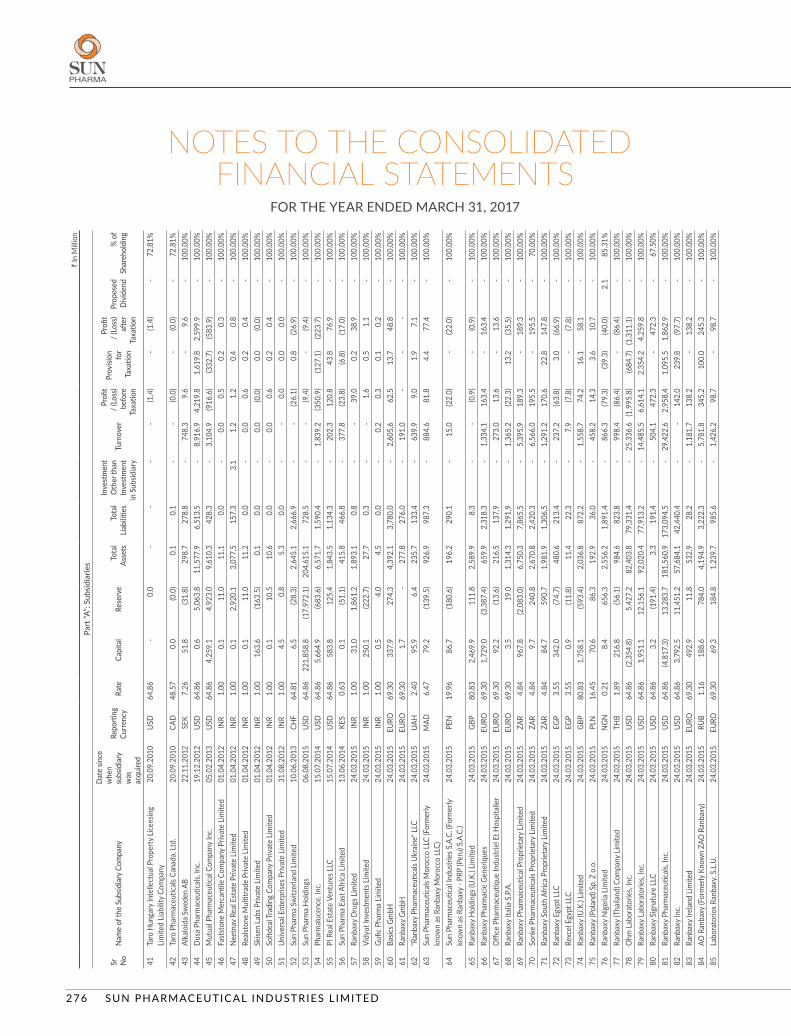
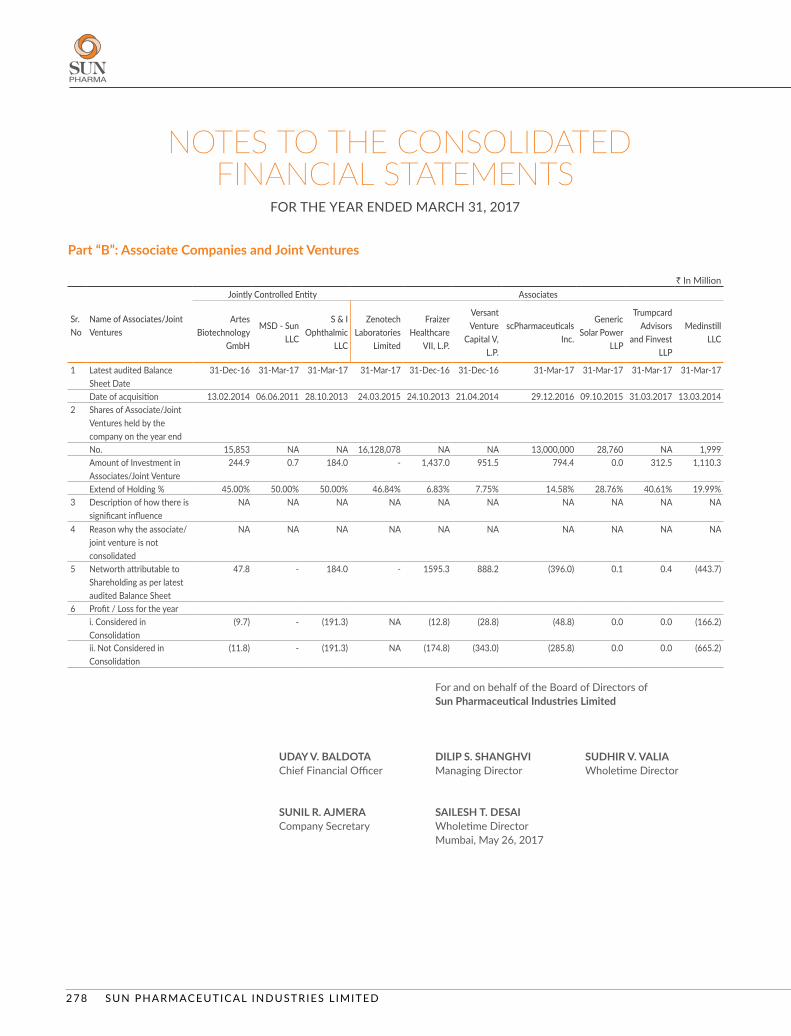
reflect total assets of ` 561,913.2 Million as at 31st March, 2017, total revenues of ` 242,491.8 Million and net cash inflows amounting to ` 6,209.1 Million for the year ended on that date, as considered in the consolidated Ind AS financial statements. The consolidated Ind AS financial statements also include the Group's share of net profit of ` 99.3 Million for the year ended 31st March, 2017, as considered in the consolidated Ind AS financial statements, in respect of 5 associates and 2 joint ventures, whose financial statements / financial information have not been audited by us. The above figures are before giving effect to consolidation adjustments.
These financial statements / financial information have been audited by other auditors whose reports have been furnished to us and our opinion on the consolidated Ind AS financial statements, in so far as it relates to the amounts and disclosures included in respect of these subsidiaries, associates and joint ventures, and our report in terms of sub-section (3) of Section 143 of the Act, in so far as it relates to the aforesaid subsidiaries, associates and joint ventures is based solely on the reports of the other auditors.
(b) We did not audit the financial statements / financial information of 31 subsidiaries, whose financial statements / financial information reflect total assets of ` 248,997.4 Million as at 31st March, 2017, total revenues of ` 12,831.5 Million and net cash outflows amounting to ` 231.1 Million for the year ended on that date, as considered in the consolidated Ind AS financial statements. The above figures are before giving effect to consolidation adjustments. The consolidated Ind AS financial statements also include the Group's share of profit after tax of ` Nil for the year ended 31st March, 2017, as considered in the consolidated Ind AS financial statements, in respect of 3 associates and 2 joint ventures, whose financial statements / financial information have not been audited.
These financial statements / financial information are unaudited and have been furnished to us by the Management of the Parent and our opinion on the consolidated Ind AS financial statements, in so far as it relates to the amounts and disclosures included in respect of these subsidiaries, associates and joint ventures, is based solely on such unaudited financial statements / financial information. In our opinion and according to the information and explanations given to us by the Management of the Parent, these financial statements / financial information are not material to the Group.
SUN PHARMACEUTICAL INDUSTRIES L IMITED172
(c) The comparative financial information for the year ended 31st March, 2016 and the transition date opening balance sheet as at 1st April, 2015 in respect of 71 subsidiaries, 4 associates and 2 joint ventures included in this consolidated Ind AS financial statements prepared in accordance with the Ind AS have been audited by other auditors and have been relied upon by us.
(d) The transition date opening balance sheet of the Parent as at 1st April, 2015 include the financial information of erstwhile Ranbaxy Laboratories Limited, consequent to its amalgamation into the Parent which was effected on 24th March, 2015, with the appointed date of 1st April, 2014 [refer Note 66 to the consolidated Ind AS financial statements]. The said financial information included in these consolidated Ind AS financial statements are based on financial information previously prepared in accordance with the Companies (Accounting Standards) Rules, 2006, audited by the other auditors, and have been restated to comply with Ind AS. Adjustments made to the financial information previously prepared in accordance with the Companies (Accounting Standards) Rules, 2006 to comply with Ind AS have been audited by us.
Our opinion on the consolidated Ind AS financial statements above, and our report on Other Legal and Regulatory Requirements below, is not modified in respect of the above matters with respect to our reliance on the work done and the reports of the other auditors and the financial statements / financial information certified by the Management of the Parent.
Report on Other Legal and Regulatory RequirementsAs required by Section 143(3) of the Act, based on our audit and on the consideration of the reports of the other auditors on separate financial statements and the other financial information of subsidiaries, associates and joint venture companies, referred in the Other Matters paragraph above, we report, to the extent applicable, that:
(a) We have sought and obtained all the information and explanations which to the best of our knowledge and belief were necessary for the purposes of our audit of the aforesaid consolidated Ind AS financial statements.
(b) In our opinion, proper books of account as required by law relating to preparation of the aforesaid consolidated Ind AS financial statements have been kept so far as it appears from our examination of those books and the reports of the other auditors.
(c) The Consolidated Balance Sheet, the Consolidated Statement of Profit and Loss (including Other Comprehensive Income), the Consolidated Cash Flow Statement and the Consolidated Statement of Changes in Equity dealt with by this report are in agreement with the relevant books of account maintained for the purpose of preparation of the consolidated Ind AS financial statements.
(d) In our opinion, the aforesaid consolidated Ind AS financial statements comply with the Indian Accounting Standards prescribed under Section 133 of the Act.
(e) On the basis of the written representations received from the directors of the Parent as on 31st March, 2017 taken on record by the Board of Directors of the Parent and the reports of the statutory auditors of its subsidiary companies and an associate company, incorporated in India, none of the directors of the Group companies and its associate company incorporated in India is disqualified as on 31st March, 2017 from being appointed as a director in terms of Section 164 (2) of the Act.
(f) With respect to the adequacy of the internal financial controls over financial reporting and the operating effectiveness of such controls, refer to our separate Report in “Annexure A”, which is based on the auditors’ reports of the Parent, subsidiary companies and an associate company, incorporated in India. Our report expresses an unmodified opinion on the adequacy and operating effectiveness of the internal financial controls over financial reporting of the Parent, subsidiary companies and an associate company, incorporated in India.
(g) With respect to the other matters to be included in the Auditor's Report in accordance with Rule 11 of the Companies (Audit and Auditor's) Rules, 2014, as amended, in our opinion and to the best of our information and according to the explanations given to us:
i. The consolidated Ind AS financial statements disclose the impact of pending litigations on the consolidated financial position of the Group, its associates and joint ventures – Refer Note 40A to the consolidated Ind AS financial statements.
ii. Provision has been made in the consolidated Ind AS financial statements, as required under the applicable law or accounting standards, for material foreseeable losses, if any, on long-term contracts including derivative contracts - Refer Notes 23 and 29 to the consolidated Ind AS financial statements in respect of such items as it relates to the Group. The associates and jointly ventures did not have any long-term contracts including derivative contracts.
iii. There has been no delay in transferring amounts required to be transferred, to the Investor Education and Protection Fund by the Parent and its subsidiary companies and an associate company, incorporated in India, except a sum of ` 13.4 Million, which is held in abeyance by the Parent due to pending legal cases.
iv. The Parent has provided requisite disclosures in Note 71 to the consolidated Ind AS financial statements as regards the holding and dealings in Specified Bank Notes as defined in the Notification S.O. 3407(E) dated 8th November, 2016 of the Ministry of Finance, during the period from 8th November, 2016 to 30th December, 2016 in respect of the Parent, subsidiaries and an associate, incorporated in India. Based on the audit procedures performed, the representations provided to us by the Management of the Parent and based on the consideration of reports of the other auditors, referred to in the Other Matters paragraph above, we report that the disclosures are in accordance with the relevant books of accounts maintained by the Parent, subsidiaries and an associate, incorporated in India, for the purpose of preparation of the consolidated Ind AS financial statements.
For DELOITTE HASKINS & SELLS LLP Chartered Accountants
(Firm’s Registration No. 117366W/W-100018)
RAJESH K. HIRANANDANI Place: Mumbai Partner Date: 26th May, 2017 (Membership No. 36920)
INDEPENDENT AUDITOR’S REPORT
SUN PHARMACEUTICAL INDUSTRIES L IMITED174
In conjunction with our audit of the consolidated Ind AS financial statements of the Company as of and for the year ended 31st March, 2017, we have audited the internal financial controls over financial reporting of SUN PHARMACEUTICAL INDUSTRIES LIMITED (hereinafter referred to as “the Parent”) and its subsidiary companies and its associate company, which are companies incorporated in India, as of that date.
Management’s Responsibility for Internal Financial ControlsThe respective Board of Directors of the Parent, its subsidiary companies and its associate company, which are companies incorporated in India, are responsible for establishing and maintaining internal financial controls based on the internal control over financial reporting criteria established by the respective Companies considering the essential components of internal control stated in the Guidance Note on Audit of Internal Financial Controls Over Financial Reporting issued by the Institute of Chartered Accountants of India. These responsibilities include the design, implementation and maintenance of adequate internal financial controls that were operating effectively for ensuring the orderly and efficient conduct of its business, including adherence to the respective company’s policies, the safeguarding of its assets, the prevention and detection of frauds and errors, the accuracy and completeness of the accounting records, and the timely preparation of reliable financial information, as required under the Act.
Auditor’s ResponsibilityOur responsibility is to express an opinion on the internal financial controls over financial reporting of the Parent, its subsidiary companies and its associate company, which are companies incorporated in India, based on our audit. We conducted our audit in accordance with the Guidance Note on Audit of Internal Financial Controls Over Financial Reporting issued by the Institute of Chartered Accountants of India and the Standards on Auditing, prescribed under Section 143(10) of the Act, to the extent applicable to an audit of internal financial controls. Those Standards and the Guidance Note require that we comply with ethical requirements and plan and perform the audit to obtain reasonable assurance about whether adequate internal financial controls over financial reporting was established and maintained and if such controls operated effectively in all material respects.
Our audit involves performing procedures to obtain audit evidence about the adequacy of the internal financial controls system over financial reporting and their operating effectiveness. Our audit of internal financial controls over financial reporting included obtaining an understanding of internal financial controls over financial reporting, assessing the risk that a material weakness exists, and testing and evaluating the design and operating effectiveness of internal control based on the assessed risk. The procedures selected depend on the auditor’s judgement, including the assessment of the risks of material misstatement of the financial statements, whether due to fraud or error.
We believe that the audit evidence we have obtained and the audit evidence obtained by the other auditors of the subsidiary companies and the associate company, which are companies incorporated in India, in terms of their reports referred to in the Other Matter paragraph below, is sufficient and appropriate to provide a basis for our audit opinion on the internal financial controls system over financial reporting of the Parent, its subsidiary companies and its associate company, which are companies incorporated in India.
Meaning of Internal Financial Controls Over Financial ReportingA company's internal financial control over financial reporting is a process designed to provide reasonable assurance regarding the reliability of financial reporting and the preparation of financial statements for external purposes in accordance with generally accepted accounting principles. A company's internal financial control over financial reporting includes those policies and procedures that (1) pertain to the maintenance of records that, in reasonable detail, accurately and fairly reflect the transactions and dispositions of the assets of the company; (2) provide reasonable assurance that transactions are recorded as necessary to permit preparation of financial statements in accordance with generally accepted accounting principles, and that receipts and expenditures of the company are being made only in accordance with authorisations of management and directors of the company; and (3) provide reasonable assurance regarding prevention or timely detection of unauthorised acquisition, use, or disposition of the company's assets that could have a material effect on the financial statements.
ANNEXURE “A” TO THE INDEPENDENT AUDITOR’S REPORT
(Referred to in paragraph (f) under ‘Report on Other Legal and Regulatory Requirements’ section of our report of even date to the Members of Sun Pharmaceutical Industries Limited)
Report on Internal Financial Controls Over Financial Reporting Under Clause (I) of Sub-section 3 of section 143 of the Companies Act, 2013 ( “the Act”)
Inherent Limitations of Internal Financial Controls Over Financial ReportingBecause of the inherent limitations of internal financial controls over financial reporting, including the possibility of collusion or improper management override of controls, material misstatements due to error or fraud may occur and not be detected. Also, projections of any evaluation of the internal financial controls over financial reporting to future periods are subject to the risk that the internal financial control over financial reporting may become inadequate because of changes in conditions, or that the degree of compliance with the policies or procedures may deteriorate.
OpinionIn our opinion to the best of our information and according to the explanations given to us and based on the consideration of the reports of the other auditors referred to in the Other Matter paragraph below, the Parent, its subsidiary companies and its associate company, which are companies incorporated in India, have, in all material respects, an adequate internal financial controls system over financial reporting and such internal financial controls over financial reporting were operating effectively as at 31st March, 2017, based on the internal control over financial reporting criteria established by the respective companies considering the essential components of internal control stated in the Guidance Note on Audit of Internal Financial Controls Over Financial Reporting issued by the Institute of Chartered Accountants of India.
Other MatterOur aforesaid report under Section 143(3)(i) of the Act on the adequacy and operating effectiveness of the internal financial controls over financial reporting insofar as it relates to 14 subsidiary companies (excluding a subsidiary company under liquidation) and an associate company, which are companies incorporated in India, is based solely on the reports of the auditors of such companies incorporated in India.
Our opinion is not modified in respect of this matter.
For DELOITTE HASKINS & SELLS LLP Chartered Accountants
(Firm’s Registration No. 117366W/W-100018)
RAJESH K. HIRANANDANI Place: Mumbai Partner Date: 26th May, 2017 (Membership No. 36920)
ANNEXURE “A” TO THE INDEPENDENT AUDITOR’S REPORT
(Referred to in paragraph (f) under ‘Report on Other Legal and Regulatory Requirements’ section of our report of even date to the Members of Sun Pharmaceutical Industries Limited)
Report on Internal Financial Controls Over Financial Reporting Under Clause (I) of Sub-section 3 of section 143 of the Companies Act, 2013 ( “the Act”)
SUN PHARMACEUTICAL INDUSTRIES L IMITED176
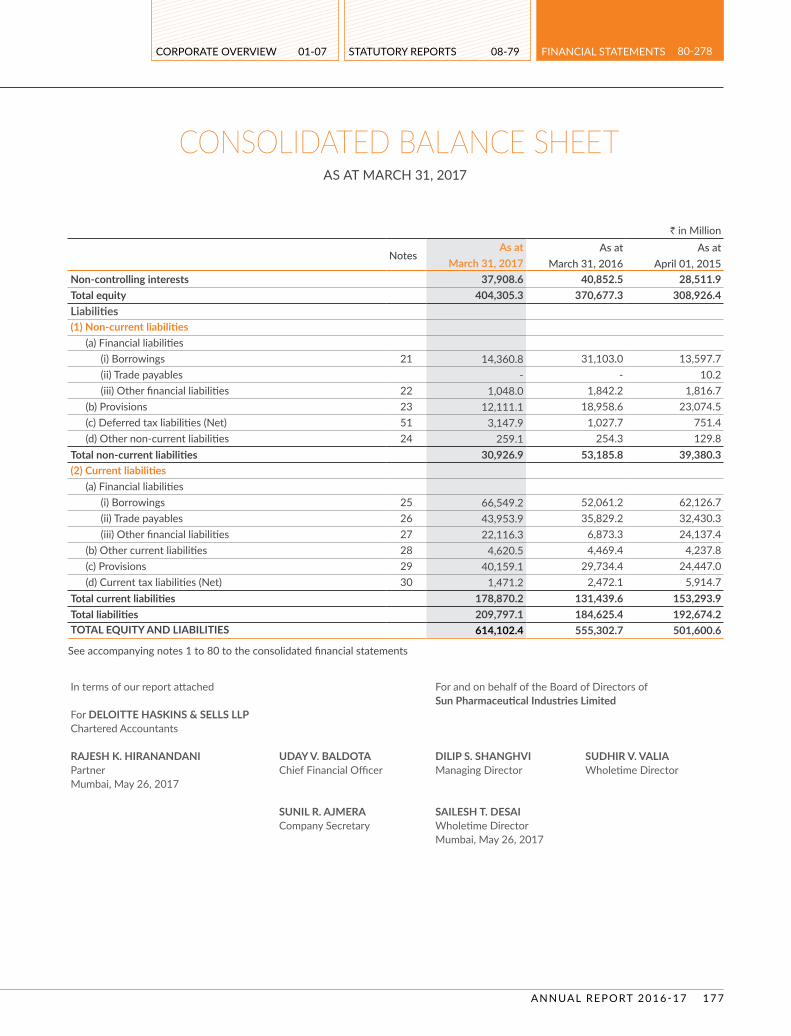
CONSOLIDATED BALANCE SHEET AS AT MARCH 31, 2017
` in Million
Notes As at As at As at
March 31, 2017 March 31, 2016 April 01, 2015ASSETS(1) Non-current assets
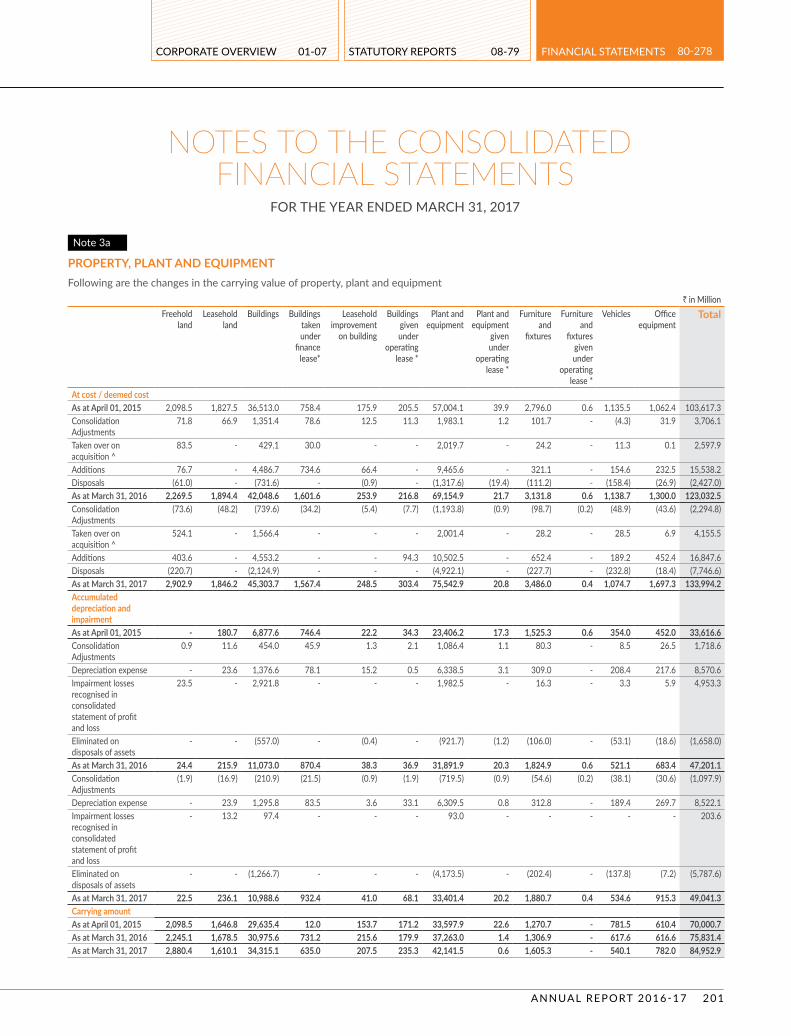
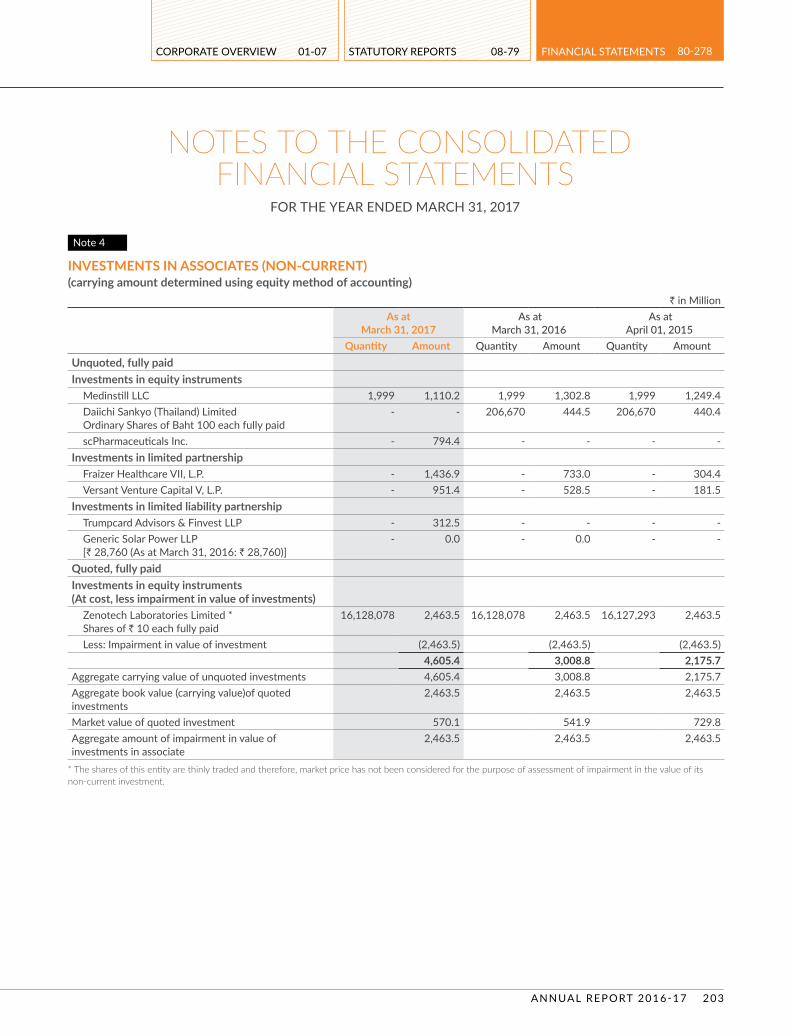
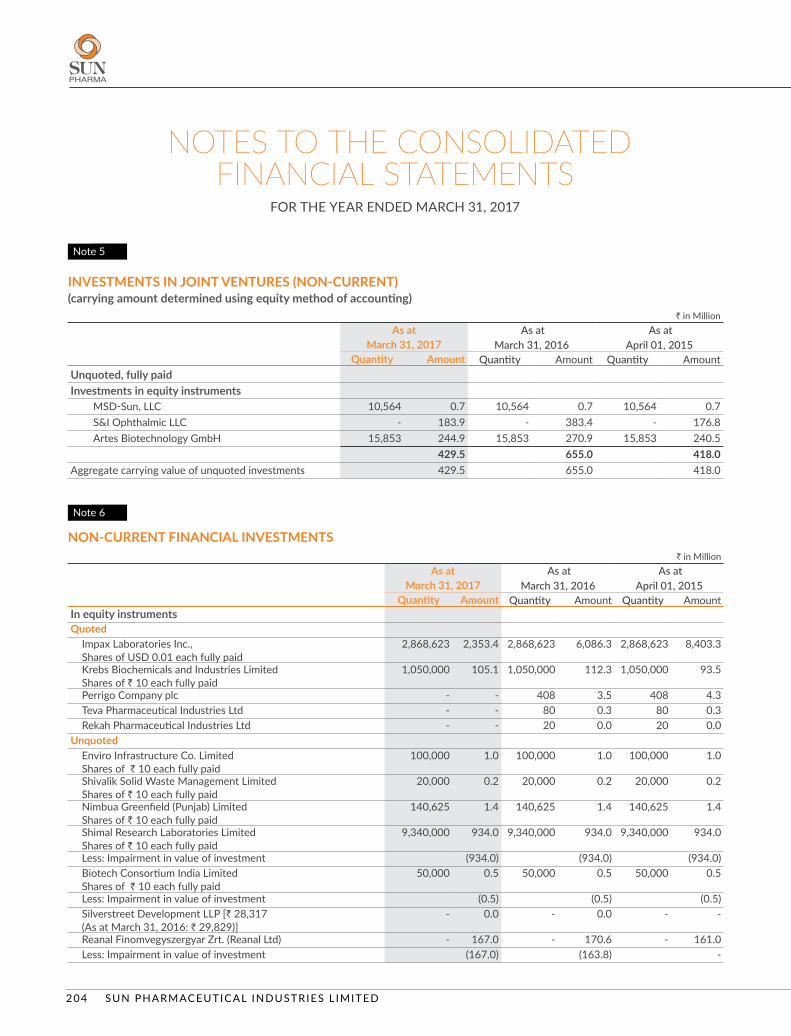
(a) Property, plant and equipment 3a 84,952.9 75,831.4 70,000.7 (b) Capital work-in-progress 15,647.6 12,034.6 15,317.7 (c) Goodwill (Net) 48 55,362.2 56,347.4 54,845.9 (d) Other intangible assets 3b 36,436.6 26,543.7 6,461.3 (e) Intangible assets under development 12,366.2 9,719.9 5,068.4 (f) Investments in associates 4 4,605.4 3,008.8 2,175.7 (g) Investments in joint ventures 5 429.5 655.0 418.0 (h) Financial assets
(i) Investments 6 4,575.1 7,496.9 10,772.1 (ii) Loans 7 698.1 1,073.2 1,830.1 (iii) Other financial assets 8 6,452.2 9,809.9 1,583.4
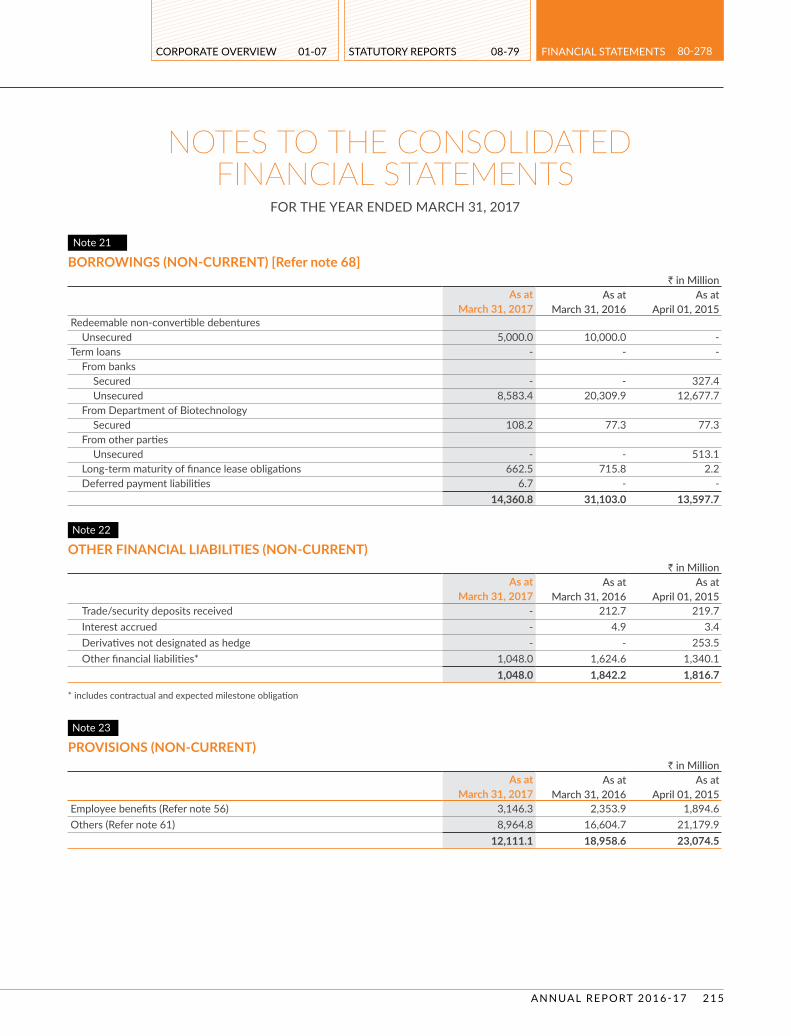
(b) Other current liabilities 28 4,620.5 4,469.4 4,237.8 (c) Provisions 29 40,159.1 29,734.4 24,447.0 (d) Current tax liabilities (Net) 30 1,471.2 2,472.1 5,914.7
Total current liabilities 178,870.2 131,439.6 153,293.9 Total liabilities 209,797.1 184,625.4 192,674.2 TOTAL EQUITY AND LIABILITIES 614,102.4 555,302.7 501,600.6
See accompanying notes 1 to 80 to the consolidated financial statements
In terms of our report attached For and on behalf of the Board of Directors of Sun Pharmaceutical Industries Limited
For DELOITTE HASKINS & SELLS LLPChartered Accountants
RAJESH K. HIRANANDANI UDAY V. BALDOTA DILIP S. SHANGHVI SUDHIR V. VALIAPartner Chief Financial Officer Managing Director Wholetime DirectorMumbai, May 26, 2017
SUNIL R. AJMERA SAILESH T. DESAICompany Secretary Wholetime Director
Mumbai, May 26, 2017
SUN PHARMACEUTICAL INDUSTRIES L IMITED178
` in Million
Notes Year ended Year ended
March 31, 2017 March 31, 2016(I) Revenue from operations 31 315,784.4 284,870.3 (II) Other income 32 6,231.5 6,582.5 (III) Total income (I + II) 322,015.9 291,452.8 (IV) Expenses
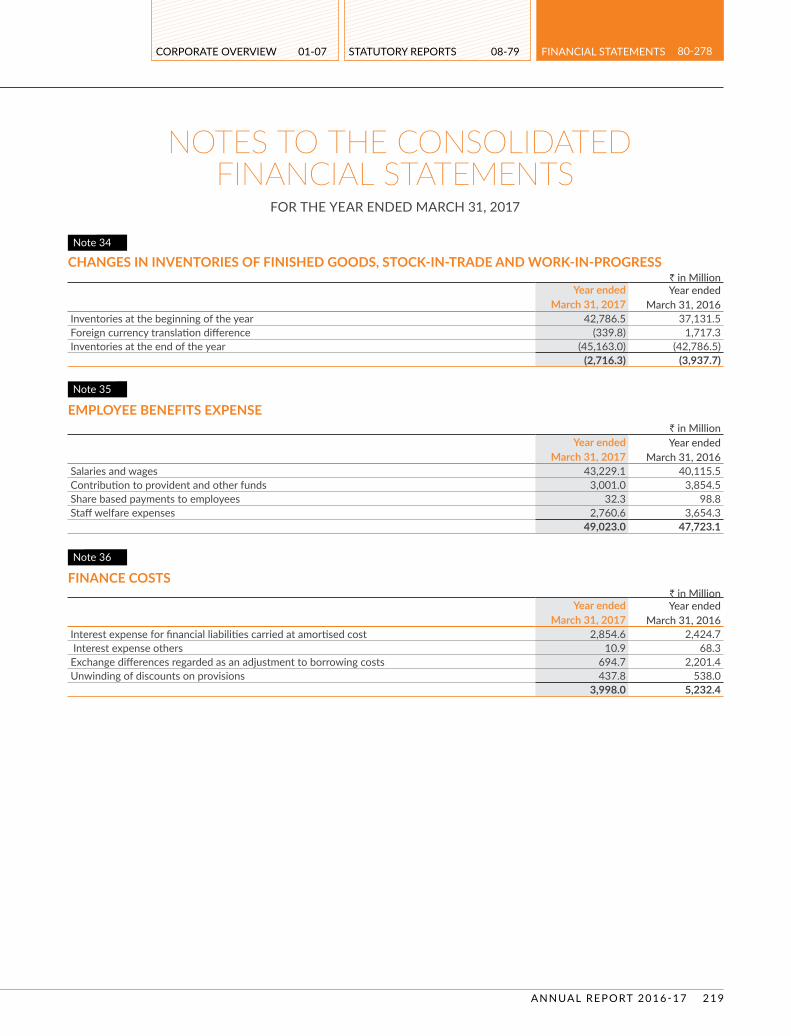
Cost of materials consumed 33 51,246.1 41,816.3 Purchases of stock-in-trade 32,777.6 25,425.2 Changes in inventories of finished goods, stock-in-trade and work-in-progress 34 (2,716.3) (3,937.7)Employee benefits expense 35 49,023.0 47,723.1 Finance costs 36 3,998.0 5,232.4 Depreciation and amortisation expense 3 12,647.5 10,375.3 Other expenses 37 84,561.3 92,260.2
Total expenses (IV) 231,537.2 218,894.8 (V) Profit before exceptional items and tax (III-IV) 90,478.7 72,558.0 (VI) Exceptional items 62 - (6,851.7)(VII) Profit before tax (V+VI) 90,478.7 65,706.3 (VIII) Tax expense
Current tax 4,046.4 11,954.1 Deferred tax charge/(credit) 8,069.3 (2,816.4)
Total tax expense (VIII) 12,115.7 9,137.7 (IX) Profit for the year before share of profit/(loss) of associates and joint ventures (VII-VIII) 78,363.0 56,568.6 (X) Share of profit/(loss) of associates 299.6 (18.7)(XI) Share of profit/(loss) of joint ventures (200.3) 33.2 (XII) Profit for the year before non-controlling interests (IX+X+XI) 78,462.3 56,583.1 (XIII) Non-controlling interests 8,818.6 11,126.0(XIV) Profit for the year attributable to owners of the Company 69,643.7 45,457.1(XV) Other comprehensive income(A) Items that will not be reclassified to profit or loss(a) Remeasurements of the defined benefit plans (766.9) (389.7) Income tax effect relating to remeasurement of the defined benefit plans (56.6) (42.2)
(710.3) (347.5)(b) Equity instruments through other comprehensive income (3,741.4) (2,802.4)Total (A) (4,451.7) (3,149.9)
In terms of our report attached For and on behalf of the Board of Directors of Sun Pharmaceutical Industries Limited
For DELOITTE HASKINS & SELLS LLPChartered Accountants
RAJESH K. HIRANANDANI UDAY V. BALDOTA DILIP S. SHANGHVI SUDHIR V. VALIAPartner Chief Financial Officer Managing Director Wholetime DirectorMumbai, May 26, 2017
SUNIL R. AJMERA SAILESH T. DESAICompany Secretary Wholetime Director
Mumbai, May 26, 2017
` in Million
Notes Year ended Year ended
March 31, 2017 March 31, 2016(B) Items that may be reclassified to profit or loss(a) Debt instruments through other comprehensive income (4.7) 1.3 (b) Effective portion of gains and loss on designated portion of hedging instruments in a
cash flow hedge 46.2 -
(c) Exchange differences in translating the financial statements of a foreign operations (10,461.7) 17,502.0 Total (B) (10,420.2) 17,503.3 (XV) Total other comprehensive income (A+B) (14,871.9) 14,353.4 (XVI) Total comprehensive income for the year (XII+XV) 63,590.4 70,936.5Other Comprehensive Income for the year attributable to:- Owners of the Company (13,337.6) 12,794.5 - Non-controlling interests (1,534.3) 1,558.9Total Comprehensive income for the year attributable to:- Owners of the Company 56,306.1 58,251.6 - Non-controlling interests 7,284.3 12,684.9 Earnings per equity share (face value per equity share - ` 1) 52Basic ( in `) 29.0 18.9 Diluted ( in `) 29.0 18.9
See accompanying notes 1 to 80 to the consolidated financial statements
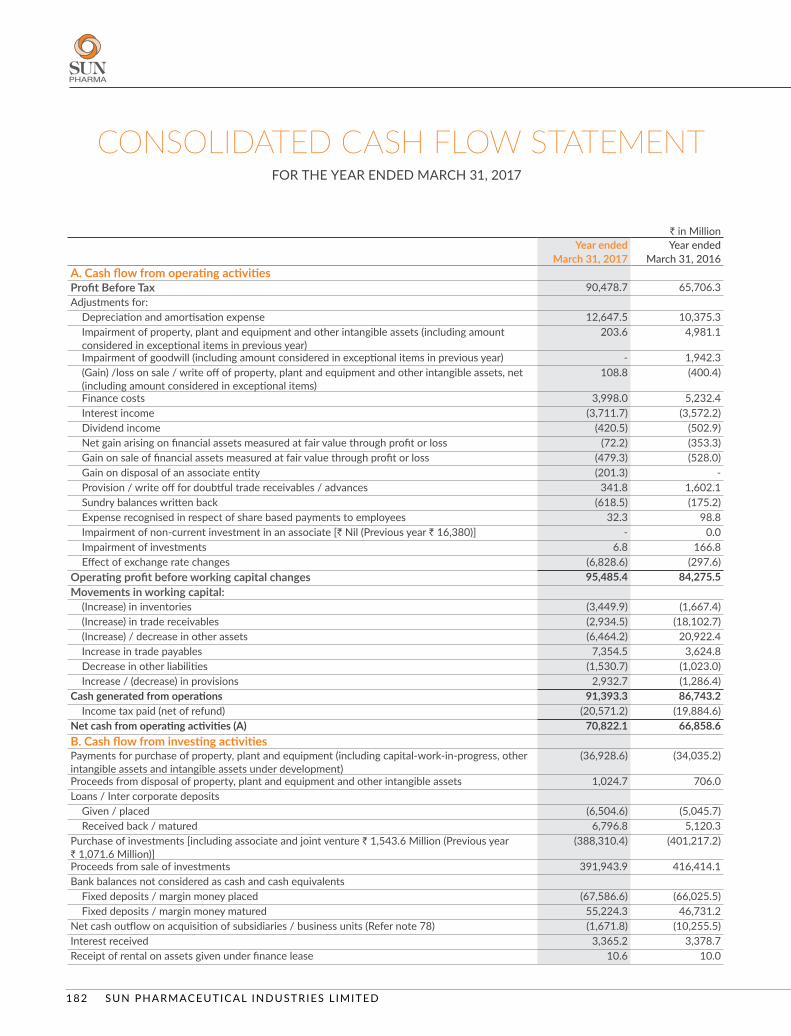
March 31, 2017 March 31, 2016 A. Cash flow from operating activitiesProfit Before Tax 90,478.7 65,706.3 Adjustments for:
Depreciation and amortisation expense 12,647.5 10,375.3 Impairment of property, plant and equipment and other intangible assets (including amount considered in exceptional items in previous year)
203.6 4,981.1
Impairment of goodwill (including amount considered in exceptional items in previous year) - 1,942.3 (Gain) /loss on sale / write off of property, plant and equipment and other intangible assets, net (including amount considered in exceptional items)
108.8 (400.4)
Finance costs 3,998.0 5,232.4 Interest income (3,711.7) (3,572.2)Dividend income (420.5) (502.9)Net gain arising on financial assets measured at fair value through profit or loss (72.2) (353.3)Gain on sale of financial assets measured at fair value through profit or loss (479.3) (528.0)Gain on disposal of an associate entity (201.3) - Provision / write off for doubtful trade receivables / advances 341.8 1,602.1 Sundry balances written back (618.5) (175.2)Expense recognised in respect of share based payments to employees 32.3 98.8 Impairment of non-current investment in an associate [` Nil (Previous year ` 16,380)] - 0.0 Impairment of investments 6.8 166.8 Effect of exchange rate changes (6,828.6) (297.6)
Operating profit before working capital changes 95,485.4 84,275.5 Movements in working capital:
(Increase) in inventories (3,449.9) (1,667.4)(Increase) in trade receivables (2,934.5) (18,102.7)(Increase) / decrease in other assets (6,464.2) 20,922.4 Increase in trade payables 7,354.5 3,624.8 Decrease in other liabilities (1,530.7) (1,023.0)Increase / (decrease) in provisions 2,932.7 (1,286.4)
Cash generated from operations 91,393.3 86,743.2 Income tax paid (net of refund) (20,571.2) (19,884.6)
Net cash from operating activities (A) 70,822.1 66,858.6 B. Cash flow from investing activitiesPayments for purchase of property, plant and equipment (including capital-work-in-progress, other intangible assets and intangible assets under development)
(36,928.6) (34,035.2)
Proceeds from disposal of property, plant and equipment and other intangible assets 1,024.7 706.0 Loans / Inter corporate deposits
Given / placed (6,504.6) (5,045.7)Received back / matured 6,796.8 5,120.3
Purchase of investments [including associate and joint venture ` 1,543.6 Million (Previous year ` 1,071.6 Million)]
(388,310.4) (401,217.2)
Proceeds from sale of investments 391,943.9 416,414.1 Bank balances not considered as cash and cash equivalents
Net cash outflow on acquisition of subsidiaries / business units (Refer note 78) (1,671.8) (10,255.5)Interest received 3,365.2 3,378.7 Receipt of rental on assets given under finance lease 10.6 10.0
CONSOLIDATED CASH FLOW STATEMENT FOR THE YEAR ENDED MARCH 31, 2017
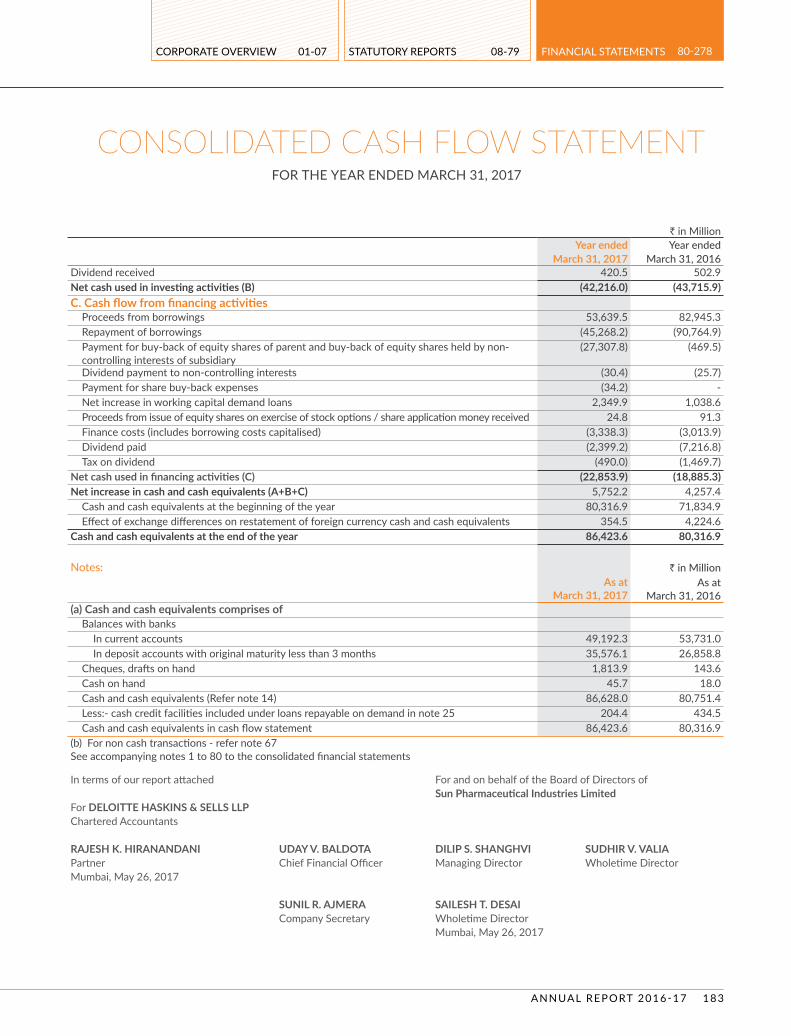
CONSOLIDATED CASH FLOW STATEMENT FOR THE YEAR ENDED MARCH 31, 2017
` in Million Year ended Year ended
March 31, 2017 March 31, 2016 Dividend received 420.5 502.9 Net cash used in investing activities (B) (42,216.0) (43,715.9)C. Cash flow from financing activities
Proceeds from borrowings 53,639.5 82,945.3 Repayment of borrowings (45,268.2) (90,764.9)Payment for buy-back of equity shares of parent and buy-back of equity shares held by non-controlling interests of subsidiary
(27,307.8) (469.5)
Dividend payment to non-controlling interests (30.4) (25.7)Payment for share buy-back expenses (34.2) - Net increase in working capital demand loans 2,349.9 1,038.6 Proceeds from issue of equity shares on exercise of stock options / share application money received 24.8 91.3 Finance costs (includes borrowing costs capitalised) (3,338.3) (3,013.9)Dividend paid (2,399.2) (7,216.8)Tax on dividend (490.0) (1,469.7)
Net cash used in financing activities (C) (22,853.9) (18,885.3)Net increase in cash and cash equivalents (A+B+C) 5,752.2 4,257.4
Cash and cash equivalents at the beginning of the year 80,316.9 71,834.9 Effect of exchange differences on restatement of foreign currency cash and cash equivalents 354.5 4,224.6
Cash and cash equivalents at the end of the year 86,423.6 80,316.9
Notes: ` in MillionAs at
March 31, 2017As at
March 31, 2016(a) Cash and cash equivalents comprises of
Balances with banksIn current accounts 49,192.3 53,731.0 In deposit accounts with original maturity less than 3 months 35,576.1 26,858.8
Cheques, drafts on hand 1,813.9 143.6 Cash on hand 45.7 18.0 Cash and cash equivalents (Refer note 14) 86,628.0 80,751.4 Less:- cash credit facilities included under loans repayable on demand in note 25 204.4 434.5 Cash and cash equivalents in cash flow statement 86,423.6 80,316.9
(b) For non cash transactions - refer note 67See accompanying notes 1 to 80 to the consolidated financial statements
In terms of our report attached For and on behalf of the Board of Directors of Sun Pharmaceutical Industries Limited
For DELOITTE HASKINS & SELLS LLPChartered Accountants
RAJESH K. HIRANANDANI UDAY V. BALDOTA DILIP S. SHANGHVI SUDHIR V. VALIAPartner Chief Financial Officer Managing Director Wholetime DirectorMumbai, May 26, 2017
SUNIL R. AJMERA SAILESH T. DESAICompany Secretary Wholetime Director
Mumbai, May 26, 2017
SUN PHARMACEUTICAL INDUSTRIES L IMITED184
NOTES TO THE CONSOLIDATED FINANCIAL STATEMENTS
FOR THE YEAR ENDED MARCH 31, 2017
1. General information Sun Pharmaceutical Industries Limited (“the Parent Company”)
is a public limited company incorporated and domiciled in India and has its listing on the BSE Limited and National Stock Exchange of India Limited. The addresses of its registered office and principal place of business are disclosed in the introduction to the annual report. The Company is in the business of manufacturing, developing and marketing a wide range of branded and generic formulations and Active Pharmaceutical Ingredients (APIs). The Parent Company and its subsidiaries (hereinafter referred to as “the Company” or “the Group”) have manufacturing locations spread across the world with trading and other incidental and related activities extending to the global markets.
2. Significant accounting policies2.1 Statement of compliance The Group has prepared its consolidated financial statements
for the year ended March 31, 2017 in accordance with Indian Accounting Standards (Ind AS) notified under the Companies (Indian Accounting Standards) Rules, 2015 (as amended) together with the comparative period data as at and for the year ended March 31, 2016. Further, the Group has prepared the opening consolidated balance sheet as at April 01, 2015 (the transition date) in accordance with Ind AS.
For all the periods up to the year ended March 31, 2016, the Group had prepared its financial statements in accordance with the requirements of previous GAAP, which includes Standards notified under the Companies (Accounting Standards) Rules, 2006 (as amended).
These are the Group’s first Ind AS financial statements. Refer Note 76 for the details of first-time adoption exemptions availed by the Group.
2.2 Basis of preparation and presentation These financial statements for the year ended March 31, 2017
are the first financial statements, the Group has prepared in accordance with Ind AS.
The consolidated financial statements have been prepared on the historical cost basis, except for: (i) certain financial instruments that are measured at fair values at the end of each reporting period; (ii) Non-current assets classified as held for
sale which are measured at the lower of their carrying amount and fair value less costs to sell; and (iii) defined benefit plans – plan assets that are measured at fair values at the end of each reporting period, as explained in the accounting policies below.
Historical cost is generally based on the fair value of the consideration given in exchange for goods and services.
Fair value is the price that would be received to sell an asset or paid to transfer a liability in an orderly transaction between market participants at the measurement date, regardless of whether that price is directly observable or estimated using another valuation technique. In estimating the fair value of an asset or a liability, the Group takes into account the characteristics of the asset or liability if market participants would take those characteristics into account when pricing the asset or liability at the measurement date. Fair value for measurement and/or disclosure purposes in these consolidated financial statements is determined on such a basis, except for share-based payment transactions that are within the scope of Ind AS 102, leasing transactions that are within the scope of Ind AS 17, and measurements that have some similarities to fair value but are not fair value, such as net realisable value in Ind AS 2 or value in use in Ind AS 36.
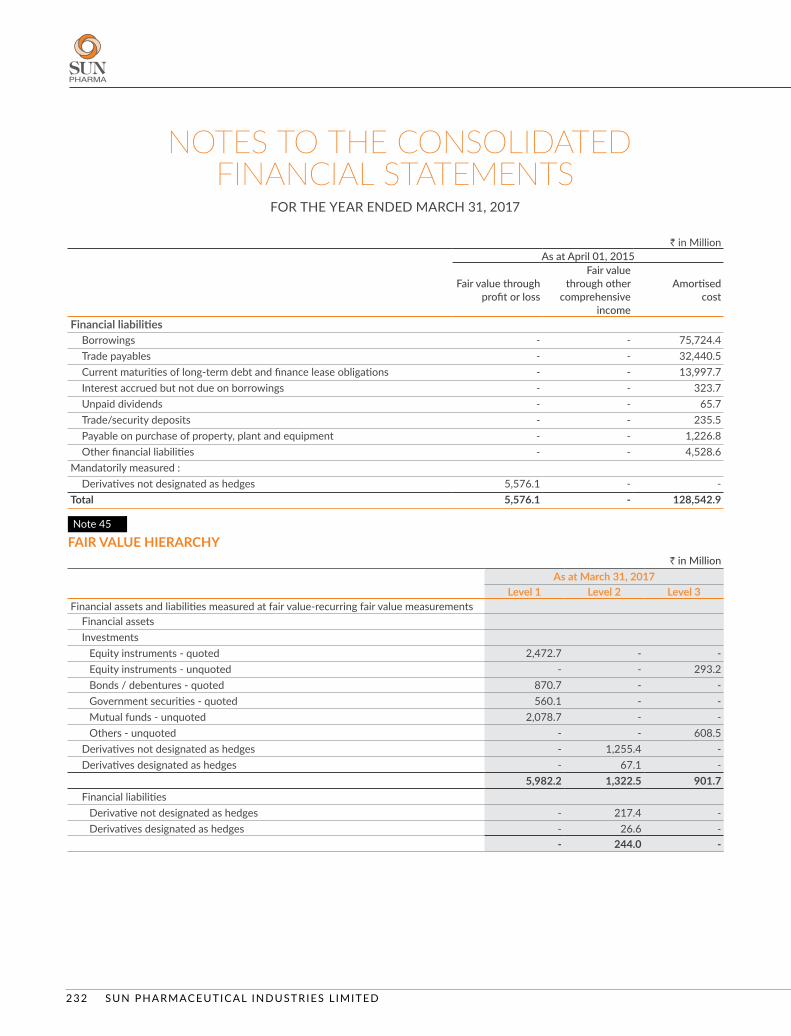
In addition, for financial reporting purposes, fair value measurements are categorised into Level 1, 2, or 3 based on the degree to which the inputs to the fair value measurements are observable and the significance of the inputs to the fair value measurement in its entirety, which are described as follows:
Level 1 inputs are quoted prices (unadjusted) in active markets for identical assets or liabilities that the entity can access at the measurement date;
Level 2 inputs are inputs, other than quoted prices included within Level 1, that are observable for the asset or liability, either directly or indirectly; and
Level 3 inputs are unobservable inputs for the asset or liability.
The Group has consistently applied the following accounting policies to all periods presented in these consolidated financial statements.
a. Basis of consolidation The consolidated financial statements comprise the
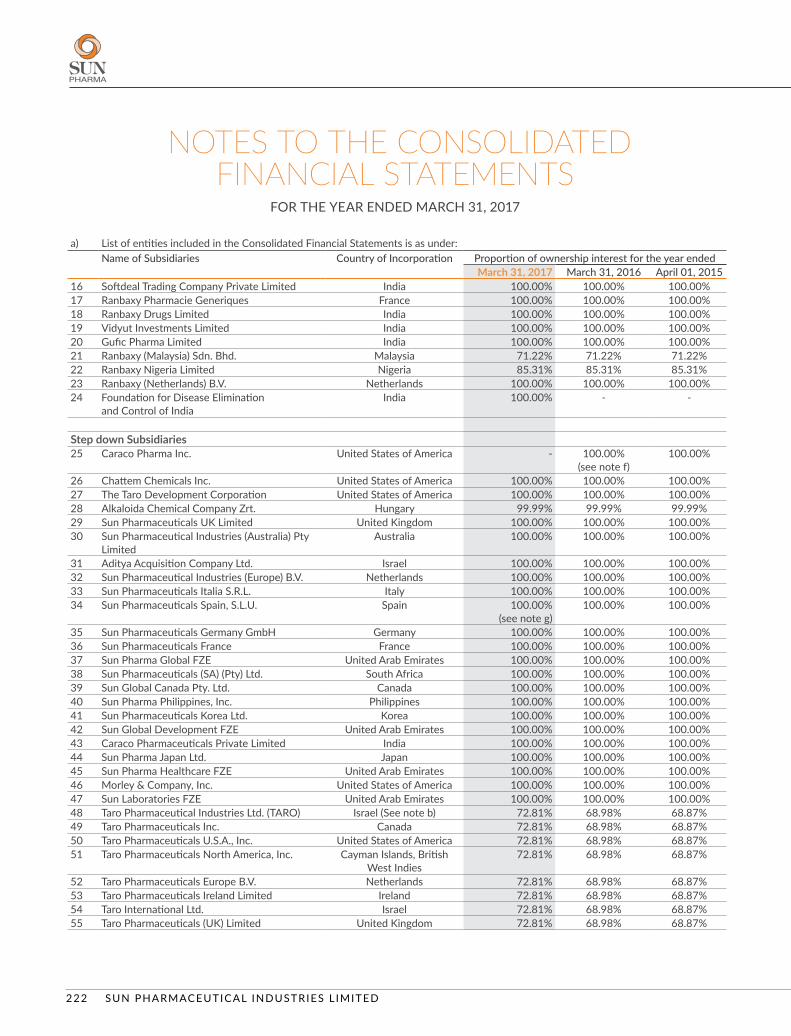
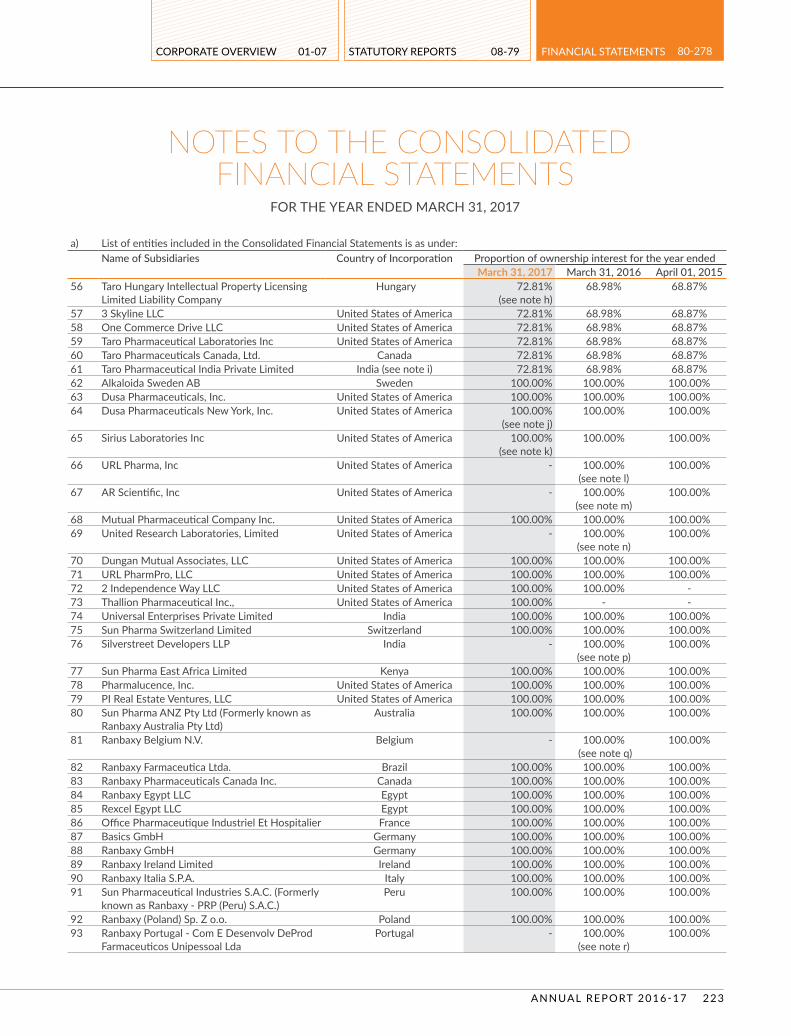
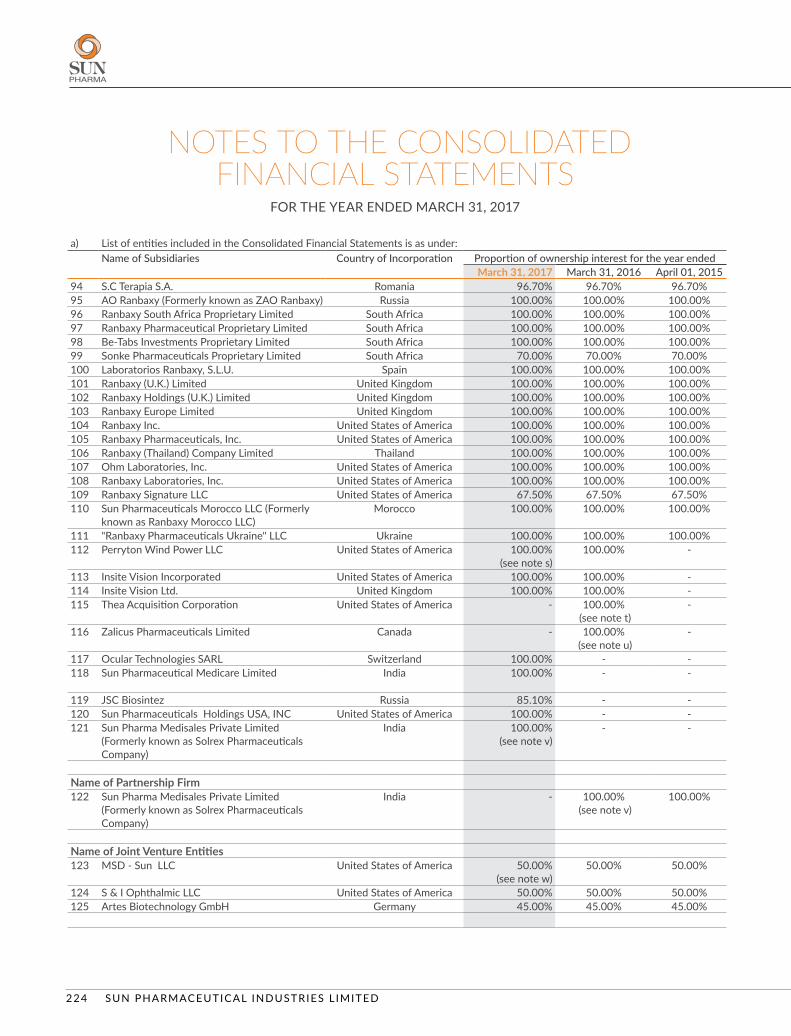
financial statements of the Parent Company, and its subsidiaries as disclosed in Note 39. Control exists when the parent has power over the entity, is exposed, or has rights, to variable returns from its involvement with the entity and has the ability to affect those returns by using its power over the entity. Power is demonstrated through existing rights that give the ability to direct relevant activities, those which significantly affect the entity’s returns. Subsidiaries are consolidated from the date control commences until the date control ceases.
Profit or loss and each component of other comprehensive income are attributed to the owners of the Company and to the non-controlling interests. Total comprehensive income of subsidiaries is attributed to the owners of the Company and to the non-controlling interests even if this results in the non-controlling interests having a deficit balance.
The financial statements of the Group companies are consolidated on a line-by-line basis and intra-Group balances, transactions including unrealised gain / loss from such transactions and cash flows relating to transactions between members of the Group are eliminated upon consolidation. These financial statements are prepared by applying uniform accounting policies in use at the Group.
Changes in the Group’s ownership interests in subsidiaries that do not result in the Group losing control over the subsidiaries are accounted for as equity transactions. The carrying amounts of the Group’s interests and the non-controlling interests are adjusted to reflect the changes in their relative interests in the subsidiaries. Any difference between the amount by which the non-controlling interests are adjusted and the fair value of the consideration paid or received is recognised directly in equity and attributed to owners of the Company.
When the Group loses control of a subsidiary, a gain or loss is recognised in profit or loss and is calculated as the difference between (i) the aggregate of the fair value of the
consideration received and the fair value of any retained interest and (ii) the previous carrying amount of the assets (including goodwill), and liabilities of the subsidiary and any non-controlling interests. All amounts previously recognised in other comprehensive income in relation to that subsidiary are accounted for as if the Group had directly disposed off the related assets or liabilities of the subsidiary (i.e. reclassified to profit or loss or transferred to another category of equity as specified/ permitted by applicable Ind AS). The fair value of any investment retained in the former subsidiary at the date when control is lost is regarded as the fair value on initial recognition for subsequent accounting under Ind AS 109, or, when applicable, the cost on initial recognition of an investment in an associate or a joint venture.
Investments in Associates and Joint Ventures Associates are those entities over which the Group has
significant influence. Significant influence is the power to participate in the financial and operating policy decisions of the entities but is not control or joint control of those policies.
A joint venture is a joint arrangement whereby the parties that have joint control of the arrangement have rights to the net assets of the joint arrangement. Joint control is the contractually agreed sharing of control of an arrangement, which exists only when decisions about the relevant activities require unanimous consent of the parties sharing control.
The results and assets and liabilities of associates or joint ventures are incorporated in these consolidated financial statements using the equity method of accounting, except when the investment, or a portion thereof, is classified as held for sale, in which case it is accounted for in accordance with Ind AS 105. Under the equity method, an investment in an associate or a joint venture is initially recognised in the consolidated balance sheet at cost and adjusted thereafter to recognise the Group’s share of the profit or loss and other comprehensive income of the associate or joint venture. Distributions received from an associate or a joint venture reduce the carrying amount of the investment. The carrying value of the Group’s investment includes goodwill identified on acquisition,
SUN PHARMACEUTICAL INDUSTRIES L IMITED186
NOTES TO THE CONSOLIDATED FINANCIAL STATEMENTS
FOR THE YEAR ENDED MARCH 31, 2017
net of any accumulated impairment losses. When the Group’s share of losses of an associate or a joint venture exceeds its interest in that associate or joint venture, the carrying amount of that interest (including any long-term investments) is reduced to zero and the recognition of further losses is discontinued except to the extent that the Group has obligations or has made payments on behalf of the associate or joint venture.
An investment in an associate or a joint venture is accounted for using the equity method from the date on which the investee becomes an associate or a joint venture and discontinues from the date when the investment ceases to be an associate or a joint venture, or when the investment is classified as held for sale.
The difference between the carrying amount of the associate or joint venture at the date the equity method was discontinued, and the fair value of any retained interest and any proceeds from disposing of a part interest in the associate or joint venture is included in the determination of the gain or loss on disposal of the associate or joint venture. In addition, the Group accounts for all amounts previously recognised in other comprehensive income in relation to that associate or joint venture on the same basis as would be required if that associate or joint venture had directly disposed off the related assets or liabilities.
When a Group entity transacts with an associate or a joint venture of the Group, profits and losses resulting from the transactions with the associate or joint venture are recognised in the Group’s consolidated financial statements only to the extent of interests in the associate or joint venture that are not related to the Group.
b. Operating Cycle Based on the nature of products / activities of the
Company and the normal time between acquisition of assets and their realisation in cash or cash equivalents, the Company has determined its operating cycle as twelve months for the purpose of classifications of its assets and liabilities as current and non-current.
c. Business combinations The Group uses the acquisition method of accounting
to account for business combinations that occurred on or after April 01, 2015. The acquisition date is generally the date on which control is transferred to the acquirer. Judgment is applied in determining the acquisition date and determining whether control is transferred from one party to another. Control exists when the Group is exposed to, or has rights to, variable returns from its involvement with the entity and has the ability to affect those returns through power over the entity. In assessing control, potential voting rights are considered only if the rights are substantive. The Group measures goodwill as of the applicable acquisition date at the fair value of the consideration transferred, including the recognised amount of any non-controlling interest in the acquiree and the fair value of the acquirer’s previously held equity interest in the acquiree (if any), less the net recognised amount of the identifiable assets acquired and liabilities assumed. When the fair value of the net identifiable assets acquired and liabilities assumed exceeds the consideration transferred, a bargain purchase gain is recognised immediately in the OCI and accumulates the same in equity as Capital Reserve where there exists clear evidence of the underlying reasons for classifying the business combination as a bargain purchase else the gain is directly recognised in equity as Capital Reserve. Consideration transferred includes the fair values of the assets transferred, liabilities incurred by the Group to the previous owners of the acquiree, and equity interests issued by the Group. Consideration transferred also includes the fair value of any contingent consideration. Changes in the fair value of the contingent consideration that qualify as measurement period adjustments are adjusted retrospectively, with corresponding adjustments against goodwill or capital reserve, as the case maybe. The subsequent accounting for changes in the fair value of the contingent consideration that do not qualify as measurement period adjustments depends on how the contingent consideration is classified. Contingent consideration that is classified as equity is not remeasured at subsequent reporting dates and its subsequent settlement is accounted for within equity. Contingent consideration that is classified as an asset or a liability is
remeasured at fair value at subsequent reporting dates with the corresponding gain or loss being recognised in profit or loss. Consideration transferred does not include amounts related to settlement of pre-existing relationships.
A contingent liability of the acquiree is assumed in a business combination only if such a liability represents a present obligation and arises from a past event, and its fair value can be measured reliably. On an acquisition-by-acquisition basis, the Group recognises any non-controlling interest in the acquiree either at fair value or at the non-controlling interest’s proportionate share of the acquiree’s identifiable net assets. Transaction costs that the Group incurs in connection with a business combination, such as finder’s fees, legal fees, due diligence fees and other professional and consulting fees, are expensed as incurred.
If the initial accounting for a business combination is incomplete by the end of the reporting period in which the combination occurs, the Group reports provisional amounts for the items for which the accounting is incomplete. Those provisional amounts are adjusted during the measurement period (see above), or additional assets or liabilities are recognised, to reflect new information obtained about facts and circumstances that existed at the acquisition date that, if known, would have affected the amounts recognised at that date.
d. Foreign currency Foreigncurrencytransactions In preparing the financial statements of each individual
Group entity, transactions in currencies other than the entity’s functional currency (foreign currencies) are translated at exchange rates at the dates of the transactions. Monetary assets and liabilities denominated in foreign currencies at the reporting date are translated into the functional currency at the exchange rate at that date Exchange differences arising on the settlement of monetary items or on translating monetary items at rates different from those at which they were translated on initial recognition during the period or in previous period are recognised in profit or loss in the period in which they arise except for:
exchange differences on foreign currency borrowings relating to assets under construction for future productive use, which are included in the cost of those assets when they are regarded as an adjustment to interest costs on those foreign currency borrowings.
exchange differences on transactions entered into in order to hedge certain foreign currency risks (see note 2.2.j). below for hedging accounting policies.
exchange differences on monetary items receivable from or payable to a foreign operation for which settlement is neither planned nor likely to occur (therefore forming part of the net investment in the foreign operation), which are recognised initially in other comprehensive income and reclassified from equity to profit or loss on repayment of the monetary items.
Non-monetary items that are measured in terms of historical cost in a foreign currency are not retranslated.
Foreignoperations For the purposes of presenting these consolidated
financial statements, the assets and liabilities of Group’s foreign operations, are translated to the Indian Rupees at exchange rates at the end of each reporting period. The income and expenses of such foreign operations are translated at the average exchange rates for the period. Resulting foreign currency differences are recognised in other comprehensive income/(loss) and presented within equity as part of Foreign Currency Translation Reserve (and attributed to non-controlling interests as appropriate). When a foreign operation is disposed off, the relevant amount in the Foreign Currency Translation Reserve is reclassified to profit or loss.
In addition, in relation to a partial disposal of a subsidiary that includes a foreign operation that does not result in the Group losing control over the subsidiary, the proportionate share of accumulated exchange differences are re-attributed to non-controlling interests and are not recognised in profit or loss. For all other partial disposals
SUN PHARMACEUTICAL INDUSTRIES L IMITED188
NOTES TO THE CONSOLIDATED FINANCIAL STATEMENTS
FOR THE YEAR ENDED MARCH 31, 2017
(i.e. partial disposals of associates or joint arrangements that do not result in the Group losing significant influence or joint control), the proportionate share of the accumulated exchange differences is reclassified to profit or loss.
Goodwill and fair value adjustments to identifiable assets acquired and liabilities assumed through acquisition of a foreign operation are treated as assets and liabilities of the foreign operation and translated at the rate of exchange prevailing at the end of each reporting period. Exchange differences arising are recognised in other comprehensive income.
e. Segment Reporting Operating segments are reported in a manner consistent
with the internal reporting provided to the chief operating decision maker. The chief operating decision maker of the Company is responsible for allocating resources and assessing performance of the operating segments and accordingly is identified as the chief operating decision maker.
f. Property, plant and equipment Items of property, plant and equipment are stated in
consolidated balance sheet at cost less accumulated depreciation and accumulated impairment losses, if any. Freehold land is not depreciated.
Properties in the course of construction for production, supply or administrative purposes are carried at cost, less any recognised impairment loss. Cost includes professional fees and, for qualifying assets, borrowing costs capitalised in accordance with the Group’s accounting policy. Such properties are classified to the appropriate categories of property, plant and equipment when completed and ready for intended use. Depreciation of these assets, on the same basis as other property assets, commences when the assets are ready for their intended use.
When parts of an item of property, plant and equipment have different useful lives, they are accounted for as separate items (major components) of property, plant and equipment.
An item of property, plant and equipment is derecognised upon disposal or when no future economic benefits are expected to arise from the continued use of the asset. Any gain or loss arising on the disposal or retirement of an item of property, plant and equipment is determined as the difference between the sales proceeds and the carrying amount of property, plant and equipment and is recognised in profit or loss.
Items of property, plant and equipment acquired through exchange of non-monetary assets are measured at fair value, unless the exchange transaction lacks commercial substance or the fair value of either the asset received or asset given up is not reliably measurable, in which case the acquired asset is measured at the carrying amount of the asset given up.
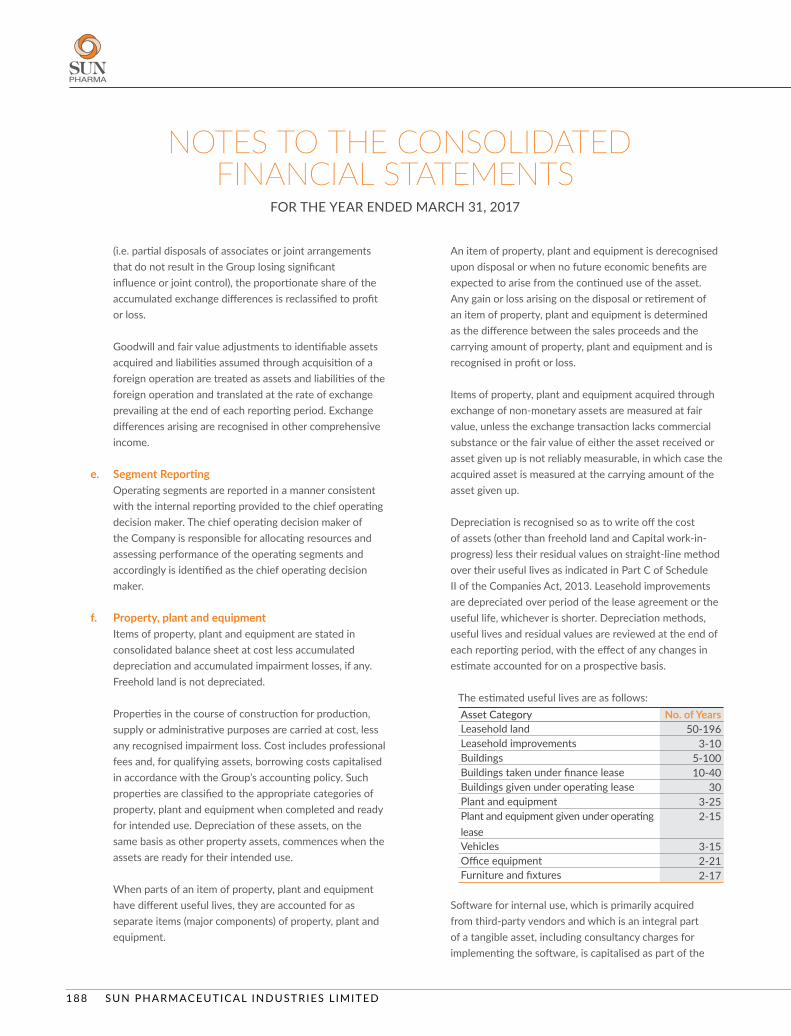
Depreciation is recognised so as to write off the cost of assets (other than freehold land and Capital work-in-progress) less their residual values on straight-line method over their useful lives as indicated in Part C of Schedule II of the Companies Act, 2013. Leasehold improvements are depreciated over period of the lease agreement or the useful life, whichever is shorter. Depreciation methods, useful lives and residual values are reviewed at the end of each reporting period, with the effect of any changes in estimate accounted for on a prospective basis.
The estimated useful lives are as follows:Asset Category No. of YearsLeasehold land 50-196Leasehold improvements 3-10Buildings 5-100Buildings taken under finance lease 10-40Buildings given under operating lease 30Plant and equipment 3-25Plant and equipment given under operating lease
2-15
Vehicles 3-15Office equipment 2-21Furniture and fixtures 2-17
Software for internal use, which is primarily acquired from third-party vendors and which is an integral part of a tangible asset, including consultancy charges for implementing the software, is capitalised as part of the
related tangible asset. Subsequent costs associated with maintaining such software are recognised as expense as incurred. The capitalised costs are amortised over the lower of the estimated useful life of the software and the remaining useful life of the tangible fixed asset.
g. Goodwill and other intangible assets Goodwill Goodwill represents the excess of consideration
transferred, together with the amount of non-controlling interest in the acquiree, over the fair value of the Group’s share of identifiable net assets acquired. Goodwill is measured at cost less accumulated impairment losses. A cash-generating unit to which goodwill has been allocated is tested for impairment annually, or more frequently when there is an indication that the unit may be impaired. The goodwill acquired in a business combination is, for the purpose of impairment testing, allocated to cash-generating units that are expected to benefit from the synergies of the combination. Any impairment loss for goodwill is recognised directly in profit or loss. An impairment loss recognised for goodwill is not reversed in subsequent periods.
On disposal of a cash-generating unit to which goodwill is allocated, the goodwill associated with the disposed cash-generating unit is included in the carrying amount of the cash-generating unit when determining the gain or loss on disposal.
Other intangible assets Other intangible assets that are acquired by the Group
and that have finite useful lives are measured at cost less accumulated amortisation and accumulated impairment losses, if any. Subsequent expenditures are capitalised only when they increase the future economic benefits embodied in the specific asset to which they relate. Intangible assets with indefinite useful lives that are acquired separately are carried at cost less accumulated impairment losses.
Research and development Expenditure on research activities undertaken with the
prospect of gaining new scientific or technical knowledge and understanding are recognised as an expense when
incurred. Development activities involve a plan or design for the production of new or substantially improved products and processes. An internally-generated intangible asset arising from development is recognised if and only if all of the following have been demonstrated:
development costs can be measured reliably;
the product or process is technically and commercially feasible;
future economic benefits are probable; and
the Group intends to and has sufficient resources to complete development and to use or sell the asset.
The expenditure to be capitalised include the cost of materials and other costs directly attributable to preparing the asset for its intended use. Other development expenditure is recognised in profit or loss as incurred.
Payments to third parties that generally take the form of up-front payments and milestones for in-licensed products, compounds and intellectual property are capitalised since the probability of expected future economic benefits criterion is always considered to be satisfied for separately acquired intangible assets.
Acquired research and development intangible assets which are under development, are recognised as In-Process Research and Development assets (“IPR&D”). IPR&D assets are not amortised, but evaluated for potential impairment on an annual basis or when there are indications that the carrying value may not be recoverable. Any impairment charge on such IPR&D assets is recognised in profit or loss. Intangible assets relating to products under development, other intangible assets not available for use and intangible assets having indefinite useful life are tested for impairment annually, or more frequently when there is an indication that the assets may be impaired. All other intangible assets are tested for impairment when there are indications that the carrying value may not be recoverable.
SUN PHARMACEUTICAL INDUSTRIES L IMITED190
NOTES TO THE CONSOLIDATED FINANCIAL STATEMENTS
FOR THE YEAR ENDED MARCH 31, 2017
The consideration for acquisition of intangible asset which is based on reaching specific milestone that are dependent on the Group’s future activity is recognised only when the activity requiring the payment is performed.
Amortisation is recognised on a straight-line basis over the estimated useful lives of intangible assets. Intangible assets that are not available for use are amortised from the date they are available for use.
The estimated useful lives for Product related intangibles and Other intangibles ranges from 5 to 20 years.
The estimated useful life and the amortisation method for intangible assets with a finite useful life are reviewed at the end of each reporting period, with the effect of any changes in estimate being accounted for on a prospective basis.
The estimated useful life and amortisation method are reviewed at the end of each reporting period, with the effect of any changes in estimate being accounted for on a prospective basis.
De-recognitionofintangibleassets Intangible assets are de-recognised either on their disposal
or where no future economic benefits are expected from their use. Gain or loss arising on such de-recognition is recognised in profit or loss, and are measured as the difference between the net disposal proceeds, if any, and the carrying amount of respective intangible assets as on the date of de-recognition.
For transition to Ind AS, the Group has elected to continue with the carrying value of all of its intangible assets recognised as of April 01, 2015 i.e. transition date, measured as per the previous GAAP and use that carrying value as its deemed cost as of the transition date.
h. Impairment of non-financial assets other than goodwill The carrying amounts of the Group’s tangible and
intangible assets are reviewed at each reporting date to determine whether there is any indication of impairment. If any such indication exists, then the asset’s recoverable
amount is estimated in order to determine the extent of the impairment loss, if any.
The recoverable amount of an asset or cash-generating unit (as defined below) is the greater of its value in use and its fair value less costs to sell. In assessing value in use, the estimated future cash flows are discounted to their present value using a pre-tax discount rate that reflects current market assessments of the time value of money and the risks specific to the asset or the cash-generating unit for which the estimates of future cash flows have not been adjusted. For the purpose of impairment testing, assets are grouped together into the smallest group of assets that generates cash inflows from continuing use that are largely independent of the cash inflows of other assets or groups of assets (the “cash-generating unit”).
An impairment loss is recognised in the profit or loss if the estimated recoverable amount of an asset or its cash generating unit is lower than its carrying amount. Impairment losses recognised in respect of cash-generating units are allocated first to reduce the carrying amount of any goodwill allocated to the units and then to reduce the carrying amount of the other assets in the unit on a pro-rata basis.
In respect of assets other than goodwill, impairment losses recognised in prior periods are assessed at each reporting date for any indications that the loss has decreased or no longer exists. An impairment loss is reversed if there has been a change in the estimates used to determine the recoverable amount. An impairment loss is reversed only to the extent that the asset’s carrying amount does not exceed the carrying amount that would have been determined, net of depreciation or amortisation, if no impairment loss had been recognised.
i. Non-current assets held for sale Non-current assets and disposal groups are classified as
held for sale if their carrying amount will be recovered principally through a sale transaction rather than through continuing use. This condition is regarded as met only when the asset (or disposal group) is available for immediate sale in its present condition subject only to terms that are usual and customary for sales of such
asset (or disposal group) and its sale is highly probable. Management must be committed to the sale, which should be expected to qualify for recognition as a completed sale within one year from the date of classification.
When the Group is committed to a sale plan involving loss of control of a subsidiary, all of the assets and liabilities of that subsidiary are classified as held for sale when the criteria described above are met, regardless of whether the Group will retain a non-controlling interest in its former subsidiary after the sale.
When the Group is committed to a sale plan involving disposal of an investment, or a portion of an investment, in an associate or joint venture, the investment or the portion of the investment that will be disposed off is classified as held for sale when the criteria described above are met, and the Group discontinues the use of the equity method in relation to the portion that is classified as held for sale.
Any retained portion of an investment in an associate or a joint venture that has not been classified as held for sale continues to be accounted for using the equity method. The Group discontinues the use of the equity method at the time of disposal when the disposal results in the Group losing significant influence over the associate or joint venture.
After the disposal takes place, the Group accounts for any retained interest in the associate or joint venture in accordance with Ind AS 109 unless the retained interest continues to be an associate or a joint venture, in which case the Group uses the equity method (see the accounting policy regarding investments in associates or joint ventures above).
Non-current assets (and disposal groups) classified as held for sale are measured at the lower of their carrying amount and fair value less costs to sell. Non-current assets are not depreciated or amortised.
j. Financial instruments A financial instrument is any contract that gives rise to
a financial asset of one entity and a financial liability or equity instrument of another entity.
Financial assets Initial recognition and measurement All financial assets are recognised initially at fair value
plus, in the case of financial assets not recorded at fair value through profit or loss, transaction costs that are attributable to the acquisition of the financial asset. Purchases or sales of financial assets that require delivery of assets within a time frame established by regulation or convention in the market place (regular way trades) are recognised on the trade date.
Subsequent measurement For purposes of subsequent measurement, financial assets
are classified in four categories:
Debt instruments at amortised cost
Debt instruments at fair value through other comprehensive income (FVTOCI)
Debt instruments and equity instruments at fair value through profit or loss (FVTPL)
Equity instruments measured at fair value through other comprehensive income (FVTOCI)
Debtinstrumentsatamortisedcost A ‘debt instrument’ is measured at the amortised cost if
both the following conditions are met:
a) The asset is held within a business model whose objective is to hold assets for collecting contractual cash flows, and
b) Contractual terms of the asset give rise on specified dates to cash flows that are solely payments of principal and interest (SPPI) on the principal amount outstanding.
After initial measurement, such financial assets are subsequently measured at amortised cost using the effective interest rate (EIR) method. Amortised cost is calculated by taking into account any discount or premium on acquisition and fees or costs that are an integral part of the EIR. The EIR amortisation is included in Other Income
SUN PHARMACEUTICAL INDUSTRIES L IMITED192
NOTES TO THE CONSOLIDATED FINANCIAL STATEMENTS
FOR THE YEAR ENDED MARCH 31, 2017
in the profit or loss. The losses arising from impairment are recognised in the profit or loss.
Debt instrument at FVTOCI A ‘debt instrument’ is measured as at FVTOCI if both of
the following criteria are met:
a) The objective of the business model is achieved both by collecting contractual cash flows and selling the financial assets, and
b) The contractual terms of the instrument give rise on specified dates to cash flows that are SPPI on the principal amount outstanding.
Debt instruments included within the FVTOCI category are measured initially as well as at each reporting date at fair value. Fair value movements are recognised in the other comprehensive income (OCI). However, the Group recognises interest income, impairment losses & reversals and foreign exchange gain or loss in the profit or loss. On derecognition of the asset, cumulative gain or loss previously recognised in OCI is reclassified from the equity to profit or loss. Interest earned whilst holding FVTOCI debt instrument is reported as interest income using the EIR method.
Debt instrument at FVTPL FVTPL is a residual category for debt instruments. Any
debt instrument, which does not meet the criteria for categorisation as at amortised cost or as FVTOCI, is classified as at FVTPL.
In addition, the Group may elect to designate a debt instrument, which otherwise meets amortised cost or FVTOCI criteria, as at FVTPL. However, such election is allowed only if doing so reduces or eliminates a measurement or recognition inconsistency (referred to as ‘accounting mismatch’).
Equity instruments All equity instruments in scope of Ind AS 109 are
measured at fair value. Equity instruments which are held for trading and contingent consideration recognised by an acquirer in a business combination to which Ind
AS103 applies are classified as at FVTPL. For all other equity instruments, the Group may make an irrevocable election to present subsequent changes in the fair value in OCI. The Group makes such election on an instrument-by-instrument basis. The classification is made on initial recognition and is irrevocable.
If the Group decides to classify an equity instrument as at FVTOCI, then all fair value changes on the instrument, including foreign exchange gain or loss and excluding dividends, are recognised in the OCI. There is no recycling of the amounts from OCI to profit or loss, even on sale of investment. However, the Group may transfer the cumulative gain or loss within equity.
Equity instruments included within the FVTPL category are measured at fair value with all changes recognised in the profit or loss.
Derecognition A financial asset (or, where applicable, a part of a financial
asset or part of a group of similar financial assets) is primarily derecognised (i.e. removed from the Group’s consolidated balance sheet) when:
The contractual rights to receive cash flows from the asset have expired, or
The Group has transferred its rights to receive contractual cash flows from the asset or has assumed an obligation to pay the received cash flows in full without material delay to a third party under a ‘pass-through’ arrangement; and either (a) the Group has transferred substantially all the risks and rewards of the asset, or (b) the Group has neither transferred nor retained substantially all the risks and rewards of the asset, but has transferred control of the asset.
When the Group has transferred its rights to receive cash flows from an asset or has entered into a pass-through arrangement, it evaluates if and to what extent it has retained the risks and rewards of ownership. When it has neither transferred nor retained substantially all of the risks and rewards of the asset, nor transferred control of the asset, the Group continues to recognise the
transferred asset to the extent of the Group’s continuing involvement. In that case, the Group also recognises an associated liability. The transferred asset and the associated liability are measured on a basis that reflects the rights and obligations that the Group has retained.
On derecognition of a financial asset in its entirety, the difference between the asset’s carrying amount and the sum of the consideration received and receivable and the cumulative gain or loss that had been recognised in OCI and accumulated in equity is recognised in profit or loss if such gain or loss would have otherwise been recognised in profit or loss on disposal of that financial asset.
Impairmentoffinancialassets In accordance with Ind AS 109, the Group applies
expected credit loss (ECL) model for measurement and recognition of impairment loss on the following financial assets and credit risk exposure:
a) Financial assets that are debt instruments, and are measured at amortised cost
b) Financial assets that are debt instruments and are measured as at FVTOCI
c) Lease receivables under Ind AS 17
d) Trade receivables or any contractual right to receive cash or another financial asset
e) Loan commitments which are not measured as at FVTPL
f) Financial guarantee contracts which are not measured as at FVTPL
The Group follows ‘simplified approach’ for recognition of impairment loss allowance on trade receivables or any contractual right to receive cash or another financial asset.
The application of simplified approach does not require the Group to track changes in credit risk. Rather, it recognises impairment loss allowance based on lifetime ECLs at each reporting date, right from its initial
recognition. As a practical expedient, the Group uses a provision matrix to determine impairment loss allowance on portfolio of its trade receivables. The provision matrix is based on its historically observed default rates over the expected life of the trade receivables and is adjusted for forward-looking estimates. At every reporting date, the historical observed default rates are updated and changes in the forward-looking estimates are analysed.
Financialliabilitiesandequityinstruments Classification as debt or equity Debt and equity instruments issued by a Group entity
are classified as either financial liabilities or as equity in accordance with the substance of the contractual arrangements and the definitions of a financial liability and an equity instrument.
Equity instruments An equity instrument is any contract that evidences a
residual interest in the assets of an entity after deducting all of its liabilities. Equity instruments issued by a Group entity are recognised at the proceeds received, net of direct issue costs.
Repurchase of the Parent Company’s own equity instruments is recognised and deducted directly in equity. No gain or loss is recognised in profit or loss on the purchase, sale, issue or cancellation of the Parent Company’s own equity instruments.
Compoundfinancialinstruments The component parts of compound financial instruments
(convertible notes) issued by the Group are classified separately as financial liabilities and equity in accordance with the substance of the contractual arrangements and the definitions of a financial liability and an equity instrument.
Initialrecognitionandmeasurement All financial liabilities are recognised initially at fair value
and, in the case of loans and borrowings and payables, net of directly attributable transaction costs.
Subsequent measurement All financial liabilities are subsequently measured at
SUN PHARMACEUTICAL INDUSTRIES L IMITED194
NOTES TO THE CONSOLIDATED FINANCIAL STATEMENTS
FOR THE YEAR ENDED MARCH 31, 2017
amortised cost using the effective interest method or at FVTPL.
Financialliabilitiesatfairvaluethroughprofitorloss Financial liabilities are classified as at FVTPL when
the financial liability is either contingent consideration recognised by the Group as an acquirer in a business combination to which Ind AS 103 applies or is held for trading or is designated upon initial recognition as at fair value through profit or loss. Financial liabilities are classified as held for trading if they are incurred principally for the purpose of repurchasing in the near term or on initial recognition it is part of a portfolio of identified financial instruments that the Group manages together and has a recent actual pattern of short-term profit-taking. This category also includes derivative entered into by the Group that are not designated and effective as hedging instruments in hedge relationships as defined by Ind AS 109. Gains or losses on liabilities held for trading are recognised in the profit or loss.
Financial liabilities designated upon initial recognition at fair value through profit or loss are designated as such at the initial date of recognition, and only if the criteria in Ind AS 109 are satisfied. For non-held-for-trading financial liabilities designated as at FVTPL, fair value gains/ losses attributable to changes in own credit risk are recognised in OCI, unless the recognition of the effects of changes in the liability’s credit risk in OCI would create or enlarge an accounting mismatch in profit or loss, in which case these effects of changes in credit risk are recognised in profit or loss. These gains/ loss are not subsequently transferred to profit or loss. All other changes in fair value of such liability are recognised in the consolidated statement of profit or loss.
Financialliabilitiessubsequentlymeasuredatamortisedcost Financial liabilities that are not held-for-trading and are
not designated as at FVTPL are measured at amortised cost in subsequent accounting periods. The carrying amounts of financial liabilities that are subsequently measured at amortised cost are determined based on the effective interest rate (EIR) method. Interest expense that is not capitalised as part of costs of an asset is included in the ‘Finance costs’ line item in the profit or loss.
After initial recognition, such financial liabilities are subsequently measured at amortised cost using the EIR method. Amortised cost is calculated by taking into account any discount or premium on acquisition and fees or costs that are an integral part of the EIR. The EIR amortisation is included as finance costs in the profit or loss.
Financial guarantee contracts Financial guarantee contracts are those contracts that
require a payment to be made to reimburse the holder for a loss it incurs because the specified debtor fails to make a payment when due in accordance with the terms of a debt instrument. Financial guarantee contracts are recognised initially as a liability at fair value and if not designated as at FVTPL, are subsequently measured at the higher of the amount of loss allowance determined as per impairment requirements of Ind AS 109 and the amount initially recognised less cumulative amount of income recognised.
Derecognition A financial liability is derecognised when the obligation
under the liability is discharged or cancelled or expires. When an existing financial liability is replaced by another from the same lender on substantially different terms, or the terms of an existing liability are substantially modified, such an exchange or modification is treated as the derecognition of the original liability and the recognition of a new liability. The difference between the carrying amount of the financial liability derecognised and the consideration paid and payable is recognised in profit or loss.
Embeddedderivatives Derivatives embedded in non-derivative host contracts
that are not financial assets within the scope of Ind AS 109 are accounted for as separate derivatives and recorded at fair value if their economic characteristics and risks are not closely related to those of the host contracts and the host contracts are not held for trading or designated at fair value though profit or loss. These embedded derivatives are measured at fair value with changes in fair value recognised in profit or loss, unless designated as effective hedging instruments.
Reclassificationoffinancialassets The Group determines classification of financial assets and
liabilities on initial recognition. After initial recognition, no reclassification is made for financial assets which are equity instruments and financial liabilities. For financial assets which are debt instruments, a reclassification is made only if there is a change in the business model for managing those assets. Changes to the business model are expected to be infrequent. The Group’s senior management determines change in the business model as a result of external or internal changes which are significant to the Group’s operations. Such changes are evident to external parties. A change in the business model occurs when the Group either begins or ceases to perform an activity that is significant to its operations. If the Group reclassifies financial assets, it applies the reclassification prospectively from the reclassification date which is the first day of the immediately next reporting period following the change in business model. The Group does not restate any previously recognised gains, losses (including impairment gains or losses) or interest.
Derivativefinancialinstrumentsandhedgeaccounting Initial recognition and subsequent measurement The Group uses derivative financial instruments, such as
forward currency contracts, full currency swap, options and interest rate swaps to hedge its foreign currency risks and interest rate risks respectively. Such derivative financial instruments are initially recognised at fair value on the date on which a derivative contract is entered into and are subsequently re-measured at fair value at the end of each reporting period. Derivatives are carried as financial assets when the fair value is positive and as financial liabilities when the fair value is negative.
Any gains or losses arising from changes in the fair value of derivatives are taken directly to profit or loss, except for the effective portion of cash flow hedges, which is recognised in OCI and later reclassified to profit or loss when the hedge item affects profit or loss or treated as basis adjustment if a hedged forecast transaction subsequently results in the recognition of a non-financial asset or non-financial liability.
For the purpose of hedge accounting, hedges are classified as:
Fair value hedges when hedging the exposure to changes in the fair value of a recognised asset or liability or an unrecognised firm commitment.
Cash flow hedges when hedging the exposure to variability in cash flows that is either attributable to a particular risk associated with a recognised asset or liability or a highly probable forecast transaction or the foreign currency risk in an unrecognised firm commitment
Hedges of a net investment in a foreign operation
At the inception of a hedge relationship, the Group formally designates and documents the hedge relationship to which the Group wishes to apply hedge accounting and the risk management objective and strategy for undertaking the hedge. The documentation includes the Group’s risk management objective and strategy for undertaking hedge, the hedging/economic relationship, the hedged item or transaction, the nature of the risk being hedged, hedge ratio and how the entity will assess the effectiveness of changes in the hedging instrument’s fair value in offsetting the exposure to changes in the hedged item’s fair value or cash flows attributable to the hedged risk. Such hedges are expected to be highly effective in achieving offsetting changes in fair value or cash flows and are assessed on an ongoing basis to determine that they actually have been highly effective throughout the financial reporting periods for which they were designated.
Hedges that meet the strict criteria for hedge accounting are accounted for, as described below:
(i) Fair value hedges Changes in fair value of the designated portion
of derivatives that qualify as fair value hedges are recognised in profit or loss immediately, together with any changes in the fair value of the hedged asset or liability that are attributable to the hedged risk.
SUN PHARMACEUTICAL INDUSTRIES L IMITED196
NOTES TO THE CONSOLIDATED FINANCIAL STATEMENTS
FOR THE YEAR ENDED MARCH 31, 2017
(ii) Cash flow hedges The effective portion of changes in the fair value
of the hedging instrument is recognised in OCI in the cash flow hedge reserve, while any ineffective portion is recognised immediately in profit or loss. The Group uses forward currency contracts as hedges of its exposure to foreign currency risk in forecast transactions and firm commitments. Amounts recognised as OCI are transferred to profit or loss when the hedged transaction affects profit or loss, such as when a forecast sale occurs. When the hedged item is the cost of a non-financial asset or non-financial liability, the amounts recognised as OCI are transferred to the initial carrying amount of the non-financial asset or liability.
If the hedging instrument expires or is sold, terminated or exercised or if its designation as a hedge is revoked, or when the hedge no longer meets the criteria for hedge accounting, any cumulative gain or loss previously recognised in OCI remains separately in equity until the forecast transaction occurs or the foreign currency firm commitment is met. When a forecast transaction is no longer expected to occur, the gain or loss accumulated in equity is recognised immediately in profit or loss.
Treasury shares The Group has created an Employee Benefit Trust (EBT)
for providing share-based payment to its employees. The Group uses EBT as a vehicle for distributing shares to employees under the employee remuneration schemes. The Group treats EBT as its extension and shares held by EBT are treated as treasury shares.
Own equity instruments that are reacquired (treasury shares) are deducted from equity. No gain or loss is recognised in profit or loss on the purchase, sale, issue or cancellation of the Group’s own equity instruments. Consideration paid or received shall be recognised directly in equity.
Dividend distribution to equity holders of the parent
The Parent Company recognises a liability to make dividend distributions to equity holders of the parent
when the distribution is authorised and the distribution is no longer at the discretion of the Parent Company. As per the corporate laws in India, a distribution is authorised when it is approved by the shareholders. A corresponding amount is recognised directly in equity.
k. Leases A lease that transfers substantially all the risks and
rewards incidental to ownership to the lessee is classified as a finance lease. All other leases are classified as operating leases.
Group as a lessee Finance leases are capitalised at the commencement of
the lease at the inception date fair value of the leased property or, if lower, at the present value of the minimum lease payments. The corresponding liability to the lessor is included in the consolidated balance sheet as a finance lease obligation. Lease payments are apportioned between finance charges and reduction of the lease liability so as to achieve a constant rate of interest on the remaining balance of the liability. Finance charges are recognised in profit or loss as finance costs, unless they are directly attributable to qualifying assets, in which case they are capitalised in accordance with the Group’s general policy on the borrowing costs. Contingent rentals are recognised as expenses in the periods in which they are incurred.
Operating lease payments are generally recognised as an expense in the profit or loss on a straight-line basis over the lease term. Where the rentals are structured solely to increase in line with expected general inflation to compensate for the lessor’s expected inflationary cost increases, such increases are recognised in the year in which such benefits accrue. Contingent rentals arising under operating leases are also recognised as expenses in the periods in which they are incurred.
Group as a lessor Rental income from operating lease is generally recognised
on a straight-line basis over the term of the relevant lease. Where the rentals are structured solely to increase in line with expected general inflation to compensate for the Group’s expected inflationary cost increases, such increases are recognised in the year in which such benefits
accrue. Initial direct costs incurred in negotiating and arranging an operating lease are added to the carrying amount of the leased asset and recognised over the lease term on the same basis as rental income. Contingent rents are recognised as revenue in the period in which they are earned.
Amounts due from lessees under finance leases are recorded as receivables at the Group’s net investment in the leases. Finance lease income is allocated to accounting periods so as to reflect a constant periodic rate of return on the Group’s net investment outstanding in respect of the leases.
l. Inventories Inventories consisting of raw materials and packing
materials, work-in-progress, stock-in-trade and finished goods are measured at the lower of cost and net realisable value. The cost of all categories of inventories is based on the weighted average method. Cost of raw materials and packing materials and stock-in-trade comprises cost of purchases. Cost of work-in-progress and finished goods comprises direct material, direct labour and an appropriate proportion of variable and fixed overhead expenditure, the latter being allocated on the basis of normal operating capacity. Cost of inventories also include all other costs incurred in bringing the inventories to their present location and condition.
Net realisable value is the estimated selling price in the ordinary course of business, less the estimated costs of completion and costs necessary to make the sale.
m. Cash and cash equivalents Cash and cash equivalent in the balance sheet comprise
cash at banks and on hand and short-term deposits with an original maturity of three months or less, which are subject to an insignificant risk of changes in value.
For the purpose of the consolidated statement of cash flows, cash and cash equivalents consist of cash and short-term deposits, as defined above, net of outstanding bank overdrafts as they are considered an integral part of the Group’s cash management.
n. Provisions, contingent liabilities and contingent assets Provisions are recognised when the Group has a present
obligation (legal or constructive) as a result of past event, it is probable that an outflow of resources embodying economic benefits will be required to settle the obligation and a reliable estimate can be made of the amount of obligation. If the effect of the time value of money is material, provisions are determined by discounting the expected future cash flows at a pre-tax rate that reflects current market assessments of the time value of money and the risks specific to the liability. Where discounting is used, the increase in the provision due to the passage of time is recognised as a finance cost.
Restructuring A provision for restructuring is recognised when the Group
has a detailed formal restructuring plan and has raised a valid expectation in those affected that it will carry out the restructuring by starting to implement the plan or announcing its main features to those affected by it. The measurement of a restructuring provision includes only the direct expenditure arising from the restructuring, which are those amounts that are both necessarily entailed by the restructuring and not associated with the ongoing activities of the entity.
Onerous contracts Present obligations arising under onerous contracts are
recognised and measured as provisions. An onerous contract is considered to exist where the Group has a contract under which the unavoidable costs of meeting the obligations under the contract exceed the economic benefit expected to be received from the contract.
Contingentliabilitiesandcontingentassets Contingent liability is disclosed for, (i) Possible obligations which will be confirmed only by
future events not wholly within the control of the Company, or
(ii) Present obligations arising from past events where it is not probable that an outflow of resources will be required to settle the obligation or a reliable estimate of the amount of the obligation cannot be made.
SUN PHARMACEUTICAL INDUSTRIES L IMITED198
NOTES TO THE CONSOLIDATED FINANCIAL STATEMENTS
FOR THE YEAR ENDED MARCH 31, 2017
Contingent Assets are not recognised in the financial statements.
o. Revenue Revenue from sale of goods include excise duty and is
measured at the fair value of the consideration received or receivable. Revenue is net of returns, sales tax, chargebacks, rebates and other similar allowances.
Saleofgoods Revenue from sale of goods is recognised when the
significant risks and rewards of ownership have been transferred to the buyer, usually on delivery of goods, it is probable that the economic benefit will flow to the Group, the associated costs and possible return of goods can be estimated reliably, there is neither continuing management involvement to the degree usually associated with ownership nor effective control over the goods sold and the amount of revenue can be measured reliably.
Provisions for chargeback, rebates, discounts and medicaid payments are estimated and provided for in the year of sales and recorded as reduction of revenue.
Sales Returns The Company accounts for sales returns accrual by
recording an allowance for sales returns concurrent with the recognition of revenue at the time of a product sale. This allowance is based on the Company’s estimate of expected sales returns. With respect to established products, the Company considers its historical experience of sales returns, levels of inventory in the distribution channel, estimated shelf life, product discontinuances, price changes of competitive products, and the introduction of competitive new products, to the extent each of these factors impact the Company’s business and markets. With respect to new products introduced by the Company, such products have historically been either extensions of an existing line of product where the Company has historical experience or in therapeutic categories where established products exist and are sold either by the Company or the Company’s competitors.
RenderingofServices Revenue from services rendered is recognised in the
consolidated statement profit and loss as the underlying services are performed. Upfront non-refundable payments received are deferred and recognised as revenue over the expected period over which the related services are expected to be performed.
Royalties Royalty revenue is recognised on an accrual basis in
accordance with the substance of the relevant agreement (provided that it is probable that economic benefits will flow to the Group and the amount of revenue can be measured reliably). Royalty arrangements that are based on production, sales and other measures are recognised by reference to the underlying arrangement.
Dividend and interest income Dividend income is recognised when the Group’s right
to receive the payment is established, which is generally when shareholders approve the dividend.
Interest income from a financial asset is recognised when it is probable that the economic benefits will flow to the Group and the amount of income can be measured reliably. Interest income is accrued on a time basis, by reference to the principal outstanding and at the effective interest rate applicable, which is the rate that exactly discounts estimated future cash receipts through the expected life of the financial asset to that asset’s net carrying amount on initial recognition.
p. Government grants The Group recognises government grants only when there
is reasonable assurance that the conditions attached to them will be complied with, and the grants will be received. When the grant relates to an expense item, it is recognised as income on a systematic basis over the periods that the related costs, for which it is intended to compensate, are expensed. When the grant relates to an asset, it is recognised as deferred revenue in the consolidated balance sheet and transferred to profit or loss on a systematic basis over the expected useful life of the related asset.
q. Employee benefits Definedbenefitplans The liability in respect of defined benefit plans is calculated
using the projected unit credit method with actuarial valuations being carried out at the end of each annual reporting period. The present value of the defined benefit obligation is determined by discounting the estimated future cash outflows by reference to market yields at the end of the reporting period on government bonds. The currency and term of the government bonds shall be consistent with the currency and estimated term of the post-employment benefit obligations. The current service cost of the defined benefit plan, recognised in the profit or loss as employee benefits expense, reflects the increase in the defined benefit obligation resulting from employee service in the current year, benefit changes, curtailments and settlements. Past service costs are recognised in profit or loss in the period of a plan amendment. The net interest cost is calculated by applying the discount rate to the net balance of the defined benefit obligation and the fair value of plan assets. This cost is included in employee benefit expense in profit or loss. Actuarial gains and losses arising from experience adjustments and changes in actuarial assumptions are charged or credited to OCI in the period in which they arise and is reflected immediately in retained earnings and is not reclassified to profit or loss.
Terminationbenefits Termination benefits are recognised as an expense at the
earlier of the date when the Group can no longer withdraw the offer of those benefits and when the entity recognises costs for a restructuring that is within the scope of Ind AS 37 and involves the payment of termination benefits.
Short-termandOtherlong-termemployeebenefits A liability is recognised for benefits accruing to employees
in respect of wages and salaries, and casual leave in the period the related service is rendered at the undiscounted amount of the benefits expected to be paid in exchange for that service.
The Group’s net obligation in respect of other long term employee benefits is the amount of future benefit that employees have earned in return for their service in the
current and previous periods. That benefit is discounted to determine its present value.
Definedcontributionplans The Group’s contributions to defined contribution plans
are recognised as an expense as and when the services are received from the employees entitling them to the contributions.
Share-based payment arrangements The grant date fair value of options granted to
employees is recognised as an employee expense, with a corresponding increase in equity, on a straight line basis, over the vesting period, based on the Group’s estimate of equity instruments that will eventually vest. At the end of each reporting period, the Group revises its estimate of the number of equity instruments expected to vest. The impact of the revision of the original estimates, if any, is recognised in profit or loss such that the cumulative expense reflects the revised estimate, with a corresponding adjustment to the equity-settled employee benefits reserve.
For cash-settled share-based payments, a liability is recognised for the goods or services acquired, measured initially at the fair value of the liability. At the end of each reporting period until the liability is settled, and at the date of settlement, the fair value of the liability is remeasured, with any changes in fair value recognised in profit or loss for the year.
r. Income tax Income tax expense consists of current and deferred tax.
Income tax expense is recognised in profit or loss except to the extent that it relates to items recognised in OCI or directly in equity, in which case it is recognised in OCI or directly in equity respectively. Current tax is the expected tax payable on the taxable profit for the year, using tax rates enacted or substantively enacted by the end of the reporting period, and any adjustment to tax payable in respect of previous years. Current tax assets and tax liabilities are offset where the Company has a legally enforceable right to offset and intends either to settle on a net basis, or to realise the asset and settle the liability simultaneously.
SUN PHARMACEUTICAL INDUSTRIES L IMITED200
NOTES TO THE CONSOLIDATED FINANCIAL STATEMENTS
FOR THE YEAR ENDED MARCH 31, 2017
Deferred tax is recognised on temporary differences between the carrying amounts of assets and liabilities in the consolidated financial statements and the corresponding tax bases used in the computation of taxable profit. Deferred tax is not recognised for the temporary differences that arise on the initial recognition of assets or liabilities in a transaction that is not a business combination and that affects neither accounting nor taxable profits and taxable temporary differences arising upon the initial recognition of goodwill.
Deferred tax is measured at the tax rates that are expected to be applied to the temporary differences when they reverse, based on the laws that have been enacted or substantively enacted by the end of the reporting period. Deferred tax assets and liabilities are offset if there is a legally enforceable right to set off corresponding current tax assets against current tax liabilities and the deferred tax assets and deferred tax liabilities relate to income taxes levied by the same tax authority on the Company.
A deferred tax asset is recognised to the extent that it is probable that future taxable profits will be available against which the temporary difference can be utilised. Deferred tax assets are reviewed at each reporting date and are reduced to the extent that it is no longer probable that the related tax benefit will be realised. Withholding tax arising out of payment of dividends to shareholders under the Indian Income tax regulations is not considered as tax expense for the Company and all such taxes are recognised in the statement of changes in equity as part of the associated dividend payment.
Minimum Alternate Tax (‘MAT’) credit is recognised as deferred tax asset only when and to the extent there is convincing evidence that the Company will pay normal income tax during the period for which the MAT credit can be carried forward for set-off against the normal tax liability. MAT credit recognised as an asset is reviewed at each Balance Sheet date and written down to the extent the aforesaid convincing evidence no longer exists.
s. Earnings per share The Parent Company presents basic and diluted earnings
per share (“EPS”) data for its equity shares. Basic EPS is calculated by dividing the profit or loss attributable to equity shareholders of the Parent Company by the weighted average number of equity shares outstanding during the period. Diluted EPS is determined by adjusting the profit or loss attributable to equity shareholders and the weighted average number of equity shares outstanding for the effects of all dilutive potential ordinary shares, which includes all stock options granted to employees.
The number of equity shares and potentially dilutive equity shares are adjusted retrospectively for all periods presented for any share splits and bonus shares issues including for changes effected prior to the approval of the financial statements by the Board of Directors.
t. Recent Accounting pronouncements Standardsissuedbutnotyeteffective In March 2017, the Ministry of Corporate Affairs
issued the Companies (Indian Accounting Standards) (Amendments) Rules, 2017, notifying amendment to Ind AS 7, ‘Statement of cash flows’. This amendment is in accordance with the recent amendments made by International Accounting Standards Board (IASB) to IAS 7, ‘Statement of cash flows’. The amendment is applicable to the Company from April 01, 2017.
The amendments to Ind AS 7 requires the entities to provide disclosures that enable users of financial statements to evaluate changes in liabilities arising from financing activities, including both changes arising from cash flows and non-cash changes, suggesting inclusion of a reconciliation between the opening and closing balances in the Balance Sheet for liabilities arising from financing activities, to meet the disclosure requirement.
The Company is evaluating the requirements of the amendment and the effect on the financial statements is being evaluated.
As at March 31, 2017 22.5 236.1 10,988.6 932.4 41.0 68.1 33,401.4 20.2 1,880.7 0.4 534.6 915.3 49,041.3 Carrying amountAs at April 01, 2015 2,098.5 1,646.8 29,635.4 12.0 153.7 171.2 33,597.9 22.6 1,270.7 - 781.5 610.4 70,000.7 As at March 31, 2016 2,245.1 1,678.5 30,975.6 731.2 215.6 179.9 37,263.0 1.4 1,306.9 - 617.6 616.6 75,831.4 As at March 31, 2017 2,880.4 1,610.1 34,315.1 635.0 207.5 235.3 42,141.5 0.6 1,605.3 - 540.1 782.0 84,952.9
SUN PHARMACEUTICAL INDUSTRIES L IMITED202
NOTES TO THE CONSOLIDATED FINANCIAL STATEMENTS
FOR THE YEAR ENDED MARCH 31, 2017
Note 3b
OTHER INTANGIBLE ASSETSOther than internally generatedFollowing are the changes in the carrying value of intangible assets
` in Million
Computer Software
Trademarks, Designs and Other Intangible
Assets
Total
At cost or deemed costAs at April 01, 2015 1,197.8 18,415.1 19,612.9 Consolidation Adjustments 32.4 872.4 904.8 Taken over on acquisition ^ - 373.7 373.7 Additions 134.1 21,508.0 21,642.1 Disposals (5.9) (103.4) (109.3)As at March 31, 2016 1,358.4 41,065.8 42,424.2 Consolidation Adjustments (16.1) (1,461.4) (1,477.5)Taken over on acquisition ^ - 3.5 3.5 Additions 99.1 15,041.3 15,140.4 Eliminated on disposals of assets (25.8) (757.0) (782.8)As at March 31, 2017 1,415.6 53,892.2 55,307.8 Accumulated amortisation and impairmentAs at April 01, 2015 399.0 12,752.6 13,151.6 Consolidation Adjustments 20.8 915.8 936.6 Amortisation expense 282.2 1,522.5 1,804.7 Impairment losses recognised in consolidated statement of profit and loss (also included in exceptional items)
3.1 64.5 67.6
Eliminated on disposals of assets (3.2) (76.8) (80.0)As at March 31, 2016 701.9 15,178.6 15,880.5 Consolidation Adjustments (12.1) (579.8) (591.9)Amortisation expense 237.6 3,887.8 4,125.4 Eliminated on disposals of assets (15.1) (527.7) (542.8)As at March 31, 2017 912.3 17,958.9 18,871.2 Carrying amountAs at April 01, 2015 798.8 5,662.5 6,461.3 As at March 31, 2016 656.5 25,887.2 26,543.7 As at March 31, 2017 503.3 35,933.3 36,436.6
Footnotes :
(a) Buildings include ` 8,620 (As at March 31, 2016: ` 8,620 ; As at April 01, 2015: ` 8,620) towards cost of shares in a co-operative housing society. (b) Impairment losses for the year ended March 31, 2016 includes ` 39.8 Million is utilised from Revaluation Reserve. (c) Freehold land includes land valued at ` 25.5 Million (Previous Year ` 25.5 Million) pending registration in the name of the Parent Company. (d) Excludes Fixed Assets Held for Sale (Refer Note 73). (e) Deletions / Adjustments during the previous year includes refund received from authorities in respect of dismantling charges. (f) Borrowing cost capitalised during the year ` 110.3 Million (Previous Year ` 162.1 Million) * Refer Note 55 ^ Refer Note 78
Less: Impairment in value of investment (2,463.5) (2,463.5) (2,463.5) 4,605.4 3,008.8 2,175.7
Aggregate carrying value of unquoted investments 4,605.4 3,008.8 2,175.7 Aggregate book value (carrying value)of quoted investments
2,463.5 2,463.5 2,463.5
Market value of quoted investment 570.1 541.9 729.8Aggregate amount of impairment in value of investments in associate
2,463.5 2,463.5 2,463.5
* The shares of this entity are thinly traded and therefore, market price has not been considered for the purpose of assessment of impairment in the value of its non-current investment.
SUN PHARMACEUTICAL INDUSTRIES L IMITED204
NOTES TO THE CONSOLIDATED FINANCIAL STATEMENTS
FOR THE YEAR ENDED MARCH 31, 2017
Note 5
INVESTMENTS IN JOINT VENTURES (NON-CURRENT)(carrying amount determined using equity method of accounting)
` in Million As at As at As at
March 31, 2017 March 31, 2016 April 01, 2015Quantity Amount Quantity Amount Quantity Amount
Unquoted, fully paidInvestments in equity instruments
9.9% Non-convertible Debentures of ` 1,000,000 each fully paid of Housing Development Finance Corporation Ltd maturing on December 23, 2018
250 259.4 250 257.8 250 262.2
8.2% Bonds of ` 1,000 each fully paid of National Highways Authority of India maturing on January 25, 2022
61,809 66.7 61,809 65.3 61,809 63.6
8.2% Bonds of ` 1,000 each fully paid of Power Finance Corporation Ltd (Series I) maturing on February 1, 2022
142,393 153.6 142,393 150.4 142,393 146.6
8/8.15% Bonds of ` 1,000 each fully paid of Indian Railway Finance Corporation Ltd maturing on February 23, 2022
163,131 175.1 163,131 170.9 163,131 166.4
9.55% Debentures of ` 1,000,000 each fully paid of Canara Bank (Perpetual Bonds ) maturing on March 5, 2025
- - - - 500.0 499.7
10.75% Bonds of ` 1,000,000 each fully paid of IDBI Bank Ltd - OMNI (2014-15-Series II) Tier I Perpetual Bonds maturing on October 17, 2024
- - - - 500.0 536.5
Unquoted0% Optionally Fully Convertible Debentures of ` 100 each fully paid of Sun Speciality Chemicals Pvt Ltd
- - 1,156,500 106.0 1,156,500 97.1
Other investmentsUnquoted
Frazier Healthcare LS VIII - 96.2 - 3.3 - - 5AM Ventures IV, L.P. - 307.3 - 184.9 - 55.0 Atlas Venture Fund - 205.0 - 49.7 - -
4,575.1 7,496.9 10,772.1
Aggregate book value (carrying value) of quoted investments 3,673.4 6,846.8 10,176.4Aggregate amount of quoted investments at market value 3,673.4 6,846.8 10,176.4 Aggregate amount of unquoted investments before impairment 2,003.2 1,748.4 1,530.2 Aggregate amount of impairment in value of investments 1,101.5 1,098.3 934.5
SUN PHARMACEUTICAL INDUSTRIES L IMITED206
NOTES TO THE CONSOLIDATED FINANCIAL STATEMENTS
FOR THE YEAR ENDED MARCH 31, 2017
Note 7
LOANS (NON-CURRENT)` in Million
As at As at As atMarch 31, 2017 March 31, 2016 April 01, 2015
Receivable on account of assets given under finance lease - secured, considered good (Refer note 55)
- 378.7 389.3
Loans to employees/othersSecured, considered good 20.4 - 40.3 Unsecured, considered good 677.7 694.5 1,400.5 Doubtful 0.8 2.7 1.9 Less: Allowance for bad and doubtful loans (0.8) (2.7) (1.9)
698.1 1,073.2 1,830.1
Note 8
OTHER FINANCIAL ASSETS (NON-CURRENT)` in Million
As at As at As atMarch 31, 2017 March 31, 2016 April 01, 2015
Bank deposits with more than 12 months maturity 4,589.2 7,631.4 - Interest accrued on investment - - 48.9 Security deposits 462.0 390.8 441.2 Derivatives designated and effective in hedge accounting relationships 67.1 - - Derivatives not designated as hedges 627.7 1,442.2 1,011.5 Others 706.2* 345.5* 81.8
6,452.2 9,809.9 1,583.4 * includes receivable towards sale of manufacturing facility
Note 9
INCOME TAX ASSET (NET) [NON-CURRENT]` in Million
As at As at As atMarch 31, 2017 March 31, 2016 April 01, 2015
Advance income tax (net of provisions) 31,250.1 15,726.2 11,238.8 31,250.1 15,726.2 11,238.8
As at As at As atMarch 31, 2017 March 31, 2016 April 01, 2015
Capital advances 3,971.7 4,181.3 3,770.5 Prepaid expenses 91.1 87.6 47.0 Balances with government authorities 2,058.5 1,080.0 1,382.8 Advance for supply of goods and services 722.8 777.2 698.1 Other assets 17.7 26.7 35.8
6,861.8 6,152.8 5,934.2
Note 11
INVENTORIES` in Million
As at As at As atMarch 31, 2017 March 31, 2016 April 01, 2015
Lower of cost and net realisable valueRaw materials and packing materials 21,212.3 19,428.8 18,159.7 Goods in transit 598.7 1,067.0 604.0
4,709.0 5,706.4 5,466.7 Stores, spares and other materials 1,350.9 940.7 772.4 Goods in transit 3.2 2.4 1.3
1,354.1 943.1 773.7 68,328.1 64,225.4 56,668.9
(i) Inventory write downs are accounted, considering the nature of inventory, ageing, liquidation plan and net realisable value. Write downs of inventories amounted to ` 9,174.9 Million (March 31, 2016: ` 8,253.8 Million; April 01, 2015: ` 7,482.6 Million). The changes in write downs are recognised as an expense in the consolidated statement of profit and loss.
(ii) For details of inventories pledged as security refer note 69.
(iii) The cost of inventories recognised as an expense is disclosed in Notes 33, 34 and 37 and as purchases of stock-in-trade in the consolidated statement of profit and loss.
SUN PHARMACEUTICAL INDUSTRIES L IMITED208
NOTES TO THE CONSOLIDATED FINANCIAL STATEMENTS
FOR THE YEAR ENDED MARCH 31, 2017
Note 12
INVESTMENTS (CURRENT) ` in Million
As at As at As atMarch 31, 2017 March 31, 2016 April 01, 2015
FS INVT CORP COM 22,316 14.2 14,659 9.1 - 3.8 In bonds/debenturesQuoted
0% 750 Debentures of IDFC of ` 1,000,000 maturing on April 9, 2015
- - - - 750 743.6
9.7% 250 Secured Non Convertible Redeemable Debentures of Housing Development Finance Corporation Ltd of ` 1,000,000 maturing on December 23, 2018
- - - - 250 252.5
I Shares New York Amt Free Muni 6,032 43.1 3,863 28.8 3,066 21.5 SPDR Ser TR Barclays Long - 2.0 - 1.9 - 1.9 Investment in bonds (Various small value investments) - 170.8 - 197.0 - 188.9
In Mutual funds*Unquoted Unit of ` 10 each fully paid
DHFL Pramercia - Insta Cash Plus Fund - Direct Plan - Growth 14,561 3.1 181,124 35.7 - - JP Morgan India -Liquid Fund - Growth Plan - - - - 2,671,655 48.5 DSP Merrill Lynch Mutual Fund - DSP BlackRock FMP -Series 161 - 12M-Dir-Growth
- - - - 20,000,000 217.9
Deutsche Mutual Fund-DWS Fixed Maturity Plan Series 63-Regular Plan-Growth
- - - - 15,000,000 163.7
Deutsche Mutual Fund - DWS Interval Fund - Annual Plan Series 1 Direct - Growth
- - - - 18,416,715 213.0
ICICI Prudential Mutual Fund-ICICI Prudential FMP Series 73-391 Days Plan G Direct Plan Cumulative
- - - - 25,000,000 275.3
ICICI Prudential Mutual Fund - ICICI Prudential FMP Series 73 - 369 Days Plan T Direct Plan Cumulative
- - - - 20,000,000 218.5
ICICI Prudential Mutual Fund - ICICI Prudential FMP Series 74 - 367 Days Plan D Direct Plan Cumulative
- - - - 40,000,000 434.5
ICICI Prudential Mutual Fund - ICICI Prudential FMP Series 74 - 368 Days Plan J Direct Plan Cumulative
- - - - 20,000,000 216.0
ICICI Prudential Mutual Fund - ICICI Prudential FMP Series 74 - 369 Days Plan K Direct Plan Cumulative
- - - - 15,000,000 161.5
ICICI Prudential Mutual Fund - ICICI Prudential FMP Series 74-370 Days Plan S Direct Plan Cumulative
- - - - 20,000,000 214.2
ICICI Prudential Mutual Fund - ICICI Prudential FMP Series 74 - 369 Days Plan B Direct Plan Cumulative
- - - - 30,000,000 325.9
Kotak Mutual Fund-Kotak FMP Series 145 Direct-Growth
- - - - 35,000,000 385.5
Kotak Mutual Fund - Kotak FMP Series 155 Direct-Growth
Unit of ` 1000 each fully paidAxis Mutual Fund - Axis Liquid Fund-Direct Growth 110,943 200.1 - - - - Axis Mutual Fund - Axis Liquid Fund- Direct Plan Growth-CFDG
As at As at As atMarch 31, 2017 March 31, 2016 April 01, 2015
UnsecuredConsidered good 72,026.1 67,756.6 50,927.5 Doubtful 2,109.9 1,955.7 1,395.6
74,136.0 69,712.3 52,323.1 Less: Allowance for doubtful debts (expected credit loss allowance) (2,109.9) (1,955.7) (1,395.6)
72,026.1 67,756.6 50,927.5
Note 14
CASH AND CASH EQUIVALENTS` in Million
As at As at As atMarch 31, 2017 March 31, 2016 April 01, 2015
Balance with BanksIn current accounts 49,192.3 53,731.0 57,564.2 In deposit accounts with original maturity less than 3 months 35,576.1 26,858.8 14,896.4
Cheques, drafts on hand 1,813.9 143.6 164.4 Cash on hand 45.7 18.0 20.9
86,628.0 80,751.4 72,645.9
Note 15
BANK BALANCES OTHER THAN DISCLOSED IN NOTE 14 ABOVE` in Million
As at As at As atMarch 31, 2017 March 31, 2016 April 01, 2015
Deposit accounts (*) 64,573.9 50,904.8 36,957.8 Earmarked balances with banks
Unpaid dividend accounts 59.3 63.0 58.5 Balances held as margin money or security against guarantees and other commitments (*)
147.2 97.3 108.5
64,780.4 51,065.1 37,124.8 (*) Other bank balances include deposits amounting to ` 25,700.8 Million (March 31, 2016: ` 46,848.6 Million; April 01, 2015: ` 28,052.4 Million) and margin
monies amounting to ` 70.2 Million (March 31, 2016: ` 97.3 Million; April 01, 2015: ` 96.1 Million) which have an original maturity of more than 12 months.
SUN PHARMACEUTICAL INDUSTRIES L IMITED212
NOTES TO THE CONSOLIDATED FINANCIAL STATEMENTS
FOR THE YEAR ENDED MARCH 31, 2017
Note 16
LOANS (CURRENT)` in Million
As at As at As atMarch 31, 2017 March 31, 2016 April 01, 2015
Receivable on account of assets under finance lease - secured, considered good (Refer note 55)
- 10.6 10.0
Loans to related parties (Refer notes 49 and 70)Unsecured, considered good 454.0 - 238.0Doubtful 512.0 512.0 274.0 Less: allowance for doubtful loans (512.0) (512.0) (274.0)
454.0 - 238.0Loans to employees/others
Secured, considered good 8.7 409.0 3,360.6 Unsecured, considered good 9,728.1 10,295.9 6,873.0Doubtful 4.5 4.5 4.5 Less: allowance for doubtful Loans (4.5) (4.5) (4.5)
As at As at As atMarch 31, 2017 March 31, 2016 April 01, 2015
Interest accrued on investments/balances with banks 599.9 284.4 90.8 Interest accrued and due on loans (Refer notes 70)
Considered good 0.2 4.9 88.8 Doubtful 214.9 151.5 - Less: allowance for doubtful interest accrued and due on loans (214.9) (151.5) -
0.2 4.9 88.8 Security deposits 70.9 177.8 130.1 Derivatives not designated as hedges 627.7 92.4 934.7 Other* 959.8 331.3 25,507.5
2,258.5 890.8 26,751.9* As at March 31, 2017 and as at March 31, 2016 includes receivable towards sale of assets/manufacturing facilities. As at April 01, 2015 includes receivable from a third party, which has agreed to bear damages paid by a subsidiary on account of patent infringement in consideration of the Group agreeing to sell them pharmaceutical products at a negotiated discounted price for a specified period.
Note 18
OTHER CURRENT ASSETS ` in Million
As at As at As atMarch 31, 2017 March 31, 2016 April 01, 2015
Export incentives receivable 2,159.2 1,936.4 1,500.4 Prepaid expenses 2,601.6 2,537.3 2,537.4 Advances for supply of goods and services 9,023.1 4,422.7 1,828.9 Balances with government authorities 8,997.8 7,855.3 6,537.4 Other 168.2 46.5 115.3
C) Items of other comprehensive income (OCI)Debt instrument through other comprehensive income (3.4) 1.3 - Equity instrument through other comprehensive income 339.7 4,081.1 6,883.5 Foreign currency translation reserve 7,015.7 15,943.1 - Effective portion of cash flow hedges 46.2 - -
Total reserves and surplus 363,997.4 327,418.2 278,008.5
Nature and purpose of each reserveCapital reserve - During amalgamation / merger / acquisition, the excess of net assets taken, over the consideration paid, if any, is treated as capital reserve.
Securities premium reserve - The amount received in excess of face value of the equity shares is recognised in Securities Premium Reserve. In case of equity-settled share based payment transactions, the difference between fair value on grant date and nominal value of share is accounted as securities premium reserve. This reserve is utilised in accordance with the provisions of the Companies Act, 2013.
SUN PHARMACEUTICAL INDUSTRIES L IMITED214
NOTES TO THE CONSOLIDATED FINANCIAL STATEMENTS
FOR THE YEAR ENDED MARCH 31, 2017
Debenture redemption reserve - The Company is required to create a debenture redemption reserve out of the profits which is available for payment of dividend. This reserve was transferred to general reserve on redemption of debentures.
Share option outstanding account - The fair value of the equity settled share based payment transactions is recognised to share option outstanding account.
Revaluation reserve - Revaluation reserve is utilised in accordance with provisions of the Companies Act 2013.
Amalgamation reserve - The reserve was created pursuant to scheme of amalgamation in earlier years.
Capital redemption reserve - The Company has recognised capital redemption reserve on buyback of equity shares from its retained earnings. The amount in Capital Redemption Reserve is equal to nominal amount of the equity shares bought back.
Legal reserve - The reserve has been created by an overseas subsidiary in compliance with requirements of local laws.
General Reserve - The reserve arises on transfer portion of the net profit pursuant to the earlier provisions of Companies Act 1956. Mandatory transfer to general reserve is not required under the Companies Act, 2013.
Debt instrument through OCI - The Company has elected to recognise changes in the fair value of certain investment in debt instrument in other comprehensive income. This amount will be reclassified to retained earnings on derecognition of debt instrument.
Equity instrument through OCI - The Company has elected to recognise changes in the fair value of certain investment in equity instrument in other comprehensive income. This amount will be reclassified to retained earnings on derecognition of equity instrument.
Foreign currency translation reserve - Exchange differences relating to the translation of the results and net assets of the Group’s foreign operations from their functional currencies to the Group’s presentation currency (i.e. `) are recognised directly in the other comprehensive income and accumulated in foreign currency translation reserve. Exchange difference in the foreign currency translation reserve are reclassified to profit or loss on the disposal of the foreign operation.
Effective portion of cash flow hedges -The cash flow hedging reserve represents the cumulative effective portion of gains or losses arising on changes in fair value of designated portion of hedging instruments entered into for cash flow hedges. The cumulative gain or loss arising on the changes of the fair value of the designated portion of the hedging instruments that are recognised and accumulated under the cash flow hedge reserve will be reclassified to profit or loss only when the hedged transaction affects the profit or loss, or included as a basis adjustment to the non-financial hedged item.
OTHER FINANCIAL LIABILITIES (NON-CURRENT)` in Million
As at As at As at
March 31, 2017 March 31, 2016 April 01, 2015Trade/security deposits received - 212.7 219.7 Interest accrued - 4.9 3.4 Derivatives not designated as hedge - - 253.5 Other financial liabilities* 1,048.0 1,624.6 1,340.1
1,048.0 1,842.2 1,816.7
* includes contractual and expected milestone obligation
Note 23
PROVISIONS (NON-CURRENT)` in Million
As at As at As at
March 31, 2017 March 31, 2016 April 01, 2015Employee benefits (Refer note 56) 3,146.3 2,353.9 1,894.6 Others (Refer note 61) 8,964.8 16,604.7 21,179.9
12,111.1 18,958.6 23,074.5
SUN PHARMACEUTICAL INDUSTRIES L IMITED216
NOTES TO THE CONSOLIDATED FINANCIAL STATEMENTS
FOR THE YEAR ENDED MARCH 31, 2017
Note 24
OTHER NON-CURRENT LIABILITIES` in Million
As at As at As at
March 31, 2017 March 31, 2016 April 01, 2015Advances from customer 6.2 - - Deferred government grants (Refer note 72) 137.9 166.5 129.8 Deferred revenue 105.7 87.8 - Others 9.3 - -
259.1 254.3 129.8
Note 25
BORROWINGS (CURRENT)` in Million
As at As at As at
March 31, 2017 March 31, 2016 April 01, 2015Loans repayable on demand
March 31, 2017 March 31, 2016 April 01, 2015Current maturities of long-term debt (Refer note 68) 17,368.2 1,770.7 13,975.8 Current maturities of finance lease obligations (Refer note 68) 39.5 32.7 21.9 Interest accrued 384.1 439.2 320.3 Unpaid dividends 76.6 72.8 65.7 Security deposits 179.4 17.7 15.8 Payables on purchase of property, plant and equipment 1,940.7 2,086.3 1,226.8 Derivatives designated as hedge 26.6 - - Derivatives not designated as hedge 217.4 216.1 5,322.6 Others* 1,883.8 2,237.8 3,188.5
22,116.3 6,873.3 24,137.4 * includes claims, recall charges, contractual and expected milestone obligations, trade and other commitments.
Note 28
OTHER CURRENT LIABILITIES` in Million
As at As at As at
March 31, 2017 March 31, 2016 April 01, 2015Statutory remittances 3,082.7 3,583.5 3,258.5 Advance from customers 1,205.8 719.1 370.0 Deferred revenue 13.4 - 6.6 Deferred government grants (Refer note 72) 12.6 - - Others 306.0 166.8 602.7
4,620.5 4,469.4 4,237.8
Note 29
PROVISIONS (CURRENT)` in Million
As at As at As at
March 31, 2017 March 31, 2016 April 01, 2015Employee benefits (Refer note 56) 2,220.3 1,631.5 1,717.2 Others (Refer note 61) 37,938.8 28,102.9 22,729.8
40,159.1 29,734.4 24,447.0
Note 30
CURRENT TAX LIABILITIES (NET)` in Million
As at As at As at
March 31, 2017 March 31, 2016 April 01, 2015Provision for income tax [Net of advance income tax] 1,471.2 2,472.1 5,914.7
1,471.2 2,472.1 5,914.7
SUN PHARMACEUTICAL INDUSTRIES L IMITED218
NOTES TO THE CONSOLIDATED FINANCIAL STATEMENTS
FOR THE YEAR ENDED MARCH 31, 2017
Note 31
REVENUE FROM OPERATIONS ` in Million
Year ended Year ended March 31, 2017 March 31, 2016
Sale of products (including excise duty) 302,642.3 278,880.7 Other operating revenues 13,142.1 5,989.6
315,784.4 284,870.3
Note 32
OTHER INCOME` in Million
Year ended Year ended March 31, 2017 March 31, 2016
Interest Income on:Bank deposits at amortised cost 1,602.3 1,263.3 Loans and advances at amortised cost 769.3 1,048.2 Investments carried at amortised cost 73.4 119.8 Investments in debt instruments at fair value through other comprehensive income 61.0 -Investments carried at fair value through profit or loss 9.7 5.1 Other financial assets carried at amortised cost 852.7 913.7 Financial guarantee given measured at fair value through profit or loss 2.5 2.0 Others 340.8 220.1
3,711.7 3,572.2 Dividend income on investments 420.5 502.9 Gain on sale of financial assets measured at fair value through profit or loss 479.3 528.0 Net gain arising on financial assets measured at fair value through profit or loss 72.2 353.3 Gain on disposal of property, plant and equipment and other intangible assets 18.7 591.7 Sundry balances written back 618.5 175.2 Insurance claims 134.4 284.7 Lease rental and hire charges 249.4 243.9 Income from government grants 20.9 - Gain on disposal of an associate entity 201.3 - Miscellaneous income 304.6 330.6
6,231.5 6,582.5
Note 33
COST OF MATERIALS CONSUMED` in Million
Year ended Year ended March 31, 2017 March 31, 2016
Raw and packing materialsInventories at the beginning of the year 20,495.8 18,763.7 Inventories acquired on acquisition (Refer note 78) 171.0 3,724.3 Purchases during the year 52,565.2 40,276.5 Foreign currency translation difference (174.9) (452.4)Inventories at the end of the year (21,811.0) (20,495.8)
CHANGES IN INVENTORIES OF FINISHED GOODS, STOCK-IN-TRADE AND WORK-IN-PROGRESS` in Million
Year ended Year ended March 31, 2017 March 31, 2016
Inventories at the beginning of the year 42,786.5 37,131.5 Foreign currency translation difference (339.8) 1,717.3 Inventories at the end of the year (45,163.0) (42,786.5)
(2,716.3) (3,937.7)
Note 35
EMPLOYEE BENEFITS EXPENSE` in Million
Year ended Year ended March 31, 2017 March 31, 2016
Salaries and wages 43,229.1 40,115.5 Contribution to provident and other funds 3,001.0 3,854.5 Share based payments to employees 32.3 98.8 Staff welfare expenses 2,760.6 3,654.3
49,023.0 47,723.1
Note 36
FINANCE COSTS ` in Million
Year ended Year ended March 31, 2017 March 31, 2016
Interest expense for financial liabilities carried at amortised cost 2,854.6 2,424.7 Interest expense others 10.9 68.3Exchange differences regarded as an adjustment to borrowing costs 694.7 2,201.4 Unwinding of discounts on provisions 437.8 538.0
3,998.0 5,232.4
SUN PHARMACEUTICAL INDUSTRIES L IMITED220
NOTES TO THE CONSOLIDATED FINANCIAL STATEMENTS
FOR THE YEAR ENDED MARCH 31, 2017
Note 37
OTHER EXPENSES` in Million
Year ended Year ended March 31, 2017 March 31, 2016
Consumption of materials, stores and spare parts 6,531.0 5,633.7 Conversion and other manufacturing charges 6,408.8 4,407.1 Power and fuel 5,250.9 5,454.4 Rent 1,237.8 1,329.6 Rates and taxes 3,022.3 2,659.2 Insurance 1,068.2 1,253.0 Selling and distribution 20,736.5 17,266.1 Commission on sale 1,130.0 1,462.6 Repairs and maintenance 4,097.0 4,145.1 Printing and stationery 859.7 761.6 Travelling and conveyance 5,250.1 3,671.3 Freight outward and handling charges 3,339.9 3,894.8 Communication 726.1 774.3 Provision/write off for doubtful trade receivables/advances 341.8 1,602.1 Professional, legal and consultancy 14,642.6 18,862.0 Donations 32.1 173.9 Loss on sale/write off of property, plant and equipment 127.5 155.8 Net (gain) / loss on foreign currency transactions (3,730.7) 2,925.0 Excise duty on sales 2,703.0 3,784.2 (Decrease)/increase of excise duty on inventories (5.2) 115.4 Payment to auditors (net of input credit, where applicable)
For audit [includes Nil (Previous year ` 0.7 Million) in respect of previous year] 170.4 193.3 For taxation matters 5.7 16.6 For other services 52.1 46.7 Reimbursement of expenses 4.7 0.9
Impairment of investments 6.8 166.8 Impairment of non-current investment in an associate [` Nil (Previous Year ` 16,380)] - 0.0 Impairment of property, plant and equipment and other intangible assets 203.6 511.2 Miscellaneous expenses 10,348.6 10,993.5
RESEARCH AND DEVELOPMENT EXPENDITURE INCLUDED IN THE CONSOLIDATED STATEMENT OF PROFIT AND LOSS
` in Million Year ended Year ended
March 31, 2017 March 31, 2016Salaries and wages 5,270.2 4,872.2 Contribution to provident and other funds 406.3 441.7 Staff welfare expenses 228.0 368.6 Consumption of materials, stores and spare parts 3,976.2 3,443.1 Power and fuel 366.3 347.8 Rates and taxes 318.0 104.0 Rent 92.9 136.9 Insurance 41.1 39.1 Repairs and maintenance 583.2 549.8 Printing and stationery 40.2 37.9 Travelling and conveyance 209.6 319.5 Communication 57.1 80.9 Professional, legal and consultancy 7,939.4 9,933.4 Loss on sale/write off of property, plant and equipment, Net (0.4) 0.6 Miscellaneous expenses 1,930.4 1,566.9
21,458.5 22,242.4 Less:Interest Income 2.0 2.1 Miscellaneous income 9.2 13.9 Receipts from Research activities 423.0 938.6
434.2 954.6 21,024.3 21,287.8
Note 39
a) List of entities included in the Consolidated Financial Statements is as under:Name of Subsidiaries Country of Incorporation Proportion of ownership interest for the year ended
March 31, 2017 March 31, 2016 April 01, 2015Parent CompanySun Pharmaceutical Industries LimitedDirect Subsidiaries
1 Green Eco Development Centre Limited India 100.00% 100.00% 100.00%2 Sun Pharmaceutical (Bangladesh) Limited Bangladesh 72.50% 72.50% 72.50%3 Sun Pharmaceutical Industries, Inc. United States of America 100.00% 100.00% 100.00%4 Sun Farmaceutica do Brasil Ltda. Brazil 100.00% 100.00% 100.00%5 Sun Pharma De Mexico S.A. DE C.V. Mexico 75.00% 75.00% 75.00%6 SPIL De Mexico S.A. DE C.V. Mexico 100.00% 100.00% 100.00%7 Sun Pharmaceutical Peru S.A.C. Peru 99.33% 99.33% 99.33%8 OOO "Sun Pharmaceutical Industries" Limited Russia 100.00% 100.00% 99.00%9 Sun Pharma De Venezuela, C.A. Venezuela 100.00% 100.00% 100.00%10 Sun Pharma Laboratories Limited India 100.00% 100.00% 100.00%11 Faststone Mercantile Company Private Limited India 100.00% 100.00% 100.00%12 Neetnav Real Estate Private Limited India 100.00% 100.00% 100.00%13 Realstone Multitrade Private Limited India 100.00% 100.00% 100.00%14 Skisen Labs Private Limited India 100.00% 100.00% 100.00%15 Sun Pharma Holdings Mauritius 100.00% 100.00% 100.00%
SUN PHARMACEUTICAL INDUSTRIES L IMITED222
NOTES TO THE CONSOLIDATED FINANCIAL STATEMENTS
FOR THE YEAR ENDED MARCH 31, 2017
a) List of entities included in the Consolidated Financial Statements is as under:Name of Subsidiaries Country of Incorporation Proportion of ownership interest for the year ended
March 31, 2017 March 31, 2016 April 01, 201516 Softdeal Trading Company Private Limited India 100.00% 100.00% 100.00%17 Ranbaxy Pharmacie Generiques France 100.00% 100.00% 100.00%18 Ranbaxy Drugs Limited India 100.00% 100.00% 100.00%19 Vidyut Investments Limited India 100.00% 100.00% 100.00%20 Gufic Pharma Limited India 100.00% 100.00% 100.00%21 Ranbaxy (Malaysia) Sdn. Bhd. Malaysia 71.22% 71.22% 71.22%22 Ranbaxy Nigeria Limited Nigeria 85.31% 85.31% 85.31%23 Ranbaxy (Netherlands) B.V. Netherlands 100.00% 100.00% 100.00%24 Foundation for Disease Elimination
and Control of IndiaIndia 100.00% - -
Step down Subsidiaries25 Caraco Pharma Inc. United States of America - 100.00%
(see note f)100.00%
26 Chattem Chemicals Inc. United States of America 100.00% 100.00% 100.00%27 The Taro Development Corporation United States of America 100.00% 100.00% 100.00%28 Alkaloida Chemical Company Zrt. Hungary 99.99% 99.99% 99.99%29 Sun Pharmaceuticals UK Limited United Kingdom 100.00% 100.00% 100.00%30 Sun Pharmaceutical Industries (Australia) Pty
LimitedAustralia 100.00% 100.00% 100.00%
31 Aditya Acquisition Company Ltd. Israel 100.00% 100.00% 100.00%32 Sun Pharmaceutical Industries (Europe) B.V. Netherlands 100.00% 100.00% 100.00%33 Sun Pharmaceuticals Italia S.R.L. Italy 100.00% 100.00% 100.00%34 Sun Pharmaceuticals Spain, S.L.U. Spain 100.00%
(see note g)100.00% 100.00%
35 Sun Pharmaceuticals Germany GmbH Germany 100.00% 100.00% 100.00%36 Sun Pharmaceuticals France France 100.00% 100.00% 100.00%37 Sun Pharma Global FZE United Arab Emirates 100.00% 100.00% 100.00%38 Sun Pharmaceuticals (SA) (Pty) Ltd. South Africa 100.00% 100.00% 100.00%39 Sun Global Canada Pty. Ltd. Canada 100.00% 100.00% 100.00%40 Sun Pharma Philippines, Inc. Philippines 100.00% 100.00% 100.00%41 Sun Pharmaceuticals Korea Ltd. Korea 100.00% 100.00% 100.00%42 Sun Global Development FZE United Arab Emirates 100.00% 100.00% 100.00%43 Caraco Pharmaceuticals Private Limited India 100.00% 100.00% 100.00%44 Sun Pharma Japan Ltd. Japan 100.00% 100.00% 100.00%45 Sun Pharma Healthcare FZE United Arab Emirates 100.00% 100.00% 100.00%46 Morley & Company, Inc. United States of America 100.00% 100.00% 100.00%47 Sun Laboratories FZE United Arab Emirates 100.00% 100.00% 100.00%48 Taro Pharmaceutical Industries Ltd. (TARO) Israel (See note b) 72.81% 68.98% 68.87%49 Taro Pharmaceuticals Inc. Canada 72.81% 68.98% 68.87%50 Taro Pharmaceuticals U.S.A., Inc. United States of America 72.81% 68.98% 68.87%51 Taro Pharmaceuticals North America, Inc. Cayman Islands, British
West Indies72.81% 68.98% 68.87%
52 Taro Pharmaceuticals Europe B.V. Netherlands 72.81% 68.98% 68.87%53 Taro Pharmaceuticals Ireland Limited Ireland 72.81% 68.98% 68.87%54 Taro International Ltd. Israel 72.81% 68.98% 68.87%55 Taro Pharmaceuticals (UK) Limited United Kingdom 72.81% 68.98% 68.87%
a) List of entities included in the Consolidated Financial Statements is as under:Name of Subsidiaries Country of Incorporation Proportion of ownership interest for the year ended
March 31, 2017 March 31, 2016 April 01, 201556 Taro Hungary Intellectual Property Licensing
Limited Liability Company Hungary 72.81%
(see note h)68.98% 68.87%
57 3 Skyline LLC United States of America 72.81% 68.98% 68.87%58 One Commerce Drive LLC United States of America 72.81% 68.98% 68.87%59 Taro Pharmaceutical Laboratories Inc United States of America 72.81% 68.98% 68.87%60 Taro Pharmaceuticals Canada, Ltd. Canada 72.81% 68.98% 68.87%61 Taro Pharmaceutical India Private Limited India (see note i) 72.81% 68.98% 68.87%62 Alkaloida Sweden AB Sweden 100.00% 100.00% 100.00%63 Dusa Pharmaceuticals, Inc. United States of America 100.00% 100.00% 100.00%64 Dusa Pharmaceuticals New York, Inc. United States of America 100.00%
(see note j)100.00% 100.00%
65 Sirius Laboratories Inc United States of America 100.00% (see note k)
100.00% 100.00%
66 URL Pharma, Inc United States of America - 100.00% (see note l)
100.00%
67 AR Scientific, Inc United States of America - 100.00% (see note m)
100.00%
68 Mutual Pharmaceutical Company Inc. United States of America 100.00% 100.00% 100.00%69 United Research Laboratories, Limited United States of America - 100.00%
(see note n)100.00%
70 Dungan Mutual Associates, LLC United States of America 100.00% 100.00% 100.00%71 URL PharmPro, LLC United States of America 100.00% 100.00% 100.00%72 2 Independence Way LLC United States of America 100.00% 100.00% -73 Thallion Pharmaceutical Inc., United States of America 100.00% - -74 Universal Enterprises Private Limited India 100.00% 100.00% 100.00%75 Sun Pharma Switzerland Limited Switzerland 100.00% 100.00% 100.00%76 Silverstreet Developers LLP India - 100.00%
(see note p)100.00%
77 Sun Pharma East Africa Limited Kenya 100.00% 100.00% 100.00%78 Pharmalucence, Inc. United States of America 100.00% 100.00% 100.00%79 PI Real Estate Ventures, LLC United States of America 100.00% 100.00% 100.00%80 Sun Pharma ANZ Pty Ltd (Formerly known as
Ranbaxy Australia Pty Ltd)Australia 100.00% 100.00% 100.00%
81 Ranbaxy Belgium N.V. Belgium - 100.00% (see note q)
known as Ranbaxy - PRP (Peru) S.A.C.)Peru 100.00% 100.00% 100.00%
92 Ranbaxy (Poland) Sp. Z o.o. Poland 100.00% 100.00% 100.00%93 Ranbaxy Portugal - Com E Desenvolv DeProd
Farmaceuticos Unipessoal LdaPortugal - 100.00%
(see note r)100.00%
SUN PHARMACEUTICAL INDUSTRIES L IMITED224
NOTES TO THE CONSOLIDATED FINANCIAL STATEMENTS
FOR THE YEAR ENDED MARCH 31, 2017
a) List of entities included in the Consolidated Financial Statements is as under:Name of Subsidiaries Country of Incorporation Proportion of ownership interest for the year ended
March 31, 2017 March 31, 2016 April 01, 201594 S.C Terapia S.A. Romania 96.70% 96.70% 96.70%95 AO Ranbaxy (Formerly known as ZAO Ranbaxy) Russia 100.00% 100.00% 100.00%96 Ranbaxy South Africa Proprietary Limited South Africa 100.00% 100.00% 100.00%97 Ranbaxy Pharmaceutical Proprietary Limited South Africa 100.00% 100.00% 100.00%98 Be-Tabs Investments Proprietary Limited South Africa 100.00% 100.00% 100.00%99 Sonke Pharmaceuticals Proprietary Limited South Africa 70.00% 70.00% 70.00%100 Laboratorios Ranbaxy, S.L.U. Spain 100.00% 100.00% 100.00%101 Ranbaxy (U.K.) Limited United Kingdom 100.00% 100.00% 100.00%102 Ranbaxy Holdings (U.K.) Limited United Kingdom 100.00% 100.00% 100.00%103 Ranbaxy Europe Limited United Kingdom 100.00% 100.00% 100.00%104 Ranbaxy Inc. United States of America 100.00% 100.00% 100.00%105 Ranbaxy Pharmaceuticals, Inc. United States of America 100.00% 100.00% 100.00%106 Ranbaxy (Thailand) Company Limited Thailand 100.00% 100.00% 100.00%107 Ohm Laboratories, Inc. United States of America 100.00% 100.00% 100.00%108 Ranbaxy Laboratories, Inc. United States of America 100.00% 100.00% 100.00%109 Ranbaxy Signature LLC United States of America 67.50% 67.50% 67.50%110 Sun Pharmaceuticals Morocco LLC (Formerly
known as Ranbaxy Morocco LLC) Morocco 100.00% 100.00% 100.00%
111 "Ranbaxy Pharmaceuticals Ukraine" LLC Ukraine 100.00% 100.00% 100.00%112 Perryton Wind Power LLC United States of America 100.00%
(see note s)100.00% -
113 Insite Vision Incorporated United States of America 100.00% 100.00% -114 Insite Vision Ltd. United Kingdom 100.00% 100.00% -115 Thea Acquisition Corporation United States of America - 100.00%
(see note t)-
116 Zalicus Pharmaceuticals Limited Canada - 100.00% (see note u)
-
117 Ocular Technologies SARL Switzerland 100.00% - -118 Sun Pharmaceutical Medicare Limited India 100.00% - -
119 JSC Biosintez Russia 85.10% - -120 Sun Pharmaceuticals Holdings USA, INC United States of America 100.00% - -121 Sun Pharma Medisales Private Limited
(Formerly known as Solrex Pharmaceuticals Company)
India 100.00% (see note v)
- -
Name of Partnership Firm122 Sun Pharma Medisales Private Limited
(Formerly known as Solrex Pharmaceuticals Company)
India - 100.00% (see note v)
100.00%
Name of Joint Venture Entities123 MSD - Sun LLC United States of America 50.00%
(see note w)50.00% 50.00%
124 S & I Ophthalmic LLC United States of America 50.00% 50.00% 50.00%125 Artes Biotechnology GmbH Germany 45.00% 45.00% 45.00%
a) List of entities included in the Consolidated Financial Statements is as under:Name of Subsidiaries Country of Incorporation Proportion of ownership interest for the year ended
March 31, 2017 March 31, 2016 April 01, 2015Name of Subsidiary of Joint Venture Entity126 MSD - Sun FZ LLC United Arab Emirates 50.00%
(see note x)50.00% 50.00%
Name of Associates127 Zenotech Laboratories Limited India 46.84% 46.84% 46.84%128 Daiichi Sankyo (Thailand) Ltd. Thailand 26.90%
(see note y)26.90% 26.90%
129 Medinstill LLC United States of America 19.99% 19.99% 19.99%130 Fraizer Healthcare VII, L.P. United States of America 6.83% 6.83% 6.83%131 Versant Venture Capital V, L.P. United States of America 7.75% 7.75% 7.75%132 Generic Solar Power LLP India 28.76% 28.76% -133 scPharmaceuticals Inc. United States of America 14.58% - -134 Trumpcard Advisors and Finvest LLP India 40.61% - -
b Following are the details of the Group’s holding in Taro: March 31, 2017 March 31, 2016 April 01, 2015Voting power 81.87% 79.32% 79.24%Beneficial ownership 72.81% 68.98% 68.87%
c In respect of entities at Sr. Nos. 4 to 8, 95, 111, 113, 114, 117, 119 and 125 the reporting date is as of December 31, 2016 and different from the reporting date of the Parent Company. Adjustments have been made for significant transactions of these subsidiaries for the periods from January 01, 2016 to March 31, 2016 and January 01, 2017 to March 31, 2017, on the basis of their management accounts for the said periods.
d Entities at Sr. No. 24, 73, 117, 118, 119, 120, 133 and 134 have been incorporated / acquired during the year ended March 31, 2017.e Foundation for Disease Elimination and Control of India (FDEC), a wholly owned subsidiary incorporated in India on September 21, 2016
by the Company as part of its Corporate Social Responsibility (CSR) initiative. FDEC has entered into an MOU with Indian Council of Medical Research (ICMR) and Madhya Pradesh State Government to undertake the Mandla Malaria Elimination Demonstration Project with a goal to eliminate Malaria in the state. FDEC is a Section 8 company not considered for consolidation since it can apply its income for charitable purposes only and can raise funds/contribution independently.
f With effect from August 20, 2015, Caraco Pharma Inc., has been merged with Sun Pharmaceutical Industries, Inc.g With effect from March 02, 2017, Sun Pharmaceuticals Spain, S.L.U. has been liquidated. h With effect from February 16, 2017, Taro Hungary Intellectual Property Licensing Limited Liability Company has been liquidated. i Taro Pharmaceutical India Private Limited is under liquidation.j With effect from August 16, 2016 Dusa Pharmaceuticals New York, Inc. has been dissolved.k With effect from February 22, 2017 Sirius Laboratories Inc has been dissolved. l With effect from April 01, 2015, URL Pharma Inc., has merged into Mutual Pharmaceutical Company, Inc.m With effect from April 01, 2015, AR Scientific Inc. have merged into URL Pharma Inc. n With effect from April 01, 2015, United Research Laboratories Limited, have merged into URL Pharma Inc.o With effect from March 16, 2017, Thallion Pharmaceutical Inc. was acquired and merged with Taro Pharmaceuticals Inc. p During the previous year, the Company has sold its investment in Silverstreet Developers LLP with effect from April 01, 2015.q With effect from March 01, 2016, Ranbaxy Belgium N.V. has been liquidated. r With effect from June 30, 2015 Ranbaxy Portugal - Com E Desenvolv DeProd Farmaceuticos Unipessoal Lda has been liquidated.s With effect from April 07, 2016 Perryton Wind Power LLC has been liquidated.t With effect from November 02, 2015, Thea Acquisition Corporation has been merged with Insite Vision Incorporated.
SUN PHARMACEUTICAL INDUSTRIES L IMITED226
NOTES TO THE CONSOLIDATED FINANCIAL STATEMENTS
FOR THE YEAR ENDED MARCH 31, 2017
u Zalicus Pharmaceuticals Limited was acquired during the previous year and subsequently amalgamated in Taro Pharmaceuticals Inc., on October 05, 2015.
v During the year, Solrex Pharmaceuticals Company, a partnership firm has been converted into company which is known as Sun Pharma Medisales Private Limited.
w MSD - Sun LLC is under liquidation.x MSD-Sun FZ LLC has been deregistered with effect from September 14, 2015 having deregistration certificate dated December 25, 2016.y Daiichi Sankyo (Thailand) Ltd.’s shares were sold as per agreement dated May 13, 2016.z Significant Accounting Policies and other Notes to these Consolidated Financial Statements are intended to serve as a means of
informative disclosure and a guide for better understanding of the consolidated position of the Group. Recognising this purpose, the Group has disclosed only such policies and notes from the individual financial statements which fairly represent the needed disclosures. Lack of homogeneity and other similar considerations made it desirable to exclude some of them, which in the opinion of the management, could be better viewed when referred from the individual financial statements.
aa Disclosures mandated by the Companies Act, 2013 Schedule III Part II by way of additional information is given in Annexure A.
Note 40
CONTINGENT LIABILITIES (TO THE EXTENT NOT PROVIDED FOR)` in Million
As at As at As at
March 31, 2017 March 31, 2016 April 01, 2015A) Contingent Liabilities I) Claims against the Group not acknowledged as debts 1,147.6 1,127.5 1,021.3 II) Liabilities Disputed - Appeals filed with respect to :
Income Tax on account of Disallowances / Additions 56,712.6 30,915.7 26,706.7 Sales Tax on account of Rebate / Classification 45.7 38.8 37.9 Excise Duty on account of Valuation / Cenvat Credit 4,548.1 2,025.3 624.3 Environment cess 23.3 23.3 23.3 ESIC Contribution on account of applicability 132.8 0.2 0.2 Service tax on certain services performed outside India under reverse charge basis
- - 156.0
Drug Price Equalisation Account [DPEA] on account of demand towards unintended benefit, enjoyed by the Group
3,488.2 3,326.4 3,248.0
Demand by JDGFT, import duty with respect to import alleged to be in excess of entitlement as per the Advanced Licence Scheme
16.7 15.4 15.4
Fine imposed for anti-competitive settlement agreement by European Commission
715.4 773.0 689.1
Octroi demand on account of rate difference 171.0 171.0 171.0 Alleged breach of social security code contested by French subsidiary (maximum penalty amount)
- - 124.8
Other matters-employee /worker related cases, State Electricity Board, Punjab Land Preservation Act related matters etc.
III) LEGAL PROCEEDINGS The Parent Company and / or its subsidiaries are involved in various legal proceedings including product liability, contracts, employment
claims, anti-trust and other regulatory matters relating to conduct of its business. The respective company records a provision in the financial statements to the extent that it concludes that a liability is probable and estimable based on the status of these cases, advice of the counsel, management assessment of the likely damages etc. The Group carries product liability insurance / is contractually indemni-fied by the manufacturer, for an amount it believes is sufficient for its needs. In respect of other claims, the Group believes, these claims do not constitute material litigation matters and with its meritorious defences the ultimate disposition of these matters are not expected to have material adverse effect on its Financial Statements.
` in Million
As at As at As at
March 31, 2017 March 31, 2016 April 01, 2015IV) Trade commitments - - 530.6
Footnote:Future cash outflows in respect of the above matters are determinable only on receipt of judgements / decisions pending at various forums / authorities.
B) Guarantees Given by the bankers on behalf of the Group 2,250.5 819.1 776.9
Note 41
COMMITMENTS (TO THE EXTENT NOT PROVIDED FOR)` in Million
Commitments As at As at As at
March 31, 2017 March 31, 2016 April 01, 2015I) Estimated amount of contracts remaining to be executed on capital
III) Lease related commitments [Refer notes 55]IV) Investment related commitments 1,715.2 246.6 2,894.4 V) Letters of credit for imports 2,362.0 1,855.9 1,489.2
Note 42
DISCLOSURES RELATING TO SHARE CAPITALi Rights, Preferences and Restrictions attached to Equity Shares The Equity Shares of the Parent Company, having par value of ` 1 per share, rank pari passu in all respects including voting rights and
entitlement to dividend.
ii Reconciliation of the number of shares and amount outstanding at the beginning and at the end of reporting period (As at April 01, 2015 excluding share suspense account):
As at As at March 31, 2017 March 31, 2016
Number of shares ` in Million Number of
shares ` in Million
Equity shares of ` 1 eachOpening Balance 2,406,605,118 2,406.6 2,071,163,910 2,071.2 Add: Shares allotted during the year pursuant to the scheme of Amalgamation (Refer note 66)
- - 334,770,248 334.8
Add : Shares allotted to employees on exercise of employee stock options [excluding shares held by ESOP trust (Refer note 58)]
iii The movement of shares issued to ESOP Trust at face value is as follows (As at April 01, 2015 excluding share suspense account):
As at As at March 31, 2017 March 31, 2016
Equity shares of ` 1 each Number of shares ` in Million Number of
shares ` in Million
Opening balance 123,381 0.1 - -Add: Shares allotted during the year pursuant to scheme of amalgamation (Refer note 66)
- - 186,516 0.2
Add: Shares allotted to the ESOP trust - - 160,000 0.1 Less: shares allotted by ESOP trust on exercise of employee stock option (93,015) (0.1) (223,135) (0.2)Closing balance (March 31, 2017: ` 30,366) 30,366 0.0 123,381 0.1
iv 1,035,581,955 (upto March 31, 2016: 1,035,581,955; upto April 01, 2015: 1,035,581,955) equity shares of ` 1 each have been allotted as fully paid up bonus shares during the period of five years immediately preceding the date at which the Balance Sheet is prepared.
v 334,956,764 (upto March 31, 2016: 334,956,764; April 01, 2015: Nil) equity shares of ` 1 each have been allotted, pursuant to scheme of amalgamation, without payment being received in cash during the period of five years immediately preceding the date at which the Balance Sheet is prepared. (Refer note 66)
vi Refer note 58 for number of employee stock options against which equity shares are to be issued by the Parent Company / ESOP Trust upon vesting and exercise of those stock options.
vii 7,500,000 (upto March 31, 2016: Nil, upto April 01, 2015: Nil) equity shares of ` 1 each have been bought back during the period of five years immediately preceding the date at which the Balance Sheet is prepared. The shares bought back in the current year were cancelled immediately. (Refer note 65)
viii Equity Shares held by each shareholder holding more than 5 percent Equity Shares (As at April 01, 2015 excluding Share Suspense Account) in the Parent Company are as follows:
Name of Shareholders As at March 31, 2017 As at March 31, 2016 As at April 01, 2015
Loans to related parties - - 454.0 Loans to employees/others - - 10,434.9 Trade receivables - - 72,026.1 Bank deposits with more than 12 months maturity - - 4,589.2 Security deposits - - 532.9 Cash and cash equivalents - - 86,628.0 Bank balances other than Cash and cash equivalents - - 64,780.4 Interest accrued on investments / balances with banks - - 599.9 Interest accrued on investments loans - - 0.2 Derivatives designated as hedges - 67.1 - Other financial assets - - 1,666.0
Mandatorily measured :Derivatives not designated as hedges 1,255.4 - -
Total 4,235.8 3,970.6 241,711.6
SUN PHARMACEUTICAL INDUSTRIES L IMITED230
NOTES TO THE CONSOLIDATED FINANCIAL STATEMENTS
FOR THE YEAR ENDED MARCH 31, 2017
` in MillionAs at March 31, 2017
Fair value through profit or loss
Fair value through other
comprehensive income
Amortised cost
Financial liabilitiesBorrowings - - 80,910.0 Current maturities of long-term debt and finance lease obligations - - 17,407.7 Trade payables - - 43,953.9 Interest accrued but not due on borrowings - - 384.1 Unpaid dividends - - 76.6 Trade/security deposits - - 179.4 Payable on purchase of property, plant and equipment - - 1,940.7 Derivatives designated as hedges - 26.6 - Other financial liabilities - - 2,931.8
Mandatorily measured :Derivatives not designated as hedges 217.4 - -
Receivable on account of assets under finance lease - - 389.3 Loans to employees/others - - 11,399.4 Trade receivables - - 67,756.6 Bank deposits with more than 12 months maturity - - 7,631.4 Security deposits - - 568.6 Cash and cash equivalents - - 80,751.4 Bank balances other than cash and cash equivalents - - 51,065.1 Interest accrued on investments / balances with banks - - 284.4 Interest accrued on loans - - 4.9 Other financial assets - - 676.8
Mandatorily measured :Derivatives not designated as hedges 1,534.6 - -
Total 7,759.4 7,079.8 221,858.3 # Pertains to investment in equity instruments of Impax Laboratories Inc., Krebs Biochemicals and Industries Limited and FS INVT CORP COM.
Receivable on account of assets under finance lease - - 399.3 Loans to related parties - - 238.0 Loans to employees/others - - 11,674.4 Trade receivables - - 50,927.5 Cash and cash equivalents - - 72,645.9 Bank balances other than Cash and cash equivalents - - 37,124.8 Interest accrued on investments / balances with banks - - 139.7 Interest accrued and due on loans - - 88.8 Other financial assets - - 25,589.3 Security deposits - - 571.3
Mandatorily measured :Derivatives not designated as hedges 1,946.2 - -
Total 22,375.1 11,384.0 200,020.4 # Pertains to investment in equity instruments of Impax Laboratories Inc., Krebs Biochemicals and Industries Limited and FS INVT CORP COM.
SUN PHARMACEUTICAL INDUSTRIES L IMITED232
NOTES TO THE CONSOLIDATED FINANCIAL STATEMENTS
FOR THE YEAR ENDED MARCH 31, 2017
` in MillionAs at April 01, 2015
Fair value through profit or loss
Fair value through other
comprehensive income
Amortised cost
Financial liabilitiesBorrowings - - 75,724.4 Trade payables - - 32,440.5 Current maturities of long-term debt and finance lease obligations - - 13,997.7 Interest accrued but not due on borrowings - - 323.7 Unpaid dividends - - 65.7 Trade/security deposits - - 235.5 Payable on purchase of property, plant and equipment - - 1,226.8 Other financial liabilities - - 4,528.6
Mandatorily measured :Derivatives not designated as hedges 5,576.1 - -
Total 5,576.1 - 128,542.9
Note 45
FAIR VALUE HIERARCHY` in Million
As at March 31, 2017Level 1 Level 2 Level 3
Financial assets and liabilities measured at fair value-recurring fair value measurementsFinancial assetsInvestments
Derivatives not designated as hedges - 1,946.2 - 31,314.3 1,946.2 498.6
Financial liabilitiesDerivative not designated as hedges - 5,576.1 -
- 5,576.1 -
Level 1 inputs are quoted prices (unadjusted) in active markets for identical assets or liabilities that the entity can access at the measurement date.
Level 2 inputs are inputs, other than quoted prices included within Level 1, that are observable for the asset or liability, either directly or indirectly.
Level 3 inputs are unobservable inputs for the asset or liability.
The investments included in Level 3 of fair value hierarchy have been valued using the cost approach to arrive at their fair value. The cost of unquoted investments approximates the fair value because there is wide range of possible fair value measurements and the costs represents estimate of fair value within that range.
SUN PHARMACEUTICAL INDUSTRIES L IMITED234
NOTES TO THE CONSOLIDATED FINANCIAL STATEMENTS
FOR THE YEAR ENDED MARCH 31, 2017
The investments which are fair valued through other comprehensive income, are not held for trading. Instead, they are held for medium or long-term strategic purpose. Upon the application of Ind AS 109, the Group has chosen to designate these investments in equity instruments as at fair value through other comprehensive income as the management believe that this provides a more meaningful presentation for medium or long-term strategic investments, than reflecting changes in fair value immediately in consolidated statement of profit and loss. There were no transfers between Level 1 and 2 in the period.
The management considers that the carrying amount of financial assets and financial liabilities carried as amortised cost approximates their fair value.
Reconciliation of Level 3 fair value measurements` in Million
Year ended Year ended March 31, 2017 March 31, 2016
Unlisted shares valued at fair value Balance at the beginning of the year 544.1 498.6
a) The Group’s capital management objectives are: - to ensure the Group’s ability to continue as a going concern; and - to provide an adequate return to shareholders through optimisation of debts and equity balance. The Group monitors capital on the basis of the carrying amount of debt less cash and cash equivalents as presented on the face of the consolidated financial statements. The Group’s objective for capital management is to maintain an optimum overall financial structure.
` in Million As at As at As at
March 31, 2017 March 31, 2016 April 01, 2015Debt (includes non-current borrowings, current borrowings, current maturities of finance lease obligations and current maturities of long term debt)
98,317.7 84,967.6 89,722.1
Less: cash and cash equivalents 86,628.0 80,751.4 72,645.9 Net debt 11,689.7 4,216.2 17,076.2 Total equity 404,305.3 370,677.3 308,926.4 Net debt to total equity ratio 2.9% 1.1% 5.5%
b) Dividend on Equity shares paid during the year` in Million
March 31, 2017 March 31, 2016Dividend on equity sharesFinal dividend for the year ended March 31, 2016 of ` 1.0 (Previous year for year ended March 31, 2015: ` 3.0) per fully paid share
2,406.8 7,219.5
Dividend distribution tax on above 490.0 1469.7Dividends not recognised at the end of the reporting periodThe Board of Directors at its meeting held on May 26, 2017 have recommended payment of final dividend of ` 3.5 per share of face value of ` 1 each for the year ended March 31, 2017. The same amounts to ` 8,397.6 Million.
This proposed dividend is subject to the approval of shareholders in the ensuing annual general meeting and hence not recognised as liability.
Note 47
FINANCIAL RISK MANAGEMENT
The Group’s activities expose it to a variety of financial risks, including market risk, credit risk and liquidity risk. The Group’s risk management assessment and policies and processes are established to identify and analyse the risks faced by the Group, to set appropriate risk limits and controls, and to monitor such risks and compliance with the same. Risk assessment and management policies and processes are reviewed regularly to reflect changes in market conditions and the Group’s activities.
Credit riskCredit risk is the risk of financial loss to the Group, if a customer or counterparty to a financial instrument fails to meet its contractual obligations and arises principally from the Group’s receivables from customers, loans and investments. Credit risk is managed through credit approvals, establishing credit limits and continuously monitoring the creditworthiness of counterparty to which the Group grants credit terms in the normal course of business.
InvestmentsThe Group limits its exposure to credit risk by generally investing in liquid securities and only with counterparties that have a good credit rating. The Group does not expect any losses from non-performance by these counter-parties, and does not have any significant concentration of exposures to specific industry sectors or specific country risks.
Trade receivablesThe Group has used expected credit loss (ECL) model for assessing the impairment loss. For this purpose, the Group uses a provision matrix to compute the expected credit loss amount. The provision matrix takes into account external and internal risk factors and historical data of credit losses from various customers.
` in Million
As at March 31, 2017
As at March 31, 2016
As at April 01, 2015
Financial assets for which loss allowances is measured using the expected credit loss Trade receivables
less than 180 days 69,889.0 65,351.3 48,763.9 180 - 365 days 1,729.0 1,671.5 1,204.2 beyond 365 days 2,518.0 2,689.5 2,355.0
Total 74,136.0 69,712.3 52,323.1
SUN PHARMACEUTICAL INDUSTRIES L IMITED236
NOTES TO THE CONSOLIDATED FINANCIAL STATEMENTS
FOR THE YEAR ENDED MARCH 31, 2017
` in Million Year ended Year ended
March 31, 2017 March 31, 2016Movement in the expected credit loss allowance on Trade receivablesBalance at the beginning of the year 1,955.7 1,395.6
Addition 318.1 1,528.3 Recoveries (163.9) (968.2)
Balance at the end of the year 2,109.9 1,955.7
Liquidity riskLiquidity risk is the risk that the Group will not be able to meet its financial obligations as they become due. The Group manages its liquidity risk by ensuring, as far as possible, that it will always have sufficient liquidity to meet its liabilities when due, under both normal and stressed conditions, without incurring unacceptable losses or risk to the Group’s reputation.
The Group had unutilised credit limit/undrawn borrowing facilities from banks of ` 62,162.2 Million as on March 31, 2017, ` 32,401.2 Million as on March 31, 2016, ` 33,533.8 Million as on April 01, 2015.
The table below provides details regarding the contractual maturities of undiscounted significant financial liabilities as at March 31, 2017:
The table below provides details regarding the contractual maturities of undiscounted significant financial liabilities as at March 31, 2016:` in Million
Market risk Market risk is the risk of loss of future earnings, fair values or future cash flows that may result from adverse changes in market rates and prices (such as interest rates, foreign currency exchange rates and commodity prices) or in the price of market risk-sensitive instruments as a result of such adverse changes in market rates and prices. Market risk is attributable to all market risk-sensitive financial instruments, all foreign currency receivables and payables and all short term and long-term debt. The Group is exposed to market risk primarily related to foreign exchange rate risk, interest rate risk and the market value of its investments. Thus, the Group’s exposure to market risk is a function of investing and borrowing activities and revenue generating and operating activities in foreign currencies.
Foreign exchange riskThe Group’s foreign exchange risk arises from its foreign operations, foreign currency revenues and expenses, (primarily in US Dollar, Euro, South African Rand and Russian Rouble) and foreign currency borrowings (primarily in US Dollar). As a result, if the value of the Indian Rupee appreciates relative to these foreign currencies, the Group’s revenues and expenses measured in Indian Rupees may decrease or increase and vice-versa. The exchange rate between the Indian rupee and these foreign currencies has changed substantially in recent periods and may continue to fluctuate substantially in the future. Consequently, the Group uses both derivative and non-derivative financial instruments, such as foreign exchange forward contracts, option contracts, currency swap contracts and foreign currency financial liabilities, to mitigate the risk of changes in foreign currency exchange rates in respect of its highly probable forecasted transactions and recognised assets and liabilities.
a) Significant foreign currency risk exposure relating to trade receivables, cash and cash equivalents, borrowings and trade payables` in Million
b) Sensitivity For the years ended March 31, 2017, March 31, 2016 and April 01, 2015, every 5% strengthening in the exchange rate between the
Indian Rupee and the respective major currencies for the above mentioned financial assets/liabilities would increase Group’s profit and equity by approximately ` 1,054.5 Million, ` 1,774.3 Million and ` 1,813.8 Million respectively. A 5% weakening of the Indian Rupee and the respective major currencies would lead to an equal but opposite effect.
In management’s opinion, the sensitivity analysis is unrepresentative of the inherent foreign exchange risk because the exposure at the end of the reporting period does not reflect the exposure during the year.
c) Derivative contracts The Group is exposed to exchange rate risk that arises from its foreign exchange revenues and expenses, primarily in US Dollar, Euro,
South African Rand and Russian Rouble, and foreign currency debt in primarily in US Dollar. The Group uses foreign currency forward contracts, foreign currency option contracts and currency swap contracts (collectively, “derivatives”) to mitigate its risk of changes in foreign currency exchange rates. The counterparty for these contracts is generally a bank or a financial institution.
Hedges of highly probable forecasted transactions
The Group designates its derivative contracts that hedge foreign exchange risk associated with its highly probable forecasted transactions as cash flow hedges and measures them at fair value. The effective portion of such cash flow hedges is recorded as in other comprehensive income, and re-classified in the income statement as revenue in the period corresponding to the occurrence of the forecasted transactions. The ineffective portion of such cash flow hedges is immediately recorded in the consolidated statement of profit and loss.
In respect of the aforesaid hedges of highly probable forecasted transactions, the Group has recorded a loss of ` 46.2 Million for year ended March 31, 2017 and ` Nil for year ended March 31, 2016 in other comprehensive income. The Group also recorded as
a component of revenue, loss of ` 559.7 Million for year ended March 31, 2017 and ` Nil for year ended March 31, 2016 due to occurrence of forecasted sale transaction.
Changes in the fair value of forward contracts and option contracts that economically hedge monetary assets and liabilities in foreign currencies, and for which no hedge accounting is applied, are recognised in consolidated statement of the profit and loss account. The changes in fair value of the forward contracts and option contracts, as well as the foreign exchange gains and losses relating to the monetary items, are recognised in consolidated statement of the profit and loss.
The following table gives details in respect of the notional amount of outstanding foreign exchange derivative contracts:Amount in Million
Currency Buy / Sell Cross As at As at As atCurrency March 31, 2017 March 31, 2016 April 01, 2015
* Structured options @ 2 to 2.5 timesInterest rate riskThe Group has loan facilities on floating interest rate, which exposes the Group to risk of changes in interest rates. The Parent Company’s Treasury Department monitors the interest rate movement and manages the interest rate risk by evaluating interest rate swaps etc. based on the market / risk perception.
For the year ended March 31, 2017 and March 31, 2016, every 50 basis point decrease in the floating interest rate component applicable to its loans and borrowings would increase the Group’s profit before tax by approximately ` 196.2 Million and ` 257.8 Million respectively. A 50 basis point increase in floating interest rate would have led to an equal but opposite effect.
Commodity rate riskExposure to market risk with respect to commodity prices primarily arises from the Group’s purchases and sales of active pharmaceutical ingredients, including the raw material components for such active pharmaceutical ingredients. These are commodity products, whose prices may fluctuate significantly over short periods of time. The prices of the Group’s raw materials generally fluctuate in line with commodity cycles, although the prices of raw materials used in the Group’s active pharmaceutical ingredients business are generally more volatile. Cost of raw materials forms the largest portion of the Group’s cost of revenues. Commodity price risk exposure is evaluated and managed through operating procedures and sourcing policies. As of March 31, 2017, the Group had not entered into any material derivative contracts to hedge exposure to fluctuations in commodity prices.
SUN PHARMACEUTICAL INDUSTRIES L IMITED240
NOTES TO THE CONSOLIDATED FINANCIAL STATEMENTS
FOR THE YEAR ENDED MARCH 31, 2017
Note 48
GOODWILL (NET):Goodwill acquired in business combination is allocated, at acquisition, to the Cash Generating Units (CGUs) that are expected to benefit from that business combination. The carrying amount of goodwill has been allocated as follows:(i) Goodwill in respect of:
` in Million
As at As at As at
March 31, 2017 March 31, 2016 April 01, 2015Sun Pharmaceutical Industries, Inc. 23,273.5 23,729.6 22,683.2 Sun Farmaceutica do Brasil Ltda. 425.3 430.4 427.4 Sun Pharma Japan Ltd. 119.0 119.8 127.2 Taro Pharmaceutical Industries Ltd. 12,295.6 12,556.5 11,849.6 Ranbaxy Pharmaceutical Proprietary Limited - - 1,331.4 S.C Terapia S.A. 17,295.8 17,699.3 16,681.1 Ranbaxy Ireland Limited - - 117.0 Ranbaxy Farmaceutica Ltda. 358.9 366.6 345.9 Basics GmbH 311.9 338.7 301.1 Ranbaxy Pharmaceuticals, Inc. 290.0 296.5 281.3 Insite Vision Incorporated 435.3 445.0 - Ranbaxy Italia S.p.A - - 239.3 Sun Pharma Medisales Private Limited (Formerly known as Solrex Pharmaceuticals Company)
1,208.0 1,208.0 1,208.0
Ranbaxy South Africa Proprietary Limited 3.4 3.1 3.5 JSC Biosintez 112.6 - - Sun Pharmaceuticals Medicare Limited 1.0 - - Gufic Pharma Limited 469.4 469.4 469.4
Total (A) 56,599.7 57,662.9 56,065.4 Less: Capital Reserve in respect of :
Alkaloida Chemical Company Zrt. 1,152.5 1,229.2 1,149.5 Ranbaxy Nigeria Limited 1.4 1.5 1.4 Ranbaxy Drugs Limited 27.5 27.5 27.5 Ranbaxy Malaysia Sdn. Bhd. 56.1 57.3 41.0
Total (B) 1,237.5 1,315.5 1,219.5 Total (A-B) 55,362.2 56,347.4 54,845.9
(ii) Below is the reconciliation of the carrying amount of goodwill:` in Million
As at As at
March 31, 2017 March 31, 2016Opening balance 56,347.4 54,845.9 Add: Due to acquisitions during the year 113.6 688.7Less: Impairment/write off (Refer note 62) - (1,942.3)Add/ (Less): Foreign currency translation difference (1,098.8) 2,755.1 Closing balance 55,362.2 56,347.4
The carrying amount of goodwill are stated above. The recoverable amounts have been determined based on value in use calculations which uses cash flow projections covering generally a period of five years (which are based on key assumptions such as margins, expected growth rates based on past experience and Management’s expectations/ extrapolation of normal increase/ steady terminal growth rate) and appropriate discount rates that reflects current market assessments of time value of money and risks specific to these investments. The cash flow projections included estimates for five years developed using internal forecasts and terminal growth rate thereafter. The planning horizon reflects the assumptions for short to mid-term market developments. The average growth rate used in extrapolating cash flows beyond the planning period ranged from 1% to 2% for the year ended March 31, 2017, March 31, 2016 and April 01, 2015. Discount rate
reflects the current market assessment of the risks specific to a CGU or group of CGUs. The discount rate is estimated on the weighted average cost of capital for respective CGU or group of CGUs. Discount rate used ranged from 4% to 11.9% for the year ended March 31, 2017, March 31, 2016 and April 01, 2015. The management believes that any reasonable possible change in key assumptions on which recoverable amount is based is not expected to cause the aggregate carrying amount to exceed the aggregate recoverable amount of the cash generating unit. However, based on the impairment assessment, the Management has determined that in respect of certain subsidiaries, an impairment loss considering the above criteria/ factors aggregating to ` Nil (March 31, 2016: ` 1,942.3 Million) in the value of goodwill has been recognised.
Note 49
RELATED PARTY DISCLOSURES (IND AS-24) AS PER ANNEXURE ‘B’
Note 50
INCOME TAXES
Tax Reconciliation` in Million
Reconciliation of tax expense Year ended March 31, 2017
Year ended March 31, 2016
Profit before tax 90,478.7 65,706.3Enacted income tax rate in India (%) 34.608% 34.608%Income tax expense calculated at enacted corporate tax rate 31,312.9 22,739.6Effect of income that is exempt from tax (8,605.7) (6,395.7)Effect of expenses that are not deductible in determining taxable profit 152.3 448.2Incremental deduction allowed on account of research and development costs (4,927.9) (4,901.0)Investment allowance deduction (295.1) (265.1)Effect of income which is taxed at special rates 25.1 54.5Effect of unused tax losses and tax offsets not recognised as deferred tax assets 5,193.2 5,164.4Effect of difference between Indian and foreign tax rates and non taxable subsidiaries (12,658.7) (9,608.1)Effect of deferred tax expense on undistributed profits 415.3 415.3Tax payable under MAT 2,100.0 -Others (595.7) 1,485.6Income tax expense recognised in consolidated statement of profit and loss 12,115.7 9,137.7
SUN PHARMACEUTICAL INDUSTRIES L IMITED242
NOTES TO THE CONSOLIDATED FINANCIAL STATEMENTS
FOR THE YEAR ENDED MARCH 31, 2017
Note 51
DEFERRED TAXi) DEFERRED TAX ASSETS (Net)
` in MillionOpening
balance April 01, 2015
Movement during the
Year *
Closing balance March
31, 2016 Deferred Tax Asset
Expenses claimed for tax purpose on payment basis 9,756.7 3,086.8 12,843.5 Unabsorbed depreciation/carry forward losses 4,019.2 389.3 4,408.5 Inventory and other related items 5,327.6 814.8 6,142.4 Intangible assets 3,282.9 (328.2) 2,954.7 Others 1,263.3 299.0 1,562.3
23,649.7 4,261.7 27,911.4 MAT Credit Entitlement 7,517.0 - 7,517.0
31,166.7 4,261.7 35,428.4 Less : Deferred Tax Liabilities
Difference between written down value of property plant and equipment and capital work-in-progress as per books of accounts and income tax
3,299.9 (53.3) 3,246.6
Others 694.7 (2.8) 691.9 3,994.6 (56.1) 3,938.5
27,172.1 4,317.8 31,489.9
DEFERRED TAX ASSETS (Net)
` in Million Opening
balance April 01, 2016
Movement during the
Year *
Closing balance March
31, 2017 Deferred Tax Assets
Expenses claimed for tax purpose on payment basis 12,843.5 (4,851.9) 7,991.6 Unabsorbed depreciation / carried forward losses 4,408.5 1,623.0 6,031.5 Inventory and other related items 6,142.4 (2,572.8) 3,569.6 Intangible assets 2,954.7 (103.7) 2,851.0 Others 1,562.3 (110.1) 1,452.2
27,911.4 (6,015.5) 21,895.9 MAT Credit Entitlement 7,517.0 - 7,517.0
35,428.4 (6,015.5) 29,412.9 Less : Deferred Tax Liabilities
Difference between written down value of property plant and equipment and capital work-in-progress as per books of accounts and income tax
Less : Deferred Tax AssetsExpenses claimed for tax purpose on payment basis 126.5 342.9 469.4 Others 48.2 13.2 61.4
174.7 356.1 530.8 1,027.7 2,120.2 3,147.9
* Movement during the year includes foreign currency translation difference amounting to ` 1,182.9 Million (gain) and ` 669.2 Million (loss) for the year ended March 31, 2016 and March 31, 2017 respectively and deferred tax on remeasurements of defined benefit plans amounting to ` 42.2 Million and ` 98.8 Million for the year ended March 31, 2016 and March 31, 2017 respectively, recognised in OCI.
iii) Deductible temporary differences, unused tax losses and unused tax credits for which no deferred tax assets have been recognised are attributable to the following:
140,748.2 126,309.0 105,593.3The unused tax credits will expire from financial year 2017-18 to financial year 2023-24 and unused tax losses expiry ranges from financial year 2017-18 to 2032-33. In case of certain overseas subsidiaries which have tax losses and unused tax credits, the amount is not material and there is no expiry period for tax losses and unused tax credits.
SUN PHARMACEUTICAL INDUSTRIES L IMITED244
NOTES TO THE CONSOLIDATED FINANCIAL STATEMENTS
FOR THE YEAR ENDED MARCH 31, 2017
Note 52
EARNINGS PER SHARE Year ended Year ended
March 31, 2017 March 31, 2016Profit for the year (` in Million) - used as numerator for calculating earnings per share 69,643.7 45,457.1 Weighted Average number of shares used in computing basic earnings per share 2,403,319,673 2,406,379,179 Add: Dilution effect of employee stock options 203,455 1,059,730 Weighted average number of shares used in computing diluted earnings per share 2,403,523,128 2,407,438,909 Nominal value per share (in `) 1 1Basic Earnings Per Share (in `) 29.0 18.9 Diluted Earnings Per Share (in `) 29.0 18.9
Note 53
SEGMENT REPORTING
The Chief Operating Decision Maker (‘CODM’) evaluates the Group’s performance and allocates resources based on an analysis of various performance indicators by reportable segments. The Group’s reportable segments are as follows: 1. India 2. United States 3. Emerging Markets 4. Rest of the World The reportable segments derives their revenues from the sale of pharmaceuticals products (generics, speciality, API, etc.) . The CODM reviews revenue as the performance indicator. The measurement of each segment’s revenues, expenses and assets is consistent with the accounting policies that are used in preparation of the Group’s consolidated financial statements.
` in Million Year ended Year ended
March 31, 2017 March 31, 2016Revenue by GeographyIndia 80,610.1 77,844.6 United States of America 138,823.6 136,724.7 Emerging markets 49,074.2 39,075.5 Rest of world 34,134.4 25,235.9
302,642.3 278,880.7
In view of the interwoven / intermix nature of business and manufacturing facility, other segmental information is not ascertainable.
Concentration of Revenues from two customers of the Group were 35.7% and 30.9% of total revenue for the year ended March 31, 2017 and March 31, 2016 respectively.
Note 54
Other intangible assets consisting of trademarks, designs, technical knowhow, licences, non-compete fees and other intangible assets are stated at cost of acquisition based on their agreements. The amortisable amount of intangible assets is arrived at, based on the management’s best estimates of useful lives of such assets after due consideration as regards their expected usage, the product life cycles, technical and technological obsolescence, market demand for products, competition and their expected future benefits to the Group.
LEASES (a) The Group has given certain premises and Plant and Machinery under operating lease or leave and license agreements. These are
generally not non-cancellable and periods range between 11 months to 10 years under leave and license / lease and are renewable by mutual consent on mutually agreeable terms. The Group has received refundable interest free security deposits, where applicable, in accordance with agreed terms.
(b) The Group has obtained certain premises for its business operations (including furniture and fittings, therein as applicable) under operating lease or leave and license agreements. These are generally not non-cancellable and range between 11 months to 10 years under leave and licenses, or longer for other lease and are renewable by mutual consent on mutually agreeable terms. The Group has given refundable interest free security deposits in accordance with the agreed terms. These refundable security deposits have been valued at amortised cost under relevant Ind AS.
(c) Lease receipts/payments are recognised in the consolidated statement of profit and loss under “Lease Rental and Hire Charges” and “Rent” in Note 32 and Note 37.
` in Million Year ended Year ended
March 31, 2017 March 31, 2016(d) Operating lease(i) Group as lesseeThe future minimum lease payments under non-cancellable operating leasenot later than one year 386.2 596.3 later than one year and not later than five years 648.1 840.1 later than five years 203.3 209.2 (ii) Group as lessorThe future minimum lease payments under non-cancellable operating leasenot later than one year 133.5 28.0 later than one year and not later than five years 532.9 107.9 later than five years 58.3 67.6
(e) Finance lease(i) Group as lesseeThe future minimum lease payments under non-cancellable finance leasenot later than one year 134.5 134.6 later than one year and not later than five years 433.2 569.5 later than five years 494.6 654.5 Less: Unearned Finance Charges 360.3 610.1 Present value of minimum lease payments payablenot later than one year 39.5 32.7 later than one year and not later than five years 265.4 223.7 later than five years 397.1 492.1 (ii) Group as lessorThe future minimum lease payments under non-cancellable finance leasenot later than one year - 46.8 later than one year and not later than five years - 165.8 later than five years - 716.2 Less: Unearned Finance Income - 539.5 Present value of minimum lease payments receivablenot later than one year - 10.6 later than one year and not later than five years - 28.3 later than five years - 350.4
SUN PHARMACEUTICAL INDUSTRIES L IMITED246
NOTES TO THE CONSOLIDATED FINANCIAL STATEMENTS
FOR THE YEAR ENDED MARCH 31, 2017
Note 56
EMPLOYEE BENEFITSDefined contribution planContributions are made to Regional Provident Fund (RPF), Family Pension Fund, Employee State Insurance Corporation (ESIC) and other Funds which covers all regular employees of the parent and Indian subsidiaries. While both the employees and parent and Indian subsidiaries make predetermined contributions to the Provident Fund and ESIC, contribution to the Family Pension Fund and other statutory funds are made only by the parent and Indian subsidiaries. The contributions are normally based on a certain percentage of the employee’s salary. Amount recognised as expense in respect of these defined contribution plans, aggregate to ` 773.2 Million (Previous Year ` 730.0 Million).
` in Million Year ended Year ended
March 31, 2017 March 31, 2016Contribution to Provident Fund and Family Pension Fund 668.8 613.3Contribution to Superannuation Fund 74.9 90.3Contribution to ESIC and Employees Deposit Linked Insurance (EDLI) 29.3 26.3Contribution to Labour Welfare Fund 0.2 0.1
The Parent and Indian subsidiaries has an obligation towards provident fund with respect to certain employees upto March 31, 2015 which was recognised as defined benefit plan. From the previous year the contribution for the same is made to RPF and the Parent and Indian subsidiaries does not have any obligation apart from such contribution. Accordingly, from previous year, the provident fund is recognised as defined contribution plan.
Defined benefit plana) Gratuity In respect of Gratuity, a defined benefit plan, contributions are made to LIC’s Recognised Group Gratuity Fund Scheme. It is governed
by the Payment of Gratuity Act, 1972. Under the Gratuity Act, employees are entitled to specific benefit at the time of retirement or termination of the employment on completion of five years or death while in employment. The level of benefit provided depends on the member’s length of service and salary at the time of retirement/termination age. Provision for Gratuity is based on actuarial valuation done by an independent actuary as at the year end. Each year, the Parent and Indian subsidiaries reviews the level of funding in gratuity fund. The Parent and Indian subsidiaries decides its contribution based on the results of its annual review. The Parent and Indian subsidiaries aims to keep annual contributions relatively stable at a level such that the fund assets meets the requirements of gratuity payments in short to medium term.
b) Pension fund The Parent and Indian subsidiaries has an obligation towards pension, a defined benefit retirement plan, with respect to certain
employees, who had already retired before March 01, 2013, will continue to receive the pension as per the pension plan.
These plans typically expose the Parent and Indian subsidiaries to actuarial risks such as: investment risk, interest rate risk, longevity risk and salary risk.
i) Investment risk - The present value of the defined benefit plan liability is calculated using a discount rate determined by reference to the market yields on government bonds denominated in Indian Rupees. If the actual return on plan asset is below this rate, it will create a plan deficit. However, the risk is partially mitigated by investment in LIC managed fund.
ii) Interest rate risk - A decrease in the bond interest rate will increase the plan liability. However, this will be partially offset by an increase in the return on the plan’s debt investments.
iii) Longevity risk - The present value of the defined benefit plan liability is calculated by reference to the best estimate of the mortality of plan participants both during and after their employment. An increase in the life expectancy of the plan participants will increase the plan’s liability.
iv) Salary risk - The present value of the defined benefit plan liability is calculated by reference to the future salaries of plan participants. As such, an increase in the salary of the plan participants will increase the plan’s liability.
Other long term benefit planActuarial Valuation for Compensated Absences is done as at the year end and the provision is made as per the Parent and Indian subsidiaries rules with corresponding charge to the Consolidated Statement of Profit and Loss amounting to ` 499.3 Million (Previous Year ` 465.2 Million) and it covers all regular employees. Major drivers in actuarial assumptions, typically, are years of service and employee compensation.
Obligation in respect of defined benefit plan and other long term employee benefit plans are actuarially determined as at the year end using the ‘Projected Unit Credit’ method. Gains and losses on changes in actuarial assumptions relating to defined benefit obligation are recognised in other comprehensive income whereas gains and losses in respect of other long term employee benefit plans are recognised in the consolidated statement of profit and loss.
` in MillionYear ended March 31, 2017 Year ended March 31, 2016
Pension Fund (Unfunded)
Provident Fund (Funded)
Gratuity (Funded)
Pension Fund (Unfunded)
Provident Fund (Funded)
Gratuity (Funded)
Expense recognised in the consolidated statement of profit and loss (Refer note 35)
Current service cost - - 242.4 - - 211.4 Interest cost 70.2 592.6 204.5 76.6 347.6 168.3 Expected return on plan assets - (598.5) (160.9) - (385.5) (146.5) Recognition of unrecognised liabilities of earlier years
- - - - 3.7 -
Excess of planned assets over commitments not recognised in Financial statements
- 5.9 - - 34.2 -
Expense charged to the consolidated statement of profit and loss
70.2 - 286.0 76.6 - 233.2
Remeasurement of defined benefit obligation recognised in other comprehensive income
Actuarial loss / (gain) on defined benefit obligation 56.2 - 726.4 (39.7) - 439.6 Return on plan assets - - (18.0) - - (11.3)Expense/(income) charged to other comprehensive income
56.2 - 708.4 (39.7) - 428.3
Reconciliation of defined-benefit obligations Obligations as at the beginning of the year 930.7 4,598.6 2,708.4 981.8 4,810.2 2,142.1 Current service cost - - 242.4 - - 211.4 Interest cost 70.2 592.6 204.5 76.6 347.6 168.3 Liability transferred in/ Acquisitions - - 17.4 - - - Obligations transferred - 1.8 - - 28.9 - Benefits paid (87.6) (507.6) (227.2) (88.0) (588.1) (253.0)Obligation transferred to regional provident fund, net of accumulated unrecognised gains
- (4,685.4) - - - -
Actuarial (Gains)/Losses on obligationsdue to change in demographic assumptions - - 16.4 - - (14.6)due to change in financial assumptions 54.5 - 623.3 31.0 - 299.3 due to experience 1.7 - 86.7 (70.7) - 154.9 Obligation as at the year end 969.5 - 3,671.9 930.7 4,598.6 2,708.4
SUN PHARMACEUTICAL INDUSTRIES L IMITED248
NOTES TO THE CONSOLIDATED FINANCIAL STATEMENTS
FOR THE YEAR ENDED MARCH 31, 2017
` in MillionMarch 31, 2017 March 31, 2016
Provident Fund
(Funded)
Gratuity (Funded)
Provident Fund
(Funded)
Gratuity (Funded)
Reconciliation of liability/(asset) recognised in the consolidated balance sheet
Present value of commitments (as per Actuarial Valuation) - 3,671.9 4,598.6 2,708.4 Fair value of plan assets - (2,348.7) (4,632.8) (2,131.2)Excess of planned assets over commitments not recognised - - (34.2) - Net liability recognised in the consolidated balance sheet - 1,323.2 - 577.2
Reconciliation of plan assets Plan assets as at the beginning of the year 4,632.8 2,131.2 4,806.5 1,867.6 Expected return 598.5 160.9 385.5 146.5 Assets transferred in/ Acquisitions - 17.4 - - Plan assets transferred 1.8 - 28.9 - Actuarial gain - 18.0 - 11.3 Employer's Contribution during the year - 248.4 - 358.8 Employees' Contributions during the year - - - - Benefits paid (507.6) (227.2) (588.1) (253.0)Funds transferred to regional provident fund (4,725.5) - - - Plan assets as at the year end - 2,348.7 4,632.8 2,131.2
Year ended March 31, 2017 Year ended March 31, 2016Pension Fund
The major categories of plan assets are as under:Central government securities - 20.9 - 25.9 Bonds and securities of public sector / financial institutions - 69.3 - 156.3 Insurer managed funds (Funded with LIC, break-up not available) - 2,236.3 - 1,940.4 Surplus fund lying uninvested - 22.2 - 8.6
The contribution expected to be made by the Parent and Indian subsidiaries for gratuity, during financial year ending March 31, 2018 is ` 483.1 Million (Previous year ` 413.0 Million).
Note 57
Taro Pharmaceutical Industries Ltd and its Israeli subsidiaries are required to make severance or pension payments to dismissed employees and to employees terminating employment under certain other circumstances. Deposits are made with a pension fund or other insurance plans to secure pension and severance rights for the employees in Israel.
-II (ESOS-II), Employees Stock Option Scheme 2005 (ESOS 2005) and Employees Stock Option Plan 2011 (ESOP 2011) for the grant of stock options to the eligible employees and Directors of the Erstwhile RLL and its subsidiaries. ESOS-II had been discontinued from January 17, 2015. The ESOSs is administered by the Compensation Committee (“Committee”). Options are granted at the discretion of the Committee to selected employees depending upon certain criterion. Each option comprises one underlying equity share.
ESOS 2005 provided that the grant price of options would be the latest available closing price on the stock exchange on which the shares of the erstwhile RLL were listed, prior to the date of the meeting of the Committee in which the options were granted. If the shares are listed on more than one stock exchange, then the stock exchange where there is highest trading volume on the said date shall be considered. The options vested evenly over a period of five years from the date of grant. Options lapse, if they are not exercised prior to the expiry date, which was ten years from the date of grant.
SUN PHARMACEUTICAL INDUSTRIES L IMITED250
NOTES TO THE CONSOLIDATED FINANCIAL STATEMENTS
FOR THE YEAR ENDED MARCH 31, 2017
ESOP 2011 provided that the grant price of options would be the face value of the equity share i.e. ` 5 per share. The options vested evenly over a period of three years from the date of grant. Options lapse, if they were not exercised prior to the expiry date, which was three months from the date of the vesting. An ESOP Trust had been formed to administer ESOP 2011. Shares issued to the ESOP Trust were allocated to the eligible employees upon exercise of stock options from time to time.
The Shareholders’ Committee of erstwhile RLL had approved issuance of options under the ESOS’s as per details given below:Date of approval Scheme Original No. of options approvedJune 25, 2003 ESOS-II 4,000,000 June 30, 2005 ESOS 2005 4,000,000 May 9, 2011 ESOP 2011 3,000,000
In accordance with the above approval of issuance of options, stock options have been granted from time to time.
The stock options outstanding as on June 30, 2005 are proportionately adjusted in view of the sub-division of equity shares of the Erstwhile RLL from the face value of ` 10 each into 2 equity shares of ` 5 each.
Pursuant to the Scheme of Amalgamation, Sun Pharmaceutical Industries Limited (‘transferee company’) formulated two Employee Stock Option Schemes, namely, (i) SUN Employee Stock Option Scheme-2015 (SUN-ESOS 2015) to administer ESOS 2005 (ii) SUN Employee Stock Option Plan-2015 (SUN-ESOP 2015) to administer ESOP 2011. These scheme provide that the number of transferee options issued shall equal to the product of number of transferor options outstanding on effectiveness of Scheme multiplied by the Share exchange ratio (0.80) and each transferee option shall have an exercise price per equity share equal to transferor option exercise price per equity shares divided by the share exchange ratio (0.80) and fractions rounded off to the next higher whole number. The terms and conditions of ESOS, of transferee company are not less favourable than those of ESOSs of erstwhile RLL. No new grants shall be made under these schemes and these schemes shall operate only for the purpose of administering the exercise of options already granted / vested on an employee pursuant to SUN-ESOS 2015 and SUN-ESOP 2015.
The movement of the options (post split) granted under SUN-ESOS 2015March 31, 2017
Stock options (numbers)
Range of exercise prices (`)
Weighted-average exercise prices (`)
Weighted-average remaining
contractual life (years)
Outstanding at the commencement of the year 610,739 270.0-703.0 480.9 2.5 Exercised during the year $ (62,682) 270.0-562.5 500.1 - Lapsed during the year (146,379) 270.0-562.5 521.7 - Outstanding at the end of the year * 401,678 270.0-562.5 462.9 1.9 Exercisable at the end of the year * 401,678 270.0-562.5 462.9 1.9
* Includes options exercised, pending allotment$ Weighted average share price on the date of exercise ` 690.23
The movement of the options (post split) granted under SUN-ESOS 2015 March 31, 2016
Stock options (numbers)
Range of exercise prices (`)
Weighted-average exercise prices (`)
Weighted-average remaining contractual
life (years)Outstanding at the commencement of the yearNumber of options – post-merger of Erstwhile RLL with the transferee company
1,169,545 270.0-703.0 496.0 3.3
No. of options on Account of rounding off of the fraction to the next higher whole number as per the merger Scheme
41 270.0-703.0 496.0 3.3
Total Number of options outstanding 1,169,586 270.0-703.0 496.0 3.3 Exercised during the year $ (447,825) 270.0-703.0 518.9 - Lapsed during the year (111,022) 270.0-703.0 479.9 - Outstanding at the end of the year * 610,739 270.0-703.0 480.9 2.5 Exercisable at the end of the year * 610,739 270.0-703.0 480.9 -
* Includes options exercised, pending allotment$ Weighted average share price on the date of exercise ` 823.63
The movement of the options (post split) granted under SUN-ESOP 2015 for the current year is given below:March 31, 2017
Outstanding at the commencement of the year 169,913 6.3 6.3 1.1 Forfeited during the year (11,179) 6.3 6.3 - Exercised during the year# (93,015) 6.3 6.3 - Lapsed during the year (13,435) 6.3 6.3 - Outstanding, end of the year * 52,284 6.3 6.3 0.4 Exercisable at the end of the year * 941 6.3 6.3 -
* Includes options exercised, pending allotment# Weighted average share price on the date of exercise ` 802.00
March 31, 2016
Stock options (numbers) Exercise prices (`)
Weighted-average exercise
prices (`)
Weighted-average remaining
contractual life (years)
Outstanding at the commencement of the yearNumber of options – post-merger of Erstwhile RLL with the transferee company
449,430 6.3 6.3 1.7
No. of options on Account of rounding off of the fraction to the next higher whole number as per the merger Scheme
1,368 6.3 6.3 0.9
No of options of certain overseas employees 4,968 6.3 6.3 0.9Total Number of options outstanding 455,766 6.3 6.3 0.9
Forfeited during the year (43,326) 6.3 6.3 - Exercised during the year # ^ (224,201) 6.3 6.3 - Lapsed during the year (18,326) 6.3 6.3 - Outstanding, end of the year 169,913 6.3 6.3 1.1Exercisable at the end of the year $ 40,259 6.3 6.3 0.2
$ Include options exercised, pending allotment. # Shares allotted by the ESOP Trust against the options exercised including 1,066 shares equivalent to 1,333 shares issued by Erstwhile RLL prior to April 10, 2015.^ Weighted average share price on the date of exercise ` 848.68.
SUN PHARMACEUTICAL INDUSTRIES L IMITED252
NOTES TO THE CONSOLIDATED FINANCIAL STATEMENTS
FOR THE YEAR ENDED MARCH 31, 2017
During the current year, the Parent Company has recorded a Stock-based employee compensation expense of ` 32.3 Million (Previous Year ` 98.8 Million). The amount has been determined under a fair value method wherein the grant date fair value of the options was calculated by using Black Scholes pricing model.
The following table summarizes the assumptions used in calculating the grant date fair value for instrument granted in the year ended March 31, 2015: @@Particulars Year ended March 31, 2015Grant Date May 08, 2014Dividend yield 0.43%Expected life of options from the date(s) of grant 1.25, 2.25 and 3.25 yearsRisk free interest rate 8.57% (1.25 years)
8.65% (2.25 years)8.71% (3.25 years)
Expected volatility 40.47%Grant date fair value ` 462.39 (1.25 years)
` 460.79 (2.25 years)` 459.16 (3.25 years)
@@ Assumptions used are as applicable at the date of grant in the context of erstwhile RLL.
The Black –Scholes option-pricing model was developed for estimating fair value of trade options that have no vesting restrictions and are fully transferable. Since options pricing models require use of subjective assumptions, changes therein can materiality affect fair value of the options. The options pricing models do not necessary provide a reliable measurable of fair value of options. The volatility in the share price is based on volatility of historical stock price of the erstwhile RLL for last 60 months.
(b) As at March 31, 2017, the Parent Company has received an amount of ` 0.0 Million (` 7,177) towards share application money towards 1,148 equity shares of the Parent Company. The Parent Company will allot these equity shares during the next financial year. The Parent Company has sufficient authorised capital to cover the allotment of these shares. Pending allotment of shares, the amounts are maintained in a designated bank account and are not available for use by the Parent Company.
As at March 31, 2016, the Parent Company has received an amount of ` 6.7 Million towards share application money towards 13,780 equity shares of the Parent Company [As at April 01, 2015 ` 149.0 Million towards 280,474 equity shares (no. of shares post merger)] at a premium of ` 6.7 Million (As at April 01 , 2015: ` 148.7 Million). The Parent Company has alloted these equity shares during the next financial year. The Parent Company has sufficient authorised capital to cover the allotment of these shares. Pending allotment of shares, the amounts are maintained in a designated bank account and are not available for use by the Parent Company.
Note 59
Expenditure related to Corporate Social Responsibility as per Section 135 of the Companies Act, 2013 read with Schedule VII thereof: ` 96.1 Million (Previous Year ` 171.0 Million).
Note 60
The Group does not have any material associates or joint ventures warranting a disclosure in respect of individual associates or joint ventures. The Group’s share of other comprehensive income is ` Nil (March 31, 2016: ` Nil) in respect of such associates and joint ventures. The unrecognised share of loss of ` Nil (March 31, 2016: ` Nil) in respect of such associates and joint ventures.
In respect of any present obligation as a result of a past event that could lead to a probable outflow of resources, provision has been made, which would be required to settle the obligation. The said provisions are made as per the best estimate of the management and disclosure as per Ind AS 37 - “Provisions, Contingent Liabilities and Contingent Assets” has been given below:
` in MillionAs at March 31, 2017 As at March 31, 2016
Product and Sales related*
Consultancy charges Total Product and
Sales related *Consultancy
charges Total
Opening balance 44,707.6 - 44,707.6 42,725.1 1,184.6 43,909.7 Add: Provision for the year 18,905.5 - 18,905.5 11,758.5 - 11,758.5 Add: Unwinding of discount on provisions 437.8 - 437.8 538.0 - 538.0Less: Utilisation/Settlement (15,852.3) - (15,852.3) (12,830.2) (1,184.6) (14,014.8)Add/ (Less): Foreign currency translation difference
(1,295.0) - (1,295.0) 2,516.2 - 2,516.2
Closing balance 46,903.6 - 46,903.6 44,707.6 - 44,707.6 * Includes provision for Trade commitments, discounts, rebates, price reduction, product returns, medicaids and contingency provision.
Note 62
Exceptional item for previous year represents charge on account of impairment of certain property, plant and equipment and intangible assets and other related costs and write down of the carrying value of goodwill. This charge had arisen on account of the integration and optimisation exercise being carried out for certain manufacturing facilities. The recoverable amount of the said assets is its value in use which is determined for a period of less than one year.
Note 63
a) Since the US-FDA import alert at Karkhadi facility in March 2014, the Company remained fully committed to implement all corrective measures to address the observations made by the US-FDA with the help of third party consultant. Substantial progress has been made at the Karkhadi facility in terms of completing the action items to address the observations made by the US-FDA in its warning letter issued in May 2014. The Company is continuing to work closely and co-operatively with the US-FDA to resolve the matter. The contribution of this facility to Company’s revenues is not significant.
b) The US-FDA, on January 23, 2014, had prohibited using API manufactured at Toansa facility for manufacture of finished drug products intended for distribution in the U.S. market. Consequentially, the Toansa manufacturing facility was subject to certain provisions of the consent decree of permanent injunction entered in January 2012 by erstwhile Ranbaxy Laboratories Ltd (which was merged with Sun Pharmaceutical Industries Ltd in March 2015). In addition, the Department of Justice of the USA (‘US DOJ’), United States Attorney’s Office for the District of New Jersey had also issued an administrative subpoena dated March 13, 2014 seeking information primarily related to Toansa manufacturing facility for which a Form 483 containing findings of the US-FDA was issued in January 2014. The Company is continuing to fully cooperate and is in dialogue with the US DOJ, and continuing to provide requisite information.
c) In December 2015, the US-FDA issued a warning letter to the manufacturing facility at Halol. Subsequently, a re-inspection was carried out by the US-FDA in November 2016. At the conclusion of the inspection, FDA issued a Form 483 with nine observations. The Company has submitted its response documenting the corrective measures to resolve the 483 observations. The Company is providing regular updates to US-FDA on the progress of the corrective actions. The Company is continuing to manufacture and distribute products to the U.S from Halol facility and at the same time working closely and cooperatively with the US-FDA to resolve the matter.
SUN PHARMACEUTICAL INDUSTRIES L IMITED254
NOTES TO THE CONSOLIDATED FINANCIAL STATEMENTS
FOR THE YEAR ENDED MARCH 31, 2017
d) In September 2013, the US-FDA had put the Mohali facility under import alert and was also subjected to certain provisions of the consent decree of permanent injunction entered in January 2012 by erstwhile Ranbaxy Laboratories Ltd (which was merged with Sun Pharmaceutical Industries Ltd in March 2015). In November 2016, the US-FDA conducted a re-inspection of the Mohali facility post the completion of remediation work at the facility. As a result of this re-inspection, in March 2017, the US-FDA lifted the import alert and indicated that the facility was in compliance with the requirements of cGMP provisions mentioned in the consent decree. The Mohali facility will continue to remain under consent decree under certain other provisions of the decree for a fixed period of time to demonstrate sustainable cGMP compliance.
Note 64
Remuneration to the Managing Director and the Whole-time Director(s) of the Parent Company for the years ended March 31, 2015, March 31, 2016 and March 31, 2017 are higher by ` 49.6 Million, ` 29.6 Million and ` 44.7 Million respectively than the amounts approved by the Central Government of India (Ministry of Corporate Affairs) on applications made by the Parent Company to approve the maximum remuneration as approved by the members of the Company for the three years ended March 31, 2017, in excess of the limits specified under Schedule V to the Companies Act, 2013, in case of inadequacy of profits. The Parent Company has re-represented to the office of the Ministry of Corporate Affairs (MCA) for approval of remuneration within the overall limits approved by the members of the Parent Company for the years ended March 31, 2015 and March 31, 2016, and that for the year ended March 31, 2017, applications for revision in the remuneration, as approved by the members of the Parent Company, has been made to the MCA. The responses in respect of the foregoing re-representation / applications for revision are awaited from the MCA. On receipt of the requisite approvals, the balance amount of remuneration for the aforesaid years, if any, as per their entitlement, shall be paid to the Managing Director and the Whole-time Director(s), as applicable, and the same shall be given effect to in the year in which the approval is received. Excess remuneration, if any, after final approval in respect of the re-representation/applications for revision is received, shall be refunded by the respective Managing Director and the Whole-time Director(s).
Note 65
The Parent Company completed buy-back of 7,500,000 equity shares of ` 1 each (representing 0.31% of total pre buy-back paid up equity capital) on October 18, 2016, from the shareholders on a proportionate basis by way of a tender offer at a price of ` 900 per equity share for an aggregate amount of ` 6,750.0 Million in accordance with the provisions of the Companies Act, 2013 and the SEBI (Buy Back of Securities) Regulations, 1998. This buy-back of equity shares was approved by the Board of Directors of the Parent Company at its meeting held on June 23, 2016.
Note 66
Pursuant to the Scheme of Arrangement u/s 391 to 394 of the Companies Act, 1956 for amalgamation of erstwhile RLL with the Parent Company as sanctioned by the Hon’ble High Court of Gujarat and Hon’ble High Court of Punjab and Haryana on March 24, 2015 (effective date) all the assets, liabilities and reserves of erstwhile RLL were transferred to and vested in the Parent Company with effect from April 01, 2014, the appointed date. Erstwhile RLL along with its subsidiaries and associates was operating as an integrated international pharmaceutical organisation with business encompassing the entire value chain in the production, marketing and distribution of pharmaceutical products. The scheme was accordingly been given effect to in the Consolidated Financial Statements for the year ended March 31, 2015. On April 10, 2015, in terms of the Scheme of Arrangement 0.8 equity share of ` 1 each (Number of Shares 334,956,764 including 186,516 Shares held by ESOP trust) of the Parent Company has been allotted to the shareholders of erstwhile RLL for every 1 share of ` 5 each (Number of Shares 418,695,955 including 233,146 shares held by ESOP trust) held by them in the share capital of erstwhile RLL, after cancellation of 6,967,542 shares of erstwhile RLL. These shares were considered for the purpose of calculation of earnings per share appropriately. The net effect of ` 982.5 Million being the difference between the amount recorded as share capital, the amount of the share capital of erstwhile RLL and cancellation of shares of erstwhile RLL has been reduced from Reserves.
Note 67
Pursuant to the declaration executed by the Sun Pharma Laboratories Limited (SPLL), a wholly owned subsidiary, in favour of Trumpcard Advisors and Finvest LLP (‘Donee’) on March 31, 2017, the power
undertaking of SPLL (‘Donor’) has been gifted to Trumpcard Advisors and Finvest LLP. Accordingly, on and with effect from the close of business hours on March 31, 2017, all the assets, movable and immovable, tangible and intangible, along with the liabilities pertaining to the power undertaking stand transferred to and vested in Trumpcard Advisors and Finvest LLP as a going concern without consideration. For this purpose, the net book value on gift of power undertaking has been added to the cost of investment of the SPLL in Vintage Power Generation LLP, being the partner of the Donee.
Note 68
DETAILS OF LONG TERM BORROWINGS AND CURRENT MATURITIES OF LONG TERM DEBT AND FINANCE LEASE OBLIGATIONS [INCLUDED UNDER OTHER FINANCIAL LIABILITIES (CURRENT)]
A Secured Term Loan from banks: (I) Long term loan of ` Nil (March 31, 2016: ` Nil, April 01,
2015: USD 5.9 Million - ` 368.0 Million) [Included in long term borrowings ` Nil (March 31, 2016: ` Nil, April 01, 2015 ` 311.0 Million) and ` Nil (March 31, 2016: ` Nil, April 01, 2015: ` 57.0 Million) in current maturities of long term debt] which was repayable by October 2020 has been repaid during the year ended March 31, 2016. The loan was secured by building situated at New York, USA.
(II) Loan of ` Nil (March 31, 2016: ` Nil, April 01, 2015 BRL 0.8 Million - ` 16.4 Million) included in long term borrowings ` Nil (March 31, 2016: ` Nil, April 01, 2015 ` 16.4 Million) which was repayable by December 2016 has been repaid during the year ended March 31, 2016. The loan was secured by land and factory building situated at Goiania, Brazil.
B Secured Term Loan from Other Parties: Secured term loan from department of biotechnology of
` 108.2 Million (March 31, 2016: ` 77.3 Million, April 01, 2015: ` 77.3 Million) has been secured by hypothecation of assets and goods of the Parent Company. The loan is repayable in 10 equal half yearly installments commencing from December 26, 2018, last installment is due on June 26, 2023.
C Lease obligations of ` 702.0 Million (March 31, 2016: ` 748.5 Million, April 01, 2015: ` 24.1 Million) [included in non-current
borrowing March 31, 2017: ` 662.5 Million (March 31, 2016: ` 715.8 Million, April 01, 2015: ` 2.2 Million) and March 31, 2017: ` 39.5 Million (March 31, 2016: ` 32.7 Million and April 01, 2015: ` 21.9 Million) in current maturities of long term finance lease obligations] repayable by FY 2019-2025 is secured against assets taken on finance lease.
D Unsecured Term Loan from banks: (i) Loan of USD 17.5 Million equivalent to ` 1,134.2 Million
(March 31, 2016: USD 18.2 Million equivalent ` 1,206.7 Million, April 01, 2015: USD 18.9 Million equivalent ` 1,181.6 Million) [Included in non-current borrowing March 31, 2017: ` 1,085.2 Million (March 31, 2016: ` 1,158.8 Million, April 01, 2015: ` 1,138.3 Million) and March 31, 2017: ` 49.0 Million (March 31, 2016: ` 47.9 Million, April 01, 2015: ` 43.3 Million) in current maturities of long term debt], which is repayable in varying amounts by June 2033. The loan is collateralized by substantially all the assets of Pharmalucence Inc.
(ii) External Commercial Borrowings (ECBs) has 6 loans aggregating of USD 256 Million (March 31, 2016: USD 266 Million, April 01, 2015: USD 288 Million) equivalent to ` 16,602.9 Million (March 31, 2016: ` 17,625.2 Million, April 01, 2015: ` 18,001.4 Million) [(included in long term borrowings ` 7,523.2 Million (March 31, 2016: ` 15,902.4 Million, April 01, 2015: ` 11,625.9 Million) and in current maturities of long term debt ` 9,079.7 Million (March 31, 2016: ` 1,722.8 Million, April 01, 2015: ` 6,375.5 Million))]. For the ECB loans outstanding as at March 31, 2017, the terms of repayment for borrowings are as follows:
a) USD Nil (March 31, 2016: USD Nil, April 01, 2015: USD 50 Million) equivalent to ` Nil (March 31, 2016: ` Nil, April 01, 2015: ` 3,125.2 Million). The loan was taken on August 12, 2010. The outstanding amount has been repaid during the year ended March 31, 2016.
b) USD Nil (March 31, 2016: USD Nil, April 01, 2015: USD 30 Million) equivalent to ` Nil (March 31, 2016: ` Nil, April 01, 2015: ` 1,875.2 Million). The loan was taken on September 9, 2010. The outstanding amount has been repaid during the year ended March 31, 2016.
SUN PHARMACEUTICAL INDUSTRIES L IMITED256
NOTES TO THE CONSOLIDATED FINANCIAL STATEMENTS
FOR THE YEAR ENDED MARCH 31, 2017
c) USD 10 Million (March 31, 2016: USD 20 Million, April 01, 2015: USD 30 Million) equivalent to ` 648.6 Million (March 31, 2016: ` 1,325.2 Million, April 01, 2015: ` 1,875.2 Million). The loan was taken on June 30, 2011 and is repayable in 3 equal installments of USD 10 Million each at the end of 4th year, 5th year and 6th year. Second installment of USD 10 Million has been repaid in current year and first installment of USD 10 Million was repaid during the year ended March 31, 2016. The last installment is due on June 30, 2017.
d) USD 50 Million (March 31, 2016: USD 50 Million, April 01, 2015: USD 50 Million) equivalent to ` 3,242.8 Million (March 31, 2016: ` 3,313.0 Million, April 01, 2015: ` 3,125.2 Million). The loan was taken on September 20, 2012 and is repayable on September 19, 2017.
e) USD 100 Million (March 31, 2016: USD 100 Million, April 01, 2015: USD 100 Million) equivalent to ` 6,485.5 Million (March 31, 2016: ` 6,626.0 Million, April 01, 2015: ` 6,250.5 Million). The loan was taken on June 04, 2013 and is repayable on June 03, 2018.
f) USD Nil (March 31, 2016: USD 16 Million, April 01, 2015: USD 28 Million) equivalent to ` Nil (March 31, 2016: ` 1,060.2 Million, April 01, 2015: ` 1,750.1 Million). Loan of USD 40 Million was taken on March 25, 2011 and was repayable in 3 installments viz., 30% each of the drawn amount at the end of 4th year and 5th year and 40% of the drawn amount at the end of the 6th year. The last installment of USD 16 Million has been repaid in current year. First and Second installment of USD 12 Million each has been repaid in previous years.
g) USD 50 Million (March 31, 2016: USD 50 Million, April 01, 2015: USD Nil) equivalent to ` 3,242.8 Million (March 31, 2016: ` 3,313.0 Million, April 01, 2015: ` Nil) The loan was taken on August 11, 2015 and is repayable on August 11, 2017.
h) USD 30 Million (March 31, 2016: USD 30 Million, April 01, 2015: USD Nil) equivalent to ` 1,945.7 Million (March 31, 2016: ` 1,987.8 Million, April 01, 2015: ` Nil) The loan was taken on September 09, 2015 and is repayable on September 08, 2017.
i) USD 16 Million (March 31, 2016 : USD Nil, April 01, 2015: USD Nil) equivalent to ` 1,037.7 Million (March 31, 2016: ` Nil, April 01, 2015: ` Nil). The loan was taken on March 24, 2017 and is repayable on March 22, 2019.
(iii) Loan under Foreign Currency Non Resident (FCNR B) Scheme of USD 50.0 Million (March 31, 2016: USD 50 Million, April 01, 2015: USD Nil) equivalent to ` 3,242.8 Million (March 31, 2016: ` 3,313.0 Million, April 01, 2015: ` Nil). The loan was taken on August 19, 2015 and is repayable on August 18, 2017.
E Unsecured Debentures: 10,000.0 Million (March 31, 2016: ` 10,000 Million; April
01, 2015: ` Nil) Rated unsecured listed redeemable non-convertible debentures at a coupon rate of 7.94% p.a. were issued by Sun Pharma Laboratories Limited (“SPLL” - the Wholly owned subsidiary) on December 23, 2015. Following are the details:
Particulars Face Value (`)Redemption
Amount (` in Million)
Date of Redemption
Rated Unsecured Listed Redeemable 5,000 Non-Convertible Debentures Series 2 1,000,000 5,000.0 March 22, 2019Rated Unsecured Listed Redeemable 5,000 Non-Convertible Debentures Series 1 1,000,000 5,000.0 December 22, 2017
F Unsecured Term Loan from Other Parties: Unsecured loan from other parties amounting to ` Nil (March 31, 2016: ` Nil, April 01, 2015: ` 513.1 Million) of which ` Nil (March 31,
2016: ` Nil, April 01, 2015: ` 497.6 Million) was repayable after August 2016 on demand and balance of ` Nil (March 31, 2016: ` Nil, April 01, 2015: ` 15.5 Million) was repayable after March 2016 on demand. The above loans has been repaid during the year ended March 31, 2016.
G Term Loan from banks and Debentures (included under current maturities of long term borrowing): (i) Redeemable non-convertible debentures of ` Nil (March 31, 2016: ` Nil, April 01, 2015: ` 5,000.0 Million) issued on November 23,
2012 for a period of 36 months at a coupon rate of 9.20% p.a. Such debentures were secured by a pari-passu first ranking charge on the Parent Company’s specified fixed assets so as to provide a fixed asset cover of 1.25x and were listed on the National Stock Exchange. The loan was taken on November 23, 2012 and has been repaid during the year ended March 31, 2016.
(ii) Unsecured Term Loan of ` Nil (March 31, 2016: ` Nil, April 01, 2015: ` 2,500.0 Million) has been repaid during the year ended March 31, 2016.
The Parent Company has not defaulted on repayment of loan and interest payment thereon during the year.
Note 69 DETAILS OF SECURITIES FOR SHORT TERM BORROWINGS ARE AS UNDER:First charge has been created on a pari-passu basis, by hypothecation of inventories, trade receivables, outstanding money receivables, claims and bills and other receivables (includes under loans and advances and other assets), both present and future.
Note 70 LOANS/ADVANCES DUE FROM AN ASSOCIATE
` in Million
As at March 31, 2017
As at March 31, 2016
As at April 01, 2015
Interest bearing with specified repayment schedule:Zenotech Laboratories Limited, India *Considered good - - 326.8 Considered doubtful 726.9 663.5 274.0
726.9 663.5 600.8 Less: Allowance for doubtful loan/interest accrued and due on loan 726.9 663.5 274.0
- - 326.8
* includes interest accrued and due on loans amounting to ` 214.9 Million (March 31, 2016: ` 151.5 Million; April 01, 2015: ` 88.8 Million).
Loans have been granted to the above entity for the purpose of its business.
Consequent to the amalgamation of erstwhile RLL into the Parent Company as referred in Note 66, Zenotech Laboratories Limited (‘Zenotech’) had become an associate of the Parent Company. The erstwhile RLL had granted certain loans to Zenotech which were outstanding and inherited by the Parent Company. The Parent Company has not granted any further loans to Zenotech post effective date of amalgamation i.e. March 24, 2015. The balance of this inherited outstanding loan is ` 512.0 Million. The Parent Company is in process of evaluating various options in relation to recovery of the outstanding loans and interest thereon of ` 214.9 Million (March 31, 2016: ` 151.5 Million, April 01, 2015: ` 88.8 Million).
SUN PHARMACEUTICAL INDUSTRIES L IMITED258
NOTES TO THE CONSOLIDATED FINANCIAL STATEMENTS
FOR THE YEAR ENDED MARCH 31, 2017
Note 71
DETAILS OF SPECIFIED BANK NOTES (SBN) HELD AND TRANSACTED OF THE PARENT COMPANY AND SUBSIDIARIES COMPANIES IN INDIA DURING THE PERIOD FROM NOVEMBER 08, 2016 TO DECEMBER 30, 2016 IS AS FOLLOWS:
All amounts in absolute `
Particulars Specified bank notes*
Other denomination notes Total
Closing cash in hand as on November 08, 2016 2,964,000 5,427,960 8,391,960 Permitted receipts during November 08, 2016 and December 30, 2016 - 14,405,657 14,405,657 Permitted payments during November 08, 2016 and December 30, 2016 (280,500) (12,794,823) (13,075,323)Amount deposited in banks (2,683,500) - (2,683,500)Closing cash in hand as on December 30, 2016 - 7,038,794 7,038,794
* Specified bank notes are currency notes of ` 500 and ` 1000 discontinued vide notification S.O. 3407(E) dated November 08, 2016.
Note 72
The Group has benefited from active grants from Government of Romania and European Union. These grants were received for building, plant and machinery and laboratory equipment. The grant will be amortised in varying periods based on category of asset and from the date when grant is received. Amortisation period ranges from 2 months to 338 months.
Note 73
Property, plant and equipment consisting of land, building, plant and equipment, furniture and fixtures amounting to ` 65.9 Million (March 31, 2016: ` 71.9 Million, April 01, 2015: ` Nil) in respect of the manufacturing facility in Ireland are held for sale. The management expects disposal of these assets in financial year 2017-2018.
Note 74 DISCLOSURE OF A SUBSIDIARY THAT HAS NON-CONTROLLING INTEREST THAT IS MATERIAL TO THE GROUP
Name of Subsidiary Principal place of business
Country of incorporation Nature* As at March
31, 2017As at March
31, 2016As at April
01, 2015Taro Pharmaceutical Industries Ltd. and its subsidiaries (TARO Group)
United States of America
Israel Beneficial ownership
27.19% 31.02% 31.13%
Voting power 18.13% 20.68% 20.76%* Held by Non-controlling interest
March 31, 2016Consolidated Statement of profit and loss of TARO GroupTotal Income 60,748.8 63,350.5 Total Expenses (23,243.0) (21,951.6)Profit after Tax 30,612.9 35,472.4 Total comprehensive income for the year 25,241.9 40,406.9
` in MillionYear ended
March 31, 2017Year ended
March 31, 2016Consolidated cash flows information of TARO GroupCash flow from operating activities 29,345.5 25,853.2 Cash flow from investing activities (7,899.4) (18,629.9)Cash flow from financing activities 40,268.8 37,737.2
There has been no dividend paid by TARO during the year ended March 31, 2017 and March 31, 2016.
Note 75
(a) Sun Pharma Global FZE, a subsidiary of the Parent Company holds 23.35% in the capital of Enceladus Pharmaceutical B.V. However, as Sun Pharma Global FZE does not have any ‘Significant Influence’ in Enceladus Pharmaceutical B.V., as is required under Ind AS 28 - “Investment in Associates & Joint Ventures”, the said investment in Enceladus Pharmaceutical B.V. has not been consolidated as an “Associate Entity”.
(b) The Parent Company holds 24.91% in the capital of Shimal Research Laboratories Limited. However, as the Parent Company does not have any ‘Significant Influence’ in Shimal Research Laboratories Limited, as is required under Ind AS 28 - “Investment in Associates & Joint Ventures”, the said investment in Shimal Research Laboratories Limited has not been consolidated as an “Associate Entity”.
SUN PHARMACEUTICAL INDUSTRIES L IMITED260
NOTES TO THE CONSOLIDATED FINANCIAL STATEMENTS
FOR THE YEAR ENDED MARCH 31, 2017
Note 76
FIRST TIME IND AS ADOPTION RECONCILIATIONi Explanation to transition to Ind AS Ind AS 101 -“First-time Adoption of Indian Accounting Standards”
requires that all Ind AS standards and interpretations that are issued and effective for the first Ind AS consolidated financial statements which is for the year ended March 31, 2017 for the Group, be applied retrospectively and consistently for all financial years presented. Except for the Group has availed certain exemptions and complied with the mandatory exceptions provided in Ind AS 101, as described below. The Group has recognised all assets and liabilities whose recognition is required by Ind AS and has not recognised items of assets or liabilities which are not permitted by Ind AS, reclassified items from previous GAAP to Ind AS as required under Ind AS and applied Ind AS in measurement of recognised assets and liabilities.
Set out below are the Ind AS 101 optional exemptions availed as applicable and mandatory exceptions applied in the transition from previous GAAP to Ind AS.
ii Derecognition of financial assets and financial liabilities The Group has applied the derecognition requirements of financial
assets and financial liabilities prospectively for transactions occurring on or after the transition date.
iii Hedge accounting At the date of transition to Ind AS, the Group has measured all
derivatives at fair value and eliminated all deferred losses and gains arising on derivatives that were reported in accordance with previous GAAP as if they were assets or liabilities.
iv Classification and measurement of financial assets The Group has assessed conditions for classification of the
financial assets on the basis of the facts and circumstances that were exist on the date of transition to Ind AS.
v Deemed cost of property, plant and equipment and other intangible assets
On transition to Ind AS, the Parent Company and the Indian subsidiaries have elected to continue with the carrying value of all of its property, plant and equipment and other intangible assets recognised as at April 01, 2015 measured as per the previous GAAP and use that carrying value as the deemed cost of the property, plant and equipment and other intangible assets.
vi Designation of previously recognised financial instruments Ind AS 101 allows an entity to designate investments in equity
instruments at FVTOCI on the basis of the facts and circumstances at the date of transition to Ind AS. The Group has elected to apply this exemption for its investments in certain equity instruments.
vii Compound financial instruments Under Ind AS 32, the Group should split compound financial
instruments into separate equity and liability components. Ind AS 101 provides that if the liability component is no longer outstanding at the date of transition, a first-time adopter does not have to separate it from the equity component. The Group has elected to apply this exemption for its compound financial instruments.
viii Fair value measurement of financial assets and financial liabilities at initial recognition
The Group has applied the requirements in paragraph B5.1.2A (b) of Ind AS 109 prospectively to transactions entered into on or after the date of transition to Ind AS. This exemption has been availed by the Group.
ix Non - current assets held for sale and discontinued operations
Ind AS 105 requires that asset classified as non - current as per Ind AS 1 are not reclassified as current assets until they meet criteria to be classified as held for sale. The adopter can opt to either value those assets at carrying amount or fair value less cost of sale at the transition date and record any difference between such amount and carrying value directly to retained earnings. The Group has applied for this exemption.
x Business Combinations Ind AS 101 provides the option to apply Ind AS 103 prospectively
from the transition date or from a specific date prior to the transition date. This provides relief from full retrospective application that would require restatement of all business combinations prior to the transition date. The Group elected to apply Ind AS 103 prospectively to business combinations occurring after its transition date. Business combinations occurring prior to the transition date have not been restated.
xi Share-based payment transactions As per previous GAAP, the Group had applied the fair value
recognition and measurement principles similar to those prescribed
under Ind AS 102 for all options granted before the Transition Date. Consequently, this exemption was not required to be applied.
xii Non-controlling interests Ind AS 110 requires entities to attribute the profit or loss and each component of other comprehensive income to the owners of the parent
and to the non-controlling interests. Ind AS 110 requires the above requirement to be followed prospectively from the date of transition. Consequently, the group has applied the above requirement prospectively.
xiii Cumulative translation differences on foreign operations The Group has elected the option to reset the cumulative translation differences on foreign operations that exists as of the transition date to zero.
xiv Excise duty Under the previous GAAP, excise duty was netted off against sale of products. However, under Ind AS, excise duty is included in sale of
products and is separately presented as expense in the consolidated statement of profit and loss.` in Million
Footnote No.
As at March 31,
2016
As at April 01,
2015Reconciliation of total equityEquity as per previous GAAP * 314,042.2 256,231.9
Add / (Less) : Adjustments for GAAP DifferencesAdjustment for proposed dividend (including corporate dividend tax) a 2,896.8 8,689.2 Effect of measuring derivative instruments at fair value through profit or loss b 922.5 823.8 Discount / (Unwinding of discount) on provisions c 885.1 1,382.3 Recognition of intangible assets not eligible for recognition under previous GAAP d 30.1 - Provision for expected credit losses f (201.2) (118.8)Effect of measuring financial instruments at fair value through OCI g 4,069.3 6,883.5 Effect of measuring investments at fair value through profit or loss h 72.8 581.6 Retrospective application of Ind AS 21 to goodwill arising in business combinations occurred before the date of transition to Ind AS
i 5,422.3 4,417.4
Tax impact on Ind AS adjustments (including on unrealised intra group profits on inventories) j 1,518.8 1,387.3 Other Ind AS adjustments 166.1 136.3
Equity as per Ind AS 329,824.8 280,414.5
* Equity as per previous GAAP includes share capital, share suspense account and reserves and surplus.
SUN PHARMACEUTICAL INDUSTRIES L IMITED262
NOTES TO THE CONSOLIDATED FINANCIAL STATEMENTS
FOR THE YEAR ENDED MARCH 31, 2017
` in MillionFootnote
No.Year ended
March 31, 2016Reconciliation of total comprehensive incomeProfit for the year as per previous GAAP 47,159.1
Add / (Less) : Adjustments for GAAP DifferencesEffect of measuring derivative instruments at fair value through profit or loss b 98.7 Effect of measuring investments at fair value through profit or loss h (508.8)Discount / (Unwinding of discount) on provisions c (497.2)Remeasurement of defined benefit obligation recognised in OCI under Ind AS e 389.7 Recognition of intangible assets not eligible for recognition under previous GAAP d 30.1 Provision for expected credit losses f (82.4)Tax impact on Ind AS adjustments (including on unrealised intra group profits on inventories) j 131.5 Other Ind AS adjustments k (1,263.6)
Profit for the year as per Ind AS - attributable to the owners of the company 45,457.1 Other comprehensive income (net of tax) 12,794.5
Total comprehensive income pertaining to the owners of the company 58,251.6
Effect of Ind AS adoption on the statement of cash flow for the year ended March 31, 2016` in Million
Previous GAAPEffect of
transition to Ind AS
Ind AS
Net cash flows from operating activities 67,693.8 (835.2) 66,858.6 Net cash flows from investing activities (44,549.1) 833.2 (43,715.9)Net cash flows from financing activities (19,243.2) 357.9 (18,885.3)Net increase in cash and cash equivalents 3,901.5 355.9 4,257.4
Net increase in cash and cash equivalents represents:(i) Movement in cash credit facilities considered as a component of cash and cash equivalents under Ind AS which as per previous GAAP, was considered as
financing activity.
(ii) Consideration paid for obtaining control of subsidiaries / business unit being disclosed as net of cash and cash equivalents acquired as part of such transactions under Ind AS and
(iii) Changes in cash and cash equivalent balances due to equity accounting of joint ventures under Ind AS.
Other Ind AS adjustments are either non cash adjustments or are regrouping among the cash flows from operating, investing and financing activities and has no impact on the net cash flow for the year ended March 31, 2016 as compared with the previous GAAP.
Footnotes:a) Proposed Dividend (including corporate dividend tax) Under Ind AS, dividend to holders of equity instruments is recognised as a liability in the period in which the obligation to pay is
established. Under previous GAAP, dividend proposed was recorded as a provision in the period to which it relates.
b) Derivative instruments at fair value through profit or loss Under previous GAAP, derivative instruments entered into for hedging the foreign currency fluctuation risk were accounted for on the
principles of prudence. Pursuant to this, losses, if any, on Mark to Market basis, were recognised and gains were not recognised. Under Ind AS, gains on derivative instruments have been measured at fair value through profit or loss.
c) Discounting/(unwinding of discount) on provisions Under Ind AS, long term provisions are to be measured at
present value at the date of transition.
d) Separately acquired intangible assets Under Ind AS, separately acquired intangible assets shall be
capitalised which were not eligible for capitalisation under previous GAAP.
e) Employee benefits Under previous GAAP, actuarial gains and losses were recognised
in consolidated statement of profit and loss. Under Ind AS, the actuarial gains and losses form part of remeasurement of net defined benefit liability / asset, which is recognised in other comprehensive income in the respective periods.
f) Expected credit loss Under previous GAAP, the Group had created provision for
doubtful debts based on specific amount for incurred losses. Under Ind AS, the allowance for doubtful debts has been determined based on expected credit loss model.
g) Effect of measuring financial instruments at fair value through OCI
Under Ind AS, the Group has measured financial instruments at fair value through OCI, which were not applicable in previous GAAP.
h) Effect of measuring investments at fair value through profit or loss
Under previous GAAP, non current investments were stated at cost less provision, if any, for other than temporary diminution in value. Current investments were valued at lower of cost and fair value. Under Ind AS, gains or losses on investments have been measured at fair value through profit or loss.
i) Retrospective application of Ind AS 21 to goodwill arising in business combinations occurred before the date of tran-sition to Ind AS
Under Ind AS, retrospective application of Ind AS 21 to goodwill arising in business combinations occurred before the date of transition to Ind AS, which has resulted in increase in equity.
j) Tax impact on Ind AS adjustments In the financial statements prepared under Previous GAAP,
deferred tax was accounted as per the income statement approach which required creation of deferred tax asset/liability on temporary differences between taxable profit and accounting profit. Under Ind AS, deferred tax is accounted as per the Balance Sheet approach which requires creation of deferred tax asset/liability on temporary differences between the carrying amount of an asset/liability in the Balance Sheet and its corresponding tax base. The application of Ind AS has also resulted in recognition of deferred tax on new temporary differences which were not required to be recognised under previous GAAP, including deferred taxes in respect of unrealised intra group profits on inventories.
Further, deferred tax assets on unabsorbed depreciation and carry forward of losses was recognised only to the extent of virtual certainty supported by convincing evidence under previous GAAP as against recognition of such assets under Ind AS to the extent that it is probable that the said assets would be utilised.
k) Other Ind AS adjustments Other Ind AS adjustments mainly pertains to difference in loss
on disposal of foreign subsidiaries, determined under Ind AS as compared to previous GAAP, in view of the Group availing exemption as referred to in note 76(xiii) and difference in treatment of cumulative translation differences on translation of foreign operations.
Note 77
USE OF ESTIMATES AND JUDGEMENTSThe preparation of the Group’s financial statements requires the management to make judgements, estimates and assumptions that affect the reported amounts of revenues, expenses, assets and liabilities, and the accompanying disclosures, and the disclosure of contingent liabilities. Actual results may differ from these estimates. Estimates and underlying assumptions are reviewed on an ongoing basis. Revisions to accounting estimates are recognised in the period in which the estimates are revised and in any future periods affected. In particular, information about significant areas of estimation uncertainty and critical judgments in applying accounting policies that have the most significant effect on the amounts recognised in the consolidated financial statements is included in the following notes:
SUN PHARMACEUTICAL INDUSTRIES L IMITED264
NOTES TO THE CONSOLIDATED FINANCIAL STATEMENTS
FOR THE YEAR ENDED MARCH 31, 2017
1 Fair value measurement of Financial Instruments
When the fair values of financials assets and financial liabilities recorded in the financial statements cannot be measured based on quoted prices in active markets, their fair value is measured using valuation techniques which involve various judgements and assumptions.
2 Useful lives of property, plant and equipment and intangible assets (Refer note 2)
Property, plant and equipment and other intangible assets represent a significant proportion of the asset base of the Group. The charge in respect of periodic depreciation and amortisation is derived after determining an estimate of an asset’s expected useful life and the expected residual value at the end of its life. The useful lives and residual values of Group’s assets are determined by the management at the time the asset is acquired and reviewed periodically, including at each financial year end. The lives are based on historical experience with similar assets as well as anticipation of future events, which may impact their life, such as changes in technical or commercial obsolescence arising from changes or improvements in production or from a change in market demand of the product or service output of the asset.
3 Assets and obligations relating to employee benefits (Refer note 56)
The employment benefit obligations depends on a number of factors that are determined on an actuarial basis using a number of assumptions. The assumptions used in determining the net cost/ (income) include the discount rate, inflation and mortality assumptions. Any changes in these assumptions will impact upon the carrying amount of employment benefit obligations.
4 Tax expense [Refer Note 2(r)] Significant judgements are involved in determining the
provision for income taxes, if any, including amount expected to be paid/recovered for uncertain tax positions. Further, significant judgement is exercised to ascertain amount of deferred tax asset (DTA) that could be recognised based on the probability that future taxable profits will be available against which DTA can be utilized and amount of temporary difference
in which DTA can not be recognised on want of probable taxable profits.
5 Provisions [Refer note 2(n)]6 Write down in value of inventories (Refer Note 11)7 Contingencies (Refer note 40)8 Business combinations (Refer note 78)9 Impairment of goodwill (Refer note 48)
Note 78
BUSINESS COMBINATIONSa) Acquisition of plant (Baska, Gujarat) from Unimed
Technologies Limited On March 25, 2017, the Group completed the acquisition
of the manufacturing undertaking of Unimed Technologies Limited located at Baska, Gujarat which is engaged in the manufacturing of pharmaceutical products, on a slump sales basis to continue expansion of our business. The acquisition price of ` 10.0 Million was paid in cash.
The following assets and liabilities were recognised as at the date of acquisition (at fair value):
` In MillionAssetsCash and cash equivalents 0.2 Trade receivables 48.0 Inventories 307.7 Other current assets 371.1 Other non-current financial assets 10.6 Capital work-in-progress 522.1 Property, plant and equipment 633.5
1,893.2 LiabilitiesTrade payables (748.2)Provision for employee benefits (13.7)Other current financial liabilities (122.4)Borrowings (1,000.0)
(1,884.3)Total identifiable assets at fair value 8.9Goodwill 1.0 Total purchase price 9.9
The goodwill is tax deductible.
The gross amount of trade receivables acquired have been largely collected.
There has not been any contribution to group revenue on account of this business purchase. The business acquired has contributed a net loss of ` 13.5 Million from the date of acquisition.
b) JSC Biosintez On December 20, 2016, the Group completed the acquisition
of 85.1% shares of JSC Biosintez, a Russian pharmaceutical company focused on the hospital segment with an objective to acquire the product portfolio and local manufacturing capability in Russia which would help in expanding our presence in Russia and serving Russia pharmaceutical market more effectively. The excess of the purchase consideration paid over the fair value of assets acquired has been attributed to goodwill. The goodwill is not tax deductible.
The business acquisition was conducted by entering into a share purchase agreement for cash consideration of ` 1,539.2 Million.
The Group has elected to measure the non-controlling interests in the acquiree at its proportionate share of net assets.
The following assets and liabilities were recognised in the acquisition (at fair value):
` In MillionAssetsCash and cash equivalents 2.8 Trade receivables 1,028.5 Inventories 399.9 Other current assets 31.9 Other non-current assets 60.9 Property, plant and equipment 3,522.0 Capital work-in-progress 259.4 Other intangible assets 3.5 Intangible assets under development 69.7
(3,702.3)Total identifiable assets at fair value 1,676.3 Non-controlling interest 14.9%Non- controlling interest measured at the Group's proportionate share in net assets
(249.7)
Goodwill 112.6 Total purchase price 1,539.2
The gross amount of trade receivables acquired have been largely collected.
From the date of acquisition, JSC Biosintez has contributed revenue of ` 907.2 million and profit before tax of ` 43.0 million to the Group. If the business combinations had taken place at the beginning of the year, revenue would have been ` 3,308.7 million and the profit before tax would have been ` 216.8 million.
Transaction costs of ` 97.9 million have been expensed and are included in other expenses in the consolidated statement of profit and loss.
c) Insite Vision Incorporated On November 02, 2015, the Group acquired 100% shares
of Insite Vision Incorporated along with its subsidiary Insite Vision Limited (together referred as “Insite”). Accordingly, the results of operations for Insite have been included in these consolidated financial statements from that date forward. The Group acquired Insite to facilitate its entry and expansion into the ophthalmic market in the United States. The excess of the purchase consideration paid over the fair value of assets acquired has been attributed to goodwill. The goodwill is not tax deductible.
The business acquisition was conducted by entering into a share purchase agreement for cash consideration of ` 4,688.4 Million.
The following assets and liabilities were recognised as at the date of acquisition (at fair value):
` In MillionAssetsCash and cash equivalents 214.3Trade receivables 10.5Other current assets 13.0Property, plant and equipment 87.5Intangible assets under development 4,501.9
4,827.2 LiabilitiesTrade payables (257.5)Other current liabilities (276.1)
(533.6)Total identifiable assets at fair value 4,293.6 Goodwill 445.0 Total purchase price 4,738.6
SUN PHARMACEUTICAL INDUSTRIES L IMITED266
NOTES TO THE CONSOLIDATED FINANCIAL STATEMENTS
FOR THE YEAR ENDED MARCH 31, 2017
The gross amount of trade receivables acquired have been largely collected.
InSite Vision Incorporate had revenue of ` 50.7 Million and loss before tax of ` 459.4 Million during the five months of 2016. If the business combinations had taken place at the beginning of the year, revenue would have been ` 369.1 Million and the loss before tax would have been ` 1,561.1 Million.
Transaction costs of ` 68.2 million have been expensed and are included in other expenses in the consolidated statement of profit and loss.
d) Acquisition of GSK’s opiate business in Australia
On September 01, 2015, the Group completed the acquisition of GlaxoSmithKline’s (GSK’s) opiates business in Australia, strengthening its active pharmaceutical ingredients (API) and analgesic drug segments. This acquisition also enhances the opiate alkaloids portfolio of the group and depth in global opiates market. The acquisition price of ` 6,720.5 million was paid/payable in cash.
The following assets and liabilities were recognised as at the date of acquisition (at fair value):
` In MillionAssetsInventories 4,212.5 Property, plant and equipment 2,510.4 Other intangible assets 373.7
7,096.6 LiabilitiesProvision for employee benefits (224.7)Other current liabilities (151.4)
(376.1)Total identifiable assets at fair value 6,720.5 Goodwill -Total purchase price 6,720.5 GSK opiate business had revenue of ` 2,063.9 Million and loss of ` 281.1 million during the seven months of 2016 and revenue of ` 4,744.6 million and loss before tax of ` 345.2 Million in the current year.
Transaction costs of ` 47.8 Million have been expensed and are included in other expenses in the consolidated statement of profit and loss.
Note 79
a) During the December 2016, the Group acquired a branded
oncology product, Odomzo, from Novartis for an upfront payment of USD 175 Million equivalent to ` 11,884.3 Million approximately and additional milestone payments.
b) During the year ended March 31, 2016, the Group acquired portfolio consisting of 14 established prescription brands from Novartis AG and Novartis Pharma AG in Japan for a cash consideration of USD 293 Million equivalent to ` 19,414.2 Million approximately.
Note 80
a) Figures pertaining to the subsidiary companies have been
reclassified wherever necessary to bring them in line with the group financial statements.
b) Previous GAAP figures have been reclassified/regrouped wherever necessary to conform with the consolidated financial statements prepared under Ind AS.
Disclosure of additional information pertaining to the Parent Company, subsidiaries, associates and joint ventures as per Schedule III of Companies Act, 2013:
Name of the EntityNet Assets, i.e., total assets
minus total liabilities Share in profit or (loss)Share in Other
63 "Ranbaxy Pharmaceuticals Ukraine" LLC 0.0 107.4 0.0 27.1 - - 0.0 27.1 Non controlling interest in all subsidiaries 9.4 37,908.6 (12.7) (8,818.6) (11.5) 1,534.3 (12.9) (7,284.3)Associate (Investment as per the equity method)Indian1 Zenotech Laboratories Limited - - - - - - - - Foreign Joint Ventures (Investment as per equity method)1 MSD - Sun LLC (Consolidated with its subsidiary) 0.0 0.7 - - - - - - Intercompany Elimination and Consolidation Adjustments (165.9) (670,772.1) 24.9 17,348.6 65.9 (8,786.8) 15.2 8,561.8 Total 100.0 404,305.3 100.0 69,643.7 100.0 (13,337.6) 100.0 56,306.1
# Includes share of profit and share of TCI, from its associates and a joint venture of ` 101.8 million
* Includes share of loss and share of TCI, from a joint venture of ` 2.5 million
The above amounts / percentage of net assets and net profit or (loss) in respect of the Parent Company, its subsidiaries, associates and joint ventures are determined based on the amounts of the respective entities included in consolidated financial statements before inter-company eliminations / consolidation adjustments. Refer note 39 (e)
Disclosure of additional information pertaining to the Parent Company, subsidiaries, associates and joint ventures as per Schedule III of Companies Act, 2013:
Name of the EntityNet Assets, i.e., total assets
minus total liabilities Share in profit or (loss)Share in other
48 Ranbaxy (Poland) Sp. Z o.o. 0.0 156.6 0.0 16.0 - - 0.0 16.0 49 Ranbaxy Portugal - Com E Desenvolv DeProd Farmaceuticos
Unipessoal Lda - - (0.0) (1.6) - - (0.0) (1.6)
50 S. C. Terapia S.A. 2.5 9,204.4 4.3 1,945.0 - - 3.3 1,945.0 51 AO Ranbaxy (Formerly Known ZAO Ranbaxy) 0.2 703.8 0.5 205.9 - - 0.4 205.9 52 Ranbaxy South Africa Proprietary Limited (Consolidated with
Non Controlling Interest in all subsidiaries 11.0 40,852.5 (24.5) (11,126.0) (12.2) (1,558.9) (21.8) (12,684.9)Associates (Investment as per the equity method)Indian1 Zenotech Laboratories Limited - - - - - - - - Foreign2 Daiichi Sankyo (Thailand) Ltd. 0.1 444.5 0.0 3.3 - - 0.0 3.3 Foreign Joint Ventures (Investment as per the equity method)2 MSD - Sun LLC (Consolidated with its subsidiary) 0.0 0.7 0.4 180.4 - - 0.3 180.4 Intercompany Elimination and Consolidation Adjustments (187.5) (695,155.0) 11.8 5,373.6 98.3 12,571.5 30.8 17,945.1 Total 100.0 370,677.3 100.0 45,457.1 100.0 12,794.5 100.0 58,251.6
# Includes share of profit and share of TCI, from its associates and a joint venture of ` 156.0 million@ Includes share of loss and share of TCI, from a joint venture of ` 13.2 million
The above amounts / percentage of net assets and net profit or (loss) in respect of the Parent Company, its subsidiaries, associates and joint ventures are determined based on the amounts of the respective entities included in consolidated financial statements before inter-company eliminations / consolidation adjustments.
Names of related parties where there are transactions and description of relationships
a Key Managerial Personnel
Dilip S. Shanghvi Managing DirectorSudhir V. Valia Executive DirectorSailesh T. Desai Executive DirectorIsrael Makov Chairman and Non- Executive DirectorKalyansundaram Subramanian (w.e.f. February 14, 2017) Executive DirectorS. Mohanchand Dadha Non- Executive DirectorHasmukh S. Shah Non- Executive DirectorKeki M. Mistry Non- Executive DirectorAshwin S. Dani Non- Executive DirectorRekha Sethi Non- Executive Director
b Relatives of Key Managerial PersonnelAalok ShanghviVidhi Shanghvi
c Enterprise under control of Key Managerial Personnel or their relativesMakov Associates LtdShantilal Shanghvi FoundationDadha Pharma Pvt. Ltd.
d Enterprise under significant Influence of Key managerial Personnel or their relativesSun Pharma Advanced Research Company LtdSun Petrochemicals Pvt LtdAlfa Infraprop Pvt. Ltd.PV Power Technologies Pvt. Ltd.
e Joint VentureS & I Ophthalmic LLC
f AssociatesZenotech Laboratories LimitedDaiichi Sankyo (Thailand) Ltd.Medinstill LLCFrazier Healthcare VII, L.P.Versant Venture Capital V, L.P.scPharmaceuticals Inc.Trumpcard Advisors and Finvest LLP Generic Solar Power LLP
g Unconsolidated SubsidiaryFoundation for Disease Elimination and Control of India
SUN PHARMACEUTICAL INDUSTRIES L IMITED272
NOTES TO THE CONSOLIDATED FINANCIAL STATEMENTS
FOR THE YEAR ENDED MARCH 31, 2017
` in MillionParticulars March 31, 2017 March 31, 2016Purchase of goods 28.2 21.7
Associates 12.9 20.6 Enterprise under significant Influence of Key managerial Personnel or their relatives 15.3 1.1
Purchase of Property, Plant and Equipment and other intangible assets 885.4 4.0 Enterprise under significant Influence of Key managerial Personnel or their relatives 885.4 4.0
Sale of goods 103.4 881.9 Associates 38.8 871.9 Enterprise under significant Influence of Key managerial Personnel or their relatives 64.6 10.0
Sale of Property, Plant and Equipment and other intangible assets - 0.4 Enterprise under significant Influence of Key managerial Personnel or their relatives - 0.4
Receiving of Service 1,296.6 1,616.3 Enterprise under control of Key managerial Personnel or their relatives 283.0 506.2 Enterprise under significant Influence of Key managerial Personnel or their relatives 1,013.6 1,110.1
Reimbursement of Expenses Paid 17.7 61.7 Associates 2.8 - Key managerial personnel (` 45,815) 0.0 - Enterprise under significant Influence of Key managerial Personnel or their relatives 14.9 61.7
Rendering of Service 147.8 558.3 Joint Venture ( March 31, 2016 : ` 44,016 ) 11.6 0.1 Associates - 3.2 Enterprise under significant Influence of Key managerial Personnel or their relatives 136.2 555.0
Reimbursement of Expenses Received 290.1 41.6 Enterprise under significant Influence of Key managerial Personnel or their relatives 289.8 41.6 Unconsolidated Subsidiary 0.3 -
Purchase of Investment in Associates and Joint Venture and Unconsolidated Subsidiary 1,856.1 1,071.6 Associates (Refer Note 67) 1,856.0 744.5 Joint Venture - 327.1 Unconsolidated Subsidiary 0.1 -
Interest Income 70.4 69.9 Associates 70.4 69.9
Lease Rental and Hire Charges 51.1 48.7 Enterprise under significant influence of key managerial personnel or their relatives 51.1 48.7
Provision for doubtful Loans and Interest accrued and due on Loans 63.4 389.5 Associates 63.4 389.5
Associates 137.7 13.5 32.1 Key managerial personnel 153.7 102.3 119.6 Relatives of key managerial personnel 0.6 2.4 1.2 Enterprise under control of Key managerial Personnel or their relatives 126.0 57.9 166.4 Enterprise under significant influence of key managerial personnel or their relatives
415.8 - 31.5
Deposit Received - 66.2 66.2 Enterprise under significant influence of key managerial personnel or their relatives
- 66.2 66.2
Loan Given 454.0 - 326.8 Associates * 454.0 - 326.8
* Net of Provision for doubtful loans and interest accrued and due on loans thereof ` 726.9 Million [ March 31, 2016 : ` 663.5 Million ; April 01, 2015: ` 274.0 Million] (Refer Note 70)
Key Managerial Personnel who are under the employment of the Company are entitled to post employment benefits and other long term employee benefits recognised as per Ind AS 19 - ‘Employee Benefits’ in the financial statements. As these employee benefits are lump sum amount provided on the basis of actuarial valuation, the same is not included above and there is no Share-based payments to key managerial personnel of Company.
Disclosure in respect of material transaction with related parties.
` in MillionParticulars March 31, 2017 March 31, 2016Purchase of goods
Zenotech Laboratories Limited 12.9 20.5 Sun Pharma Advanced Research Company Ltd 10.9 1.1
Purchase of Property, Plant and Equipment and other intangible assetsSun Pharma Advanced Research Company Ltd 885.4 4.0
Sale of goodsDaiichi Sankyo (Thailand) Ltd. 38.8 871.9 Sun Pharma Advanced Research Company Ltd 64.6 10.0
Sale of Property, Plant and Equipment and other intangible assetsSun Petrochemicals Pvt Ltd - 0.4
Receiving of ServiceSun Pharma Advanced Research Company Ltd 1,013.6 1,368.7 Makov Associates Ltd 283.0 247.6
Reimbursement of Expenses PaidSun Pharma Advanced Research Company Ltd 14.9 61.7
Rendering of ServiceSun Pharma Advanced Research Company Ltd 136.2 555.0
SUN PHARMACEUTICAL INDUSTRIES L IMITED274
NOTES TO THE CONSOLIDATED FINANCIAL STATEMENTS
FOR THE YEAR ENDED MARCH 31, 2017
` in MillionParticulars March 31, 2017 March 31, 2016Reimbursement of Expenses Received
Sun Pharma Advanced Research Company Ltd 289.8 41.6 Purchase of Investment in Associates and Joint Venture and Unconsolidated Subsidiary
Frazier Healthcare VII, L.P. 269.6 412.7 Versant Venture Capital V, L.P. 402.0 331.8 scPharmaceuticals Inc. 871.9 - S & I Ophthalmic LLC - 327.1
Date of acquisition 13.02.2014 06.06.2011 28.10.2013 24.03.2015 24.10.2013 21.04.2014 29.12.2016 09.10.2015 31.03.2017 13.03.20142 Shares of Associate/Joint
Ventures held by the company on the year end No. 15,853 NA NA 16,128,078 NA NA 13,000,000 28,760 NA 1,999 Amount of Investment in Associates/Joint Venture