Independent Boards and Innovation * Benjamin Balsmeier † , Lee Fleming ‡ , and Gustavo Manso §¶ October 11, 2016 Abstract Much research has suggested that independent boards of directors are more effective in reduc- ing agency costs and improving firm governance. How they influence innovation is less clear. Relying on regulatory changes, we show that firms that transition to independent boards fo- cus on more crowded and familiar areas of technology. They patent and claim more and receive more total future citations to their patents. However, the citation increase comes mainly from in- cremental patents in the middle of the citation distribution; the numbers of uncited and highly cited patents—arguably associated with riskier innovation strategies—do not change signifi- cantly. Keywords: Corporate Governance, Board Composition, Innovation, Exploration and exploitation JEL Classification: G34, L14, L25, M21 * The authors thank David Hsu, Adair Morse, David Sraer for helpful comments, as well as Gabe Fierro and Guan-Cheng Li for invaluable research assistance. Balsmeier acknowledges financial support from the Flemish Science Foundation. This work is supported by NSF grant 1360228 and the Coleman Fung Institute for Engineering Leadership; errors and omissions remain the authors’. † Swiss Economic Institute, ETH Zurich, Leonhardstrasse 21, 8092 Zurich, Switzerland ‡ Fung Institute for Engineering Leadership, University of California, 2451 Ridge Road, Berkeley 94709, USA § Haas School of Business, University of California, 545 Student Services Building 1900, Berkeley 94720, USA ¶ Corresponding author. Tel:1-510-643-6623; fax: 1-510-643-1412; e-mail: [email protected]
Transcript
Independent Boards and Innovation∗
Benjamin Balsmeier†, Lee Fleming‡, and Gustavo Manso§ ¶
October 11, 2016
Abstract
Much research has suggested that independent boards of directors are more effective in reduc-ing agency costs and improving firm governance. How they influence innovation is less clear.Relying on regulatory changes, we show that firms that transition to independent boards fo-cus on more crowded and familiar areas of technology. They patent and claim more and receivemore total future citations to their patents. However, the citation increase comes mainly from in-cremental patents in the middle of the citation distribution; the numbers of uncited and highlycited patents—arguably associated with riskier innovation strategies—do not change signifi-cantly.
∗The authors thank David Hsu, Adair Morse, David Sraer for helpful comments, as well as Gabe Fierroand Guan-Cheng Li for invaluable research assistance. Balsmeier acknowledges financial support fromthe Flemish Science Foundation. This work is supported by NSF grant 1360228 and the Coleman FungInstitute for Engineering Leadership; errors and omissions remain the authors’.
†Swiss Economic Institute, ETH Zurich, Leonhardstrasse 21, 8092 Zurich, Switzerland‡Fung Institute for Engineering Leadership, University of California, 2451 Ridge Road, Berkeley 94709,
USA§Haas School of Business, University of California, 545 Student Services Building 1900, Berkeley 94720,
Coles, Daniel, and Naveen, 2008; Denis and Sarin, 1999; Core, Holthausen, and Larcker,
1999), CEO appointments and dismissals (Knyazeva, Knyazeva, and Masulis, 2013;
Borokhovich, Parrino, and Trapani, 1996; Weisbach, 1988), adoption of antitakeover
defenses (Brickley, Coles, and Terry, 1994) or takeover premiums (Cotter, Shivdasani,
and Zenner, 1997; Byrd and Hickman, 1992). From these studies the picture emerges
that independent board members increase board oversight. Whether such intensified
board monitoring is beneficial or detrimental to shareholder wealth is less clear and
may depend on the complexity of a firm’s operations (Faleye, Hoitash, and Hoitash,
2011; Duchin et al., 2010).
Several recent papers use patent data to empirically study how corporate gover-
nance affects innovation. Raw patent counts are usually supplemented by the number
of citations that a patent receives, as this measure correlates with financial and technical
value (Harhoff et al., 1999; Hall et al., 2005); future cites are sometimes broken down by
whether the firm cites its own work (Lerner, Sorensen, and Stromberg, 2011). Though
less common, some papers have analyzed technology classes or the tails of the cita-
tion distribution (Gonzalez-Uribe and Xu, 2016; Byun, Oh, and Xia, 2015; Cerqueiro,
Hegde, Penas, and Seamans, 2015; Chen, Gao, Hsu, and Li, 2015). Measures of origi-
nality and generality (Hall, Jaffe, and Trajtenberg, 2001) have also been used, though
5
these measures depend on the US Patent and Trademark Office’s changing and now
discontinued classification of technologies (see Lerner, Sorensen, and Stromberg, 2011;
and Hsu, Tian, and Xu, 2014). Lerner and Seru (2014) detail a number of problems with
the use of patent measures in the finance literature, including failures to correct for
differences in time periods and truncation (caused by the lag between application and
patent grant, or delay in the accumulation of future prior art citations), economic value
(typically proxied by future prior art citation), technology (typically measured by the
United States Patent and Trademark Office classes), and disambiguation of assignees
(determining which firms own which patents). One empirical contribution of this pa-
per is to offer improved and easily calculated measures that can address some of these
issues.
The results of the recent surge of empirical patent work on governance and innova-
tion are decidedly mixed. Much of the contradictory work is well identified, so resolu-
tion will have to rely on sharper theory or more careful measurements of governance
and innovation. A variety of papers find that stronger governance leads to greater in-
novation (alternately, weaker governance leads to decreased innovation). Aghion, van
Reenen, and Zingales (2013) show that greater institutional ownership correlates with
greater patenting and citations to patents. Bernstein (2014) finds that firms experience
no change in the amount of patenting following an Initial Public Offering (IPO) (when
they would assumedly transition from strong oversight by venture capitalists to weaker
public oversight), however, they do experience a decrease in citations. Atanassov (2013)
found that a strengthening of anti-takeover provisions in a state (assumedly implying
6
weaker governance) led to fewer patents and citations, but that institutional sharehold-
ers decreased the effect. Sapra, Subramanian, and Subramanian (2014) used a similar
research context to Atanassov (2013) but found a non-monotonic effect, where innova-
tion increased for firms that experienced very weak and very strong external takeover
pressure.
In contrast, a variety of papers finds that weaker governance leads to increased in-
novation (alternately, stronger governance leads to decreased innovation). Atanassov
(2016) finds that firms with a greater proportion of bank financing invented more and
more highly cited patents (and that the volatility of citations was greater). In contrast
to Atanassov (2013) and in partial contrast to Sapra, Subramanian, and Subramanian
(2014), Chemmanur and Tian (2016) find that firms with greater anti-takeover provi-
sions receive more and more highly cited patents.
Most similar to the current study, Faleye, Hoitash, and Hoitash (2011) find that
monitoring intensity, as measured by the proportion of independent board directors
on at least two monitoring committees, correlates negatively with research and de-
velopment expenditure and future prior art citation counts. While they present well-
specified panel data models, their Sarbanes-Oxley regressions (the main identification
strategy used in the current paper) investigate the effect of SOX on firm value—but
not, however, on R&D and patent data. Kang et al. (2014) find no correlation with so-
cial connections between the CEO and board members and research and development
spending (arguably a social connection implies weaker governance); they find a posi-
tive correlation with patents and citations.
7
Using a differences-in-differences (DiD) identification strategy based on the regu-
latory requirements of SOX, we find no effect of a firm’s transition to an independent
board upon R&D spending but a positive effect on total patenting and citations and
a focusing of the firm’s innovative search on known and previously successful areas;
these results remain robust across a variety of matched, fixed effects, and trend control
models.
Taking heed of the critiques of Lerner and Seru (2014), this paper assembles a suite
of more detailed and nuanced measures of innovation. This battery of measures offers
additional and consistent insights into the mechanisms of how board independence
influences innovation, while retaining the advantages of the SOX identification strat-
egy. Of more general interest, the battery of measures enables cleaner identification
of a firm’s search strategy; it illustrates how a firm can invent more highly cited and
valuable patents by exploiting its current area of expertise. Such exploitation may be
characterized as local search and is probably less risky, yet it is still innovation and
arguably the most effective and valuable search strategy for the firm.
3. Identification strategy
Identification for our study relies upon regulatory changes that forced public firms
to increase the presence of independent directors on their boards in the early 2000s.
The effects of those regulatory changes on variables other than innovation have been
analyzed elsewhere [see, e.g., Duchin et al. (2010), for a setup that is most similar to
ours]. In this section, we briefly describe the regulatory framework that is relevant to
8
our analysis.
Initiated by recommendations of the Blue Ribbon Committee (BRC) in 1999, stock
market rules of the NYSE and Nasdaq have been built upon the assumption that inde-
pendent board members are better able to monitor managers. Subsequent to the BRC
recommendations, the Securities and Exchange Commission (SEC) approved new rules
in December 1999, requiring public firms to move to a fully independent audit commit-
tee with the next re-election or replacement of audit committee members. Further moti-
vated by prominent corporate scandals, e.g., Enron, this rule was written into U.S. law
in 2002 as a part of the Sarbanes-Oxley Act (SOX). It was followed by subsequent NYSE
and Nasdaq regulations in 2003 that imposed even stricter requirements on board com-
position. In addition to having an audit committee composed of exclusively indepen-
dent directors, both stock exchanges forced firms to have a majority of independent
directors as regular board members, and the compensation and nomination commit-
tees had to consist of 100% independent board members (>50% if firms are listed on
Nasdaq only).
Definitions of director independence vary slightly across each rule. SOX states in
Section 301 that a given director is independent if the person does not “accept any con-
sulting, advisory, or other compensatory fee from the issuer” (except for serving the
board), and is not an “affiliated person of the issuer or any subsidiary” (NYSE speaks
of “no material relationship”; and Nasdaq requires no relationship that would inter-
fere with “independent judgment”). The NYSE and Nasdaq regulations are clear; the
independence assumption is violated, for instance, if a director him- or herself or a di-
9
rect family member was an employee of the firm during the previous three years, or
a family member works for a third firm with which the given firm has a professional
relationship, or a family member is connected to the firm’s auditor.
These regulations made board changes necessary for a large group of firms. The
number and fraction of independent board members was fairly stable until the year
2000. As the described board regulations came into effect, more and more independent
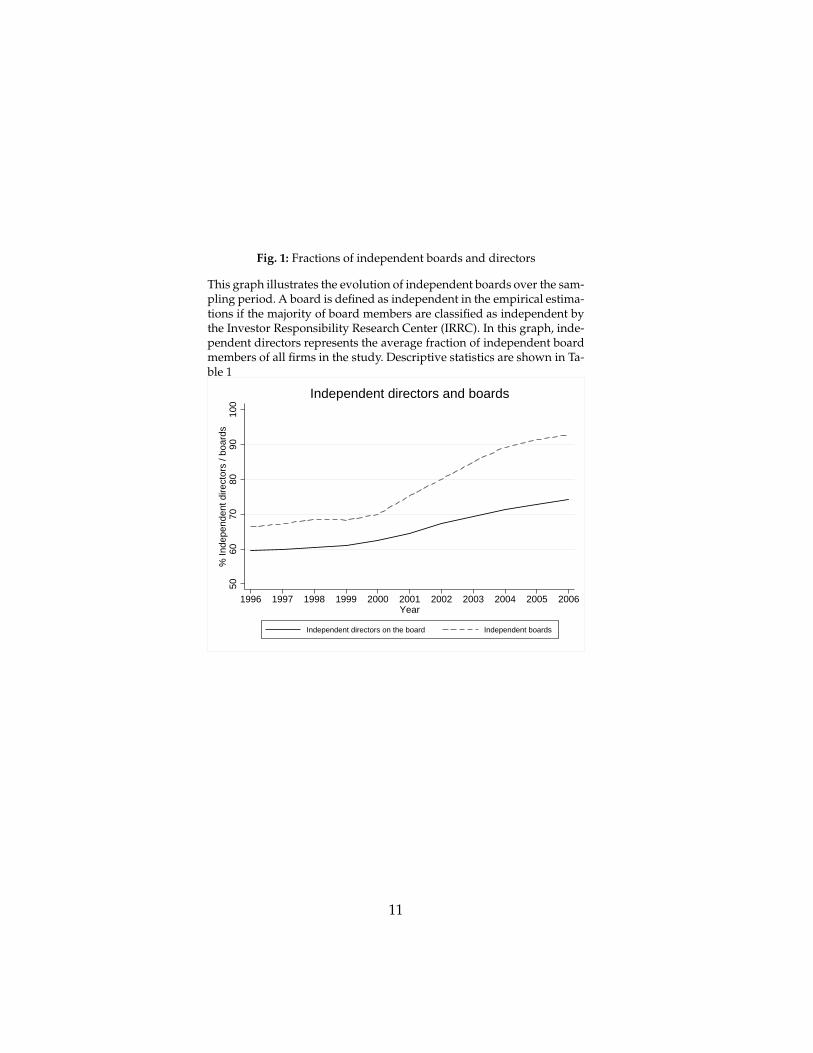
directors were appointed to corporate boards. Fig. 1 illustrates the changes in board
composition for the sample of firms used in our study. It resembles a pattern that has
been documented in other studies for differing sets of public firms (e.g., Linck et al.,
2008; Duchin et al., 2010). Board composition data are taken from the Investor Respon-
sibility Research Center (IRRC). From 1996 to 2006, the IRRC tracked individual board
members of all major public U.S. firms and indicated in their database whether an indi-
vidual board member is independent, an employee of the firm, or otherwise affiliated
(former employee, employee of an organization that receives charitable gifts from the
company, employee of a customer or supplier to the company, relative of an executive
director, etc.).
Reflecting the previously introduced regulatory changes, Fig. 1 shows an increase
of independent director presence on corporate boards from 2001 to 2006. Theoretical
considerations about board control suggest that a crucial difference arises when a board
switches from a minority to a majority of independent board members (Harris and
Raviv, 2008).1 It was further an explicit requirement of regulatory reforms. Thus, our
1The fraction of independent board members provides more variation but has two major disadvan-tages. First, considering board voting behavior, it is likely that the influence of independent directors on
10
Fig. 1: Fractions of independent boards and directors
This graph illustrates the evolution of independent boards over the sam-pling period. A board is defined as independent in the empirical estima-tions if the majority of board members are classified as independent bythe Investor Responsibility Research Center (IRRC). In this graph, inde-pendent directors represents the average fraction of independent boardmembers of all firms in the study. Descriptive statistics are shown in Ta-ble 1
Independent directors on the board Independent boards
Independent directors and boards
11
analysis focuses on this variable. Our data also show that the proportion of firms with
a majority of independent board members stayed rather stable around 68% before 2000
and moved up to about 94% by 2006.
Our empirical identification of the relationship between board independence and
innovation stems from the difference between firms who were already in compliance
with the regulatory changes before 2001 and those firms who switch to a majority of
independent directors after regulatory changes became effective. Hence, all firms that
were not required to change their board serve as a control group. In line with Duchin et
al. (2010), we define firms as treated when they switch to an independent board in 2001
or later and have an audit committee that contains 100% independent board members.
The latter requirement helps to sort out potential voluntary switches, increasing the
amount of truly exogenous increases of independent board members and making our
main variable of interest less likely to be confounded by endogenous choice. The frac-
tion of independent directors increased by 25% during 2001 to 2006 within noncompli-
ant firms and by 9% within firms that had already fulfilled the regulatory requirements
before 2001.
board oversight does not increase linearly with the number or fraction of independent members but ex-hibits a jump when independent directors gain or lose the majority of votes. Second, the switch from aminority to a majority of independent directors was an explicit requirement of regulation, such that itis more likely that observed changes in that regard happened involuntarily, which in turn improves theidentification of causal effects.
12
4. Sample selection
The data set we built up for our study is determined by the joint availability of data
on the composition of corporate boards and committees from the IRRC, information
on basic firm characteristics from Compustat, and patent data from the National Bu-
reau of Economic Research (NBER), the Fung Institute, and the United States Patent
and Trademark Office (USPTO). The IRRC provides data on corporate board members
for 3,000 major public U.S.-based firms from 1996 to 2006. Compustat has further infor-
mation on almost all of the firms covered by IRRC. A major challenge for the empir-
ical researcher interested in those firms’ innovative activities is the identification and
compilation of the corresponding patent portfolios. Researchers involved in the NBER
patent data project have spent significant amounts of resources to identify patents that
have been granted to U.S.-based firms. The NBER patent database contains, however,
only those patents that have been granted through 2006. Due to the time lag with which
inventions are granted property rights (1–5 years) and the publication of correspond-
ing data by the USPTO, this results in significantly truncated data for patents filed after
2001. Researchers have found ways to use incomplete patent data for the years 2002
to 2006, exploiting the distribution of applications before 2002, but those approaches
add noise to econometric analyses, and lead to significant estimation errors in our case,
because our sample of board data covers 50% of years for which the NBER data are
severely truncated. The issue becomes even more prevalent if researchers want to take
citations to patents into account that often occur several years after a patent has been
13
granted. In terms of patent applications, the NBER data misses 18% of patent applica-
tions of U.S.-based assignees identified in 2002, rising to 99% by 2006.2
Newly available disambiguations (see Balsmeier et al., 2016) provide more recent
data, avoid the truncation of the NBER patent database, and identify comprehensive
patent portfolios of the firms in our sample up to the year 2007.3 Following the lit-
erature (e.g., He and Tian, 2013), we assign an eventually granted patent to the year it
was applied for. Disambiguation of firm names presents a major challenge, since patent
documents do not contain a unique identifier of assignees. Following disambiguation,
patents are aggregated to the firm level and merged with other databases such as Com-
pustat and IRRC.
We extended the reach of the NBER patent database by combining it with USPTO
and Fung Institute data, including patent citations and other detailed information within
each patent document. We started with standardized assignee names provided by the
USPTO for all patents granted through December 31, 2012. These standardized assignee
names are largely free of misspellings but still contain many name abbreviations for
individual firms. The standardized USPTO assignee names remain consistent through-
out time and have been used by the NBER patent project team to disambiguate firm
names. For almost all U.S. firms that received at least one patent between 1975 and
2006, the NBER provides a unique time-invariant assignee. We took all variations of
2The numbers are derived by comparing all patent applications in the NBER database with all patentsin the Fung Institutes database as published in April 2014.
3We gather patent data through 2007, because we will estimate regressions of firms’ patenting activitiesin year t on board data and controls in t-1, reflecting that patenting activities need some time to be influ-enced by boards and simultaneous determination of variables may otherwise confound the estimation.
14
standardized assignee names that belong to a given single firm as a training set, and
gave all granted patents that appear with the same standardized assignee name the
same unique NBER identifier.4 This information enabled us to track firms’ patenting
activity over significantly longer time periods, overcoming truncation issues of patent
applications and generally increasing the accuracy of available patent portfolios.
Finally, we merged unique time-invariant Compustat identifiers to the patent as-
signee identifiers as they are provided by the NBER. It is worthwhile to note that in
our analysis we take only those firms into account for which the NBER has identified
Compustat matches, and we assigned zero patents only to those firms where the NBER
team searched for but could not find matches with any patent. In this regard we devi-
ate from other studies that assign zero patents also to those firms that have not been
tested to appear as a patent assignee or not. Thus, we avoid measurement errors at the
expense of a smaller but more accurate data set.
In order to circumvent potential selection effects to confound our estimation of
the relationship between board independence and innovation, we further removed all
firms that appear only before the year 2000 or entered the sample in the year 2000 or
later, such that the remaining firms can be observed over a timespan where the previ-
ously described regulatory changes took place. Finally, we arrive at a sample of 6,107
observations on 713 firms observed during the period from 1996 to 2006 for which we
could gather all information of interest. All firms in the sample combined have applied
for and been granted 328,463 patents during the sample period.
4Based on the first assignee that appears on the patent document. It allowed us to identify ~250k addi-tional patents granted to U.S.-based assignees after 2006.
15
4.1. Measuring innovative search
Much recent empirical work on corporate governance and innovation has relied on
patent data (e.g., Atanassov, 2013; He and Tian, 2013). Raw patent counts are used as
well as the number of future prior art citations that a patent receives, as the number
of future cites correlates with financial and technical value; highly cited patents are
much more valuable commercially and the relationship is highly skewed in favor of
very highly cited patents (Harhoff et al., 1999; Hall et al., 2005). To be comparable with
the extant literature we will show how board independence influences patent counts
and citations. Our results go on to illustrate, however, that raw patent counts and total
citation counts are of limited use in identifying differences in innovative search strate-
gies, specifically towards more or less exploration. Therefore, we introduce a suite of
measures, consistent with the arguments of Lanjouw and Schankerman (2004) for the
use of multiple indicators of patent quality. These serve as additional dependent vari-
ables besides raw patent counts and citations, thus enabling the illustration of a richer
and more robust picture of how board independence affects not only the rate but also
the type and direction of innovation.
First, we calculate the number of citations that each patent makes to prior patents
(Lanjouw and Schankerman, 2004). An increase in the number of backward citations
reflects direct relations to more prior art that must be specified in the patent application
(required by law). This correlates with innovative search in relatively more crowded,
better-known, and typically more mature technological areas.
16
Second, we take the number of times a given patent cites other patents owned by
the same company [Sorenson and Stuart (2000); similar measures are used in Faleye,
Hoitash, and Hoitash (2011)]. More self-cites indicate search within previously known
areas of expertise while fewer self-citations indicate a broadening of innovative search
or efforts to explore areas that are new to the firm.
Third, we calculate the number of patents that are filed in technology classes pre-
viously unknown to the firm. Unknown patent classes are defined as those in which a
given firm has not applied for any patent beforehand (starting in 1976). The comple-
ment is the number of patents applied for in known classes. Addressing one concern of
Lerner and Seru (2014), we consistently use the original patent class at time of patent
grant; hence, if the USPTO defines a brand new class and issues a new patent, it will be
observed, but if the USPTO redefines an old patent into a new class, it will not change
the measure.
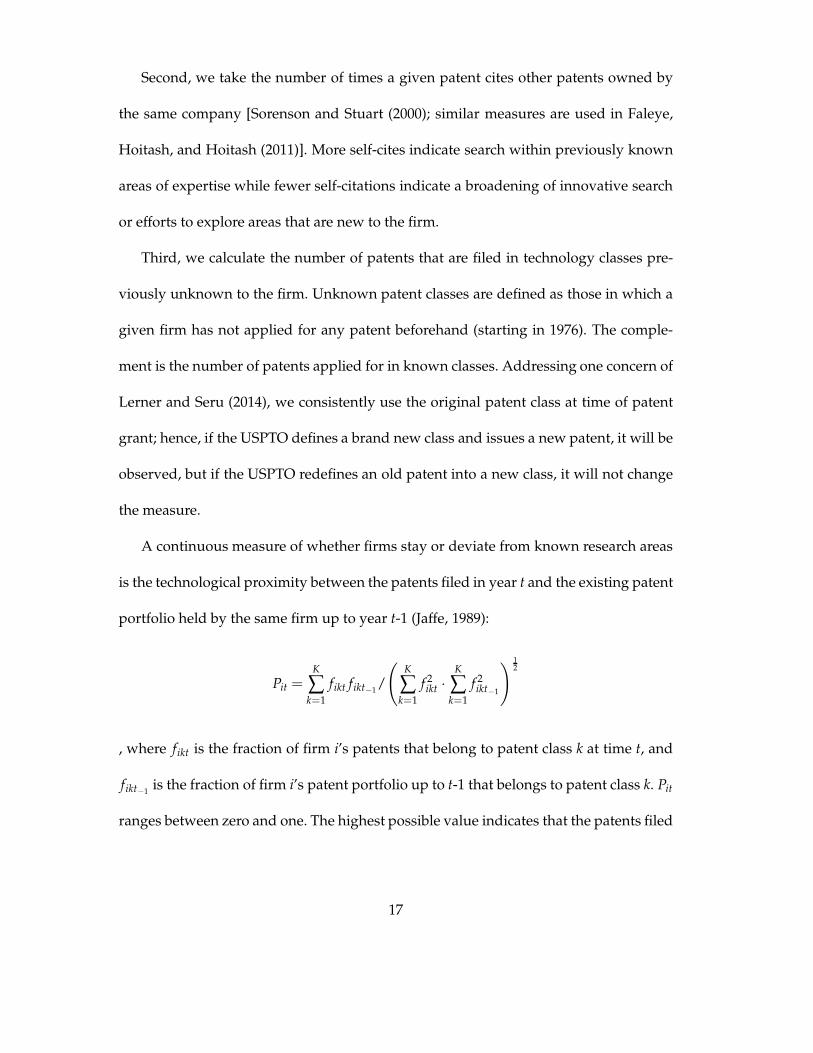
A continuous measure of whether firms stay or deviate from known research areas
is the technological proximity between the patents filed in year t and the existing patent
portfolio held by the same firm up to year t-1 (Jaffe, 1989):
Pit =K
∑k=1
fikt fikt−1/
(
K
∑k=1
f 2ikt ·
K
∑k=1
f 2ikt−1
)12
, where fikt is the fraction of firm i’s patents that belong to patent class k at time t, and
fikt−1is the fraction of firm i’s patent portfolio up to t-1 that belongs to patent class k. Pit
ranges between zero and one. The highest possible value indicates that the patents filed
17
in year t are distributed across patent classes in the exact same way as the portfolio of
all patents of the same firm up to the previous year.5 Positive coefficients in a regression
would thus indicate a more narrow innovation trajectory within known areas.
Fourth, we categorize patents according to how many citations they have received
relative to other granted patents that have been applied for in the same technology
class and year (Azoulay, Graff Zivin, and Manso, 2011). In addition to limiting com-
parison of similar patents, we exclusively and exhaustively bin all patents according to
their location in the distribution of citations. This is intended to clearly separate differ-
ent types and degrees of innovative outcomes, ranging from highly successful break-
throughs (highly cited) to completely failed inventions (not cited at all) and moderately
successful outcomes that lie between. We estimate separate models for each of the four
non-overlapping categories: top 1%, 2nd-10th%, not in the top 10% but cited at least
once, and never cited at all. We count a patent as a top 1% (2–10%) patent if the patent
falls into the highest percentile (centile) of the citation distribution in the same tech-
nology class and application year. We also separately count all patents that received no
citation at all and those that have received at least one citation but do not fall in the top
10% category.
Fifth and finally, we calculate the total number of claims made by a firm’s patent
portfolio each year (Lanjouw and Schankerman, 2004). It is difficult to algorithmically
interpret ex ante the innovative value of any particular claim, however, as claims can be
added as scope conditions which typically act as limitations on the basic invention. An
5Reflecting that a value of one indicates no change, the measure takes value one if no patent was appliedfor in a given year. All results presented below are robust to excluding non-patenting firms.
18
increase in the total number of claims should correlate, however, with the effort a firm
puts into the patenting process, and this effort should increase in response to pressures
for immediate and quantifiable results.
We do not use measures of originality and generality because their correspondence
to exploration and exploitation remains unclear. The measures calculate the spread of
classes covered by forward and backward citations, however, they do not take history
into account; the spread may be novel and unique, or it may be old and common. For
example, a patent may be measured as original because it cites other patents across
a wide variety of classes, yet that citation pattern may have already appeared on any
number of patents. Additional pragmatic issues make the measure unattractive: 1) it is
only calculated for the NBER sample, 2) any calculation relies upon the concordance of
classes which changes as each new class is defined, and 3) the USPTO recently stopped
using the US class system, hence it will be impossible to update the measure going
forward. Unreported regressions available from the first author show no significant
effect of board transition on the average of a firm’s patent scores of originality and
generality, for the patents in the NBER sub sample. Individual-level patent regressions
similarly show no significant relationship.
4.2. Control variables
Following the extant literature, we control for a vector of firm characteristics that
could confound the relation between board independence and a firm’s innovative search
and success. We compute all variables for firm i over its fiscal year t. Board size measures
19
the number of board members as we want to insulate the effect of board independence
from contemporary changes in the number of directors. Further, we found that the firms
in our sample differ significantly in terms of R&D spending over total assets and firm
size as measured by total assets—two variables that are naturally positively related to
firms’ innovation activities. In order to reduce the skewness in total assets we take the
logarithm of total assets in all multivariate econometric analyses. In addition, we con-
trol for firm age (the number of years since the initial public offering date), as older
firms may search in older technological areas. Moreover, leverage (long-term debt over
total assets) and capital expenditures (scaled by total assets) account for financial con-
straints that are known to influence corporate innovation. Finally, Tobin’s Q enters the
regression to control for differences in growth opportunities.
4.3. Summary statistics
Table 1 presents summary statistics on the data set. The patenting activities of the
firms in our sample show typical skewness with a mean of ~54 patents and a median
of three patents. Related measures like the amount of R&D investment and citation-
weighted patent counts reveal similar distributions and high concentrations among the
most active firms. We calculated the number of patents that cite a given patent based on
all US granted patents by April 2014. To control for secular trends in citation rates we
employ time fixed effects that presumably affect all firms equally on average (see also
Atanassov, 2013; and Hall, Jaffe, and Trajtenberg, 2001). 680 firms (85%) have applied
for at least one patent during the sampling period. The average firm has filed 0.5 (5.0
20
patents) in the top 1% (10%) category, 18.1 patents that are never cited, and 30.6 that
appear in the middle of the citation distribution. Similar to the number of cites received
in the future, the number of backward citations is quite large on average with 1,157.2
cites (median 26). On average, 176.6 of those backward citations relate to patents that
belong to the same firm (median 0). Further, 1.3 patents are filed in new-to-the-firm
technology classes, while 52.5 are filed in known classes. The average technological
proximity measure is 0.54.
Regarding other variables of interest, the average firm in our sample is 17.8 years
old, has nine board members, a book value of assets of $7 billion, an R&D to assets ratio
of 5%, a leverage ratio of 18.2%, capital expenditures over total assets of 5.3%, and a
Tobin’s Q of 1.2. The Appendix displays a correlation table of all variables (Table 18).
4.4. Methodological remarks
In order to analyze how a transition to an independent board affects innovative
search we follow the literature on corporate governance and innovation (e.g., Atanassov,
2013; He and Tian, 2013; Kortum and Lerner, 2000) and estimate the baseline model in
where patentsi,t+1 is the number of eventually granted patents of firm i applied for in
year t+1. In alternative regressions we will exchange the number of patents with our
21
Table 1: Summary statistics
This table reports summary statistics of variables used in the study. Board size is the number of boardmembers. Independent board is an indicator variable that indicates whether the majority of board mem-bers are independent. Top (1%) are the number of patents that fall into the 1% most cited patents withina given three-digit class and application year. Top 10% to 2% are the number of patents that fall intothe 10% to 2% most cited patents within a given three-digit class and application year. Cited patentsare the number of patents that received at least one citation but do not appear in the top 10% of the ci-tation distribution. Uncited are the number of patents that were not cited. Self-citations are the numberof cites to patents held by the same firm. Patents in new/known classes is the number of patents thatare filed in classes where the given firm has filed no/at least one other patent beforehand. Tech. prox.is the technological proximity between the patents filed in year t to the existing patent portfolio heldby the same firm up to year t-1, calculated according to Jaffe (1989). Further information on variabledefinitions and data sources provided in Sections 4.1 and 4.2.
previously introduced measures of innovation that allow us to assess the firms’ inno-
vative search strategy in more detail.6 Our main explanatory variable of interest, inde-
pendent boardit, is a dummy that indicates firms that have transitioned from a minority
to a majority of independent board members in the year 2001 or later when regulatory
changes became effective.7 Under the assumption that changes in patenting by firms
that transitioned would have been comparable to changes in patenting by other firms
in the absence of a transition, β1 captures the effect of board independence on innova-
tion by the affected firms.8 Zit is a vector of the previously introduced firm character-
istics, and year fixed effects θt control for changes in the macroeconomic environment
and systematic changes in patenting activities over time. Our preferred specifications
include firm fixed effects αi that control for any unobserved firm heterogeneity that
is time-invariant. Hence, we basically estimate a DiD model, where those firms that
switch from a minority to a majority of independent directors on the board in 2001 or
later are the ‘treated firms’, and all others are ‘non-treated firms’. In order to unravel
the influence of firm fixed effects in our regressions we also show alternative models
6In case the dependent variable is a count, all results are robust to alternatively estimating Poissonmodels (not shown).
7All results presented below are robust to alternatively taking the years 2000 or 2002 as the thresholdvalue.
8As can be seen in Fig. 1, not all firms transitioned from a friendly to an independent board at the sametime, because directors were allowed to fulfill their contracts that were signed before the law change. Inprinciple, this gives firms room for strategic choice that could confound our identification. Therefore, wechecked whether the time between the law change and compliance is correlated with pre-SOX innovativeactivity of the firms in our sample. In order to test this, we first defined a variable that measures the yearsuntil the board actually changed from friendly to independent although SOX and other regulations werealready active (2003). We found 17 firms with a one year lag, 14 with a two-year lag, and eight with athree-year lag. Then, we regressed time lag until compliance on firms’ average amount of R&D, patents,and cites before 2001 (results are robust to taking 2000 or 2002 instead). The lack of significant correlationbetween compliance lags and pre-treatment innovative activity increases confidence that the estimation isnot biased by systematic choice of more or less innovative firms to transition later or earlier.
23
with industry fixed effects, based on three-digit standard industry classification (SIC)
industry dummies, instead of firm fixed effects. To stay within the DiD framework, we
include a dummy variable that marks all treated firms in those regressions without firm
fixed effects.
Identification hinges in all models upon the parallel trend assumption; treated and
non-treated firms show similar trends in the dependent variable of interest in the ab-
sence of treatment. To increase our confidence in this assumption, we estimate the dy-
namics of the treatment effect, which provides evidence that the DiD estimator is not
significantly different from zero in the absence of treatment.
Our estimation might still be biased, however, if other remaining cross-sectional
heterogeneity of the firms in our sample change systematically with the transition to an
independent board and our measures of innovative search. In order to minimize con-
cerns in this regard, we further re-estimate all our models based on a balanced sample,
where treated and non-treated firms are comparable in terms of key observable charac-
teristics before 2002. To achieve a balanced sample we use Coarsened Exact Matching
(CEM).9 CEM has several features that bound the degree of model dependence, reduce
causal estimation error, bias, and inefficiency [Iacus, King, and Porro (2009, 2011), for a
similar application, see Azoulay, Zivin, and Wang (2010)]. Based on CEM’s coarsening
function we match treated and non-treated firms on the joint distribution of firms’ R&D
spending over total assets, firm size as measured by the natural logarithm of total as-
sets, the natural logarithm of Tobin’s Q, boardsize, and 26 two-digit SIC industry code
9In alternative models we balanced the sample based on propensity score matching, taking only thenearest neighbor of each treated firm as a control, and find qualitatively the same results.
24
dummies. We took the average values of those variables over the years 2000 and 2001 as
matching criteria to ensure highest comparability before treatment.10 Table 2 presents
the differences in mean values of all control variables before and after the matching
procedure.
Panels A and B of Table 2 show that treated firms in the full sample are on average
a little smaller, invest less in R&D, and have a smaller board. Except with regard to
R&D spending, the relative differences of the two firm groups appear small in magni-
tude. Both groups are not statistically significant with regard to the mean values of the
other control variables that have not explicitly been included in the matching. In order
to eliminate any statistically significant differences of observable firm characteristics,
while keeping as many treated firms as possible in the sample, we ran CEM with the
side condition to differentiate firms according to ten categories of R&D spending and
three categories of firm size, board size, and Tobin’s Q. Based on this procedure, four
out of the 125 treated firms remain unmatched. For the remaining 121 treated firms,
CEM selected 430 comparable firms, i.e., 158 incomparable firms are subsequently dis-
carded from the analysis. Panel C of Table 2 shows that, after matching, there are no
statistically significant differences between the treated and non-treated firms accord-
ing to two sided t-tests. Although not necessary for a consistent DiD estimation, it is
worthwhile to mention that both groups do not differ in terms of the average amount
of applied patents after matching.
While balancing the sample should improve identification (at least for firms that are
10The results are robust to taking all available observations before 2001 into account.
25
Table 2: CEM matching of treated and non-treated firms
This table reports mean values of treated and non-treatedobservable firm characteristics, averaged over the years2000 and 2001, before and after matching, based on the jointdistribution of firms’ R&D spending over total assets, firmsize as measured by the natural logarithm of total assets,the natural logarithm of Tobin’s Q, and board size. ***, **, *denote significance levels of 1%, 5%, and 10% of two-sidedt-tests on the difference between mean values of Panels Aand B, and Panels A and C, respectively.
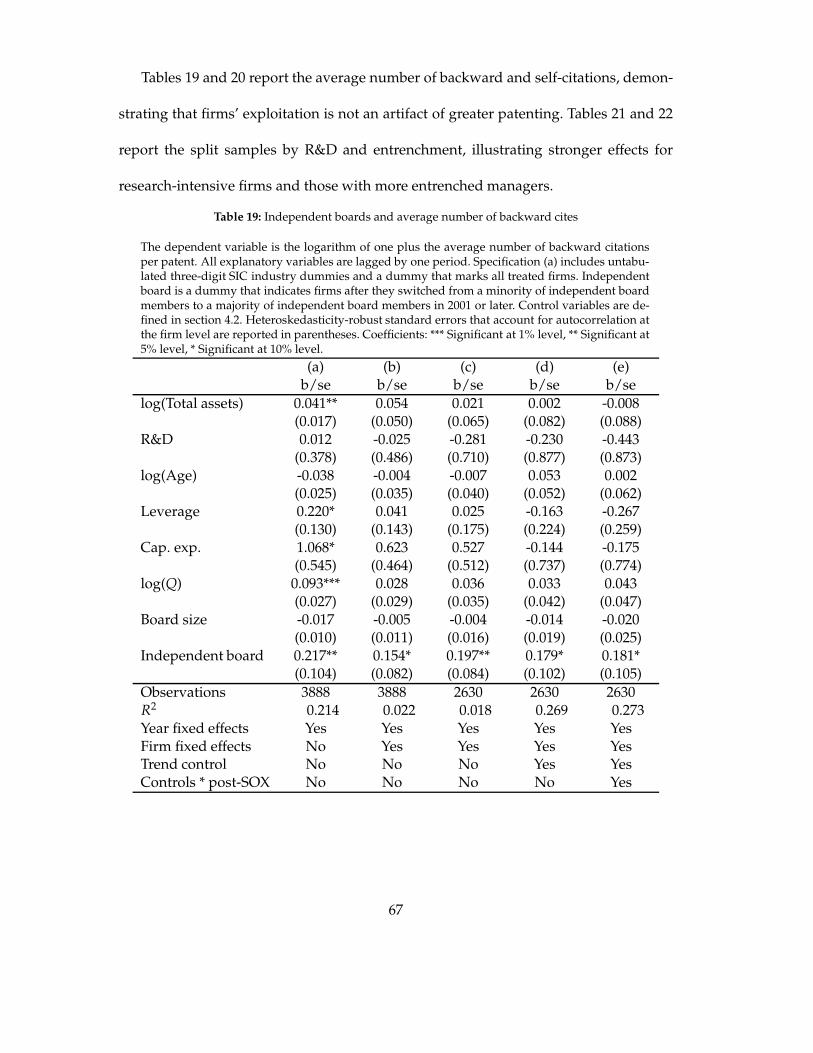
We first present results on research and development spending, the number of patents,
and the total number of citations to and claims within a firm’s patent portfolio. We then
present measures of innovative search strategy, including a breakdown of the citation
distribution, backward and self-citations, and movement into new classes and across
27
technological distance.
5.1. R&D, patents, citation-weighted patents, and claims
Tables 3 to 6 estimate regressions of firms’ R&D investments, the number of eventu-
ally granted patents applied for, the total number of citations made to the firm’s patents,
and the total number of claims contained within a firm’s patent portfolio. Each table
contains five specifications of the same model. Specification (a) is a standard OLS model
with industry fixed effects, (b) is a standard firm fixed effects model, (c) is the same as
(b) but estimated on the previously described balanced CEM sample, (d) adds trend
controls, and (e) adds interaction terms of all controls with a post-SOX marker. For all
models with firm fixed effects the R-squared values refer to the explained within-firm
variance. The first model assesses potential changes in R&D investments after board in-
dependence changed, which might drive subsequent changes in patenting.11 The next
two models differentiate between a change in the number of patents and a change in
citations to those patents. Cite-weighted patent counts (the total number of citations to
a firm’s patent portfolio) have been shown to correlate with financial value and patent
renewals (Harhoff et al., 1999; and Hall et al., 2005). The last model estimates effects on
the total number of claims in a firm’s portfolio.
Table 3 illustrates that a transition to an independent board appears unrelated to
the level of firms’ R&D investments. In contrast, Tables 4 and 5 illustrate how patenting
and total citations both increase. Reading across the models, the effect on patenting
11Alternative regressions with R&D investments scaled by total assets reveal a significant positive effectonly in specifications without firm fixed effects. Inclusion of controls for time-invariant firm heterogeneityleads to statistically insignificant results.
28
Table 3: Independent boards and R&D
The dependent variable is log(R&D). All explanatory variables are lagged by one period. Speci-fication (a) includes untabulated three-digit SIC industry dummies and a dummy that marks alltreated firms. Independent board is a dummy that indicates firms after they switched from a mi-nority of independent board members to a majority of independent board members in 2001 orlater. Control variables are defined in Section 4.2. Heteroskedasticity-robust standard errors thataccount for autocorrelation at the firm level are reported in parentheses. Coefficients: *** Signifi-cant at 1% level, ** Significant at 5% level, * Significant at 10% level.
Observations 6107 6107 4414 4414 4414R2 0.733 0.256 0.254 0.450 0.508Year fixed effects Yes Yes Yes Yes YesFirm fixed effects No Yes Yes Yes YesTrend control No No No Yes YesControls * post-SOX No No No No Yes
29
Table 4: Independent boards and number of patents
The dependent variable is the logarithm of one plus the number of eventually granted patents.All explanatory variables are lagged by one period. Specification (a) includes untabulated three-digit SIC industry dummies and a dummy that marks all treated firms. Independent board is adummy that indicates firms after they switched from a minority of independent board membersto a majority of independent board members in 2001 or later. Control variables are defined inSection 4.2. Heteroskedasticity-robust standard errors that account for autocorrelation at the firmlevel are reported in parentheses. Coefficients: *** Significant at 1% level, ** Significant at 5% level,* Significant at 10% level.
Observations 6107 6107 4414 4414 4414R2 0.571 0.207 0.176 0.410 0.414Year fixed effects Yes Yes Yes Yes YesFirm fixed effects No Yes Yes Yes YesTrend control No No No Yes YesControls * post-SOX No No No No Yes
30
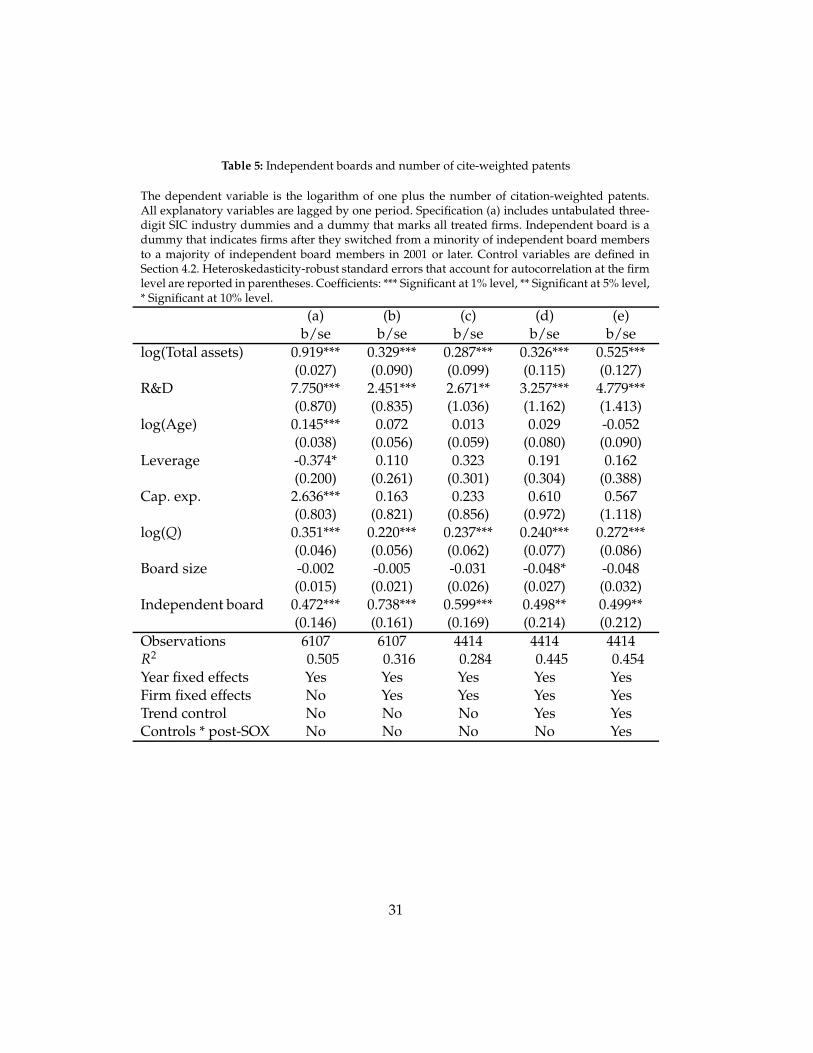
Table 5: Independent boards and number of cite-weighted patents
The dependent variable is the logarithm of one plus the number of citation-weighted patents.All explanatory variables are lagged by one period. Specification (a) includes untabulated three-digit SIC industry dummies and a dummy that marks all treated firms. Independent board is adummy that indicates firms after they switched from a minority of independent board membersto a majority of independent board members in 2001 or later. Control variables are defined inSection 4.2. Heteroskedasticity-robust standard errors that account for autocorrelation at the firmlevel are reported in parentheses. Coefficients: *** Significant at 1% level, ** Significant at 5% level,* Significant at 10% level.
Observations 6107 6107 4414 4414 4414R2 0.505 0.316 0.284 0.445 0.454Year fixed effects Yes Yes Yes Yes YesFirm fixed effects No Yes Yes Yes YesTrend control No No No Yes YesControls * post-SOX No No No No Yes
31
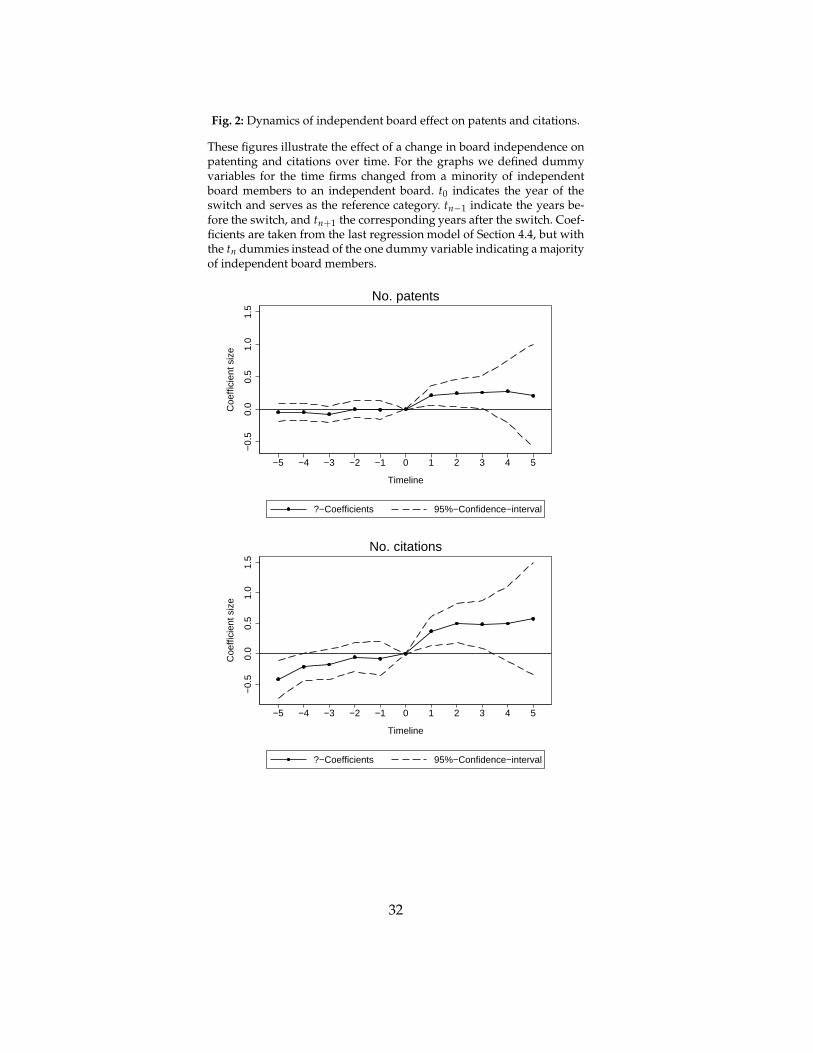
Fig. 2: Dynamics of independent board effect on patents and citations.
These figures illustrate the effect of a change in board independence onpatenting and citations over time. For the graphs we defined dummyvariables for the time firms changed from a minority of independentboard members to an independent board. t0 indicates the year of theswitch and serves as the reference category. tn−1 indicate the years be-fore the switch, and tn+1 the corresponding years after the switch. Coef-ficients are taken from the last regression model of Section 4.4, but withthe tn dummies instead of the one dummy variable indicating a majorityof independent board members.
−0.
50.
00.
51.
01.
5
Coe
ffici
ent s
ize
−5 −4 −3 −2 −1 0 1 2 3 4 5
Timeline
?−Coefficients 95%−Confidence−interval
No. patents
−0.
50.
00.
51.
01.
5
Coe
ffici
ent s
ize
−5 −4 −3 −2 −1 0 1 2 3 4 5
Timeline
?−Coefficients 95%−Confidence−interval
No. citations
32
ranges between a 31% to 20% increase in the number of patents, and a 59% to 41%
increase in total citations. Fig. 2 illustrates the dynamics of the latter two effects. For
the graphs we defined dummy variables for the specific times before and after firms
changed to an independent board. t0 defines the year of the switch and serves as the
baseline category, tn−1 defines the number of years before the switch, and tn+1 the years
after the switch. Then, we ran regressions including these variables instead of the single
dummy variable in the baseline model beforehand. As we still include year fixed effects,
the coefficients represent the relative change in patenting per year that is attributable to
the board change.
Table 6 illustrates that the number of claims in a firm’s patents increases following a
transition to an independent board. The effect on the number of claims ranges between
a 50% to 36% increase in the number of claims. Fig. 3 illustrates the dynamics.
The results are consistent with classic agency theory and our first hypothesis, sug-
gesting that intensified monitoring leads to increased effort of the agent, which results
in increased claims and patenting of inventions. That firms patent more, but do not
spend significantly more on R&D, raises the question whether firms just work more ef-
ficiently or exploit extant knowledge at the expense of explorative innovation (models
of patenting efficiency were not significant). The arguments for our second hypothe-
sis argue that increased board independence leads to a shift from explorative to more
exploitative innovative activities. The following models illustrate a consistent shift to-
wards exploitation but no clear signal of the effect on exploration.
33
Table 6: Independent boards and number of claims
The dependent variable is the logarithm of one plus the total number of claims of a patent port-folio. All explanatory variables are lagged by one period. Specification (a) includes untabulatedthree-digit SIC industry dummies and a dummy that marks all treated firms. Independent boardis a dummy that indicates firms after they switched from a minority of independent board mem-bers to a majority of independent board members in 2001 or later. Control variables are definedin Section 4.2. Heteroskedasticity-robust standard errors that account for autocorrelation at thefirm level are reported in parentheses. Coefficients: *** Significant at 1% level, ** Significant at 5%level, * Significant at 10% level.
Observations 6107 6107 4414 4414 4414R2 0.466 0.133 0.119 0.304 0.307Year fixed effects Yes Yes Yes Yes YesFirm fixed effects No Yes Yes Yes YesTrend control No No No Yes YesControls * post-SOX No No No No Yes
34
Fig. 3: Independent boards and number of claims.
This figure illustrates the effect of a change in board independence onclaims over time. For the graph we defined dummy variables for thetime firms changed from a minority of independent board members toan independent board. t0 indicates the year of the switch and serves asthe reference category. tn−1 indicate the years before the switch, and tn+1
the corresponding years after the switch. Coefficients are taken from thelast regression model of Section 4.4, but with the tn dummies insteadof the one dummy variable indicating a majority of independent boardmembers.
−0.
50.
00.
51.
01.
5
Coe
ffici
ent s
ize
−5 −4 −3 −2 −1 0 1 2 3 4 5
Timeline
ß−Coefficients 95%−Confidence−interval
No. claims
35
5.2. The distribution of citations
Most recent research that uses patent data considers raw counts and total citations to
the raw count patents, but less research considers the distribution of citations in careful
detail. In this section we model the number of breakthrough, important, incremental,
and failed inventions that a firm makes. These estimations are motivated by the argu-
ment that responding to increased oversight will increase tangible and countable but
incremental patents at the expense of risky patents; such risky patents are more likely
to fail completely or provide a breakthrough.
To model each of these four possible outcomes, we split the distribution into sub-
categories: (1) the number of patents that the firm invents that received cites within the
highest percentile (top 1%) among all patents in the same three-digit patent class and
application year, (2) the number of patents that received cites within the highest centile
(10%) among all patents in the same three-digit patent class and application year but
not including the top 1%, (3) the number of patents that received at least one citation
(the median of the entire distribution is zero) but not including the top 10%, and (4) the
number of patents that received no citation. Hence, the measures should be interpreted
as 1) the number of breakthroughs, 2) the number of important patents, 3) the number
of incremental patents that have small value, and 4) the number of patents that have lit-
tle or no value to the firm. As an example, in the year 2000, IBM invented 4,367 patents,
of which 24 were in the top 1% of their field, 360 in the top 10% but not including the top
1%, 3,374 with at least one cite but not in the top 1% or 10%, and 609 of which received
36
no citations. Tables 7 to 10 present the corresponding results for each of the bins.
Consistent with the models in Tables 4 and 5 we see a positive effect of board transi-
tions on patenting and citation rates. The estimated effect is by far the most significant
and largest—from 35% to 22%—for incremental patents that received at least one cita-
tion (but not in the top 10% of the distribution), while the estimated effect on particu-
larly successful patents (top 1% or top 10%) is very small in magnitude and significant
at p<0.10 for only two out of ten regressions. Taking also into account that the effect
on the number of unsuccessful patents (no cites) is most often statistically insignificant,
the evidence is consistent with the argument that firms focus on less risky opportuni-
ties when the board becomes independent. Inclusion of a measure of backward cita-
tions weakens these effects further, implying that the increase in citations is mediated
by movement of the firm into more crowded areas of technological search (models not
shown but available from first author). In other words, the increase in citations may not
correspond to an increase in patent value, rather, it may be an artifact of the exploitation
strategy.
5.3. Self- and backward citations
In this section, we investigate more nuanced measures of search strategy. First, we
focus on the number of citations that each patent makes to other patents. An increase
in the number of backward citations reflects more prior art that must be specified in
the patent application. This should correlate with innovative search in relatively better-
known and mature technological areas. Second, we take the number of times a given
37
Table 7: The number of breakthrough inventions: independent boards and top 1% patents
The dependent variable is the logarithm of one plus the number of patents that fall in the top1% percentile of the citation distribution within patent class and application year. All explanatoryvariables are lagged by one period. Specification (a) includes untabulated three-digit SIC indus-try dummies and a dummy that marks all treated firms. Independent board is a dummy thatindicates firms after they switched from a minority of independent board members to a major-ity of independent board members in 2001 or later. Control variables are defined in Section 4.2.Heteroskedasticity-robust standard errors that account for autocorrelation at the firm level arereported in parentheses. Coefficients: *** Significant at 1% level, ** Significant at 5% level, * Sig-nificant at 10% level.
Observations 6107 6107 4414 4414 4414R2 0.312 0.009 0.014 0.179 0.182Year fixed effects Yes Yes Yes Yes YesFirm fixed effects No Yes Yes Yes YesTrend control No No No Yes YesControls * post-SOX No No No No Yes
38
Table 8: The number of important inventions: independent boards and top 2% to 10% patents
The dependent variable is the logarithm of one plus the number of patents that fall in the top 10%centile of the citation distribution within patent class and application year (excluding the top 1%).All explanatory variables are lagged by one period. Specification (a) includes untabulated three-digit SIC industry dummies and a dummy that marks all treated firms. Independent board is adummy that indicates firms after they switched from a minority of independent board membersto a majority of independent board members in 2001 or later. Control variables are defined inSection 4.2. Heteroskedasticity-robust standard errors that account for autocorrelation at the firmlevel are reported in parentheses. Coefficients: *** Significant at 1% level, ** Significant at 5% level,* Significant at 10% level.
Observations 6107 6107 4414 4414 4414R2 0.407 0.017 0.021 0.208 0.214Year fixed effects Yes Yes Yes Yes YesFirm fixed effects No Yes Yes Yes YesTrend control No No No Yes YesControls * post-SOX No No No No Yes
39
Table 9: The number of incremental inventions: independent boards and cited patents, not in top 10%
The dependent variable is the logarithm of one plus the number of patents that are cited but do notfall in the top 10% of the citation distribution. All explanatory variables are lagged by one period.Specification (a) includes untabulated three-digit SIC industry dummies and a dummy that marksall treated firms. Independent board is a dummy that indicates firms after they switched from aminority of independent board members to a majority of independent board members in 2001or later. Control variables are defined in Section 4.2. Heteroskedasticity-robust standard errorsthat account for autocorrelation at the firm level are reported in parentheses. Coefficients: ***Significant at 1% level, ** Significant at 5% level, * Significant at 10% level.
Observations 6107 6107 4414 4414 4414R2 0.536 0.248 0.207 0.416 0.421Year fixed effects Yes Yes Yes Yes YesFirm fixed effects No Yes Yes Yes YesTrend control No No No Yes YesControls * post-SOX No No No No Yes
40
Table 10: The number of failed inventions: independent boards and patents without citations
The dependent variable is the logarithm of one plus the number of patents that are not cited.All explanatory variables are lagged by one period. Specification (a) includes untabulated three-digit SIC industry dummies and a dummy that marks all treated firms. Independent board is adummy that indicates firms after they switched from a minority of independent board membersto a majority of independent board members in 2001 or later. Control variables are defined inSection 4.2. Heteroskedasticity-robust standard errors that account for autocorrelation at the firmlevel are reported in parentheses. Coefficients: *** Significant at 1% level, ** Significant at 5% level,* Significant at 10% level.
Observations 6107 6107 4414 4414 4414R2 0.510 0.045 0.040 0.323 0.332Year fixed effects Yes Yes Yes Yes YesFirm fixed effects No Yes Yes Yes YesTrend control No No No Yes YesControls * post-SOX No No No No Yes
41
patent cites other patents owned by the same company. More self-cites indicate con-
straining search within previously known areas of expertise while fewer self-citations
indicate a broadening of innovative search or efforts to explore areas that are new to the
firm. Tables 11 and 12 present the corresponding results and Fig. 4 illustrates the dy-
namics of the effects.12 Firms that transition to independent boards increase backward
and self-citations right after the transition and the effect remains for subsequent years.
The results presented in Tables 11 and 12 and Fig. 4 support the argument that firms
with independent boards tend to narrow their innovative search towards known and
mature technological areas. Regression coefficients imply an increase of 50% to 39%
for backward citations and 39% to 26% for self-citations. The effect holds in patent-
level regressions as well—it is not an artifact of increased patenting (see Appendix for
robustness checks).
5.4. Technology classes
We now turn to the number of patents that are filed in USPTO classes previously
unknown to the firm (the office classified all technologies into approximately 400 major
classes). Unknown patent classes are defined as those in which a given firm has not
been granted any patent back to 1976. The complement is the number of patents applied
for in known classes. A more sophisticated measure of whether firms stay or deviate
from known research areas is the technological proximity between the patents filed in
year t and the existing patent portfolio held by the same firm up to year t-1 (Jaffe, 1989).
12Alternative regressions of non-self-citations reveal very similar results as estimated for the total num-ber of backward citations.
42
Table 11: Independent boards and backward citations
The dependent variable is the logarithm of one plus the number of backward citations. All ex-planatory variables are lagged by one period. Specification (a) includes untabulated three-digitSIC industry dummies and a dummy that marks all treated firms. Independent board is a dummythat indicates firms after they switched from a minority of independent board members to a ma-jority of independent board members in 2001 or later. Control variables are defined in Section 4.2.Heteroskedasticity-robust standard errors that account for autocorrelation at the firm level arereported in parentheses. Coefficients: *** Significant at 1% level, ** Significant at 5% level, * Sig-nificant at 10% level.
Observations 6107 6107 4414 4414 4414R2 0.450 0.115 0.106 0.295 0.298Year fixed effects Yes Yes Yes Yes YesFirm fixed effects No Yes Yes Yes YesTrend control No No No Yes YesControls * post-SOX No No No No Yes
43
Table 12: Independent boards and self-citations
The dependent variable is the logarithm of one plus the number of self-citations. All explanatoryvariables are lagged by one period. Specification (a) includes untabulated three-digit SIC indus-try dummies and a dummy that marks all treated firms. Independent board is a dummy thatindicates firms after they switched from a minority of independent board members to a major-ity of independent board members in 2001 or later. Control variables are defined in Section 4.2.Heteroskedasticity-robust standard errors that account for autocorrelation at the firm level arereported in parentheses. Coefficients: *** Significant at 1% level, ** Significant at 5% level, * Sig-nificant at 10% level.
Observations 6107 6107 4414 4414 4414R2 0.469 0.088 0.061 0.285 0.286Year fixed effects Yes Yes Yes Yes YesFirm fixed effects No Yes Yes Yes YesTrend control No No No Yes YesControls * post-SOX No No No No Yes
44
Fig. 4: Dynamics of independent board effect on backward and self-citations.
Notes: These figures illustrate the effect of a change in board indepen-dence on backward and self-citations over time. For the graphs we de-fined dummy variables for the time firms changed from a minority ofindependent board members to an independent board. t0 indicates theyear of the switch and serves as the reference category. tn−1 indicatethe years before the switch, and tn+1 the corresponding years after theswitch. Coefficients are taken from the last regression in 4.4, but with thetn dummies instead of the one dummy variable indicating a majority ofindependent board members.
−0.
50.
00.
51.
01.
5
Coe
ffici
ent s
ize
−5 −4 −3 −2 −1 0 1 2 3 4 5
Timeline
ß−Coefficients 95%−Confidence−interval
Backward cites
−0.
50.
00.
51.
01.
5
Coe
ffici
ent s
ize
−5 −4 −3 −2 −1 0 1 2 3 4 5
Timeline
ß−Coefficients 95%−Confidence−interval
Self−cites
45
Both measures use the original class in which the patent was granted (each year the
USPTO changed the organization or concordance of the classifications).
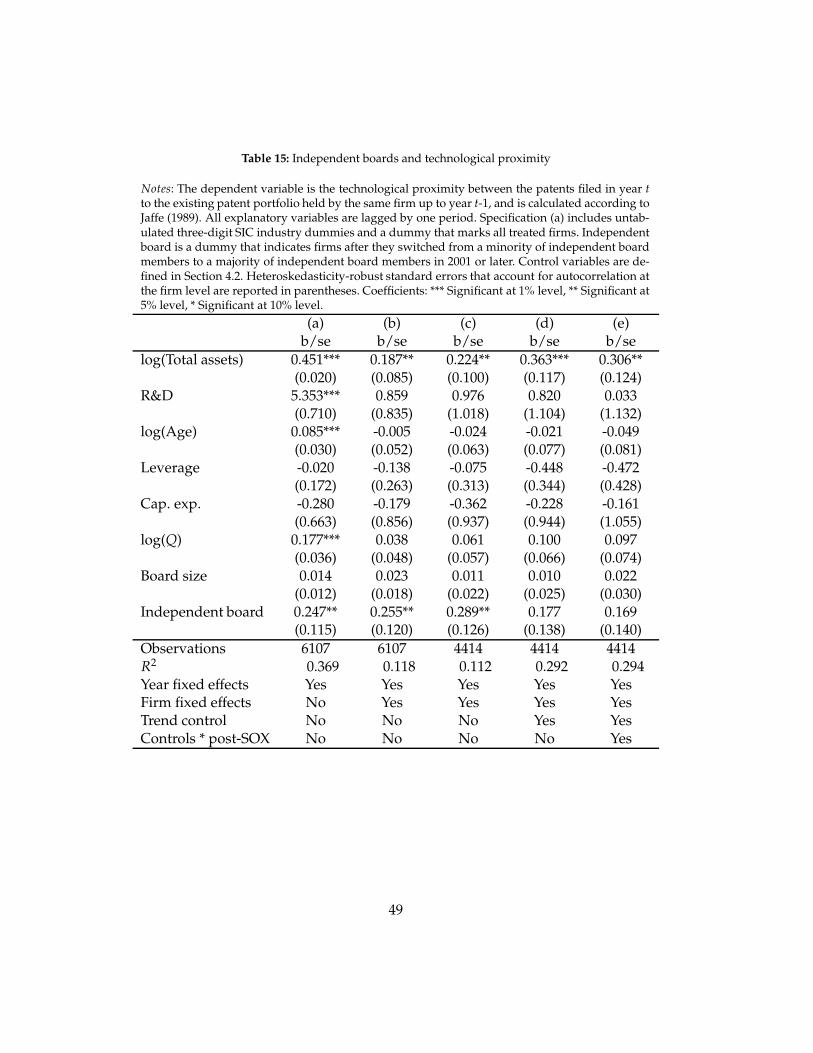
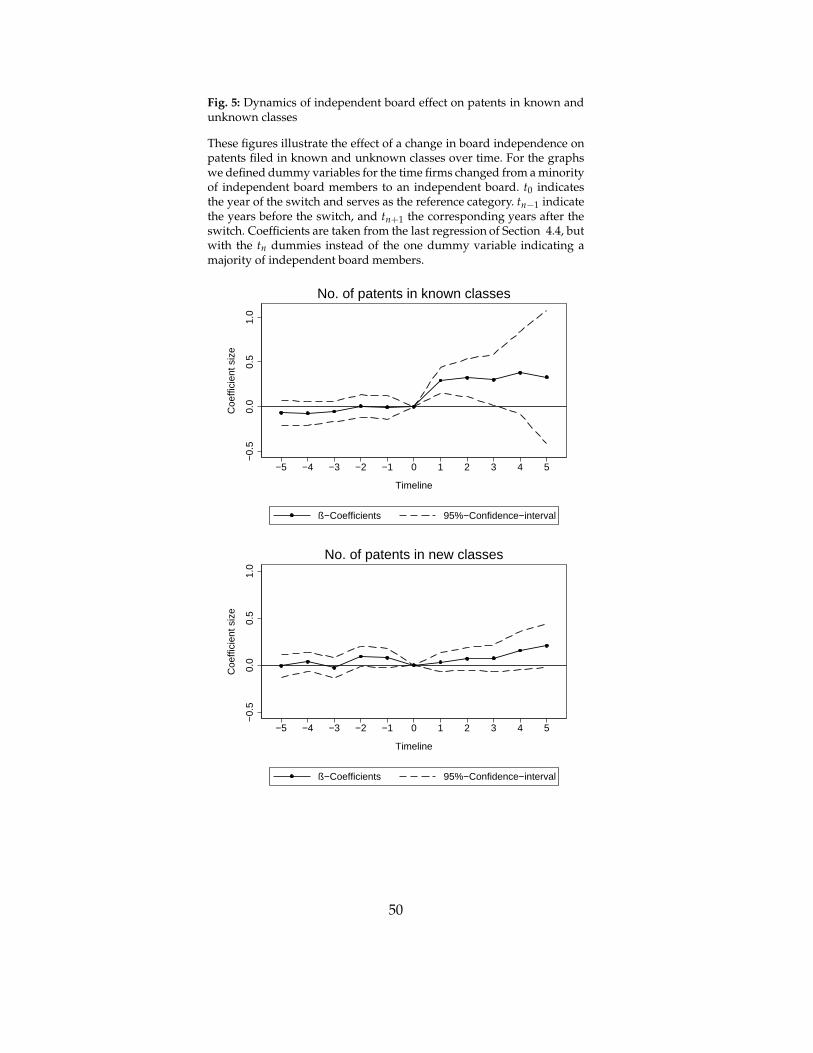
Tables 13 to 15 present the corresponding regression results. Fig. 5 illustrates the
dynamics of the effects on patents in known and unknown areas. As can be seen, inde-
pendent boards have an insignificant effect on exploration of new classes but a strong
and significantly positive effect on search in previously patented classes—the number
of patents in known classes increases by 32% to 20%. The Jaffe measure of technological
proximity ranges from 25% to 29% but loses significance in the trend models.
6. Robustness checks and discussion
We first test robustness by adding controls for several alternative governance mech-
anisms that might confound the relationship between board independence and innova-
tion. Second, we re-estimate all models using an instrumental variable (IV)-regression
specification as introduced by Duchin et al. (2010). Third, we acknowledge limitations
and close with a discussion of the mechanisms that might drive our results.
6.1. Governance provisions
Empirical research in corporate governance has considered a wide range of provi-
sions that influence corporate behavior. If those factors simultaneously vary with board
independence, missing controls could lead to an under- or overestimation of the inde-
pendent board effect. We minimize this possibility by adding controls sequentially and
finally estimating a full model. In order to economize on the size of the robustness
46
Table 13: Independent boards and patents in known classes
The dependent variable is the logarithm of one plus the number of patents filed in classes wherethe given firm had already at least one other patent filed any previous year. All explanatory vari-ables are lagged by one period. Specification (a) includes untabulated three-digit SIC industrydummies and a dummy that marks all treated firms. Independent board is a dummy that in-dicates firms after they switched from a minority of independent board members to a major-ity of independent board members in 2001 or later. Control variables are defined in Section 4.2.Heteroskedasticity-robust standard errors that account for autocorrelation at the firm level arereported in parentheses. Coefficients: *** Significant at 1% level, ** Significant at 5% level, * Sig-nificant at 10% level.
Observations 6107 6107 4414 4414 4414R2 0.572 0.184 0.153 0.401 0.406Year fixed effects Yes Yes Yes Yes YesFirm fixed effects No Yes Yes Yes YesTrend control No No No Yes YesControls * post-SOX No No No No Yes
47
Table 14: Independent boards and patents in unknown classes
The dependent variable is the logarithm of one plus the number of patents filed in classes wherethe given firm had no other patent filed in any previous year. All explanatory variables are laggedby one period. Specification (a) includes untabulated three-digit SIC industry dummies and adummy that marks all treated firms. Independent board is a dummy that indicates firms afterthey switched from a minority of independent board members to a majority of independent boardmembers in 2001 or later. Control variables are defined in Section 4.2. Heteroskedasticity-robuststandard errors that account for autocorrelation at the firm level are reported in parentheses.Coefficients: *** Significant at 1% level, ** Significant at 5% level, * Significant at 10% level.
Observations 6107 6107 4414 4414 4414R2 0.319 0.134 0.115 0.284 0.291Year fixed effects Yes Yes Yes Yes YesFirm fixed effects No Yes Yes Yes YesTrend control No No No Yes YesControls * post-SOX No No No No Yes
48
Table 15: Independent boards and technological proximity
Notes: The dependent variable is the technological proximity between the patents filed in year tto the existing patent portfolio held by the same firm up to year t-1, and is calculated according toJaffe (1989). All explanatory variables are lagged by one period. Specification (a) includes untab-ulated three-digit SIC industry dummies and a dummy that marks all treated firms. Independentboard is a dummy that indicates firms after they switched from a minority of independent boardmembers to a majority of independent board members in 2001 or later. Control variables are de-fined in Section 4.2. Heteroskedasticity-robust standard errors that account for autocorrelation atthe firm level are reported in parentheses. Coefficients: *** Significant at 1% level, ** Significant at5% level, * Significant at 10% level.
Observations 6107 6107 4414 4414 4414R2 0.369 0.118 0.112 0.292 0.294Year fixed effects Yes Yes Yes Yes YesFirm fixed effects No Yes Yes Yes YesTrend control No No No Yes YesControls * post-SOX No No No No Yes
49
Fig. 5: Dynamics of independent board effect on patents in known andunknown classes
These figures illustrate the effect of a change in board independence onpatents filed in known and unknown classes over time. For the graphswe defined dummy variables for the time firms changed from a minorityof independent board members to an independent board. t0 indicatesthe year of the switch and serves as the reference category. tn−1 indicatethe years before the switch, and tn+1 the corresponding years after theswitch. Coefficients are taken from the last regression of Section 4.4, butwith the tn dummies instead of the one dummy variable indicating amajority of independent board members.
−0.
50.
00.
51.
0
Coe
ffici
ent s
ize
−5 −4 −3 −2 −1 0 1 2 3 4 5
Timeline
ß−Coefficients 95%−Confidence−interval
No. of patents in known classes
−0.
50.
00.
51.
0
Coe
ffici
ent s
ize
−5 −4 −3 −2 −1 0 1 2 3 4 5
Timeline
ß−Coefficients 95%−Confidence−interval
No. of patents in new classes
50
check table we focus on five outcome variables: (1) Future citations received, (2) Break-
through patents that fall in the Top 1% category, (3) Incremental patents that received at
least one citation but do not fall into the Top 10% category, (4) Self-citations, (5) Patents
filed in technology classes that are known to the firm. Reported results come from the
previously introduced regression models with firm fixed effects and after matching.
We first consider CEO and board tenures, outside directorships, outside CEOs, and
CEO shareholder voting rights. The sample shrinks because the IRRC collected data on
those measures only from 1998 onwards. The tenure of the CEO and/or board members
may influence investment decisions, through, for example, anticipated time horizons
and payoffs to long-term investments. Hence, we add the years since the CEO has been
appointed and the average time since appointment of all directors. Prior research has
also shown that simultaneous outside board mandates can have an influence on the ad-
vice and control offered by the board (e.g., Field, Lowry, and Mkrtchyan, 2013) and that
CEOs of other companies who simultaneously serve as monitoring directors influence
corporate governance (Fahlenbrach, Low , and Stulz, 2010). The total number of simul-
taneous outside directorships of all board members and the number of outside CEOs on
the board thus also enter the regressions (results are robust to taking the average num-
ber of outside directorships and CEOs, respectively; not reported). Table 16, Panel A,
reports the results. Though the number of outside directorships of all board members
is significantly and positively correlated with breakthrough innovations, none of the
newly added board characteristics change the previously identified effect of the switch
to an independent board (there is also no impact on the effect of switching on other
51
dependent variables, both here and below, results omitted for brevity).
Next, we add a control variable for inside firm ownership which is proxied by the
percentage of shareholder voting rights of the CEO (results are robust to alternatively
taking the cumulative voting rights of all board members). Data come again from IRRC.
Table 16, Panel B, illustrates how inside ownership itself is not significantly correlated
with any innovation measure. The size of the marginal effect of board independence
decreases by 10% to 15%, though the statistical significance of the effect remains at the
1% level.
Large shareholders have incentives to actively control executives (Shleifer and Vishny,
1997). Outside control may have changed with board independence as well, which
might confound our previous estimations. Following Atanassov (2013), we control for
large shareholder presence by adding a dummy variable that marks firms with at least
one non-executive holding of at least 5% of equity (results are robust to taking higher
threshold levels). Data come from Thomson Financial. Table 16, Panel C, reports the
results. The presence of a blockholder appears to have no effect on the first four depen-
dent variables, and a small and weakly significant negative effect on patents filed in
known technology classes. Again, the independent board effect remains qualitatively
unaltered.
The fifth robustness check adds a measure of the strength of the shareholders’ rights
using the G-Index of Gompers, Metrick, and Ishii (2003). The G-Index combines 24 cor-
porate governance provisions that influence shareholder rights. It ranges from 1 to 24,
where the lowest values indicate the strongest rights, and vice versa. Some of those
52
combined provisions are particularly likely to have changed simultaneously with board
independence. Hence, we add the following four indicators for firms that have: (1) a
staggered board, where only a proportion of the directors can be replaced each year; (2)
a poison pill that gives shareholders special rights to prevent hostile takeover attempts;
(3) cumulative voting where shareholders are allowed to combine their voting rights in
a way that multiplies their rights with the number of directors to be elected (the only
governance provision that is supposed to increase shareholder control), and (4) direc-
tor indemnification where bylaws or the corporate charter can indemnify officers and
directors from certain legal expenses and judgments resulting from lawsuits. Table 16,
Panel D reports the results including the control for the G-Index, and Panel E reports
the results including the specific governance provisions. None of the governance con-
trols are significantly correlated with any of our dependent variables of interest. Again,
the estimated effect of the independent board change remains qualitatively unaltered.
Finally, we re-estimate all our models jointly including all of the previously men-
tioned additional controls. Results are reported in Panel F of Table 16. Although this
exercise reduces the amount of observations and controls for corporate governance pro-
visions of all sorts, the effect of a switch to an independent board remains statistically
and economically significant in models 1, 3, 4, and 5; consistent with our former results
it stays insignificant in model 2. The sizes of the marginal effects decrease by up to 28%
(in case of future citations). That only a few newly added controls show statistically
significant influences themselves is partly related to the inclusion of firm fixed effects
in all specifications, which limits investigations of these variables’ effects, for example,
53
the governance provisions, that exhibit low variation over time.
54
Table 16: Robustness checks
This table reports the results of separate robustness checks in each panel. The dependent variables arethe logarithm of one plus the total number of citations received (model A), the logarithm of one plusthe number of patents in the top 1% of the citation distribution per year and tech class (model B), thelogarithm of one plus the number of patents that received at least one citation but do not fall in the top10% of the citation distribution per year and tech class (model C), the logarithm of one plus the totalnumber of self-citations (model D), the logarithm of one plus the total number of patents filed in knowntechnology classes (model E). All specifications are estimated after matching and include firm and timefixed effects and control variables as introduced in Section 4.2, not shown. Independent board indicateswhen a firm switches from a minority of independent board members to a majority of independent boardmembers in 2001 or later. Independent variables are introduced in Section 6.1. Heteroskedasticity-robuststandard errors that account for autocorrelation at the firm level are reported in parentheses. Coefficients:*** Significant at 1% level, ** Significant at 5% level, * Significant at 10% level.
p-value < 0.01). Overall, the robustness check largely supports our main findings from
the DiD models.
6.3. Discussion
The results consistently describe a shift towards innovative exploitation for firms
that transition to an independent board. They do not provide consistent evidence for
any influence on exploration; there are positive but weakly significant increases in the
57
Table 17: Robustness checks
The dependent variables are the logarithm of one plus the total number of citations received(model A), the logarithm of one plus the number of patents in the top 1% of the citation distri-bution per year and tech class (model B), the logarithm of one plus the number of patents thatreceived at least one citation but do not fall in the top 10% of the citation distribution per yearand tech class (model C), the logarithm of one plus the total number of self-citations (model D),the logarithm of one plus the total number of patents filed in known technology classes (modelE). ∆Independent directors are the predicted changes in the percentage of independent directorsbetween 2000 and 2005. The first stage includs all control variables introduced in Section 4.2, in-dustry dummies, and, as an instrument, a dichotomous variable that marks all firms that did notcomply with SOX in the year 2000. Heteroskedasticity-robust standard errors that account for au-tocorrelation at the firm level are reported in parentheses. Coefficients: *** Significant at 1% level,** Significant at 5% level, * Significant at 10% level.
tail of the citation distribution and no impact on patenting in new classes. Here we
summarize robustness checks reported in the Appendix, explore potential mechanisms
that could accomplish the shift towards exploitation, and discuss why independent
boards (and managers) might have less influence on exploration.
Firms which transition to independent boards patent more; this raises the concern
that the increased backward and self-citation results might simply be artifacts of the in-
creased patenting. To rule out this possibility, we estimate regressions of backward and
self-citations per patent. As can be seen in Tables 19 and 20 in the Appendix, the pro-
portion of backward and self-citations also increases for firms which transition to inde-
pendent boards. Effects sizes range from 22–18% for backward citations and 16–14% for
self-citations. We also investigated the coefficient of variance of citations to firms that
undergo the transition to independent boards. While the results were not significant on
a yearly basis, an aggregation of the four years following the transition demonstrated
a significant decrease; consistent with a shift to exploitation and thinning of the tails,
citations to firms with independent boards become less variable after the transition. We
found no evidence that the transition to independent boards influences innovative effi-
ciency (Cohen, Diether, and Malloy, 2013); there is no statistically significant result for
the regression of patents per R&D investment and citations per R&D are positive but
lose significance in the trend models.
Table 21 shows that our results are more pronounced for firms with high research
and development spending and stock. Board independence appears to have a stronger
impact on firms for which innovation is more important (high R&D), probably because
59
for those firms the tension between exploration/exploitation is more significant and
boards need to be more concerned about their innovation strategies. If innovation is
less important (low R&D), there is probably less board involvement in innovation and
thus our results are less pronounced.
As proposed in the introduction, multiple mechanisms could cause a firm whose
board becomes independent to shift towards exploitation. For example, managers may
shirk less and work harder in response to greater oversight, take less risk out of ca-
reer concerns, respond to advice, or search less because they fear an independent board
will constrain future flexibility. Ruling out one versus another mechanism empirically
remains difficult, as they imply similar predictions and probably co-exist in practice.
Nonetheless, the split sample tests described below remain consistent with models
where greater oversight results in increased effort and risk aversion.
We split the sample into firms with high and low managerial entrenchment, using
the index of Bebchuk, Cohen, and Ferrell (2009). This entrenchment or "e-index" indi-
cates how many corporate governance provisions are in place that shield a manager
from getting fired, e.g., poison pills, golden parachutes, and supermajority require-
ments for mergers and charter amendments. 13 Table 22 shows that the effects of inde-
pendent boards are consistently stronger for firms with high managerial entrenchment.
Managers in firms with low entrenchment index are already subject to career concerns
and takeover pressures, even before the board becomes independent. Therefore, the
13The E-Index is given by Bebchuk, Cohen, and Ferrell (2009) for all equal years and is fairly stable overtime. In order to keep the sample size as large as possible we imputed with the lagged value where theE-Index was missing; if the lagged value was missing we took the forward value.
60
transition to an independent board does not have much impact on these managers. It is
for entrenched managers that transitioning into independent boards can trigger career
concerns and greater exploitation.
Most likely, many mechanisms play overlapping and possibly complementary roles
in explaining the shift towards exploitation. The aggregate evidence is most consistent,
however, with increased oversight and career concerns mechanisms; the shift towards
exploitation when a firm’s board becomes independent is most likely due to a combi-
nation of greater managerial effort and an increased aversion to innovative risk.
We do not see an increase in exploitation at the expense of breakthroughs, indeed,
we see almost no impact of board transition on breakthroughs at all. This might im-
ply that exploration and exploitation are not ends of a continuum; rather, they could
be orthogonal and possibly complementary strategies, especially for firms with large
research portfolios and relatively independent research teams. Alternately, exploitation
could also lead to breakthroughs, through greater focus and reliance on deep expertise
(Jones, 2009). Particularly with the increasing "burden of knowledge," an exploration
strategy necessarily implies a more shallow understanding of an area simply because
it is new and unfamiliar. This could be an even more severe handicap for fast moving
fields. A lack of significance might also simply result from lack of statistical power;
breakthroughs are by definition rare events.
It is likely, however, that exploitation crowds out exploration in general (March,
1991). To begin with, the first-order goal of boards and managers is value creation
for shareholders, not scientific or technical discovery. It is also likely that boards and
61
managers have less fundamental ability to influence exploration; it is simply easier to
manage and organize extant and tangible possibilities than to encourage breakthrough
creativity. By its nature, exploration also takes longer to measure and appropriate. To
explore this hypothesis with the current data set, we ran lagged outcomes of later years,
but found no significant differences. Such delayed and uncertain payback is less attrac-
tive to managers and boards. It may also be more difficult to appropriate explorative
innovation, as it requires a stable workforce and patient investment; this hypothesis
could be explored with patent citation diffusion models.
These arguments raise the possibility that the contradictory results in the literature
on governance and innovation are caused by the conflation of two successful innova-
tion strategies. For example, this research and that of Lerner, Sorenson, and Stromberg
(2011) illustrate an exploitation strategy; in contrast, Chemmanur and Tian (2016) illus-
trate an exploration strategy (as evidenced by the increase in citation variance). Both
probably lead to an increase in firm value, though the mechanisms, risk, and payoff
vary greatly. As a further example, are the non-monotonic results of Sapra, Subrama-
nian, and Subramanian (2014) due to differing search strategies? Does higher citation
come from focus and exploitation on the strong governance end and search and explo-
ration on the weak governance end? Similarly, does the weak governance result come
from the tails of the distribution and greater volatility in patent citations, consistent
with an exploration strategy? Some of the conflicting results in the governance and in-
novation literature might be profitably revisited with more nuanced measures and an
effort to better identify the particular mechanisms and strategies that result in increased
62
patenting and citations.
7. Conclusion
We proposed that firms which undergo a transition to more independent boards in-
crease exploitation of previously successful areas of expertise. We argued that the shift
towards exploitation results from stronger board oversight which increases both man-
agerial effort and risk aversion. Supporting evidence came from the regulatory changes
of Sarbanes-Oxley; firms that transition to more independent boards invent more but
less explorative patents. On average these patents also receive more citations, though
the citations occur to patents in the middle of the distribution and not to breakthrough
or completely failed patents. Furthermore, the increase in cites is due partly to an in-
crease in claims within each patent as well as movement into more crowded areas of
technology. This implies that the increase in citations is partly due to a more thorough
patenting of extant portfolios and an artifact of the citation norms in more crowded
fields. Firms that transition also patent more heavily in technology classes of their cur-
rent portfolio; they do not patent more in new classes. The effects are more pronounced
for research-intensive firms and those that score high on measures of managerial en-
trenchment. Speaking to the larger literature on governance and innovation, our results
indicate that strengthened governance improves innovation performance along exist-
ing trajectories, without harming the probability of a breakthrough.
We offered more nuanced and easily calculated patent measures that enable greater
insight into the search and innovation process. These measures highlight the impor-
63
tance of differentiating between the greater productivity of exploitation and the riskier
search of exploration. The results indicate that firms can increase their patent counts—
and even future citations to those patents—through exploitation of their existing port-
folios. Further work should differentiate, both theoretically and empirically, between
greater and focused effort and riskier search; it should not assume that an increase in
patent counts or citations implies an increase in risk-taking and creativity.
Independent boards appear to move firms towards innovative exploitation and
have little impact on exploration, but what is best for performance? Other research has
found mixed evidence for the impact of independent boards on overall performance
(see, e.g., Duchin et al. 2010; Nguyen and Nielsen, 2010; Adams, Hermalin, and Weis-
bach, 2010). Lack of exploration may cause long-term obsolescence and competency
traps, but where is the optimal tradeoff? Can large and diverse firms avoid the stark
tradeoff, by developing portfolios that simultaneously explore and exploit? These are
topics for future research.
64
Appendix: Robustness checks
65
Table 18: Cross-correlations
This table reports pair-wise correlations of all variables used in the study. Board size is the number of board members. Independent board is an indicator variable that indicates whether the majority ofboard members are independent. Top (1%) are patents that fall into the 1% most cited patents within a given three-digit class and application year. Top 10% to 2% are patents that fall into the 10% to2% most cited patents within a given three-digit class and application year. Cited patents are the number of patents that received at least one citation but do not appear in the top 10%. Uncited are thenumber of patents that were not cited. Self-citations are the number of cites to patents held by the same firm. Patents in new/known classes is the number of patents that are filed in classes where thegiven firm has filed no/at least one other patent beforehand. Tech. prox. is the technological proximity between the patents filed in year t to the existing patent portfolio held by the same firm up to yeart-1, and is calculated according to Jaffe (1989). Further information on variable definitions and data sources are provided in Section 4.2.
Tables 19 and 20 report the average number of backward and self-citations, demon-
strating that firms’ exploitation is not an artifact of greater patenting. Tables 21 and 22
report the split samples by R&D and entrenchment, illustrating stronger effects for
research-intensive firms and those with more entrenched managers.
Table 19: Independent boards and average number of backward cites
The dependent variable is the logarithm of one plus the average number of backward citationsper patent. All explanatory variables are lagged by one period. Specification (a) includes untabu-lated three-digit SIC industry dummies and a dummy that marks all treated firms. Independentboard is a dummy that indicates firms after they switched from a minority of independent boardmembers to a majority of independent board members in 2001 or later. Control variables are de-fined in section 4.2. Heteroskedasticity-robust standard errors that account for autocorrelation atthe firm level are reported in parentheses. Coefficients: *** Significant at 1% level, ** Significant at5% level, * Significant at 10% level.
Observations 3888 3888 2630 2630 2630R2 0.214 0.022 0.018 0.269 0.273Year fixed effects Yes Yes Yes Yes YesFirm fixed effects No Yes Yes Yes YesTrend control No No No Yes YesControls * post-SOX No No No No Yes
67
Table 20: Independent boards and average number of self-cites
The dependent variable is the logarithm of one plus the average number of self-citations perpatent. All explanatory variables are lagged by one period. Specification (a) includes untabulatedthree-digit SIC industry dummies and a dummy that marks all treated firms. Independent boardis a dummy that indicates firms after they switched from a minority of independent board mem-bers to a majority of independent board members in 2001 or later. Control variables are definedin Section 4.2. Heteroskedasticity-robust standard errors that account for autocorrelation at thefirm level are reported in parentheses. Coefficients: *** Significant at 1% level, ** Significant at 5%level, * Significant at 10% level.
Observations 3888 3888 2630 2630 2630R2 0.228 0.023 0.027 0.237 0.240Year fixed effects Yes Yes Yes Yes YesFirm fixed effects No Yes Yes Yes YesTrend control No No No Yes YesControls * post-SOX No No No No Yes
68
Table 21: Median split, high and low R&D stock, matched sample
The sample is split at the median value of the firms’ R&D stock, calculated with a depreciation rateof 15%, using the perpetual inventory method introduced by Hall, Jaffe, and Trajtenberg (2005).Coefficients stem from two separate estimations based on each subsample. The dependent vari-ables are the logarithm of one plus the total number of citations received (model a), the logarithmof one plus the number of patents in the top 1% of the citation distribution per year and tech class(model b), the logarithm of one plus the number of patents that received at least one citation butdo not fall in the top 10% of the citation distribution per year and tech class (model c), the loga-rithm of one plus the total number of self-citations (model d), the logarithm of one plus the totalnumber of patents filed in known technology classes (model e). All specifications include timefixed effects and control variables as introduced in Section 4.2, not shown. Independent board is adummy that indicates firms after they switched from a minority of independent board membersto a majority of independent board members in 2001 or later. Heteroskedasticity-robust standarderrors that account for autocorrelation at the firm level are reported in parentheses. Coefficients:*** Significant at 1% level, ** Significant at 5% level, * Significant at 10% level.
Table 22: Median split, high and low entrenchment, matched sample
The sample is split at the median value of the top managers’ degree of entrenchment measured bythe E-Index of Bebchuk, Cohen and Ferrell (2009). Missing values of the E-Index cause a slightlysmaller sample. Coefficients stem from two separate estimations based on each subsample. Thedependent variables are the logarithm of one plus the total number of citations received (model a),the logarithm of one plus the number of patents in the top 1% of the citation distribution per yearand tech class (model b), the logarithm of one plus the number of patents that received at least onecitation but do not fall in the top 10% of the citation distribution per year and tech class (model c),the logarithm of one plus the total number of self-citations (model d), the logarithm of one plusthe total number of patents filed in known technology classes (model e). All specifications includetime fixed effects and control variables as introduced in Section 4.2, not shown. Independentboard is a dummy that indicates firms after they switched from a minority of independent boardmembers to a majority of independent board members in 2001 or later. Heteroskedasticity-robuststandard errors that account for autocorrelation at the firm level are reported in parentheses.Coefficients: *** Significant at 1% level, ** Significant at 5% level, * Significant at 10% level.