14
November 2016 School Lunch Flunks Independent Democratic Conference An Investigation into the Dirtiest New York City Public School Cafeterias

November 2016
School Lunch Flunks
Independent Democratic Conference
An Investigation into the Dirtiest New York City Public School Cafeterias

1
INTRODUCTION
On May 23, 2016 New York City television station WPix 11 published data on health violations
accumulated by schools during the 2014-2015 school year. The data, obtained through a Freedom
of Information request to the New York City Department of Health and Mental Hygiene
(DOHMH) revealed evidence of mice inside schools during more than 400 school visits by health
inspectors. Hazards included live roaches 61 times, 42 schools without soap and cold water for
lunchroom staff to wash their hands, and 61 schools lacking the proper thermostats to measure
food temperature.1
Parents expressed outrage to the press about being left in the dark about inspection results, and the
New York City Department of Education (DOE) Chief of School Support Services Eric Goldstein
vowed to work with DOHMH to make information associated with these health inspections more
accessible to parents. However, since the release of the data, the DOE and DOHMH have failed to
make public a plan to better inform parents of these inspection results.
In the meantime, other health related hazards in school cafeterias have gone public. On September
16, 2016 various publications including the New York Daily News reported on a green substance
found in school pizzas.2 Ultimately, this caused the DOE to temporarily suspend pizza as a school
lunch option for students. On October 21, 2016 the pizza option was made available to students
again, but according to the New York Daily News, school pizza was again eliminated as a lunch
option after another discolored slice was found at a school cafeteria on November 9, 2016.3
The Independent Democratic Conference (IDC) believes that it is imperative that parents are
properly informed about the state of food safety at their children’s school cafeteria. And while the
NYCDOE publicly promised to work with DOHMH to make the data on school cafeteria
inspections accessible to parents, that pledge has yet to be fulfilled. As a result, the IDC is ready
to take action to ensure parents are well informed about the quality of their children’s lunchrooms.
The IDC will introduce legislation that will require that DOHMH inform the public about the
cleanliness of school cafeterias in the same manner it informs the public about restaurants, which
would require that each school cafeteria receive a letter grade that is made public to all parents by
posting it in the school and by including this information with the existing school score cards
created by the DOE. The IDC believes that this transparency will force cafeteria administrators to
clean up their act. We expect our kids to get A’s and we should expect the cafeterias that feed them
to work just as hard to make the grade.
1 Miller, M. (2016). “Critical health code violations found a several NYC school cafeterias.” Retrieved from http://pix11.com/2016/05/23/critical-health-code-violations-found-at-several-nyc-schools/ 2 Chapman, B. (2016). “NYC schools pull pizza from lunch menu after suppliers deliver green slice.” Retrieved from
http://www.nydailynews.com/new-york/nyc-schools-pull-pizza-lunches-finding-green-slices-article-1.2795526 3 Chapman, B. (2016). “Pizza cut from NYC public schools again after another unsightly slice surfaces.” Retrieved from
http://www.nydailynews.com/new-york/education/pizza-cut-nyc-public-schools-bad-slice-surfaces-article-
1.2865009?utm_source=Master+Mailing+List&utm_campaign=9cb39e10f3-EMAIL_CAMPAIGN_2016_11_09&utm_medium=email&utm_term=0_23e3b96952-9cb39e10f3-75495621
2
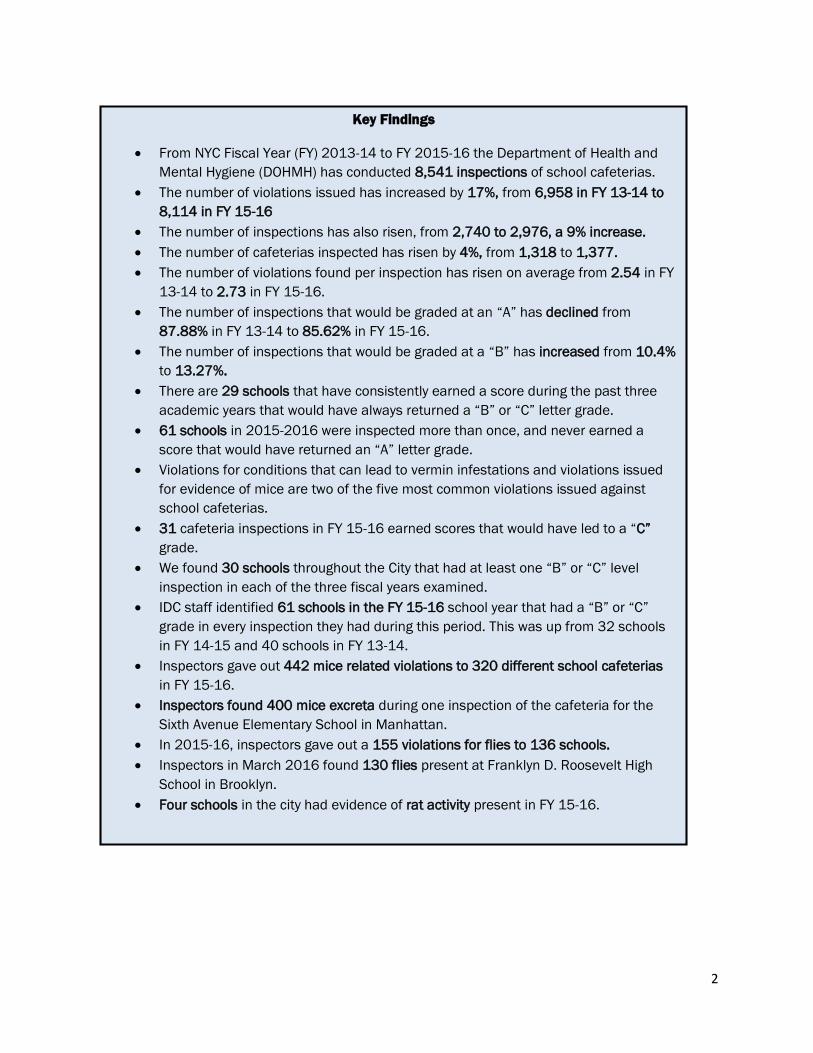
Key Findings
From NYC Fiscal Year (FY) 2013-14 to FY 2015-16 the Department of Health and
Mental Hygiene (DOHMH) has conducted 8,541 inspections of school cafeterias.
The number of violations issued has increased by 17%, from 6,958 in FY 13-14 to
8,114 in FY 15-16
The number of inspections has also risen, from 2,740 to 2,976, a 9% increase.
The number of cafeterias inspected has risen by 4%, from 1,318 to 1,377.
The number of violations found per inspection has risen on average from 2.54 in FY
13-14 to 2.73 in FY 15-16.
The number of inspections that would be graded at an “A” has declined from
87.88% in FY 13-14 to 85.62% in FY 15-16.
The number of inspections that would be graded at a “B” has increased from 10.4%
to 13.27%.
There are 29 schools that have consistently earned a score during the past three
academic years that would have always returned a “B” or “C” letter grade.
61 schools in 2015-2016 were inspected more than once, and never earned a
score that would have returned an “A” letter grade.
Violations for conditions that can lead to vermin infestations and violations issued
for evidence of mice are two of the five most common violations issued against
school cafeterias.
31 cafeteria inspections in FY 15-16 earned scores that would have led to a “C”
grade.
We found 30 schools throughout the City that had at least one “B” or “C” level
inspection in each of the three fiscal years examined.
IDC staff identified 61 schools in the FY 15-16 school year that had a “B” or “C”
grade in every inspection they had during this period. This was up from 32 schools
in FY 14-15 and 40 schools in FY 13-14.
Inspectors gave out 442 mice related violations to 320 different school cafeterias
in FY 15-16.
Inspectors found 400 mice excreta during one inspection of the cafeteria for the
Sixth Avenue Elementary School in Manhattan.
In 2015-16, inspectors gave out a 155 violations for flies to 136 schools.
Inspectors in March 2016 found 130 flies present at Franklyn D. Roosevelt High
School in Brooklyn.
Four schools in the city had evidence of rat activity present in FY 15-16.

3
BACKGROUND
DOHMH Food Safety Inspections
The New York City Department of Health and Mental Hygiene (DOHMH) is responsible for
conducting annual inspections of New York City public school cafeterias. Similar to inspections
DOHMH conducts across restaurants in New York City, schools are given a score based on how
well they follow City and State food safety requirements. Inspectors check for food handling, food
temperature, personal hygiene, facility and equipment maintenance and vermin control. Violations
are classified as either critical or general. Critical violations generally deal with issues that can
directly affect food safety, such as the presence of vermin, cooking food to the incorrect
temperature, or a failure by staff to use the correct food handling methods. General violations deal
with broader issues, like the general cleanliness and maintenance of a location. Critical violations
can also be classified as public health hazards if the inspector feels they present a clear and pressing
danger to public safety. Each violation earns a certain number of points. The points for a particular
violation depend on the health risk it poses to the public. Inspectors assign additional points to
reflect the extent of the violation. A violation’s condition level can range from 1 (least extensive)
to 5 (most extensive). At the end of the inspection, the inspector totals the points and this number
is the inspection score.4 The higher the score, the worse the school performed during the food
safety inspection.
In the case of school cafeteria inspections, the data received from DOHMH indicates that there are
two inspection programs: a pre-permit inspection program for new schools before are operational;
and a cycle inspection program for existing schools, which occur at least once per year and are
broken down into three inspection types. The first type is an initial inspection, which all operational
New York City public schools go through at least once per year; the second type is a re-inspection,
which the DOHMH conducts within two weeks of an initial inspection if a violation poses a public
health hazard or if the school has accumulated an egregious number of violations; and a final
compliance inspection for persistently poor performing schools. Because parents would be most
concerned about schools their children already attend, the IDC analysts focused on cycle
inspection program data scores associated with the three types of inspections.
Public Letter Grades
Unlike restaurant inspections, school scores are not converted into letter grades that are made
public. For restaurants, dining facilities that score between 0 and 13 points during their initial
inspection are awarded an “A” grade. Those accumulating 14 or more points have the ability to
ask for a re-inspection. They are given a “grade pending” sign and are re-inspected typically one
month after the initial inspection. Restaurants going through a re-inspection are given a second
opportunity to obtain an “A” grade, if the dining facility scores between 0 and 13 points. However,
restaurants failing to meet the requirements of an “A” grade during re-inspection are awarded a
“B” if they accumulate between 14 and 27 points, or a “C” if they amass 28 or more points. Staff
examination of the inspections data found that DOHMH will conduct re-inspections of cafeterias,
4 Department of Health and Mental Hygiene. (2012). “How we score and grade”. Retrieved from http://www1.nyc.gov/assets/doh/downloads/pdf/rii/how-we-score-grade.pdf

4
but only if the inspection initial inspection would have earned a “C.” None of the results are made
public, so parents have no idea that the cafeteria their children are eating at was found to be as
clean as a “B” or “C” level restaurant.
DATA TRENDS FOR SCHOOL CAFETERIA INSPECTIONS 2013-16
IDC staff poured through three fiscal years’ worth of inspections of school cafeterias conducted
by DOHMH. During that period, DOHMH conducted 8,541 different inspections, including pre-
permit inspections, cycle inspections, re-inspections and enforcement inspections. Cycle
inspections made up the overwhelming majority of those inspections. DOHMH groups the
violations by each New York City Fiscal Year (FY), which runs from July 1 to June 30, so FY 15-
16 for example, will cover all inspections conducted between July 1, 2015 through June 30. 2016.
General Breakdown of Inspection Results
Fiscal Year: FY 13-14 FY 14-15 FY 15-16
Cafeterias Inspected 1,318 1,384 1,377
Total Inspections 2,740 2,825 2,976
Inspections Per Cafeteria 2.08 2.04 2.16
Total Violations Issued 6,958 7,292 8,114
Violations Per Inspection 2.54 2.58 2.73
Critical Violations 1,161 1,242 1,378 Critical Violations per
Inspection 0.42 0.44 0.46
Percentage of Violations labeled Critical
16.69% 17.03% 16.98%
As the table above shows, the number of violations has increased significantly in the past three
fiscal years, from 6,958 to 8,114, a 17% increase over the FY 13-14 period. During that same time,
the number of cafeterias being inspected and the number of inspections themselves have also
increased, but those increases (A 4% increase in cafeterias being inspected and a 9% increase in
total inspections) have both been smaller than the increase in violations issued. For this reason, the
number of violations per inspections have risen during this period, both for violations in general
as well as for the number of critical violations being issued. The number of inspections per
cafeteria have also gone up. There has been a slight increase in the percentage of total violations
labeled critical between FY 13-14 and FY 15-16, though the latest numbers are better than in FY
14-15.
DOHMH classifies violations using various codes. Codes can refer to a single type of violation or
to a related group of possible violations. There are 67 different codes given for the different types
of violations that are scored by DOHMH. Of these 67 codes, five made up the majority of the
scored violations issued to school cafeterias in each of the three fiscal years examined.

5
Most Common Scored Violation Types
VIOLATION CODE
Violations FY 13-14
Cafeterias in FY 13-14
Violations FY 14-15
Cafeterias in FY 14-15
Violations FY 15-16
Cafeterias in FY 15-16
10F 3,760 1,030 4,212 1,099 4,986 1,114
10B 652 422 578 380 646 421
08A 500 318 527 314 559 399
04L 423 298 368 283 442 320
10C 427 291 311 242 225 194
The most commonly issued violations fall under the 10F code. This code refers to violations
dealing with the poor maintenance or improper construction of surfaces not used in food
preparation (walls, floors) or equipment not used in storing or preparing food. Dusty floors and
stained walls are common examples of 10F violations, which make up more than half of all the
violations issued in any one fiscal year. These are considered general violations.
The next most common code is 10B, which concern issues of the poor disposal of liquid wastes,
the possible cross-contamination of potable water sources with waste liquids, or improperly
installed or maintained condensation pipes. These are considered general violations. 8A, which we
discuss in greater detail later in the report, deals with violations that make pest infestations more
likely. These are usually considered general violations, though some can rise to the level of critical
violations. 4L is the code for evidence of mice activity. These are considered critical violations.
This type of violation was the fourth most common in FY 14-15 and FY 15-16 and the fifth most
common in FY 13-14. The final most common scored violation fall under code 10C, which refers
to violations dealing with insufficient or inadequate lighting. The data shows that there has been a
significant (47%) decline in this type of violation even as the total number of violations increased.
Inspection Outcomes
Percentage of Inspections FY 13-14 FY 14-15 FY 15-16
A – 13 or Fewer points 87.88% 87.50% 85.62%
A – 0 points, No scored violations 20.66% 21.17% 18.65%
B - 14-27 Points 10.40% 11.15% 13.27%
C - 28 or more Points 1.72% 1.35% 1.11%
Violation for Vermin/Pest Conditions 14.96% 14.12% 14.99%
The data shows that most inspections conducted in school cafeterias return scores that would equal
a grade of “A” for a commercial restaurant. A significant percentage of inspections do not find any
6
scored violations at all. Unfortunately, the data also shows a disturbing downward trend in these
numbers. The percentage of inspections that would be graded an “A” has fallen by two full
percentage points between FY 2013-14 and FY 2015-16, as has the percentage of inspections that
found no scored violations at all. The percentage of truly terrible inspections that would yield a
grade of “C” has also declined. What we see is an increase of almost three full percentage points
for inspections that would return a “B” grade. This increase in mediocre inspection results is
something that we must fight to turn around.
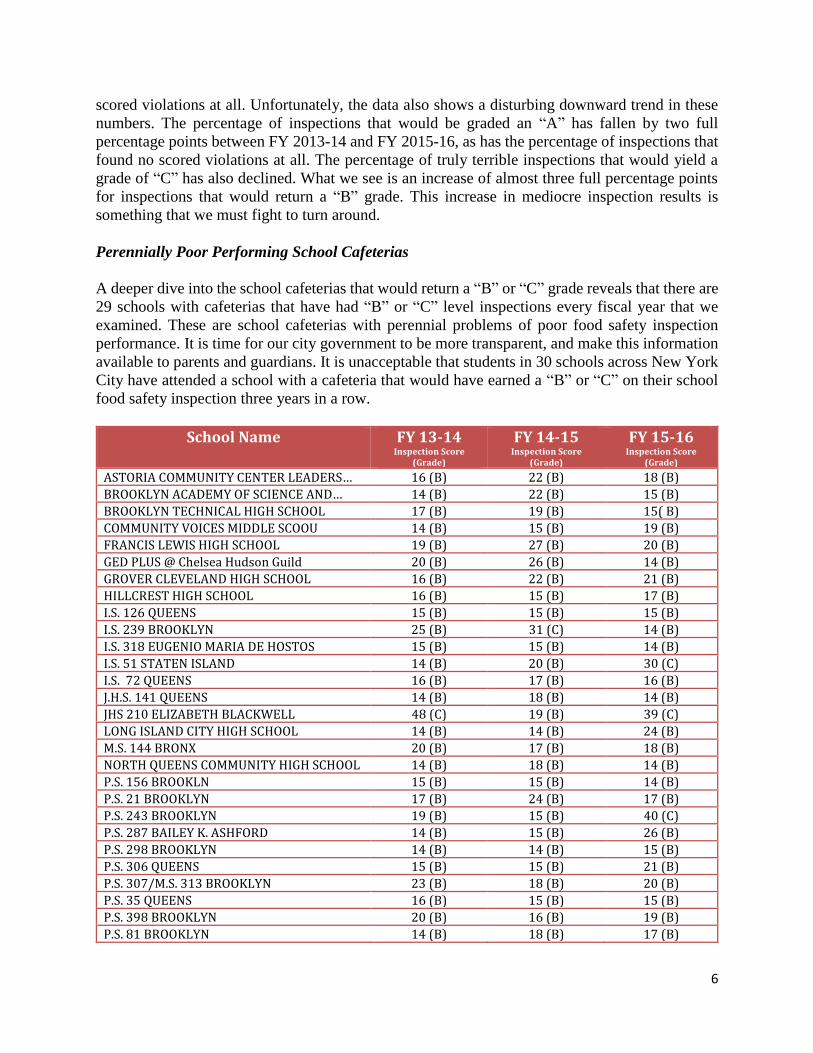
Perennially Poor Performing School Cafeterias
A deeper dive into the school cafeterias that would return a “B” or “C” grade reveals that there are
29 schools with cafeterias that have had “B” or “C” level inspections every fiscal year that we
examined. These are school cafeterias with perennial problems of poor food safety inspection
performance. It is time for our city government to be more transparent, and make this information
available to parents and guardians. It is unacceptable that students in 30 schools across New York
City have attended a school with a cafeteria that would have earned a “B” or “C” on their school
food safety inspection three years in a row.
School Name FY 13-14 Inspection Score
(Grade)
FY 14-15
Inspection Score (Grade)
FY 15-16
Inspection Score (Grade)
ASTORIA COMMUNITY CENTER LEADERS… 16 (B) 22 (B) 18 (B)
BROOKLYN ACADEMY OF SCIENCE AND… 14 (B) 22 (B) 15 (B)
BROOKLYN TECHNICAL HIGH SCHOOL 17 (B) 19 (B) 15( B)
COMMUNITY VOICES MIDDLE SCOOU 14 (B) 15 (B) 19 (B)
FRANCIS LEWIS HIGH SCHOOL 19 (B) 27 (B) 20 (B)
GED PLUS @ Chelsea Hudson Guild 20 (B) 26 (B) 14 (B)
GROVER CLEVELAND HIGH SCHOOL 16 (B) 22 (B) 21 (B)
HILLCREST HIGH SCHOOL 16 (B) 15 (B) 17 (B)
I.S. 126 QUEENS 15 (B) 15 (B) 15 (B)
I.S. 239 BROOKLYN 25 (B) 31 (C) 14 (B)
I.S. 318 EUGENIO MARIA DE HOSTOS 15 (B) 15 (B) 14 (B)
I.S. 51 STATEN ISLAND 14 (B) 20 (B) 30 (C)
I.S. 72 QUEENS 16 (B) 17 (B) 16 (B)
J.H.S. 141 QUEENS 14 (B) 18 (B) 14 (B)
JHS 210 ELIZABETH BLACKWELL 48 (C) 19 (B) 39 (C)
LONG ISLAND CITY HIGH SCHOOL 14 (B) 14 (B) 24 (B)
M.S. 144 BRONX 20 (B) 17 (B) 18 (B)
NORTH QUEENS COMMUNITY HIGH SCHOOL 14 (B) 18 (B) 14 (B)
P.S. 156 BROOKLN 15 (B) 15 (B) 14 (B)
P.S. 21 BROOKLYN 17 (B) 24 (B) 17 (B)
P.S. 243 BROOKLYN 19 (B) 15 (B) 40 (C)
P.S. 287 BAILEY K. ASHFORD 14 (B) 15 (B) 26 (B)
P.S. 298 BROOKLYN 14 (B) 14 (B) 15 (B)
P.S. 306 QUEENS 15 (B) 15 (B) 21 (B)
P.S. 307/M.S. 313 BROOKLYN 23 (B) 18 (B) 20 (B)
P.S. 35 QUEENS 16 (B) 15 (B) 15 (B)
P.S. 398 BROOKLYN 20 (B) 16 (B) 19 (B)
P.S. 81 BROOKLYN 14 (B) 18 (B) 17 (B)
7
P.S. 86 QUEENS 18 (B) 19 (B) 20 (B)
P.S. 91 BROOKLYN 14 (B) 16 (B) 14 (B)
J.H.S. 210 Elizabeth Blackwell, which is located in Ozone Park, Queens, is a good example of
some of what we see at the schools above. The first inspection in FY 13-14 returned a score of 8,
good enough for an “A.” The following inspection was disastrous – with the total score coming in
at 48, including two violations for evidence of mice. This prompted a re-inspection a month later,
which scored 19 points, including yet another violation for evidence of mice, enough for just a “B”
grade. The first inspection of FY 14-15 scored 19 again, and again evidence of mice were found.
The second inspection for the fiscal year was better, with a score of 9, good enough for an “A”
again. The first inspection of FY 15-16 scored 19 again, and the mouse problem continued, with 6
mouse excreta found. The second inspection during this fiscal year, in the early part of March 2016
was another disaster, with a score of 39, well into “C” territory. Seventy-seven mouse excreta were
found during this inspection. Within three weeks the re-inspection came. This time the score was
26, enough for a “B,” but barely. This time only 10 mouse excreta were found. This school was
inspected eight times during these three fiscal years. Out of those eight inspections, two would
have brought in an “A,” two would have received a “C,” and four would have been graded at a
“B,” including both re-inspections following the “C” grades.
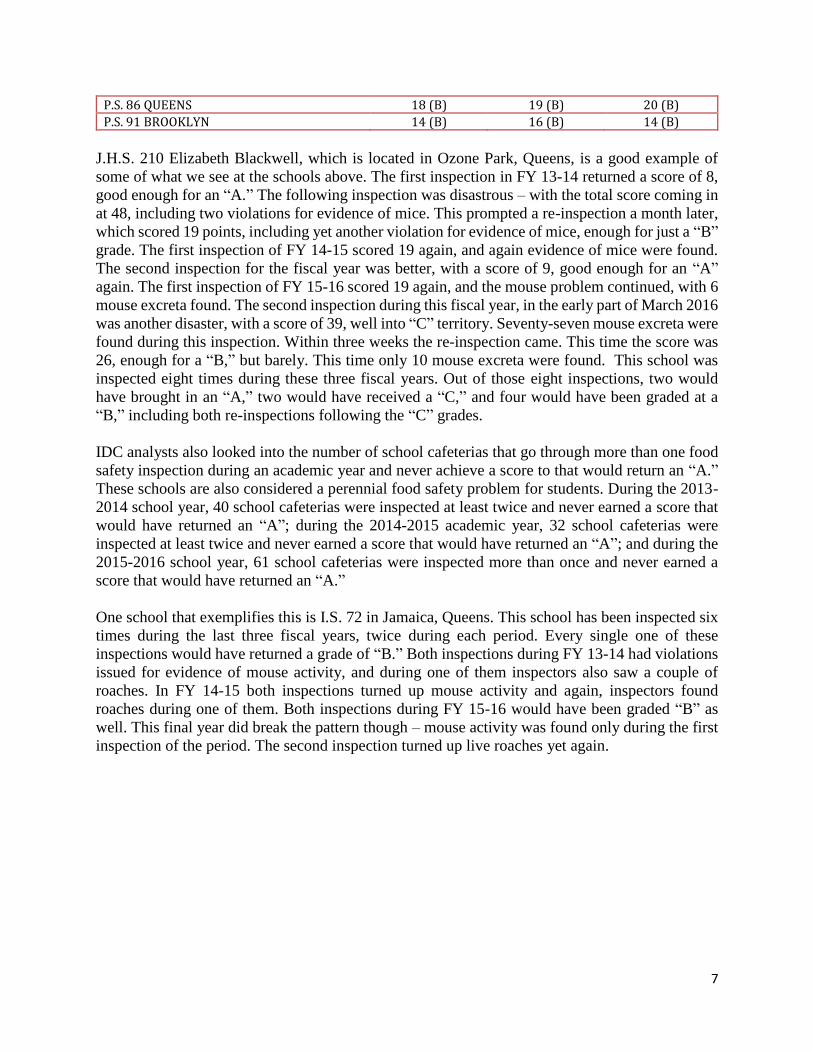
IDC analysts also looked into the number of school cafeterias that go through more than one food
safety inspection during an academic year and never achieve a score to that would return an “A.”
These schools are also considered a perennial food safety problem for students. During the 2013-
2014 school year, 40 school cafeterias were inspected at least twice and never earned a score that
would have returned an “A”; during the 2014-2015 academic year, 32 school cafeterias were
inspected at least twice and never earned a score that would have returned an “A”; and during the
2015-2016 school year, 61 school cafeterias were inspected more than once and never earned a
score that would have returned an “A.”
One school that exemplifies this is I.S. 72 in Jamaica, Queens. This school has been inspected six
times during the last three fiscal years, twice during each period. Every single one of these
inspections would have returned a grade of “B.” Both inspections during FY 13-14 had violations
issued for evidence of mouse activity, and during one of them inspectors also saw a couple of
roaches. In FY 14-15 both inspections turned up mouse activity and again, inspectors found
roaches during one of them. Both inspections during FY 15-16 would have been graded “B” as
well. This final year did break the pattern though – mouse activity was found only during the first
inspection of the period. The second inspection turned up live roaches yet again.

8
“C” Cafeterias in the 2015-16 school year.
As explained in the section “School Health Inspections,” schools are given a score based on how
well they follow City and State food safety requirements. The higher the score, the worse the
school performed during the food safety inspection. For restaurants, dining facilities that score
between 0 and 13 points are awarded an “A” grade, those with a score between 14 and 27 are
awarded a “B” grade, and dining facilities with more than 28 points are given a “C” grade. After
sifting through the 2016-2016 data, the IDC found 31 schools with a final food safety
inspection score above 28 points; in other words, 31 C rated schools. And 23 of those 31
schools had violations associated with pests and vermin.
School Date of
Inspection
Inspection
Score Violations
Types of Pests and
Vermin
CSI H.S. 3/30/2016 28 9 Mice excreta Franklin D. Roosevelt HS 3/9/2016 41 14 Filth flies, fruit flies Fredrick Douglass Academy 7/17/2015 28 11 Mice I.S. 211 Brooklyn 12/9/2015 40 13 Roaches, Mice I.S. 227 Queens 9/18/2015 32 7 Mice I.S. 51 Staten Island 10/6/2015 30 9 Mice In-Tech Academy MS/HS 368 5/5/2016 28 14 Mice JHS 210 Elizabeth Blackwell 3/14/2016 39 7 Mice John Bowne HS 2/3/2016 29 6 Linden Learning Center (PS 213) 11/13/2015 31 5 Mice New Explorers and Bronx Leadership 4/20/2016 29 6 Mice P.S. 100 Queens 3/18/2016 41 7 Flies P.S. 104 Queens 7/13/2015 37 8 Flies P.S. 152 Gwendoline N. Alleyne 2/2/2016 28 6 Flies P.S. 16 Staten Island 9/22/2015 44 9 Mice, Roaches P.S. 18 & P.S. 278 Paula Hedbavny 1/11/2016 28 1 P.S. 18 Staten Island 1/27/2016 32 6 P.S. 191 Brooklyn 12/9/2015 32 3 P.S. 205A 3/30/2016 33 7 Mice P.S. 214 Queens 7/9/2015 31 8 Roaches
40
32
61
2013-2014 2014-2015 2015-2016
Number of Schools Inspected More Than Once, But Never Returned an "A"

9
P.S. 243 Brooklyn 3/11/2016 40 9 Mice P.S. 257 Brooklyn 2/2/2016 34 8 Mice P.S. 33 Chelsea Prep 7/9/2015 35 7 Mice, Roaches, Flies P.S. 361 7/30/2015 46 6 P.S./IS 192 Brooklyn 12/16/2015 31 15 P.S./M.S. 29 4/20/2016 28 9 P.S./MS 147 Queens 4/11/2016 48 8 Drain flies, Mice Ralph McKee Vocational HS 3/9/2016 35 9 Mice Sixth Avenue Elementary School 1/26/2016 41 12 Mice The Peck Slip School 4/20/2016 32 2 Mice United Cerebral Palsy Hearst 1/6/2016 28 1
Vermin and Pests Violations in School Year 2015-2016
Violations for the evidence of specific pests or vermin like rats, mice, roaches, or flies in a school
cafeteria are rightfully considered critical violations by DOHMH. These critical violations come
in various violation conditions – the Department will grade finding a few mice excreta in an
isolated portion of a cafeteria as being a less serious problem than finding massive amounts of
mice excreta near where food is stored. DOHMH also issues violations under the classification of
“pests” for conditions that are conducive to pests or failing to implement the correct pest control
features or actions. Violations under this classification can be categorized as both critical or general
violations.
Mice:
The most common violation for vermin given out is for evidence of mice. This evidence is almost
always in the form of mice excreta found by investigators. Sighting of live mice are rare or non-
existent. In 2015-16, inspectors gave out 442 mice-related violations to 320 different school
cafeterias.
The Sixth Avenue Elementary School in Manhattan had the most serious mice outbreak found –
in one inspection they were issued with six different mice-related violations, with two of them
classified as condition 5, the most serious. Inspectors in January 2016 found an estimated 400 mice
46
115
62
82
15
Bronx Brooklyn Manhattan Queens Staten Island
Cafeterias with Mice Violations FY15-16

10
excreta in various parts of the cafeteria. The Peck Slip School, again in Manhattan, also received
a condition 5 mice violation when inspectors found 190 mice excreta in various parts of the
building.
Filth Flies:
The second most common violation for vermin is given for evidence of flies. In this case,
inspectors are confronted with the actual flies themselves. In 2015-16, inspectors gave out a 155
violations for flies to 136 schools.
Three schools were issued violations for flies that were rated to be condition 5. Inspectors in March
found 130 flies present at Franklyn D. Roosevelt High School in Brooklyn. An inspection also in
March found 101 flies at P.S. 100 in Queens and an April inspection found 95 flies at P.S./M.S.
147 in Queens.
Cockroaches:
Violations for cockroaches are less common than those for flies and mice. As with flies, inspectors
usually witness live cockroaches present in a cafeteria, instead of going by evidence of their
presence. In 2015-16, inspectors issued 64 violations for cockroaches to 61 school cafeterias
across the city.
23
44
21
40
8
0
5
10
15
20
25
30
35
40
45
50
Bronx Brooklyn Manhattan Queens Staten Island
Cafeterias with Filth Flies Violations FY15/16

11
No school cafeterias were issued any condition 5 roach violations in this latest year of data, but
two, Brooklyn Academy Of Science And The Environment & International HS At Prospect
Heights and P.S./I.S. 284 in Brooklyn were the two schools given condition 4 roach violations.
Inspectors found 10 live roaches, including several near the food handling section, at the former
school, and 15 live roaches at the later location.
Rats:
As with their smaller rodent cousins, violations for rat activity are generally issued because
inspectors find evidence of rats, like their excreta, instead of finding actual rats present. In 2015-
16, four schools were issued violations for evidence of rat activity. Those four schools were:
I.S. 218 in Manhattan, found in January 2016
P.S. 197 in Brooklyn, found in January 2016
P.S. 25 in the Bronx, found in November 2015
P.S. 78 in Staten Island, found in March 2016
Other Creatures:
DOHMH will also issue violations for other types of animals found in cafeterias. No cafeterias
were issued such a violation in FY 15-16. FY 14-15 saw violations issued for the presence of ants
and a cat.
Pests:
As noted previously, violations under the classification of “pests” are given for a variety of
conditions that are conducive to pest and vermin infestations. In 2015-16, inspectors issued 559
violations for Pest conditions to 399 schools across the city.
9
22
11
18
1
0
5
10
15
20
25
Bronx Brooklyn Manhattan Queens Staten Island
Cafeterias with Roach Violations in FY15/16

12
I.S. 98 in Brooklyn was issued seven different pest violations in one inspection in November 2015,
for issues like holes found in several walls, gaps between walls and the ceiling that would allow
pests to get through, and the accumulation of dried food waste behind equipment, which would
create the conditions that would attract pests like mice to a location.
LEGISLATIVE SOLUTION
Our analysis of the data provided by DOHMH following our FOIL request shows that while the
vast majority of cafeteria inspections receive grades that would equal an “A,” the number of
inspections that fail to get an “A”-level score has increased over the past three years. This is a
deeply disturbing trend. Our analysis shows that certain schools have perennial issues with vermin
and other issues that threaten the safety of the food being provided to students. The lack of
transparency allows certain cafeterias to coast while doing a poor job at cleaning up their acts.
New York City implemented a program of transparent grading for its tens of thousands of
restaurants to ensure that the public would vote with their feet and provide an incentive for
restaurants to clean up. Given that DOHMH utilizes the very same numerical grading procedures
when inspecting school cafeterias, the question becomes: Why we would be less transparent with
these results than we are with restaurants? After all, parents and kids don’t get a choice of which
school cafeteria they can eat at during lunch time. In this situation, being transparent becomes
more important, not less.
For these reasons, the IDC will introduce legislation that would require that:
1. New York City school cafeteria numerical food safety inspections scores be converted into
a letter grade; cafeterias receive an opportunity to receive an “A” letter grade after a re-
inspection if they fail to score an “A” during their initial inspection, much like restaurants
currently do.
54
147
70
105
23
0
20
40
60
80
100
120
140
160
Bronx Brooklyn Manhattan Queens Staten Island
Cafeterias with Pests Violations FY15/16

13
2. The grade be made public in two forms. First, the final grade be posted in a space in the
school that is visible to all parents. Second, the final letter grade be added to the school
quality reports that are annually published by the New York City DOE.
CONCLUSION
Over a million students within the New York City school system rely on school cafeterias for their
breakfasts or lunches every single school day. Parents expect these cafeterias to be sanitary and
safe. Unfortunately, they have no way of knowing whether this is in fact the case, because
information about the outcome of inspections of cafeterias is not made public. This stands in
contrast to the transparency provided to the public when it comes to inspection results for the tens
of thousands of restaurants in this city. It begs the question why the city is more transparent about
the performance of private restaurants than with its own performance in keeping those kitchens we
utilize to feed students clean. The IDC poured through thousands of inspections records of
cafeterias over the past three city fiscal years and found that while the majority of cafeteria
inspections led to scores that would equal an “A,” more and more school cafeterias are failing to
meet the grade. We also found schools that perennially fail to get an “A” and that have constant
issues with mice or other vermin, and parents have no way of knowing this. The IDC believes that
parents deserve to know about the cleanliness of the school cafeterias where their children dine as
much as they deserve to know about the cleanliness of any private eating establishments they may
choose to eat in with their family. For that reason, the IDC will introduce legislation that would
require the DOHMH to publicly grade school cafeterias as they do restaurants, and require the
DOE to make these letter grades public and available to parents, both by posting them in schools
in a place visible to the public and by including the information in the school quality reports
annually published by the Department.


