110
UAW ` 2018 Johnson, Mirmiran & Thompson, Inc. 3/25/2018 Independent Engineering Inspection of the DC Water Wastewater and Water Systems

UAW
`
2018
Johnson, Mirmiran & Thompson, Inc.
3/25/2018
Independent Engineering Inspection of the DC Water
Wastewater and Water Systems

Page 2 of 110 | Introduction
INDEPENDENT ENGINEERING INSPECTION OF THE DC WATER WASTEWATER AND WATER SYSTEMS
Contents Section 1 Introduction ................................................................................................................................. 5
1.1 Purpose ............................................................................................................................................ 5
1.2 Scope and Methodology ................................................................................................................... 5
1.3 Johnson, Mirmiran & Thompson, Inc. Qualifications ........................................................................ 9
1.4 A Note of Thanks .............................................................................................................................. 9
Section 2 DC Water Overview ................................................................................................................... 10
2.1 Vision, Values, And Mission, and Critical Success Factors ............................................................ 10
2.2 Governance and Organization ........................................................................................................ 11
2.2.1 Governance ............................................................................................................................. 11
2.2.2 Organization ............................................................................................................................ 13
2.3 Management and Operations ......................................................................................................... 15
2.3.1 Budgeting ................................................................................................................................ 15
2.3.2 Facilities Planning and Capital Programming .......................................................................... 17
2.3.3 Project Delivery ....................................................................................................................... 19
2.4 General Conclusions Regarding DC Water’s Structure, Organization, and Management ............. 19
2.5 Findings, Key Initiatives & Accomplishments ................................................................................. 20
2.5.1 Capital Planning and Project Implementation ......................................................................... 20
2.5.2 Permit Compliance .................................................................................................................. 20
2.5.3 Water Supply/Treatment ......................................................................................................... 20
2.5.4 Total Nitrogen Removal and Wet Weather Plan ..................................................................... 21
2.5.5 Combined Sewer Overflow – Long Term Control Plan ........................................................... 21
2.5.6 Inventory Management ............................................................................................................ 21
2.5.7 Asset Management ................................................................................................................. 21
2.5.8 Customer Service .................................................................................................................... 22
2.5.9 Information Technology ........................................................................................................... 22
2.5.10 Maintenance of Infrastructure .................................................................................................. 23
2.5.11 Fire Hydrant Replacement Program ........................................................................................ 23
2.5.12 Infrastructure Leak Index ......................................................................................................... 23
2.5.13 Biosolids Management Plan .................................................................................................... 24
2.5.14 DC Water Awards .................................................................................................................... 24
2.5.15 DC Water Technical Papers .................................................................................................... 26
2.5.16 DC Water Patents ................................................................................................................... 26
2.6 Recommendations .......................................................................................................................... 26
2.6.1 Asset Management ................................................................................................................. 26

Page 3 of 110 | Introduction
INDEPENDENT ENGINEERING INSPECTION OF THE DC WATER WASTEWATER AND WATER SYSTEMS
2.6.2 Design Engineering & Program Management ......................................................................... 26
2.6.3 Unaccountable Water .............................................................................................................. 27
2.6.4 Drinking Water Management ................................................................................................... 27
Section 3 Drinking Water Systems ........................................................................................................... 28
3.1 Overview......................................................................................................................................... 28
3.2 The Washington Aqueduct ............................................................................................................. 29
3.2.1 Structure, Organization and Management Processes ............................................................. 29
3.2.2 General Conclusions as to the Aqueduct’s Structure, Organization, and Management ......... 31
3.3 Water Supply Management and Coordination ................................................................................ 33
3.4 Treatment Processes and Related Facilities .................................................................................. 35
3.4.1 Raw Water Supply................................................................................................................... 35
3.4.2 Pretreatment Storage .............................................................................................................. 35
3.4.3 Water Treatment ..................................................................................................................... 35
3.4.4 Washington Aqueduct Condition Assessment ........................................................................ 37
3.5 Water Demand History ................................................................................................................... 37
3.6 Water System Service Area ........................................................................................................... 38
3.6.1 System Overview .................................................................................................................... 39
3.6.2 2015 Water System Facilities Plan .......................................................................................... 41
3.6.3 Pumping Stations .................................................................................................................... 42
3.6.4 Water Storage Facilities .......................................................................................................... 45
3.6.5 Transmission and Distribution – Mains & Appurtenances ....................................................... 47
3.6.6 Ratepayer Metering ................................................................................................................. 52
3.6.7 Organizational ......................................................................................................................... 52
3.6.8 Asset Management ................................................................................................................. 53
Section 4 Wastewater Systems ................................................................................................................ 57
4.1 Overview......................................................................................................................................... 57
4.2 Wastewater Agreements ................................................................................................................ 58
4.3 Blue Plains Advanced Wastewater Treatment Plant ...................................................................... 59
4.3.1 Permit Compliance .................................................................................................................. 60
4.3.2 Treatment Processes .............................................................................................................. 65
4.3.3 Wastewater Pretreatment Requirements ................................................................................ 65
4.3.4 Condition Assessment and Planned Improvements ................................................................ 66
4.3.5 Liquid Processing Program ..................................................................................................... 67
4.3.6 Solids Handling Process ......................................................................................................... 72
4.4 Collection and Conveyance ............................................................................................................ 77

Page 4 of 110 | Introduction
INDEPENDENT ENGINEERING INSPECTION OF THE DC WATER WASTEWATER AND WATER SYSTEMS
4.4.1 Sewer Facilities Plan ............................................................................................................... 77
4.4.2 Sewer Collection ..................................................................................................................... 78
4.4.3 Collection System CIP ............................................................................................................. 79
4.4.4 Interceptor/Trunk Force Sewer ................................................................................................ 79
4.4.5 Pumping Facilities ................................................................................................................... 80
4.4.6 Department of Sewer Services (DSS) ..................................................................................... 80
4.4.7 Department of Distribution & Conveyance Systems (DDCS) .................................................. 82
4.5 Stormwater ..................................................................................................................................... 83
4.5.1 Stormwater Background .......................................................................................................... 83
4.5.2 Stormwater Projects ................................................................................................................ 84
4.5.3 Stormwater Operations and Maintenance ............................................................................... 84
4.5.4 Findings ................................................................................................................................... 85
Section 5 Clean Rivers Project ................................................................................................................. 86
5.1 Overview......................................................................................................................................... 86
5.2 Consent Decree Modifications ........................................................................................................ 88
5.2.1 Green/Gray CSO Controls ...................................................................................................... 88
5.2.2 Amended Total Nitrogen Limit ................................................................................................. 89
5.2.3 Green Infrastructure Projects .................................................................................................. 90
5.2.4 Green Infrastructure Practices ................................................................................................ 91
5.2.5 Green Infrastructure Innovation and Public-Private Cooperation ............................................ 93
5.2.6 Strategic Partnerships ............................................................................................................. 94
5.2.7 Operations and Maintenance .................................................................................................. 94
5.3 Projects........................................................................................................................................... 94
5.3.1 Contract Divisions ................................................................................................................... 96
Section 6 Security .................................................................................................................................... 104
6.1 Overview....................................................................................................................................... 104
6.2 Physical Security .......................................................................................................................... 104
6.2.1 Capital Improvement Budget ................................................................................................. 104
6.2.2 Facilities Condition Assessment ............................................................................................ 105
6.3 Security Operations ...................................................................................................................... 105
6.3.1 Operations ............................................................................................................................. 105
6.3.2 Department of Homeland Security (DHS) ............................................................................. 106
Bibliography .............................................................................................................................................. 107

Page 5 of 110 | Introduction
INDEPENDENT ENGINEERING INSPECTION OF THE DC WATER WASTEWATER AND WATER SYSTEMS
SECTION 1 INTRODUCTION
1.1 PURPOSE
This report presents the findings of an independent engineering assessment of District of Columbia Water
and Sewer Authority’s (DC Water’s or the Authority’s) wastewater and water systems, pursuant to the
requirements of the Authority’s Master Indenture of Trust. The indenture stipulates that:
“The Authority shall cause an independent consulting engineer at least once
every five years to inspect the system and make a written report thereof which
shall include such independent engineer’s findings and recommendations as
to the maintenance of the system and the construction of additions,
extensions and improvements to the system and capital replacements
thereof.”
DC Water retained Johnson, Mirmiran & Thompson, Inc. (JMT) of Hunt Valley, MD to conduct the
Independent Consulting Engineer Assessment. The previous Independent Consulting Engineer
Assessment was prepared by JMT in 2013 (the "2013 Assessment"). This five-year recurring audit of the
current state of facilities and DC Water’s initiatives is executed to comply with the Master Indenture of Trust
(quoted above). This report contains a summary of findings and subsequent recommendations. The
information contained within this report is effective as of this draft date of March 25, 2018.
1.2 SCOPE AND METHODOLOGY
This report summarizes the findings and assessments of the Independent Consulting Engineer based on
site inspections and interviews with key DC Water and Washington Aqueduct supervisory staff and
members of the Program Management Team. Inspections and interview questions focused on the following
topics related to water, wastewater and stormwater treatment and conveyance assets:
• Physical condition of assets • Current and future capital programs
• Governance and management processes • Operations and Maintenance
• Site assessment of construction activities
for capital projects
• Cost and schedule performance of
construction activities for capital projects
• Safety programs and risk management • Consent decree and permit compliance
In addition to site visits and staff interviews, JMT also reviewed documents and reports prepared by DC
Water staff, Washington Aqueduct staff or consultants retained by either agency. Additional reports and
memoranda from agencies responsible for the Potomac River were instrumental in assessing the viability
of the river as a dependable source of water. A comprehensive list of the documents reviewed is listed in
the Bibliography attached to the end of this report. A few key reports include:

Page 6 of 110 | Introduction
INDEPENDENT ENGINEERING INSPECTION OF THE DC WATER WASTEWATER AND WATER SYSTEMS
• FY 2017-2026 Capital Improvement Program (CIP) - DC Water
• FY 2018 Operating and Capital Budgets
• D.C. Clean Rivers Biannual Status Reports
• FY 2018-2027 Capital Improvement Plan - Washington Aqueduct
• 2015 Water and Sewer System Facilities Plans (2015 Facilities Plan Updates)
• 2015 NPDES Permit (Permit # DC0021199)
• 2013 Independent Engineering Inspection (the 2013 Assessment)
• DC CLEAN RIVERS PROJECT: 2018 Anacostia River Tunnel System Overview
• Testimonies of General Manager to DC Council for Performance Oversight FY 2016 & FY 2017
JMT’s approach to the 2018 Independent Engineering Assessment (the 2018 Assessment) was methodical
with the intent to produce an independent assessment while incorporating key staff input. JMT conducted
independent research and prepared notes for each interview to minimize disruption. Detailed interview
notes were taken, and field observations were documented for inclusion in the report. JMT visited and
inspected many facilities as listed in this section. All safety measures were followed and the safety and
health measures at each facility were evaluated.
The 2018 Assessment contains performance observations based on the 2013 Assessment’s considerable
construction activities. The 2018 Assessment was conducted during a period in which DC Water has
undertaken innumerable projects and initiatives. The scope and ambition of these efforts are notable both
within the history of DC Water and within the overall water utility industry. During the intervening period,
comprehensive and aggressive construction activities continued to meet scheduled milestones for Consent
Decrees (CSO-LTCP & TN/WW) and NPDES permit requirements. While many construction projects were
commissioned in response to the mandates of regulatory orders, consent decrees, and permit
requirements, other organizational initiatives have been undertaken in the interest of increasing efficiency,
improving management and operations, and significant improvements in customer service.
Not all facilities were inspected; however, efforts have been made to ensure a significant and
representative sample of all operational facilities were observed during the inspections. JMT used
professional judgment to ascertain where inspections were required versus where document research and
interviews resulted in confidence in the condition of any other particular asset. All findings, conclusions and
recommendations take into account professional judgments regarding the implications for future system
performance and impacts on DC Water and Washington Aqueduct stakeholders.
A critical aspect part of JMT’s information gathering process involved interviews with key DC Water and
Washington Aqueduct Staff, as listed in Exhibit 1-1. JMT also attended a DC Water Board of Directors
meeting to obtain key information about the organization’s capital programs and operations.

Page 7 of 110 | Introduction
INDEPENDENT ENGINEERING INSPECTION OF THE DC WATER WASTEWATER AND WATER SYSTEMS
Exhibit 1-1: Summary of Interviews with DC Water and Washington Aqueduct Staff
Interviewee Department/Title Interviewee Name(s)
Chief Engineer Leonard Benson, Craig Fricke
Engineering & Technical Services Leonard Benson, Craig Fricke, and William
Elledge
Wastewater Engineering Diala Dandach
Wastewater Treatment, Blue Plains
Advanced Wastewater Treatment Plant
and Treatment Technologies
Aklile Tesfaye (Assistant General Manager,
Blue Plains), Christine deBarbadillo, Salil
Kharkar, and Wendell Smith
DC Clean Rivers Project Carlton Ray (Director), Bethany Bezak,
Moussa Wone, Brandon Flora
Assistant General Manager Customer
Care & Operations
Charles Kiely
Director Utility Services - Sewer Cuthbert Braveboy, Dunbar Regis, Sigrun
Sharp
Director Utility Services - Water Jason Hughes
Director Distribution and Conveyance
Systems
Chuck Sweeney
Manager Linear Asset Management Nichol Sowell
Finance and Budget Syed Khalil, Suzette Stona
Washington Aqueduct Thomas Jacobus (General Manager) and
Leo Nolan
Washington Aqueduct
Planning & Engineering Branch
Nathan Cole (Chief)
DC Water Board of Directors - Meeting
of the Environmental Quality &
Operations Committee - 1/18/18
DC Water Board of Directors Committee
members
JMT conducted site visits and performed inspections on major facilities that were made accessible to its
staff. Where applicable, unanticipated site conditions and cost/schedule impacts described during
interviews were recorded, along with the existence of applicable recovery schedules. For work sites where
some construction activities were taking place, JMT focused attention on reviewing construction progress
and comparing that progress to contract documents. For sites not undergoing construction activities, the
focus of JMT facility inspections was on conformance to industry standards, applicable codes, and safety.
Photographs were taken at most of the sites to document the visits and conditions inspected; however,
JMT was sensitive to security concerns. Site visits conducted are listed in Exhibit 1-2.

Page 8 of 110 | Introduction
INDEPENDENT ENGINEERING INSPECTION OF THE DC WATER WASTEWATER AND WATER SYSTEMS
Exhibit 1-2: DC Water and Washington Aqueduct Facilities Visited and Inspected
Facilities Inspected
• Blue Plains Advanced Wastewater Treatment Plant (Blue Plains)
• Blue Plains Tunnel Dewatering Pumping Station (TDPS) <<
• Blue Plains Control Center & Process Control System
• Northeast Boundary Tunnel (NEBT) << North Shaft
• O Street Wastewater Pumping Station • CSO 019
• Main Wastewater Pumping Station • CSO-017 & M Street Diversion
• Bryant Street Water Pumping Station • CSOs 015 & 016
• Dalecarlia Water Treatment Plant • CSO 005 & CSO 007 <<
• Dalecarlia Residuals/Solids Recovery Facility
• Main Outfall Sewer Diversion Facility <<
• Dalecarlia Water Treatment Plant • Main Pumping Station Drop Shaft <<
• Dalecarlia Pumping Station • CSOs 009, 0010, 011, 011a (B St./New Jersey Avenue) <<
• Blue Plains Tunnel • CSO 012 Tiber Creek
• McMillan Water Treatment Plant • Enhanced Clarification Facility (ECF) <<
• Fleet Maintenance Shop • CSO-018 Diversion Facility <<
• Poplar Point Pumping Station (New) << • First Street Tunnel and Temporary Pumping Station
• Fort Reno Water Pumping Station • Fort Reno Elevated Tank #2 (out of service)
• Fort Reno Reservoir • Eastside Wastewater Pumping Station
• Potomac Wastewater Pumping Station • Swirl Facility
• Sewer Services Operation Building • Tingey Street Diversion Facilities
Note: “<<” Indicates facility is Under Construction

Page 9 of 110 | Introduction
INDEPENDENT ENGINEERING INSPECTION OF THE DC WATER WASTEWATER AND WATER SYSTEMS
1.3 JOHNSON, MIRMIRAN & THOMPSON, INC.
QUALIFICATIONS
For more than 45 years, Johnson, Mirmiran & Thompson, Inc. (JMT) has provided quality engineering
services to clients in the Mid-Atlantic region and has served federal agencies throughout various states.
JMT is a full service, multi-disciplined consulting firm and performs as program managers for many
agencies, including water and sewer agencies, airports, state agencies, educational institutions, and
transportation authorities. JMT is staffed by practicing engineers of all major disciplines and retains former
public officials and academics in order to provide broad experience and skill sets to our clients and to the
public served by our clients.
1.4 A NOTE OF THANKS
The JMT team wishes to express its appreciation to the DC Water managers and staff who graciously took
the time to discuss DC Water’s achievements over the past five years while also conveying their
professional pride and enthusiasm in the organization and its mission. The interviewers also wish to thank
the Washington Aqueduct managers for their collaboration with JMT as we reviewed the Aqueduct’s
achievements over this reporting period.

Page 10 of 110 | DC Water Overview
INDEPENDENT ENGINEERING INSPECTION OF THE DC WATER WASTEWATER AND WATER SYSTEMS
SECTION 2 DC WATER OVERVIEW
2.1 VISION, VALUES, AND MISSION, AND CRITICAL
SUCCESS FACTORS
As part of these assessments, JMT has reviewed DC Water’s vision, mission, goals, objectives, initiatives
values, and critical success factors. The DC Water Board of Directors adopted the Vision, Mission, Values
and Critical Success Factors on July 3, 2008. The Blue Horizon 2020 Strategic Plan (adopted in March
2013 and revised in 2015) updated the statements as presented below. This 2018 Assessment was
performed with mindfulness of how DC Water’s staff incorporates its vision, values, and mission into their
roles and daily responsibilities.
DC Water’s Vision
To be a world-class water utility.
DC Water’s Values
Respectful – Serve with a positive attitude, courtesy, and respect that engender collaboration and trust.
Ethical – Maintain high ethical standards, accountability, and honesty as we advance the greater good.
Vigilant – Attend to public health, the environment, quality, efficiency, and sustainability of our enterprise.
Accountable – Address challenges promptly, implement effective solutions, and provide excellent service
as a committed team.
DC Water’s Mission
Exceed expectations by providing high quality water services in a safe, environmentally friendly, and efficient manner.

Page 11 of 110 | DC Water Overview
INDEPENDENT ENGINEERING INSPECTION OF THE DC WATER WASTEWATER AND WATER SYSTEMS
Focus Areas
Leadership – DC Water will advocate and lead local, regional, and national collaborations, while internally
developing the workforce of the future.
Value – DC Water will be recognized for the value it delivers by protecting public health and the
environment, supporting community sustainability, and providing for economic vitality.
Innovation – DC Water will achieve international prominence in development and
adoption of science, technology and processes in support of a culture of innovation.
DC Water’s Goals
1. Develop, Maintain, and Recruit a High Performing Workforce 2. Collaborate Locally, Regionally, Nationally, and Internationally 3. Increase Board Focus on Strategic Direction 4. Enhance Customer and Public Confidence, Communications, and Perception 5. Promote Financial Sustainability, Integrity, and Responsible Resource Allocation 6. Assure Safety and Security 7. Maximize Water Quality Treatment, Compliance, and Efficiency 8. Optimally Manage Infrastructure 9. Enhance Operating Excellence through Innovation, Sustainability, and Adoption of Best Practices
Each strategic goal also provides specific objectives and initiatives that enable the achievement of the goal.
2.2 GOVERNANCE AND ORGANIZATION
2.2.1 GOVERNANCE
DC Water’s 22-Member Board of Directors establishes policies and guides the strategic planning process.
DC Water is governed by a Board of Directors consisting of 11 principal and 11 alternate members, each
appointed for a staggered four-year term. Six principal members (appointed by the Mayor of the District of
Columbia – the District – with the advice and consent of the District Council) represent the District and five
principal members (appointed by the Mayor on recommendations of the wholesale customers) represent
the wholesale customers, two each from Prince George’s and Montgomery Counties (jurisdiction of
Washington Suburban Sanitary Commission - WSSC) in Maryland, and one from Fairfax County, Virginia.
The powers of DC Water are vested in and exercised by the Board at meetings duly called and held where
a quorum of at least six members is present. All Board members participate in decisions directly affecting
the management of joint-use facilities which are those facilities used by all three jurisdictions. Only the
District members participate in those matters that affect District ratepayers and in setting fees for services
that affect only District residents. The Board meets monthly and operates through various committees. The
standing committees include Finance and Budget, District of Columbia Retail Water and Sewer Rates,

Page 12 of 110 | DC Water Overview
INDEPENDENT ENGINEERING INSPECTION OF THE DC WATER WASTEWATER AND WATER SYSTEMS
Environmental Quality and Operations, Human Resource and Labor Relations, Audit, Governance, and
Strategic Planning. Additional standing or ad-hoc committees may also be formed to serve specific
functions not served by the standing committees
Article 3.01 of the DC Water Board of Director’s By-Laws defines what a “meeting” is and how meetings
are to be conducted in relation to the public. All meetings are open to the public and the news media.
Meetings are required to be documented by transcription and/or by electronic recording devices, as well as
video, and those documents shall be made available to the general public. Article 4.01 of the DC Water
Board of Director’s By-Laws defines the officers of the Board, their duties, term in office and resignation
and removal of officers. The selected Chairperson’s duties include: calling emergency meetings,
determining agenda, presiding over meetings, establishing Committees and appointing members to
Committees. A nominating committee elected Vice-Chairperson has the authority to execute the duties of
the Chairperson in their absence.
Article 5.01 of the DC Water Board of Director’s Bylaws establishes standing Committees of the Board.
There are seven standing Committees of the Board:
• Finance and Budget Committee • District of Columbia Retail Water and Sewer Rates Committee
• Environmental Quality and Operations Committee
• Human Resources and Labor Relations Committee
• Audit Committee • Governance Committee
• Strategic Planning Committee
The Board of Directors can create additional Committees as it deems necessary; the principal duty of any
Committee shall be to recommend proposed action to the Board of Directors.
Article 6.01 of the DC Water Board of Director’s Bylaws gives the Board the authority to hire a General
Manager who will be the chief administrative officer of DC Water. The General Manager candidate requires
the affirmative vote of eight voting members to become the DC Water General Manager. The General
Manager has supervisory and management responsibilities concerning DC Water’s business, affairs,
agents and employees. The General Manager can be removed from his/her position by eight affirmative
votes from the Board.
A representative from JMT attended the DC Water Board of Director's Environmental Quality and
Operations Committee Meeting on January 18, 2018. The Committee members viewed presentations by
some of DC Water’s key managers who reported on the proposed FY 2018 - 2027 Capital Budget. The
following are key topics that were covered in that presentation.
• 10-year CIP recommendations
• Funding level scenarios to provide baseline, or enhanced levels of service
• Needed capital improvements to maintain the system over the long-term
• Assessments of the adequacy of funding levels for various operational lines of service
• The risks of underfunding capital improvements in sanitary sewer due to regulatory requirements in other areas

Page 13 of 110 | DC Water Overview
INDEPENDENT ENGINEERING INSPECTION OF THE DC WATER WASTEWATER AND WATER SYSTEMS
• Projections of future needs in sanitary sewer CIP based on asset management principles
In the assessor’s professional opinion, the meeting observed on January 18, 2018 was indicative of a well-
run and professional organization. Committee members considerately engaged in discussion with the DC
Water managers to ensure proper understanding of the budget cases presented. The DC Water managers
presented budget cases founded on sound engineering principles and modern industry practices. DC
Water ensures organizational transparency by making meeting schedules and materials available online
and making meetings accessible to the public. The new Administrative Headquarters (HQO) will make
meetings even more accessible to the public.
The Committee members showed a high level of engagement and concern in the success of DC Water
operations. Examples of these assertions for the January 18, 2018 meeting are outlined below:
• The meeting was easily accessible to the general public. The schedule and agenda were readily available online through the DC Water website, an indication of organizational transparency.
• The board members appeared attentive to steering the management of the utility. Board members were knowledgeable about the current policies and practices engaged in by the utility in managing its infrastructure.
• Although the Committee generally declined to approve increased funding for Capital improvements proposed by DC Water’s management, reasoning was sound, citing the cost of service and affordability to customers, particularly those within the District’s lower income brackets.
• The Committee was not dismissive of the case presented by DC Water’s management. They requested the management team to re-evaluate the proposed methods of funding for needed improvements and provide an assessment of whether those improvements can be funded through other means. The apparent intent was to fund needed improvements in future budgets while also ensuring that persistent rate increases are not considered a primary means of funding improvements unless necessary.
The January 18, 2018 Committee meeting is viewed as representative of previous meetings based upon
JMT attendance at other meetings, review of earlier meeting handouts and minutes, and feedback from DC
Water staff during interviews.
2.2.2 ORGANIZATION DC Water’s current organizational chart is shown as Exhibit 2-1. The organization continues to evolve as
DC Water conducts internal analysis and studies that identify opportunities to improve effectiveness and
reduce costs.

Page 14 of 110 | DC Water Overview
INDEPENDENT ENGINEERING INSPECTION OF THE DC WATER WASTEWATER AND WATER SYSTEMS
Exhibit 2-1: DC Water Organizational Chart
AGM, Customer Care &
Operations
Water Quality &
Technology
Distribution and
Conveyance Systems
Utility Services - Water
Board of Directors Secretary to the Board
Internal Audit
(Outsourced)CEO/General ManagerGeneral Counsel
Customer Services
Emergency
Management Chief
Utility Services - Sewer
AGM, Blue Plains
Wastewater Treatment
Operations
Process Engineering
Maintenance Services
Resource Recovery
Clean Water Quality &
Technology
Chief Engineer
Engineering &
Technical Services
Clean Rivers
Permit Operations
Wastewater
Engineering
Chief Financial Officer
Finance
Accounting
Budget
Rates and Revenue
Chief of Staff
Human Capital
Management
Energy Chief
Strategic Planning
Officer
Sustainability Chief
Chief of External
Affairs
Chief Procurement
OfficerChief Marketing Officer Chief Operating Officer
Innovation ChiefChief Information
Officer
Information
Technoloogy
AGM, Support Services
Fleet Management
Facilities Management
Security
Occupational Safety &
Health
At the end of FY 2016, DC Water had 1,121 filled positions out of an authorized total of 1,260. Over the
long term, the authorized staffing level is a reduction of 20% from 1,508 positions authorized in FY 1998.
Since the 2013 Assessment, however, authorized staffing levels at DC Water remained constant. There
are 1,260 positions approved for FY 2018, the same number of positions in 2013. The actual staffing level
increased through the filling of vacant positions, with 1,121 positions filled at the close of FY 2016 (per the
Approved FY 2018 Budget.) During interviews with engineering and operational managers, the interviewers
found a considerable amount of analysis being performed to balance in-house workloads and outsourcing
engineering and contractual services.
The increased staffing from 2013 levels addresses service to customers and operational quality as defined
by the Critical Success Factors, thereby elevating services since the 2013 Assessment. In fact, customer
service capabilities were a topic of pride with the interviewed managers and staff. The morale of
interviewed staff and encountered personnel is, in the opinion of JMT, above the levels in evidence in many
of the other public agencies studied or observed. During the intervening years between the 2013
assessment and this 2018 assessment, gains have been achieved in the public and employee branding for

Page 15 of 110 | DC Water Overview
INDEPENDENT ENGINEERING INSPECTION OF THE DC WATER WASTEWATER AND WATER SYSTEMS
DC Water. Later in this report, Asset Management cooperation between departments will substantiate this
identity of DC Water.
DC Water provides its employees with comprehensive fringe benefit packages, including coverage for:
health insurance, group term life insurance, dental care, vision care, disabilities and retirement plans. It
also has undertaken efforts to provide staff with modern office spaces that reflect the importance of their
day-to-day missions.
2.3 MANAGEMENT AND OPERATIONS
The Board and General Manager are actively involved in the operation and management of DC Water.
Through interviews, executive and senior managers indicated that they are provided with the tools and
resources to fulfill DC Water’s mission. Staffing levels, facilities, budgets, and schedules are adequately
vetted and planned. Training initiatives were apparent during this review period. The level of
communications is well-documented. The DC Water website ensures transparency and is a source of pride
within the engineering and operations staff. Knowledge and direction of current activities were expressed
by interviewed managers, indicating that all sections had an understanding and agreement with the overall
focus and status of DC Water efforts and successes.
Through the course of this assessment, the JMT team met with numerous managers within the
organization. During these interviews, it was apparent that during the past five years, significant
reorganization and optimization efforts have been undertaken in the operations of the utility. These efforts
appear, in the opinion of the assessors, to be successful in creating operational improvements where
needed. The concentration of technical expertise in wastewater facilities engineering, and in operation of
distribution and conveyance systems are cited as examples of continual improvement toward operational
excellence. Clustering linear assets within one engineering team and grouping the ‘vertical’ assets into
another team follows industry trends as buried infrastructure and building components and systems are two
distinct engineering disciplines. Development of a centralized asset management strategy and
decentralized implementation programs at the appropriate operational areas are also cited as evidence of
continued improvement efforts.
In addition to management and organizational initiatives, DC Water has actively sought and implemented
cutting-edge technology improvements across the full spectrum of its operations. At all levels of the utility,
DC Water staff are equipped with industry standard or better technology to achieve their mission. Funding
of training, research and development, and technical paper presentations have placed DC Water in the
vanguard of agencies employing emerging technologies and cost-saving efficiencies.
2.3.1 BUDGETING
Each fiscal year, DC Water produces an annual operating budget and a 10-year CIP. Both documents are
subject to public review and comment prior to their approval by the Board of Directors. DC Water’s financial
management system monitors spending to prevent unauthorized expenditures. The Department of

Page 16 of 110 | DC Water Overview
INDEPENDENT ENGINEERING INSPECTION OF THE DC WATER WASTEWATER AND WATER SYSTEMS
Finance, Accounting and Budget prepares reports that are reviewed monthly to ensure compliance with
authorized budgets.
Since its creation in 1996, DC Water’s Board has adopted policies that support financial planning and
promote reliable revenue forecasting. Given the agency’s substantial borrowing needs to support its capital
projects and large-scale investment, DC Water's continuing adherence to these policies supports its ability
to cost-effectively access the capital markets and retain credibility with customers and regulators.
DC Water maintains financial practices and policies that are intended to maintain a high-quality investment-
grade bond rating to ensure the lowest practical cost of debt necessary to finance DC Water’s long-term
capital program. The current financial policies set by the Board through resolution 13-57 are summarized
below.
• DC Water maintains strong levels of operating cash reserves, equivalent to 120 days of budgeted operations and maintenance costs, $125.5 million or greater in operating reserves. o The annual reserve amount is formally approved by the Board as part of its annual
approval of the operating and capital budgets. o The operating reserve requirement is re-evaluated every five years by DC Water’s
independent rate consultant in conjunction with the Indenture-required system assessment.
• The operating reserve will, at a minimum, include any reserve requirements contained in the Indenture, excluding any debt service reserve funds and the rate stabilization fund as follows. o Operating reserve – equivalent to 60 days’ operating costs. o Renewal & replacement reserve – $35 million. This reserve requirement will also be
evaluated every five years by the independent rate consultant in conjunction with the Indenture-required system assessment.
• DC Water establishes strong debt service coverage in excess of the requirements that are stated in the Indenture.
• DC Water uses operating cash exceeding the reserve requirements, along with any significant one-time cash infusions for capital financing or for repayment of higher cost debt.
• Whenever possible, DC Water uses the least costly type of financing for capital projects, based on careful evaluation of DC Water’s capital and operating requirements and financial position for each year.
• DC Water attempts to match the period of debt repayment, in total, with the service life of each of the assets financed by any such debt.
• DC Water finances its capital equipment needs with operating cash or short-term financing instruments with the same or shorter lives as the related assets. DC Water issues commercial paper notes, classified as subordinate debt under the Indenture, as a solution for its short-term financing needs.
• Over the past five years, DC Water has proven innovative through its bond offerings. In 2014, DC Water issued its inaugural “green bond” to investors in funding a portion of the DC Clean Rivers Project. This $350 million issuance marked the first green bond issued in the United States to be supported by an independent “Second Party Opinion” and the first 100-year “Century” bond issued by a municipal water utility. Three such bonds have been issued to date in support of the environmental mission of the Clean Rivers Project.
• DC Water continues pioneering project financing through green bonds, century bonds, and recently introduced the nation’s first Environmental Impact Bond (EIB). The EIB’s return rate

Page 17 of 110 | DC Water Overview
INDEPENDENT ENGINEERING INSPECTION OF THE DC WATER WASTEWATER AND WATER SYSTEMS
is tied to project performance, specifically, the effectiveness of green infrastructure in its management of stormwater.
During FY 2016, Standard and Poor’s Investors Service (S&P), for the first time in history, upgraded DC Water’s credit rating to “AAA” for senior lien revenue bonds. The “AAA” rating is the highest rating issued by the rating agency. Subsequently, Moody’s Investor Services upgraded DC Water’s credit rating to “Aa1” for senior lien revenue bonds. Additionally, the green bonds are assessed at “GB1” by Moody’s.
The DC Water Board of Directors strives to meet the following goals in its retail rate setting. The following
are guiding principles to the rate setting process.
• Rates that, together with other revenue sources, cover current costs and meet or exceed all bond and other financial requirements.
• Rates that yield a reliable and predictable stream of revenues.
• Rates based on annually updated forecasts of operating and capital budgets.
• Rates structures that are legally defensible.
• Rates structures that customers can understand.
• Rate increases, if required, that are implemented transparently and predictably.
• To the extent annual revenues exceed costs, the Board will utilize available options to mitigate future customer impacts and annual rate increases, including transferring excess funds to the Rate Stabilization Fund.
2.3.2 FACILITIES PLANNING AND CAPITAL PROGRAMMING
DC Water is required by enabling legislation to adopt and submit a financial plan incorporating operating
and capital costs with a minimum period of five-years. DC Water continues to surpass that requirement by
annually adopting a ten-year Financial Plan and Capital Improvement Program that manages the capital
investments necessary to fulfill its mission, to comply with regulatory requirements and to preserve its
infrastructure.
DC Water’s adopted FY 2017 – FY 2026 CIP is budgeted for $3.75 billion for the 10-year period. At this
writing, full details of the FY2018 – FY 2027 CIP were not yet available, but summary documents show this
budget will increase over the previous 10-year rolling budget to $4.00 billion. This budget includes
disbursements for improvements to the Blue Plains Advanced Wastewater Treatment Plant (Blue Plains),
combined sewer overflow system, sanitary sewer and stormwater collection systems, water pumping and
distribution system, capital equipment and the Washington Aqueduct. The distribution of the 10-year CIP is
shown in Exhibit 2-2 below.

Page 18 of 110 | DC Water Overview
INDEPENDENT ENGINEERING INSPECTION OF THE DC WATER WASTEWATER AND WATER SYSTEMS
Exhibit 2-2: FY 2018 – FY 2027 Capital Improvement Program ($ in 000’s)
DC Water develops and prioritizes capital projects based on a specific set of criteria and requirements:
• Court Ordered, Stipulated Agreements, etc. – Projects that are undertaken to comply with court
orders, stipulated agreements, regulatory requirements and requirements of Authority’s the National
Pollution Discharge Elimination System (NPDES) permits.
• Health and Safety – Projects that are required to eliminate or mitigate impacts on public health or
safety and/or to ensure compliance with NPDES permit requirements.
• Board Policy, DC Water’s Commitments to Outside Agencies – Projects resulting from
policies/resolutions of the Board and outside agency commitments.
• Potential Failure, Ability to Continue Meeting Permit Requirements – Projects undertaken to
construct/rehabilitate facilities and/or equipment in danger of failing and thus endangering the ability
to continue meeting permit requirements.
• High Profile, Good Neighbor Policy – Projects undertaken to address concerns expressed by
public officials or citizens.
• Good Engineering, High Payback, Mission/Function – Projects that are needed for
rehabilitation/upgrade of facilities and infrastructure that are mission critical, projects that resolve
operational issues and inefficiencies that result in operational and maintenance cost savings.
• Good Engineering, Low Mission/Function over Long-term – Projects that are needed for
rehabilitation/upgrade of facilities and infrastructure but are lower priority.
Wastewater Treatment
22%
Combined Sewer
Overflow37%
Stormwater0%
Sanitary Sewer14%
Water19%
Capital Equipment5%
Washington Aqueduct3%
FY2018 - FY2027$4.0 Billion 10-year Disbursement Plan
Wastewater Treatment Combined Sewer Overflow Stormwater Sanitary Sewer
Water Capital Equipment Washington Aqueduct

Page 19 of 110 | DC Water Overview
INDEPENDENT ENGINEERING INSPECTION OF THE DC WATER WASTEWATER AND WATER SYSTEMS
2.3.3 PROJECT DELIVERY
DC Water relies on its Department of Engineering and Technical Services (DETS), Wastewater
Engineering, and DC Clean Rivers Project (DCCR or Clean Rivers) to plan and execute its major capital
projects. Additional project delivery is performed by DC Water groups such as Water Services, Sewer
Services, Information Technology, Facilities, and Customer Services. Financial expectations and limitations
for CIP projects are provided by the GM and the CFO.
The program management consultants, under various Engineering Program Management Consultant
(EPMC) contracts and DCCR’s Program Consultants Organization (PCO), have been very effective in
managing and delivering a structured approach to capital improvements. As specifically presented in
Section 5, DC Clean Rivers, the integration of DC Water staff and PCO engineers are managing an
extraordinary program that is complex with construction sites in various areas of DC performing under a
stipulated schedule. Section 4.3, Blue Plains Advanced Wastewater Treatment Plant, is also evidence that
Project Delivery is very effective at DC Water. EPMCs for linear and vertical assets are also evolving as
DETS and Wastewater Engineering look to increase efficiencies between staff and consultant services.
2.4 GENERAL CONCLUSIONS REGARDING DC WATER’S
STRUCTURE, ORGANIZATION, AND MANAGEMENT
A conclusion of this review is that considerable progress has been made by DC Water since the 2013
Assessment in meeting the needs and goals of the organization, stakeholders, regulators and the
environment. During the intervening period, DC Water’s management was stable, although retirements and
staff turnover typical of this type of organization did occur at key positions. Transitions provided
opportunities to reenergize staff in the mission and the core values of DC Water. The general tone during
interviews, inspections and public meetings was positive with energy of dedication toward the mission of
being a world-class water utility.
Overall, the independently operating agency is structured to be responsive in providing retail service to the
District of Columbia and its residents, along with providing regional wholesale wastewater service. DC
Water’s governance and organization give voice and decision-making participation for the wholesale
customers that are comprised of the surrounding Maryland and Northern Virginia counties and
municipalities.
The previous assessment performed in 2013 reported on improvements and efficiencies in organizational
structure and command-chain communications. This optimization has continued through the current
assessment period with several reorganizations and optimizations to the managerial and reporting
structures within the organization. The effect of these reorganizations is clear. There are new divisions of
responsibilities in the engineering and operations of the facilities and assets of the utility. For example, a
section of the DETS has been subdivided creating the aforementioned Wastewater Engineering.

Page 20 of 110 | DC Water Overview
INDEPENDENT ENGINEERING INSPECTION OF THE DC WATER WASTEWATER AND WATER SYSTEMS
This initiative is ongoing, but the intent communicated during interviews by the management team is that
this new division will be defined as responsible for the engineering, planning, and management of DC
Water’s vertical wastewater infrastructure, treatment and pumping facilities. The existing DETS maintains
the responsibility of similar functions for linear infrastructure, distribution and collections systems. A similar
reorganization also occurred in the utility’s operations, where a new Distribution and Conveyance Systems
division was created for the operations and maintenance of the critical infrastructure that distributes water
to the distribution system and conveys sewage from the collections system to treatment. Utility services
(water and sewer) remain but are now more clearly focused on the distribution and collections systems.
This results in engineering and operational units being aligned by linear and vertical assets delineation.
2.5 FINDINGS, KEY INITIATIVES & ACCOMPLISHMENTS
Section 2.5 presents findings of the independent review and also highlights some of DC Water’s key
initiatives and accomplishments.
2.5.1 CAPITAL PLANNING AND PROJECT IMPLEMENTATION
DC Water’s capital planning process is comprehensive, aggressive, and encourages public participation.
The CIP is in accord with the needs of an aging system operating in the context of increasingly more
stringent environmental regulations. The CIP planning process allows for status monitoring and
reassessment of priorities and funding needs on an annual basis and the flexibility to reprogram projects so
that if new needs arise, DC Water can consider rescheduling non-mandated initiatives in order to
accommodate more urgent needs. DC Water has relied on consultants, working closely with in-house staff,
to ensure successful implementation of capital improvement projects.
2.5.2 PERMIT COMPLIANCE
Both Washington Aqueduct and DC Water continue to meet the various permit requirements established
for the drinking water and wastewater systems. Conformance to NPDES permit conditions has been well
documented and DC Water has been recognized by the wastewater profession for uninterrupted
compliance of standards at Blue Plains
2.5.3 WATER SUPPLY/TREATMENT
The Washington Aqueduct Division continues to provide safe and dependable drinking water to the DC
Metro Area. The advanced water treatment initiatives being undertaken address emerging contaminants
that could threaten public water supplies.

Page 21 of 110 | DC Water Overview
INDEPENDENT ENGINEERING INSPECTION OF THE DC WATER WASTEWATER AND WATER SYSTEMS
2.5.4 TOTAL NITROGEN REMOVAL AND WET WEATHER PLAN
The successful modification of the Consent Decree has allowed DC Water to integrate the Combined
Sewer Overflow -Long Term Control Plan (CSO-LTCP) with the enhanced nutrient removal advancements
at Blue Plains to incorporate the Total Nitrogen/Wet Weather (TN/WW) Plan capabilities to address the
stipulations within the modified Consent Decree.
2.5.5 COMBINED SEWER OVERFLOW – LONG TERM CONTROL
PLAN
The DC Clean Rivers Project has accomplished the significant milestone of having the lower portion of the
Anacostia River Tunnel facilities commissioned by March 23, 2018. The reduced nutrient loading and
pollution abatement achieved is discussed in Section 5 of this report.
In 2017, DC Water let the largest project in its history for the Northeast Boundary Tunnel (NEBT)
design/build effort. DCCR during the past five years has met the schedule requirements of the modified
Consent Decree. ENR and biosolids improvements at Blue Plains are well coordinated with the TN/WW
Plan as construction activities continue within the limited footprint of Blue Plains. It is the opinion of JMT
that the capital improvement planning being managed by DC Clean Rivers Project exceeds typical
approaches for consent decree programs as highlighted by the innovative and successful Green Initiatives
that have eliminated the Rock Creek Tunnel and reduced the diameter of the future Potomac River Tunnel.
2.5.6 INVENTORY MANAGEMENT
A new inventory warehouse has been completed at Blue Plains. What’s unique about this facility is that it is
smaller than its predecessor. DC Water implemented a just-in-time (JIT) equipment replacement part
program that uses a computerized system to track parts inventories and order the parts in time for
scheduled replacement. Inventory management is also present at other DC Water facilities; decentralized
inventory distributes specific equipment and repair parts to end users more efficiently than one warehouse
remote to urban facilities.
2.5.7 ASSET MANAGEMENT
DC Water has prioritized establishing best management practices of its assets with the goal to maximize
service life while minimizing costs and ensuring sustainability. Asset management includes: managing
inventories of assets with supporting data that can be used to prioritize maintenance; used to prioritize
capital projects; and assist long range decision making and financial planning. The program is established
with a goal of creating and implementing a “world class” asset management program. Achieving a world-
class asset management program means benchmarking DC Water’s current asset management program
with other cities known for their excellence in asset management.
DC Water launched initiatives to maximize the use of DC Water’s current information technology (IT) asset
tracking tools which include its Geographical Information Systems (GIS) and Maximo, a Computerized
Maintenance Management System or CMMS (originally used for treatment facilities). The program has

Page 22 of 110 | DC Water Overview
INDEPENDENT ENGINEERING INSPECTION OF THE DC WATER WASTEWATER AND WATER SYSTEMS
integrated stakeholders into the program and prioritized training to make the asset management program a
success. This program was initially assessed in the 2013 assessment as a new initiative. At the time of the
2018 assessment, significant progress was identified in the program through interviews with management.
A related system that was initially implemented during that time frame was the Engineering Document
Management System. This $2.4M project was originally proposed as a centralized electronic source for all
critical DC Water documents. It allows internal departments and consultants the ability to efficiently access
data and information thereby increasing the base of knowledge available and saving time formerly spent
searching for documentation.
2.5.8 CUSTOMER SERVICE
DC Water’s Automated Meter Reading system (AMR) is capable of providing customers with twice-a-day
readings. Along with the accuracy and dependability of monthly billing readings, this automated system is
effective in identifying leakage. Overall customer service has been emphasized as DC Water has
committed to being a leader and active participant in the community. This multi-year project will replace
90,000 meters by the end of FY 2018.
A significant accomplishment in improved customer service is the First Street Tunnel Design/Build project
within the Bloomingdale community. The Bloomingdale Community has been on DC Water’s priority list of
areas requiring significant combined sewer capacity improvements for many years and was included in the
upstream portions of the Combined Sewer Overflow - Long Term Control Plan (CSO-LTCP). 2012 storm
events exacerbated the flooding conditions.
Clean Rivers initially had relief coming to this neighborhood in 2025 via the First Street Tunnel as part of
the Northeast Boundary Tunnel portion of the Anacostia River Project. DC Water, the Mayor of the District
of Columbia and residents collaborated on expediting the project. DC Water pushed up the procurement of
the First Street Tunnel to 2013 and modified the tunnel design to include a temporary pump station that has
allowed the tunnel to act as storm surge storage. A fast-tracked design-build project also provided up to 6
million gallons of combined sewage storage by converting McMillan WTP underground sand filtration
basins into retention basins. Combined sewer flood relief for the neighborhood began in October 2016 - 9
years earlier than initially planned. Greater relief will be in 2022 which represents 3 years ahead of the
CSO-LTCP schedule.
2.5.9 INFORMATION TECHNOLOGY
The Department of Information Technology has made considerable progress in both internal and external
upgrades in providing informational services. Core infrastructure upgrades have been completed that
improve virtual machine capabilities and provide redundancy and additional bandwidth. Total Management
System (TEAMS-Maximo), a maintenance organization program, and Geographic Information Systems
(GIS) have been integrated and deployed at DC Water, improving management of maintenance and
repairs of equipment, buildings and grounds, and water/sewer infrastructure. Automated meter reading
(AMR) systems have been upgraded to provide second generation Data Collector Units (DCUs), providing
new user interfaces and valuable control and monitoring features. The Livelink Enterprise Document

Page 23 of 110 | DC Water Overview
INDEPENDENT ENGINEERING INSPECTION OF THE DC WATER WASTEWATER AND WATER SYSTEMS
Management System has been deployed, improving the availability and management of DC Water
documents and files.
2.5.10 MAINTENANCE OF INFRASTRUCTURE
DC Water has established a 1% per annum replacement goal for aging infrastructure. This corresponds
with the expected 100-year life of pipelines. This has required an increase in engineering design/inspection
staff and funding for operations staff to complete repairs and replacement of water and sewer
infrastructure. The Department of Engineering and Technical Services (DETS) has transferred water main
replacement designs from design consultants to in-house engineering. The 1% replacement metric of ten
miles per year is being achieved by in-house staff. DC Water improvements have an increased presence in
neighborhoods where ratepayer funds are in evidence as water and sewer mains are being replaced in
order to meet the 1% goal. The collection system improvement program has shifted from area-wide small
gravity sewer replacement to the asset management driven plan of programmed replacement based on
failure/inflow-infiltration/back-up criteria for specific pipe segments.
2.5.11 FIRE HYDRANT REPLACEMENT PROGRAM
As described in Section 3.6.5.3.2, Fire Hydrants, the replacement and repair of fire hydrants has been
transferred from construction contract work force to in-house force account work performed by Water Utility
Services. The Director of Water Utility Services reports that the goal of 500 replacements per year was
achieved in 2017. Through a Memorandum of Understanding, DC Water is reimbursed by the District and
the program does not impact ratepayers.
2.5.12 INFRASTRUCTURE LEAK INDEX Since 2008, DC Water’s sold/pumped ratio has fluctuated from 77% to a 2015 low of 70%. The internal
audit of DC Water’s infrastructure found an Infrastructure Leakage Index (ILI) Value of 7.49 for 2014, to a
high ILI of 9.94 reported in 2015. The relatively high ILI without a corresponding gradual reduction through
the years is not within EPA’s Best Practices for Sustainable Water Conservation and Efficiency. The non-
revenue water percentage has remained around 25%, which is typical of older, urban water systems. The
ILI value reported for 2016 of 7.84 is typical of older distributions systems located in water rich areas in the
US and puts DC Water’s distribution system in the category of relatively efficient. The sold/pumped ratio
between 2008 and 2017 is shown in Exhibit 2-3.

Page 24 of 110 | DC Water Overview
INDEPENDENT ENGINEERING INSPECTION OF THE DC WATER WASTEWATER AND WATER SYSTEMS
Exhibit 2-3: DC Water Sold/Pumped Ratio
2.5.13 BIOSOLIDS MANAGEMENT PLAN
The operational Walter F. Bailey Bioenergy Facility greatly reduces Blue Plains’ energy footprint. This plan
involved the construction of four Cambi thermal hydrolysis trains and digesters, new dewatering equipment
and a combined heat and power plant. These projects were commissioned in late 2015 and improved the
biosolids quality to Grade A while reducing solids volume and producing electricity. The reduced volume
also reduces hauling costs. Grade A quality biosolids provide more certainty to land-application locations.
Details for the BMP can be found in Section 4.3.6.1.4 Sludge Digestion Facilities. In summary, the digester
gas is used by Pepco Energy Services (onsite) to produce steam. The Combined Heat and Power Facility
has capacity to produce over 13 MW of gross electrical power at future solids throughput and the
corresponding digester gas production. The reduction in weight and volume of the biosolids significantly
reduces hauling costs. Class A Biosolids are marketed as Bloom®, a soil amendment, which recovers
solids handling costs through product sales. These performance and savings metrics are closely monitored
by DC Water.
2.5.14 DC WATER AWARDS
The following awards have been bestowed upon DC Water during the assessment period. These awards
are a testament to the ongoing achievements and commitment to excellence of the DC Water team in their
mission.
Award Title Awarding Organization Date(s) of Award
Distinguished Budget Presentation Award (Annual)
Government Finance Officers Association
FY2013 – FY2018 *

Page 25 of 110 | DC Water Overview
INDEPENDENT ENGINEERING INSPECTION OF THE DC WATER WASTEWATER AND WATER SYSTEMS
Award Title Awarding Organization Date(s) of Award
Certificate of Achievement for Excellence in Financial Reporting
Government Finance Officers Association
FY2013 – FY2017 *
Project of the Year, 2016 - Blue Plains Tunnel Engineering News Record March 1, 2017
Water/Environment – Best Project: Blue Plains Tunnel
Engineering News Record - MidAtlantic
August 4, 2016
Award of Special Merit – Biosolids Main Process Train (CDM Smith)
International Federation of Consulting Engineers
October 2, 2017
ACEC Grand Award 2016 – Biosolids Management Program (CDM Smith)
American Council of Engineering Companies
April 19, 2016
Peak Platinum 5 Award – Blue Plains Wastewater Treatment Plant
National Association of Clean Water Agencies
2016
Peak Gold Award – Blue Plains Wastewater Treatment Plant
National Association of Clean Water Agencies
2015, 2014, 2013 *
Distinguished Service Award (Individual) – George S. Hawkins
National Association of Clean Water Agencies
2018
Environment Award (Individual) – Mark T. Kim
National Association of Clean Water Agencies
2017
Research and Technology Award – Mainstream Deammonification - A New "Blue-Print" for Cost Effective, Sustainable Nutrient Removal
National Association of Clean Water Agencies
2015
Operations & Environmental Performance Award – DC Water Ft. Reno Green Roof Project
National Association of Clean Water Agencies
2015
Public Information & Education Award – Building Public Support for Rate Increases Through Twitter
National Association of Clean Water Agencies
2016
Public Information & Education Award – Lady Bird as e-Ambassador
National Association of Clean Water Agencies
2016
Excellence in Management – Platinum Award National Association of Clean Water Agencies
2014
Edward J. Clearly Award – Sudhir Murthy, PhD, P.E.
American Academy of Environmental Engineers and Scientists (AAofEE&S)
2017
Honorary Member – George Hawkins AAofEE&S 2017
Juror’s Citation in Conceptual/Un-built Architecture - HQO
American Institute of Architects, NoVA Chapter
2017
Juror’s Citation in Conceptual/Un-built Architecture - HQO
American Institute of Architects, MD Chapter
2017
Utility of the Future WEF/WERF/NACWA/EPA 2017
Excellence in Concrete Construction – First Street Tunnel
National Capital Chapter American Concrete Institute
2017
* Exclusive of numerous awards received outside the period of this assessment

Page 26 of 110 | DC Water Overview
INDEPENDENT ENGINEERING INSPECTION OF THE DC WATER WASTEWATER AND WATER SYSTEMS
2.5.15 DC WATER TECHNICAL PAPERS
Engineers at Blue Plains are prolific in publishing their research, with more than 1,000 abstracts among
them in just the last 10 years. These technical papers have been presented at wastewater conferences
across the country touting Blue Plains’ implementation of advanced wastewater treatment processes.
2.5.16 DC WATER PATENTS
Over the past 5-years, DC Water has fostered a spirit of technological innovation. This is evident in patents
registered to the organization over this period. No less than eight patents, primarily for innovation in
wastewater treatment have been granted to DC Water since 2013. These patents are indicative of a high
performing organization that is attracting and furnishing some of the best engineering talent, putting them
to work solving modern water challenges.
2.6 RECOMMENDATIONS
2.6.1 ASSET MANAGEMENT
Great strides have been accomplished using IBM Maximo Asset Management for both linear and vertical
assets. Recommended actions:
• It is recommended that DC Water continue to pursue ‘front-end’ user interface upgrades to its EAM/CMMS software, Maximo, to increase ease of use and for staff, particularly in mobile applications for linear infrastructure. Some cited Maximo as designed primarily for facility-oriented applications such as, structural, mechanical, and control systems.
• DC Water should take advantage of the Department of Sewer Services’ production metrics regarding catch basin maintenance. DSS has pursued performance metrics showing deep catch basins and environmentally designed catch basins can be maintained more efficiently and environmentally effective by mechanical equipment (clamshells) vs. the more common industry use of vacuum and flushing equipment.
2.6.2 DESIGN ENGINEERING & PROGRAM MANAGEMENT
As the Facilities Plans mature and the Capital Improvements driven by regulation have been implemented,
continued consideration should be given to the ratio between in-house engineering expertise and
consultant services. Current conversions to in-house design and force account work indicate savings and
successful project completion can be obtained by DC Water employees.

Page 27 of 110 | DC Water Overview
INDEPENDENT ENGINEERING INSPECTION OF THE DC WATER WASTEWATER AND WATER SYSTEMS
2.6.3 UNACCOUNTABLE WATER
The three-year trend, 2015-2017, of water sold/pumped ratio below 75% is considered cautionary by the
American Water Works Association. DC Water should continue to identify water inefficiencies to target
those requiring corrective measures. Large metering is often a vector where losses can be eliminated, and
revenues increased. 2.6.4 DRINKING WATER MANAGEMENT
The 2013 Assessment recommended:
“DC Water could explore increasing its role in potable water treatment. Water
supply, water treatment and water distribution as a monolithic arrangement under a
single management and financing structure has proven to be effective throughout
the United States. JMT has not studied this in great detail; however, there may be
management and cost efficiencies that could be achieved to benefit both DC Water
and its rate payers. In addition, DC Water could have better control to expand its
water customer base and to be responsible for the quality of the potable water it
produces.”
In 2018, the uncertainty of the continued federal ownership of the Washington Aqueduct assets reinforces
the consideration of an accomplished organization such as DC Water to be the manager into perpetuity of
the Washington D.C. Metro area’s water treatment system. Being the agency responsible for regional
wastewater treatment at the world’s largest advanced wastewater treatment plant with a very successful
water quality compliance record, DC Water has the professional resources to meet the drinking water
needs for the DC Metro area. The success of Clean Rivers as a large public works tunneling organization
addresses the long-term need of the aging aqueduct and appurtenances starting at the Great Falls intake
structure.

Page 28 of 110 | Drinking Water Systems
INDEPENDENT ENGINEERING INSPECTION OF THE DC WATER WASTEWATER AND WATER SYSTEMS
SECTION 3 DRINKING WATER SYSTEMS
3.1 OVERVIEW
DC Water provides drinking water to the residents, businesses and institutional facilities within the
District of Columbia. DC Water is classified as a consecutive system. Consecutive systems obtain
finished or potable water from another water purveyor. DC Water conveys and distributes potable
water purchased from the Washington Aqueduct Division (the Aqueduct), which is chartered to treat
Potomac River water for the District and parts of Northern Virginia. This section of the engineering
assessment addresses the investigation of the Aqueduct in addition to DC Water’s engineering and
utility services that are pertinent to the drinking water system.
In assessing the drinking water system, the components were reviewed: water supply, treatment
facilities, transmission, pumping stations, storage facilities, and the distribution system. Facilities
owned and operated by the Aqueduct are presented separately from those owned and operated by DC
Water. Generally, the Aqueduct owns and operates the raw water intakes, conduits and raw water
pumping facilities; treatment facilities; and finished water reservoirs. DC Water owns and operates
transmission conduits, storage facilities, pumping station facilities and the water distribution system.
Exhibit 3-1 outlines the Aqueduct’s service area and major assets.
Exhibit 3-1: Washington Aqueduct Service Area and Major Facilities

Page 29 of 110 | Drinking Water Systems
INDEPENDENT ENGINEERING INSPECTION OF THE DC WATER WASTEWATER AND WATER SYSTEMS
3.2 THE WASHINGTON AQUEDUCT
3.2.1 STRUCTURE, ORGANIZATION AND MANAGEMENT
PROCESSES
A division of the Baltimore District, U.S. Army Corps of Engineers (the Corps), Washington Aqueduct (the
Aqueduct) is a federally-owned and operated public water supply agency that produces an average of 160
million gallons of drinking water per day from its two treatment plants in the District of Columbia. Daily, the
Aqueduct serves water to approximately 1 million people living, working, or visiting the District of Columbia;
Arlington County, Virginia; the City of Falls Church, and its service area in Fairfax County, Virginia. In
January 2014, Fairfax Water, the largest water utility in Virginia, assumed ownership and operation of the
drinking water supply for the City of Falls Church and its service area. In doing so, Fairfax Water became a
wholesale customer of the Aqueduct.
The Corps designed, built, and, in 1859, began operating the Aqueduct. Since then, the Aqueduct has
substantially expanded and improved the capacity and function of the original 19th century infrastructure,
which supplied raw river water to a sparsely populated District of Columbia service area. It is now providing
safe drinking water to a much larger and more populous service area employing modern technology and
facilities.
The Aqueduct is proud of its tradition of providing a reliable and safe water supply. In its treatment
brochure, the Aqueduct quotes George Washington from 1798:
“The water of the Potomac may, and will be brought from above the Great Falls into
the Federal City, which would, in future, afford an ample supply of this object.”
The Aqueduct continues to supply an ample amount of water operating from clearly defined agreements
and divisions of responsibility.
The executive management of the Aqueduct is comprised of a General Manager who is supported by four
Branch Chiefs and a Financial Management Officer. The various branches of the Aqueduct provide for the
streamlining of the functional requirements for operating and managing the water utility. Washington
Aqueduct’s organizational chart is presented as Exhibit 3-2 below:

Page 30 of 110 | Drinking Water Systems
INDEPENDENT ENGINEERING INSPECTION OF THE DC WATER WASTEWATER AND WATER SYSTEMS
Exhibit 3-2: Washington Aqueduct Division Organizational Chart
General Manager
Deputy General
Manager
Safety/
Occupational
Health Manager
Safety/
Occupational
Health Manager
Public Affairs
Specialist Baltimore
District Asset
Planning &
Engineering Branch
Chief
Plant Operations
Branch Chief
Maintenance
Branch Chief
Financial
Management Chief
Administrative
Branch Chief
Waterworks/
Electrical
Environmental
Section
Civil/Mechanical
Section
Water Treatment
Engineering Team
Dalecarlia Water
Operations Section
McMillan Water
Operations Section
Laboratory Section
Maintenance
General Foreman
Budget
Formulation,
Execution and
Analysis
Accounting, Audit
and Reporting
Support
Management
Section
Information Support
Program Support &
Human Resources
Security Officer
The Aqueduct has 179 authorized positions for FY 2017, equal to its 2013 staffing level, and a reduction
from the 2002 authorized level of 194 positions. The Aqueduct has outsourced some of its staffing
requirements for support activities. Janitorial, grounds keeping, security, and certain facilities maintenance
activities are currently performed by external providers under contract to the Aqueduct. In addition, the
staffed position level is below the authorized level as the Aqueduct is in the process of hiring replacements
for its aging workforce as long-term employees retire. This increase in retirements is being experienced by
utilities throughout the United States. The Aqueduct continues performing its mission effectively and places
a high priority on securing qualified personnel.

Page 31 of 110 | Drinking Water Systems
INDEPENDENT ENGINEERING INSPECTION OF THE DC WATER WASTEWATER AND WATER SYSTEMS
As the Aqueduct has practiced for many years, all capital improvements are funded on a pay-as-you-go
basis with pro-rata contributions from its three municipal customers. Each fiscal year, the Aqueduct submits
a proposed capital program to these wholesale customers (constituting the Wholesale Customer Board) for
approval and inclusion in their respective budgets. The Aqueduct enjoys some latitude to request
reprogramming after approval by its customers.
Before advertising any contract, and under federal regulations (applicable to the Aqueduct as an agency
under the US Army), the customers deposit the required contribution with the US Treasury.
3.2.2 GENERAL CONCLUSIONS AS TO THE AQUEDUCT’S
STRUCTURE, ORGANIZATION, AND MANAGEMENT
The Aqueduct operates in a well-organized manner with relatively minor changes in managerial staff even
as baby-boomers retire throughout the industry. In June of 2013, DC Water selected Veolia to conduct an
independent and comprehensive study of the Aqueduct. Veolia is a large global organization, which, in
part, provides water management solutions. The goal of the study was to identify opportunities to foster the
continued development of a world class operation at the Aqueduct with a focus on operational efficiency,
quality, and reliability.
From July through October 2013, Veolia’s team worked alongside Washington Aqueduct management and
employees to identify opportunities to make improvements. This effort took as its slogan: “Achieving
Excellence, Source to Tap”, which fostered partnering between consultants and staff. Several very useful
ideas were put forth. From these, a second phase of the consultant effort was focused on improvements in
maintenance management using a computer-based maintenance management system. The Aqueduct
committed itself to incorporating a maintenance management system into its activities. The results indicate
a continuous improvement practice is in place.
As part of this inspection, JMT reviewed parts of Veolia’s “Independent Comprehensive Review of the
Washington Aqueduct”. JMT’s review of the documentation supports the validity of the cooperative effort
between Veolia and the Aqueduct in identifying chemical usage and maintenance practices as areas of
potential savings from planning and optimization efforts. It is also worth mention that Veolia recognized the
Aqueduct’s ratio of full-time employees per million gallons per day (mgd) of treated water was aligned with
benchmarked utilities.
Compliance reports are submitted regularly to the offices of EPA Region 3, in Philadelphia, PA. Permitting at
the Aqueduct is different from other water agencies, as there is no formal permitting process for this unique
federally-owned utility. Changes to the system are submitted to EPA Region 3 as written explanations.
The Aqueduct maintains and upgrades its infrastructure, in part to comply with regulations, through its
Capital Improvements Plan (CIP). The 10-year 2018 to 2027 CIP projects $165,270,000 in capital
improvements. A high-level summary of the Aqueduct’s CIP is presented in Exhibit 3-3.

Page 32 of 110 | Drinking Water Systems
INDEPENDENT ENGINEERING INSPECTION OF THE DC WATER WASTEWATER AND WATER SYSTEMS
Exhibit 3-3: Washington Aqueduct Capital Improvements Plan FY 2018-2027
Capital Improvements Plan Item FY2018 - FY2027 Total 1A: Meet Legal Obligations -
1B: Required to Provide Safe Water in a Safe
Manner
$52,420,000
2: Required to Improve Process & Public
Confidence
$3,100,000
3A: Required to Provide Reliable Water Service $86,750,000
3B: Required to Sustain Infrastructure $17,000,000
Emerging Project Fund $6,000,000
Total $165,270,000
The CIP addresses infrastructure needs under a three-tiered priority ranking. Improvements and upgrades
to the raw water transmission system, the Dalecarlia and McMillan water treatment plants and pumping
stations, along with further hardening of various sites, constitute the bulk of the CIP. DC Water’s
approximate 73% prorated contribution to these projects is projected by Washington Aqueduct at
approximately $120.6 million. In 2016 the Board approved a two-year trial of a category called “emerging
project fund” and funded it for $3,000,000. Washington Aqueduct managers will notify the board of the intent
to use that fund and if no objection is raised the project(s) would be approved.
Under the tiered priority system, the following major maintenance construction projects were accomplished
between 2013 and 2017:
Exhibit 3-4: Washington Aqueduct Major Maintenance/Upgrades - 2013 to 2017
Project Name Cost
30 MG Clearwell Gatehouse Rebuild $0.7M
Little Falls Pumping Station Motor Control Upgrades $4.3M
Dalecarlia Power Distribution Upgrades $1.3M
First High Reservoir Improvements $9.9M
Dalecarlia Pumping Station Building Renovation $1.3M
McMillan Caustic Soda Containment Area Sealing $0.9M
McMillan Chemical Building Renovations $1.1M
Sample Line Improvements $2.6M
South Connection 72" Butterfly Valve Replacement $0.3M
EASA Building Clean-up and Stabilization $1.6M
20" Washwater Line Emergency Repair $0.3M
Dalecarlia Box Conduit Joint Repairs $0.03M
Dalecarlia Gasoline Tank Manway Repair $0.04M
Dalecarlia Pump Motor Circuit Breaker Replacement $1.7M
McMillan Power Protection System Upgrades $2.3M
RPF Thickener Number 2 Feedwell Replacement $0.2M
West Filter backwash Valve Installation $0.3M
Third High Reservoir and McMillan North Clearwell Cleaning $2.2M
McMillan North Clearwell Influent Gate Actuator Replacement $0.1M
East Shaft Pumping Station Rehabilitation $5.3M

Page 33 of 110 | Drinking Water Systems
INDEPENDENT ENGINEERING INSPECTION OF THE DC WATER WASTEWATER AND WATER SYSTEMS
Project Name Cost
McMillan Reservoir Cove Dredging $1.3M
Washington Aqueduct Dredging and Disposal Contract – 2016 $2.6M
Chemical Building Roadway Improvements $1.3M
Admin and Maintenance Building Boiler Control Replacement $0.4M
Maintenance Building Carpenter Shop Wall Bracing $0.06M
Low Lift Pumping Station Water Main Repairs $0.2M
The following construction projects began in 2016 or 2017 and are ongoing:
Exhibit 3-5: Washington Aqueduct Major Maintenance/Upgrades – Ongoing (2016 – Present)
Project Name Cost
Georgetown Reservoir Building Improvements $5.0M
East Shaft Pumping Station Rehabilitation $5.3M
Fire Protection System Improvements $3.8M
Washington Aqueduct Dredging and Disposal Contract – 2016 $2.6M
McMillan Transformer/Switchgear Building Renovation $2.5M
Dalecarlia Basin Collector Modifications $1.5M
Arc Flash Safety Improvements $0.3M
Dalecarlia Chemical Building Electrical Upgrades $6.8M
The CIP expenditures do not include the cost of extensive treatment changes that have been evaluated
under the scope of the Advanced Treatment Project. This project has been supported by the Wholesale
Customers who have approved a piloting plan to test the efficacy of the use of ozone, biologically active
filters, and ultraviolet disinfection in some combination as part of the Advanced Treatment Project. At the
time of this report, the Wholesale Customer Board has not reached a decision on the level of funding or the
timing of the introduction of the approved processes. This is an ongoing initiative to improve water treatment
capabilities. As developed, the cost for introducing all the processes at both Aqueduct treatment plants
would be in the range of $400,000,000 in 2016 dollars.
The upgrade/replacement activity between 2013 and 2017, along with continuing projects, represents the
level of effort being undertaken to ensure the Aqueduct accomplishes its mission of providing safe drinking
water to its metropolitan Washington, D.C. service area.
3.3 WATER SUPPLY MANAGEMENT AND COORDINATION
The Potomac River is the sole source of raw water for the Aqueduct’s two drinking water treatment plants;
Dalecarlia and McMillan. In addition to Washington Aqueduct’s demand on the river supply, the Potomac
River is the main source of water for the region; the river also supplies Fairfax Water’s Corbalis Water
Treatment Plant (WTP) and the Washington Suburban Sanitation Commission’s (WSSC) Potomac WTP.
The region is very cognizant of the sensitivity to drought and the threat of contamination inherent to the river
supply.

Page 34 of 110 | Drinking Water Systems
INDEPENDENT ENGINEERING INSPECTION OF THE DC WATER WASTEWATER AND WATER SYSTEMS
The Interstate Commission on the Potomac River Basin (IPCRB) was created with an interstate compact
established by Congress in 1940 to help the Potomac basin states and the federal government enhance,
protect, and conserve the water and associated land resources of the Potomac River basin through regional
and interstate cooperation. The IPCRB jurisdictions are represented by appointed Commissioners from
Maryland, Pennsylvania, Virginia, West Virginia, the District of Columbia, and the federal government.
The threat of contamination to a river as a sole source of drinking water occurred on the Potomac River in
November of 2016. The IPCRB reported on an oil spill that created sheen on the surface of the river. The
IPCRB reports are the references used by JMT in this report. The various water intakes of the
aforementioned plants were reported to be protected by protective booms and water intake operational
methods. The IPCRB publicly reported at the time of the occurrence that, “All drinking water facilities are
operating, safe, and protected.”
In 2017 the ICRPB Commissioners undertook a study to determine if there might be advantages to
proposing specific changes to the current Low Flow Allocation Agreement (LFA), which is an interstate
agreement. The commissioners represent all of the entities that are signatories to the agreement. The
various facilities and agreements pertaining to the Potomac River as a water supply were presented in the
2013 JMT report and are unchanged during this review period. The specific concerns within the LFA include
the role of the moderator who is defined as the individual to settle disputes concerning allocations and
whether or not the current agreement is protective of the river with respect to the amount of water to be
allowed to flow over Little Falls Dam in times of drought. These issues will be further addressed in 2018.
The importance of evaluating the extent to which the resulting changes, if any, affect the resilience of the
region’s water supply stored in the Jennings Randolph, Savage and Little Seneca Reservoirs has been
recognized. This evaluation might be affected if an additional off-stream reservoir was constructed.
Specifically, the acquisition of the Travilah Quarry has been studied by the IPCRB with the consulting
engineer’s report completed in 2015. Developing the quarry as a regional resource for source water supply
during drought conditions also allows for an off-river water supply immune to river contamination events.
The JMT review of research, studies and reports for this 2018 Assessment and the previous 2013 Report
provides reassurance that the river continues to provide a sufficient supply of good quality raw water to meet
the needs of Washington Aqueduct and the other water utilities in the region. Interviews at Washington
Aqueduct reinforced confidence in the planning and emergency operational plans in place during low flows
and the future protective strategies for contaminating events.

Page 35 of 110 | Drinking Water Systems
INDEPENDENT ENGINEERING INSPECTION OF THE DC WATER WASTEWATER AND WATER SYSTEMS
3.4 TREATMENT PROCESSES AND RELATED FACILITIES
3.4.1 RAW WATER SUPPLY
Raw water from the Potomac River flows by gravity from the Great Falls intake structure, upstream of the
dam, via the aqueduct/conduit to a forebay adjacent, and prior, to the Dalecarlia Reservoir. The original
facilities at the Great Falls Dam and Intake were built in 1869, with major renovations undertaken in 1969.
The Great Falls Dam and Intake can supply a total of up to 217 mgd to the Dalecarlia Reservoir.
In addition to the gravity flow from Great Falls, a second intake is at Little Falls, from where water is
pumped directly to the Dalecarlia Reservoir. The Little Falls Pumping Station and Intake were built in 1958
and have the capacity to deliver 525 mgd of water to the Dalecarlia Reservoir.
3.4.2 PRETREATMENT STORAGE
The Dalecarlia Reservoir is a 238 million gallon earthen basin that serves primarily as a pretreatment
reservoir for both the Dalecarlia and McMillan water treatment plants. Retention of raw water in this
reservoir allows some of the suspended solids to separate from the aqueous portion of the untreated water.
Sediments retained in the Dalecarlia Reservoir are removed via a dredging system and conveyed to the
Basin Recovery Facility. The Dalecarlia Reservoir transmits water by gravity feed to both the Dalecarlia
Water Treatment Plant (Dalecarlia sedimentation basins) and the Georgetown Reservoir.
As previously presented in the CIP improvements, presented in exhibits 3-4 and 3-5, pretreatment storage
improvements are underway to improve the removal of residuals from the forebay and reservoir at
Dalecarlia.
3.4.3 WATER TREATMENT
The Dalecarlia Water Treatment Plant is the larger of the Aqueduct’s two water treatment plants. The
original Dalecarlia facility was built in 1928. The plant capacity was increased in the 1950s by the addition
of two additional sedimentation basins, a 30-mg clear well, a 577-mgd finished water pumping station and
additional filters. A new chemical building and an additional filter building were completed in 1964. The
plant currently has a capacity of 164 mgd, based on filtration rates of two gallons per minute per square
foot (gpm/sf), and a maximum capacity of 264 mgd. Water from the Georgetown Reservoir (sedimentation
basins) is delivered to the McMillan Water Treatment Plant via the Washington City Tunnel. Originally
constructed in 1905 as a slow sand filter plant, the McMillan WTP was replaced in 1985 and is now a rapid
sand filtration plant. This plant has a design capacity of 120 mg, based on 4 gpm/sf filter design rate,
with a maximum capacity of 180 mgd.
The Basin Waste Recovery/Residuals Disposal facility was completed during the 2013 Independent
Engineer’s Report. JMT inspected and investigated the first five years of operation for this 2018 report. The
facility is well maintained and operating in a manner based on continuous improvements as the processing
of the unique characteristics of the sediment material is optimized.
Both Dalecarlia and McMillan plants employ the following treatment technologies:

Page 36 of 110 | Drinking Water Systems
INDEPENDENT ENGINEERING INSPECTION OF THE DC WATER WASTEWATER AND WATER SYSTEMS
Screening - On its way from the river to the Dalecarlia and McMillan treatment plants, raw water passes
through a series of screens designed to remove debris such as twigs and leaves.
Pre-sedimentation - While the water moves slowly through Dalecarlia Reservoir, much of the sand and
silt settles to the bottom.
Coagulation - A coagulant, aluminum sulfate (alum), is added to the water as it flows to sedimentation
basins. Coagulants aid in the removal of suspended particles by causing them to consolidate and settle.
Alum contains positively charged atoms called ions which attract the negatively charged particles
suspended in water causing them to gather into clumps of particles heavy enough to settle.
Flocculation - The water is gently stirred with large paddles to distribute the coagulant; this causes
particles to combine and grow large and heavy enough to settle. This process takes approximately 25
minutes.
Sedimentation - The water flows into quiet sedimentation basins where the flocculated particles settle to
the bottom. After about four hours, approximately 85 percent of the suspended material settles.
Filtration - Water at the top of the basins flows to large gravity filters, where the water flows down through
filter media consisting of layers of small pieces of hard coal (anthracite), sand, and gravel placed in the
bottom of deep, concrete-walled boxes. Filtered water passes through to a collecting system underneath.
Disinfection - Chlorine is added with precision equipment to kill pathogenic microscopic life such as
bacteria or viruses. Ammonia can be then added. The chlorine and ammonia combine to form chloramine
compounds. The concentration of chloramines in the water is closely monitored from the time it is added at
the treatment plants to points near the farthest points of the distribution systems.
Corrosion Control - In addition, orthophosphate is added to control corrosion in pipes, service lines, and
household plumbing throughout the distribution system. This will be discussed further in the water
distribution section.
Other Treatments - Fluoride, in the form of hydrofluorosilic acid, is added to reduce tooth decay, a
common practice in public drinking water systems. Powdered activated carbon is occasionally used for
taste and odor control, which is a safeguard against raw water quality fluctuations associated with a river
supply.

Page 37 of 110 | Drinking Water Systems
INDEPENDENT ENGINEERING INSPECTION OF THE DC WATER WASTEWATER AND WATER SYSTEMS
3.4.4 WASHINGTON AQUEDUCT CONDITION ASSESSMENT
3.4.4.1 DALECARLIA FACILITIES
On November 30, 2017, JMT met with Washington Aqueduct management and conducted a site
investigation of the facilities with emphasis on the operations and maintenance of the five-year old
Residuals Management Facilities. Operational modifications evidenced a continued effort in quality
operational improvements. The Dalecarlia campus exhibited exceptional housekeeping and operational
performance within a secure site.
3.4.4.2 MCMILLAN WATER TREATMENT PLANT
On February 21, 2018, JMT met with the plant manager at the McMillan Water Treatment Plant and
performed a site inspection and a review of the ongoing capital improvements. The plant is well managed
and maintained with good housekeeping. The plant operates within EPA regulations; JMT’s review
included the procedures for backwashing the water filters and the subsequent discharge of backwash
water with the particulate matter into the designated area within the McMillan reservoir.
3.5 WATER DEMAND HISTORY
The Aqueduct’s systems combine for a raw water capacity of 700 mgd and the combined treatment
capacity of the Dalecarlia and McMillan water treatment plants is 350 mgd. In FY 2017, the Aqueduct
produced an average of 131.5 million gallons per day, which represents a continuing reduction in water
demand. The reduction represents a 2% decrease from FY 2016. The 2013 JMT report reported a
decrease from 155.3 mgd to 139 mgd over a five-year period. The transfer of the City of Fall Church
system to Fairfax Water skews comparative FY2016 and FY 2017 demand totals as the combined
operations within Fairfax Water may have changed service areas to some extent between water supplies.
In FY 2017, 98.1 million gallons of water were provided to the District (daily average) as compared to 99.6
million gallons in FY 2016. Both FY 2016 and FY2017 wholesale purchases exceeded the 93.6 million
gallons purchased daily in FY 2013. Exhibit 3-7 below summarizes water demand from FY 2013 through
FY 2017, where DC represents DC Water, AC represents Arlington County, and FW represents Fairfax
Water. The abnormal peak of 104.5 mgd daily average in FY 2015 is attributable to Arlington County’s
reconfiguration of the County’s transmission system that created an altered hydraulic gradient. This caused
a larger portion of the federal water demand, i.e. Pentagon and Ronald Reagan Washington National
Airport to be routed through DC Water meters vs. the normal conveyance within Arlington County.
Specifically, the potable water delivered to the federal facilities was diverted from the Chain Bridge crossing
to the DC Water controlled Key Bridge crossing.
Additional information was gained from an interview with DC Water’s Assistant General Manager,
Customer Care& Operations concerning a significant upgrade to the Key Bridge/federal wholesale
metering. The upgraded metering now allows for more reliable measurement, enhanced by the ability to
remotely monitor and report the flow through the metering facility.

Page 38 of 110 | Drinking Water Systems
INDEPENDENT ENGINEERING INSPECTION OF THE DC WATER WASTEWATER AND WATER SYSTEMS
Exhibit 3-7: Summary Water Demands 2013 - 2017
3.6 WATER SYSTEM SERVICE AREA
Potable drinking water is delivered to DC Water from the two Washington Aqueduct water treatment plants.
The distribution system is a combination of DC Water-owned and controlled assets and particular facilities
owned by the Aqueduct. DC Water serves its retail customers through a distribution network consisting of
underground reservoirs, elevated tanks, pipes, valves and various system appurtenances. Both DC Water
and the Aqueduct own components of the distribution network.
DC Water’s distribution system consists of approximately 1,300 miles of pipe with over 36,000 valves for
controlling the flow. An important function of the system is to provide fire protection for the District of
Columbia. The system includes approximately 9,500 public fire hydrants. DC Water maintains 8 storage
tanks – 3 elevated tanks and 5 ground reservoirs. In addition, there are five water pumping stations with
the largest being the Bryant Street Station with a capacity of 194 mgd.
AC DC FW
2013 22.5 93.6 14.4
2014 22.2 94.8 14.2
2015 19.8 104.5 14.2
2016 21.3 99.6 13.7
2017 21.3 98.1 12.1
0
20
40
60
80
100
120M
GD
Wholesale Customer Demand
Average Daily Water Use
2013 2014 2015 2016 2017

Page 39 of 110 | Drinking Water Systems
INDEPENDENT ENGINEERING INSPECTION OF THE DC WATER WASTEWATER AND WATER SYSTEMS
3.6.1 SYSTEM OVERVIEW
The water distribution system has been configured to provide a service pressure of approximately 50
pounds per square inch (psi). To maintain suitable pressures for domestic use, the water distribution
system is divided into seven pressure zones following topographical changes. The current service areas, or
zones, are shown in Exhibit 3-8.
Exhibit 3-8: Existing Water Service Areas

Page 40 of 110 | Drinking Water Systems
INDEPENDENT ENGINEERING INSPECTION OF THE DC WATER WASTEWATER AND WATER SYSTEMS
These service areas are served by a system consisting of five pumping stations, eleven reservoirs and
elevated tanks. One of the pumping stations is operated by the Washington Aqueduct Division as are three
of the reservoirs.
Low Service Area corresponds to places with ground elevations between 0 and 70 feet and includes
areas along the Potomac and Anacostia Rivers. This area is served by the Dalecarlia Pumping Station
(operated by the Washington Aqueduct Division), and the Bryant Street Pumping Station. The pressure in
the Low Service Area is controlled by the water level in Brentwood Reservoir.
First High Service Area is located on the west side of the Anacostia River where the ground elevations
range between approximately 70 and 140 feet above sea level. This area is served by the Dalecarlia and
Bryant Street pumping stations. The pressure in the First High Service Area is controlled by the water
levels in the Fox Hall Reservoir and the Soldier’s Home Reservoir. The Fox Hall Reservoir is owned by the
Washington Aqueduct Division, while the Soldier’s Home Reservoir is owned by DC Water.
Anacostia First High Service Area serves communities located southeast of the Anacostia River and
having ground elevations between 70 and 170 feet. Water to this zone is supplied by the Anacostia
Pumping Station. The pressure in this area is controlled by the water level in Fort Stanton Reservoirs No.1
and No.2.
Second High Service Area serves the area west of the Anacostia River between Rock Creek Park and
Eastern Avenue with ground elevations between 140 and 210 feet. As with the First High Service Area, this
area is served by the Dalecarlia and Bryant Street pumping stations. The pressure in the Second High
Service Area is governed by the water level in the Van Ness Reservoir. The Van Ness Reservoir is owned
and operated by Washington Aqueduct.
Anacostia Second High Service Area serves the area located southeast of the Anacostia River along
Southern Avenue and having ground elevations above 170 feet. This area is served by the Anacostia
Pumping Station. The pressure in this area is controlled by the water level in the Good Hope Road
Elevated Tank and the Boulevard Elevated Tank. The St. Elizabeth’s Elevated Water Tank will control a
new Anacostia High Service Area in the southern portion of the Anacostia First High Area. This service
area is scheduled to be on line in spring, 2018.
Third High Service Area is located west of the Anacostia River with ground elevations between 210 and
350 feet above sea level. This area is served by the Dalecarlia and Bryant Street pumping stations. The
water supply to the Third High Service Area comes from both the Dalecarlia Pumping Station and the
Bryant Street Pumping Station. The service pressure is governed by the water level in the two Fort Reno
reservoirs, Fort Reno Reservoir No. 1 and Fort Reno Reservoir No.2. The Fort Reno Reservoir #2 is owned
and operated by the Washington Aqueduct Division.
Fourth High Service Area serves the area west of the Anacostia River, separated by Rock Creek Park,
bounded by Eastern and Western Avenues, and with ground elevation above 350 feet. The Fourth High
Service Area is further subdivided into an eastern portion and a western portion. The Fort Reno Pumping
Station supplies the western portion. The Fort Reno Pumping Station pumps from water that is supplied

Page 41 of 110 | Drinking Water Systems
INDEPENDENT ENGINEERING INSPECTION OF THE DC WATER WASTEWATER AND WATER SYSTEMS
from the Third High Service Area. The western system pressure has been controlled by the water level in
the 0.16 MG Fort Reno Elevated Tank. Within this review period, the elevated tank has been brought off-
line as the renovated pumping station can control the water level with variable speed pumps. The system
pressure for the eastern portion of the Fourth High Service Area is provided by the 16th and Alaska
Pumping Station.
The DC Water distribution system is configured in the same pressure areas as reported in the 2008
Assessment. Exhibit 3-9 summarizes the zone configuration.
Exhibit 3-9: Water Service Area Pressure Zones
Pressure Zone Ground Elevation Maximum Static
Hydraulic Grade Line
Low 0 to 70 feet 172 feet
First High 70 to 140 feet 250 feet
Anacostia First High 70 to 170 feet 258 feet
Second High 140 to 210 feet 335 feet
Anacostia Second High Above 170 feet 382 feet
Third High 210 to 350 feet 424 feet
Fourth High Above 350 feet 510 feet
3.6.2 2015 WATER SYSTEM FACILITIES PLAN
DC Water’s 2015 update to the Facilities Plan (originally developed in 2000) is the planning document
presently guiding the elements of the Capital Improvement Program. The document presents a strategy for
DC Water to continue providing safe, adequate, and reliable service to its customers. The 2015 Facilities
Plan Update:
• Presents population and demand projections through the year 2035.
• Reviews current water quality data and proposed water quality regulations.
• Evaluates pumping, storage, transmission, and distribution infrastructure systems and identifies
investment needs to meet system demands and water quality requirements over the next 20 years
to continue providing a reliable supply at adequate flows and pressures.
• Presents a prioritized Capital Improvement Program (CIP) for pumping, storage, transmission, and
distribution.
• Identifies other recommendations including continuous improvement in Asset Management
The 2015 Facilities Plan Update is comprehensive and current. Based on the accomplishments of DC
Water in implementing improvements presented in the previous 2009 Water Facilities Plan Update, DC
Water ratepayers can be assured that the recommendations and schedules of the Facility Plan are being
implemented.

Page 42 of 110 | Drinking Water Systems
INDEPENDENT ENGINEERING INSPECTION OF THE DC WATER WASTEWATER AND WATER SYSTEMS
3.6.3 PUMPING STATIONS
Exhibit 3-10 summarizes the five pumping stations serving the pressure zones. One of these stations, the
Dalecarlia Pumping Station, is owned and operated by the Aqueduct. As part of the regional water system
serving the D.C. area, DC Water utilizes the pumping capabilities of the Aqueduct. Beyond the pressure
levels served by the Dalecarlia pumping facility, DC Water maintains four pumping stations that draw water
from lower pressure zones, pressurizing the water delivered to higher zones.
Exhibit 3-10: Drinking Water Pumping Facilities
Facility Date in
Service Service Area Capacity
Dalecarlia Pumping Station
(Aqueduct operated) 1928
Low, First High, and Third
High 310 mgd
Bryant Street Pumping
Station 1905
Low, First High, Second
High, and Third High 194 mgd
Fort Reno Pumping Station 1977 From Third High to Fourth
High 15.7 mgd
16th & Alaska Pumping
Station 1993
From Third High to Fourth
High 3.5 mgd
Anacostia Pumping Station 2008 From Low to Anacostia First
and Second High 82.8 mgd
3.6.3.1 WASHINGTON AQUEDUCT PUMPING CAPABILITIES 3.6.3.1.1 DALECARLIA PUMPING STATION
As part of the Dalecarlia Water Treatment Plant, this station was built in 1928. The pumping station has a
firm capacity of 310 mgd and provides service to Low, First High, Second High, and the Third High Service
Areas. In addition to serving these zones within the District of Columbia, this station also provides service
to Arlington County, and a portion of the Fairfax Water service area (formerly the service area of the City of
Falls Church).
3.6.3.2 DC WATER PUMPING STATIONS 3.6.3.2.1 BRYANT STREET PUMPING STATION
The Bryant Street Pumping Station was built in 1905 and pumps water to the Low, First High, Second High,
and Third High Services Areas. At a capacity of 194 mgd, it is DC Water’s largest water pumping station.
Major renovations of the Bryant Street Pumping Station had been completed prior to this reporting period.
As the central pumping operations and control facility, the Bryant Street Pumping Station is the nerve
center of water distribution for DC Water. The renovations have made the station and its operating center
both effective and efficient in the reliable delivery of drinking water.

Page 43 of 110 | Drinking Water Systems
INDEPENDENT ENGINEERING INSPECTION OF THE DC WATER WASTEWATER AND WATER SYSTEMS
Condition Assessment
DC Water has completed numerous capital
projects in the previous twenty years for this
historical facility. Exhibit 3-11 is a list of recent
capital projects completed or programmed
during this review period, these upgrades
continue the operational efficacy of the facility,
which supplies water to all pressure zones, is
the central control facility for the water system,
housing many DC Water offices and functions.
Exhibit 3-11: Bryant Street Pumping Station CIP Projects
Project ID Project Title Cost Timeline
DU
Water System Laboratory Facilities – Provides laboratory facilities
for the Water Quality Division at the Bryant Street Pumping
Station
$0.6M Completed
FD Water Facilities Security System Upgrades – Provides security
system upgrades to water storage facilities $2.0M
Completion
Dec 2019
FH Discharge Piping Bryant Street Pumping Station – Provides
replacement for highly corroded discharge pipes $13.4M
Completion
Jun 2018
HI Bryant Street Pump Station Phase II $5.9M Completion
2024
HV Bryant Street Pump Station Spill Header Flow Control – Provides
replacement of manual PRVs with actuated PRVs $5.9M
Completion
FY 2024
JB
Bryant Street Pumping Station Improvements – Phase II –
Provides modifications and structural reinforcement of warehouse
and shop buildings on Bryant Street Pumping Station Site
$11.7M Completion
Aug 2018
M6 Rehabilitation of Bryant Street Pumping Station – Rehabilitates
and upgrades pumping station $61.1M
Completed
FY 2016
Interviews conducted with engineering and operation staff, along with several field visits and site
inspections at the station, indicate the station is in excellent operational order, and the staff is well
motivated.

Page 44 of 110 | Drinking Water Systems
INDEPENDENT ENGINEERING INSPECTION OF THE DC WATER WASTEWATER AND WATER SYSTEMS
3.6.3.2.2 FORT RENO PUMPING STATION
The Fort Reno Pumping Station was placed in service in 1977. It has a pumping capacity of 15.7 mgd and
pumps water from the Third High Service Area to the Fourth High Service Area. The station is located on
the same site as the Fort Reno Elevated Tank No. 2 and Fort Reno Reservoir Nos. 1 & 2. The Fort Reno
Elevated Tank No. 2 has been placed out of service as the new variable speed pumping capabilities serve
as the pressure controlling equipment for the Fourth High. The higher service pressure in the Fourth High
is presently higher than the overflow level of the elevated tank. Also, the abandoned former Fort Reno
Pumping Station and Elevated Tank No. 1 are located on the same site. Fort Reno Pumping Station has a
firm capacity of 15.7 mgd, which exceeds current and projected (2035) maximum demand conditions plus
maximum fire flow demands. Capital Project AY Upgrades to Ft. Reno Pumping Station have been
completed in FY 2018 at $13.6M.
Condition Assessment
DC Water has completed projects that remedied the structural and mechanical components of the Fort
Reno Pumping Station. The upgraded pumping station is in like-new condition with redundant variable
speed pumps with local and remote control and monitoring features. The new emergency power generator
set is exercised and maintained on a programmed schedule.
The current condition of the Fort Reno Pumping Station was provided during an interview and site
inspection on February 28, 2018. The housekeeping discipline at the multi-purposed site was exceptional,
including the water quality laboratory.
3.6.3.2.3 ANACOSTIA PUMPING STATION
DC Water is in the construction phase of upgrading the Anacostia Pumping Station to improve power and
control systems, add pumps for the new Anacostia First High South Service Area, and maintain the
reliability of the Anacostia 1st and 2nd High Service Area distribution systems. The Anacostia Pumping
Station has a firm capacity of 62.5 mgd. The pumping station supplies the Anacostia 1st, 2nd, & 3rd High
service areas. This site was not inspected during this review period.
3.6.3.2.4 16TH AND ALASKA PUMPING STATION
At 3.5 mgd capacity, the 16th and Alaska Pumping Station pumps water from the Third High Service Area
to the Fourth High Service Area. The pumping station was built in 1993. The 16th & Alaska Pumping
Station has a firm capacity of 3.5 mgd, which exceeds current and projected (2035) maximum demand
conditions plus maximum fire flow demands. The upgrades to the pumping station were completed in FY
2015. The $4.6M project has increased the reliability and serviceability of the station that supplies water to
the 4th High East from the 3rd High Service Area. This site was not inspected during this review period.

Page 45 of 110 | Drinking Water Systems
INDEPENDENT ENGINEERING INSPECTION OF THE DC WATER WASTEWATER AND WATER SYSTEMS
3.6.4 WATER STORAGE FACILITIES
Exhibit 3-12 summarizes the eight storage facilities DC Water owns and operates. Five of these facilities
are underground reservoirs and three are elevated tanks. Three additional underground reservoirs are
owned and operated by the Aqueduct; these facilities are the Foxhall and Van Ness Reservoirs and the
Fort Reno Reservoir No. 2. These facilities combine for a total storage capacity of 110 million gallons and
provide adequate storage for DC Water’s service area.
Exhibit 3-12: Water Storage Facilities
Facility Name
Service Area
Construction
(Upgrade
Project)
Capacity
Brentwood Reservoir Low Service 1959 (2014) 25 MG
Soldiers’ Home Reservoir 1st High 1939 (2003) 15 MG
Fort Reno Reservoir No. 1 3rd High 1928 (2016) 5.4 MG
Fort Reno Elevated Tank
No. 2 (out of service) 4th High 1926 (2000) 0.16 MG
Fort Stanton Reservoir
No. 1
Anacostia 1st High
(Proposed Anacostia 1st
High)
1932 (2000) 3 MG
Fort Stanton Reservoir
No. 2
Anacostia 1st High
(Proposed Anacostia 1st
High)
1943 (2020) 10 MG
Good Hope Elevated Tank
Anacostia 2nd High
(Proposed Anacostia 3rd
High)
1937 (2025) 0.5 MG
Boulevard Elevated Tank
Anacostia 2nd High
(Proposed Anacostia 3rd
High)
1945 (2025) 2 MG
The five storage reservoirs and three elevated tanks operated by DC Water were originally constructed
between 1926 and 1959 with an average age of approximately 75 years. Rehabilitation work at these
facilities is ongoing and includes site improvements, new instrumentation, upgrades to structural
components, painting of the steel tanks, and green infrastructure.
3.6.4.1 WASHINGTON AQUEDUCT STORAGE FACILITIES 3.6.4.1.1 FOXHALL RESERVOIR
The Foxhall Reservoir stores drinking water for distribution in the First High Service Area. This reservoir is
a 14.5 mg, below-ground facility and was built in 1941. Water levels in the reservoir are operated to control
pressure in the First High Service Area.

Page 46 of 110 | Drinking Water Systems
INDEPENDENT ENGINEERING INSPECTION OF THE DC WATER WASTEWATER AND WATER SYSTEMS
3.6.4.1.2 VAN NESS RESERVOIR
Built in 1931, the Van Ness Reservoir provides drinking water storage for delivery to the Second High
Service Area. This below-ground reservoir has a storage capacity of 14.6 mg and overflow elevation of 335
feet. The water level in this reservoir is operated to control pressure in the Second High Service Area.
3.6.4.1.3 FORT RENO RESERVOIR NO.2
This reservoir was built as a 20-mg drinking water storage facility in 1955. Along with Fort Reno Reservoir
No. 1 (owned and operated by DC Water), this reservoir provides water to the Third High Service Area and
is used to control pressure in this service area. Fort Reno Reservoir No. 2 has an overflow elevation of
423.5 feet.
3.6.4.2 DC WATER STORAGE RESERVOIRS AND ELEVATED TANKS
In addition to the existing water storage tanks, the $36.9M St. Elizabeth’s Elevated Tank is scheduled to be
completed in FY 2019. The 2.0 MG elevated tank will control pressure in the Anacostia 1st High South
service area. In order to replace the Ft. Reno Elevated Tank No. 2, a capital project exists to site, design
and construct a 2MG 4th High Storage Tank. Project completion is projected to be FY 2024 at $9.6M. A 2nd
High Water Storage facility is being studied to augment Washington Aqueduct’s Van Ness reservoir, which
has the capacity to supply 65% of the 2nd High’s average daily demand. Redundancy of tanks allows for
the out-of-service rehabilitation of a tank. The 2nd High storage FY 2017-2026 capital project is $16.8M to
be completed in FY 2025.
DC Water is following best practices in assessing the condition and security of water storage facilities. EPA
regulations for protecting drinking water have been incorporated within the water storage capital
improvements. The CIP adequately addresses DC Water’s storage reservoir and elevated tank
requirements. The operating budgets fund the on-going cleaning and disinfection of the storage facilities
performed by outsourced services on a three-year cycle.
3.6.4.2.1 FORT RENO RESERVOIR NO. 1
The Fort Reno Reservoir No. 1 is one of the drinking water storage facilities serving DC Water’s Third High
Service Area. The reservoir was built in 1928 and is a below-ground facility with storage capacity for 5.4
million gallons of water. Water levels in this reservoir, along with Fort Reno Reservoir No. 2, are used to
control pressure in the Third High Service Area. The reservoir has an overflow elevation of 424 feet.
Condition Assessment
On February 28, 2018, JMT inspected the reservoir and found the sanitary measures stipulated by the EPA
are in place and enforced. The green infrastructure roof is being maintained.

Page 47 of 110 | Drinking Water Systems
INDEPENDENT ENGINEERING INSPECTION OF THE DC WATER WASTEWATER AND WATER SYSTEMS
3.6.4.2.2 FORT RENO ELEVATED TANK NO. 2
The Fort Reno Elevated Tank No. 2 is an elevated steel tank within a stone masonry building. The tank is
currently in the process of being decommissioned due to functional obsolescence. Variable speed pumping
capabilities in the Fort Reno Pumping Station have surpassed this tank’s pressure controlling capabilities in
the service area. Redundancies within the pumping capabilities and limitations to capacity have rendered
this tank obsolete.
Condition Assessment
On February 28, 2018, JMT inspected the out-of-service elevated tank and found the asset is being
maintained in an operationally ready condition.
3.6.5 TRANSMISSION AND DISTRIBUTION – MAINS &
APPURTENANCES
3.6.5.1 TRANSMISSION MAINS
DC Water owns and maintains approximately 250 miles of transmission mains (16-inch diameter and
greater.) DC Water has an existing Large Diameter Water Main Rehabilitation/Replacement program
(LDWM). A detailed field analysis of existing transmission mains, prioritized in the 2015 Facilities Plan
Update, continues within the Pipe Condition Assessment (PCA) with five miles of high-risk pipes analyzed
annually. Field inspections and leak detection are used to develop capital projects addressing specific
sections of pipe in various transmission mains requiring repair or replacement.
Steel pipes in the system account for the highest number of breaks in the entire system when indexed on a
number of breaks per unit length basis. It has been determined that the high occurrence of breaks in steel
water mains is most probably due to the effects of corrosion to the pipe material and couplings. As
anticipated, very few of the pipelines surveyed were provided with corrosion protection systems, and the
systems that were in place appeared to be in disrepair. This is typical for steel transmission mains that are
not adequately protected against corrosion. The lining of the 24-inch steel main at Rock Creek (project DF)
was completed in 2016 at a reduced project cost of $0.376M. Project F6, Steel Water Mains Rehabilitation
Phase I, is a project addressing cathodic protection upgrades to protect high priority mains. Noteworthy
transmission main CIP projects are listed in Exhibit 3-15. Project C9, Large Diameter Water Mains 1, calls
for the replacement of a 30-inch cast iron main installed in 1859. By all measures, the main, located in
MacArthur Boulevard and points south, is one of the oldest large mains in the country. The $19.3M project
is programmed for FY 2020.

Page 48 of 110 | Drinking Water Systems
INDEPENDENT ENGINEERING INSPECTION OF THE DC WATER WASTEWATER AND WATER SYSTEMS
Exhibit 3-15: Transmission Main Projects
Transmission
Mains
Projects
Recommended Improvements Cost Timeline
C9 Large Diameter Water Mains 1 $19.3M Completion FY
2020
F6 Steel Water Mains Rehabilitation Phase I $9.9M Completion FY
2020
FE 20” Low Service Main & PRV $8.0M Completion FY
2018
FT Water Mains Rehab Phase II $40.0M Completion FY
2024
GU Crosstown Water Main Rehabilitation $12.7M Completed 2014
GX Large Dia. Water Main Repl. II $23.2.0M Rescheduled for
2029
JZ Large Dia. Water Main Repl. 3,4&5 $63.7M Completion FY
2027
S5 Large Diameter Water Main Int. Repairs $17.0M Completed 2016
Condition Assessment
The progress and results of the transmission main rehabilitation projects were provided during an interview
on February 20, 2018. The Department of Engineering and Technical Services has developed a Facilities
Plan that addresses the aging infrastructure.
3.6.5.2 DISTRIBUTION MAINS
The installation history and general material of construction of the distribution mains (12-inch diameter and
smaller) is well documented in DC Water records. Approximately 740 miles of distribution mains are
unlined cast iron pipe that are known to be tuberculated, which reduces hydraulic capacity and is a
potential water quality concern. The 2015 Facilities Plan Update identifies approximately 245 miles of pipe
over a hundred years old. There are many factors that dictate replacement strategy; however, it is
generally accepted that the useful life of water mains is 100 years. The 2015 Facilities Plan update
continues the recommended 1% replacement per year. The FY 2017-2026 Capital Improvement Program
adheres to the 1% per year replacement as recommended. The new replacement program began in FY
2010 with full implementation of the small water main program in FY 2014 and the large water main
program in FY 2016.
Distribution main projects are listed below in Exhibit 3-16. The illustrated projects satisfy the 1% per year
replacement metric.

Page 49 of 110 | Drinking Water Systems
INDEPENDENT ENGINEERING INSPECTION OF THE DC WATER WASTEWATER AND WATER SYSTEMS
Exhibit 3-16: Distribution Main Projects
Distribution
Mains
Projects
Recommended Improvements Cost Timeline
DE Small Diameter Water Main Rehab 12 $39.9M Completion FY 2020
F1 Small Diameter Water Main Rehab 13 $31.2M Completion FY 2020
F2 Small Diameter Water Main Rehab 14 $40.1M Completion FY 2021
GR Small Diameter Water Main Rehab 15 $39.8M Completion FY 2022
MV Small Diameter Water Main Rehab 03 $15.6M Completion FY 2020
MX Small Diameter Water Main Rehab 05 $9.0M Completed FY 2016
N9 Small Diameter Water Main Rehab 07 $17.0M Completion FY 2015
O0 Small Diameter Water Main Rehab 08 $20.7M Completion FY 2019
O1 Small Diameter Water Main Rehab 09 $25.0M Completion FY 2018
O2 Small Diameter Water Main Rehab 10 $36.8M Completion FY 2019
O3 Small Diameter Water Main Rehab 11 $39.0M Completion FY 2018
Condition Assessment
The DETS interview on February 20, 2018 indicated that the restructuring of the design element of small
water main replacement from design consultants to in-house engineers has been successful and has
exceeded the design parameter 1% per year replacement metric.
3.6.5.3 APPURTENANCES 3.6.5.3.1 CONTROL VALVES
Control valves are often referred to as the heart of a distribution system. The ability to isolate sections of
water mains for repairs is vital to providing a safe and dependable supply of water. Larger transmission
mains when required to be isolated for repair have substantially large valves. These large valves are under
considerable forces developed by the flow of water and system pressures. Functioning valves reduce the
service interruption during emergencies. Most importantly, the number of customers affected is greatly
reduced as the isolation does not require expanding the shut-off zone to reach operable valves. Project BZ,
Large Valve Replacement, was a $12.7M replacement effort for the replacement of 40 broken valves on
large diameter mains, which was completed in 2017.
Condition Assessment
DC Water has completed projects within the 2013-2017 review period. The Water Utility Services
interviews on February 6, and 21, 2018 indicated improved reliability within the water system due to the
new valving in critical areas. The system’s reliability will further improve based on the planned projects
outlined in Exhibit 3 -17.

Page 50 of 110 | Drinking Water Systems
INDEPENDENT ENGINEERING INSPECTION OF THE DC WATER WASTEWATER AND WATER SYSTEMS
Exhibit 3-17: Valve Replacement Projects
Appurtenances
Projects Recommended Improvements Cost Timeline
BZ Large Valve Replacement
(Contract 08-10) $12.7M Completed FY 2017
I8 Large Valve Replacement
(Contract 11-13) $17.7M Completion FY 2020
IB Large Valve Replacement
(Contract 17-19) $20.0M Design May 2018
KA Large Valve Replacement
(Contract 20-22) $17.6M Completion FY 2027
KB Large Valve Replacement
(Contract 23-25) $19.2M Completion FY 2029
3.6.5.3.2 FIRE HYDRANTS
A Memorandum of Understanding (MOU) between DC Water and the District of Columbia, through the
District of Columbia Fire and Emergency Medical Services Department, is in place and DC Water
continually measures its performance based on this MOU. This agreement implements an improvement
program in the operational level of fire hydrants within the District. DC Water is firmly committed to
ensuring the availability and accessibility of public fire hydrants to the District of Columbia Fire Department
(DCFD) so that they can provide superior fire protection within the District. DC Water has a Fire Hydrant
Service Status Program that measures the performance of maintenance, repair and replacement of public
fire hydrants in the District while simultaneously keeping the public informed. The report measures the
number of public hydrants, identifies how many are out of service, maps the locations, indicates how many
require repair or replacement, and recognizes the reason for being out of service. These measures are
continuously monitored and a detailed report and explanation is provided every month to the Environmental
Quality and Operations Committee, and each quarter and the full Board of Directors.
DC Water has established the goal of 1% or less Out-of-Service (OOS) for public fire hydrants. The
December 4, 2017 report to the Environmental Quality and Operations Committee showed a 4-month trend
between 0.25% and 0.38% OOS This range is typical of earlier reports that have been monitored by JMT
over the 2013-2017 review period.
The FY 2017-2026 CIP dedicates $28.2M to the Fire Hydrant Replacement Program, Project GQ. This
program replaces and upgrades fire hydrants. The replacement effort has been transferred from
contractors performing the replacement to Water Utility Services personnel. In 2017, the goal of 500
replacements per year was achieved by Water Utility Services. Replacement and maintenance costs of
hydrants are reimbursed by the DC Government. The target level of service for hydrants has been
exceeded during the assessment period; Exhibit 3-18 illustrates the prior year’s monthly levels of Out of
Service hydrants against target levels.

Page 51 of 110 | Drinking Water Systems
INDEPENDENT ENGINEERING INSPECTION OF THE DC WATER WASTEWATER AND WATER SYSTEMS
Exhibit 3-18: Fire Hydrants Out of Service
DC Water maintains a high level of transparency for the fire hydrant program by publishing quarterly
reports that depict the location and number of fire hydrants that are defective, obstructed, temporary, and
under construction. These reports are readily available on DC Water’s website, demonstrating DC Water’s
commitment to maintaining working fire hydrants.
3.6.5.3.3 LEAD SERVICE LINE REPLACEMENT POLICY
DC Water continues to address lead service lines with operational, testing, and replacement policies.
Water samples for lead from some homes in the District indicated lead was leached into drinking water
from lead service lines during a period from 2001 to 2004. Since 2004, following a change in water
chemistry within treatment processes, the District of Columbia’s drinking water has met federal limits for
lead and is in full compliance with U.S. Safe Drinking Water Act regulations, including the Lead and Copper
Rule. In response to the elevated lead samples, DC Water (then WASA) initiated a program to comply with
the Lead and Copper Rule, which included an accelerated capital program to locate and replace lead
service lines throughout the District. This program was revised by the Board of Directors in 2008 following
a scientific review of the impacts of partial lead service line replacement on drinking water.
The Lead Service Line Replacement Policy (LSLR), as revised by the Board of Directors, encourages
property owners to replace the private portion of the lead pipe in conjunction with DC Water replacing the
public portion of the service line. Lead service lines in public space (between the main and the property
line) continue to be replaced with copper pipe in conjunction with DC Water's ongoing water main
replacement projects, DDOT projects and developer activities. During these water main replacement
projects that include replacing the public service lines, DC Water strongly encourages homeowners to
replace private-side lead pipes. DC Water offers the private lead service replacements during their projects
at contractual rates that may be discounted compared to other contractors. DC Water also offers a cost
reimbursement plan of up-to four monthly payments to these homeowners.
Source: DC Water

Page 52 of 110 | Drinking Water Systems
INDEPENDENT ENGINEERING INSPECTION OF THE DC WATER WASTEWATER AND WATER SYSTEMS
In addition to service line replacements, the ongoing LSLR efforts encompass outreach efforts: online
information - including a map of all service line materials, mailings, and door-to-door (during construction
projects); lead testing for customers; and distributing filters to customers receiving lead service
replacements. The ten-year CIP, FY 2017 – FY 2026 projected expenditure for project BW, Lead service
Replacement Program, is $18.5M. The lifetime cost is projected to be $209M.
3.6.6 RATEPAYER METERING
DC Water was one of the first utilities to adopt automated meter reading (AMR), a noted best practice in
the industry. The automated meters use radio frequency and cellular phone technology to send water
usage information from the meter to DC Water. In addition, an innovative application was developed in-
house for notifying customers about their water use. The so-called High Use Notification Application
(HUNA) tool analyzes daily water consumption and provides monthly and yearly averages on each
account. It also allows customers to access daily meter readings via the web and has advanced features
which alert customers of metering anomalies.
The AMR and the Customer Service Information and Billing System help DC Water minimize estimated
billings; decrease meter investigations by field staff; reduce the cycle time to identify and correct erroneous
billings; identify meter issues; and provide modern data analytics-based services. The CIP project for the
AMR Replacement Program is a Capital Equipment project, EQP2340. The goal is to replace 90,000 water
meters, with corresponding transmitting units by FY 2018. The Lifetime approved budget is $33.2M,
reduced from the earlier estimate of $50.7M.
3.6.7 ORGANIZATIONAL
The Customer Care & Operations team is responsible for operating the water system. Utility Services -
Water maintains the water transmission and distribution systems throughout the District. Distribution and
Conveyance Systems is responsible for the pumping and storage facilities for the water system. Water
Quality and Technology (WQT) monitors drinking water quality. The following Exhibit 3-19 presents the
organizational structure dedicated to the Water System’s Operations and Maintenance.

Page 53 of 110 | Drinking Water Systems
INDEPENDENT ENGINEERING INSPECTION OF THE DC WATER WASTEWATER AND WATER SYSTEMS
Exhibit 3-19: Water Utility Services Organization Chart
Assistant General
Manager, Customer
Care & Operations
Water Quality
Manager
Director,
Distribution and
Conveyance
Systems
Director, Utility
Services - Water
Water Quality and
Technology
(18 positions)
Pumping
Operations
(28 positions)
Distribution
Maintenance
(59 positions)
Distribution Control
(84 positions)
Contract
Management
(29 positions)
Linear Asset
Management
(5 positions)
SCADA Process
Control
(15 positions)
Maintenance
(33 positions)
Potomac
Interceptor
(5 positions)
3.6.8 ASSET MANAGEMENT
Since the 2013 assessment, pursuant to DC Water’s Blue Horizon 2020 Strategic Plan, DC Water has
made significant progress toward optimally managing its infrastructure. One of the most significant
achievements on this front during this assessment period is the continued implementation and progressive
maturity of its Asset Management (AM) Program. DC Water has intentionally sought, developed, and
authorized policies and practices that enhance its abilities to optimally manage its infrastructure assets. DC
Water has also purposefully organized and empowered its management at all levels of the organization to
achieve AM goals. Planning and management studies have reviewed and recommended changes to policy
and governance - that have been or are being implemented - to empower the role of AM within the
organization. The result for DC Water is a shift of its infrastructure AM from a reactive management model
toward a proactive one.
The proactive management approach is built around utility AM practices. Utility AM is a paradigm shift in
utility management. Modern utilities are moving away from a build and operate infrastructure model toward
actively managing the performance of their infrastructure assets. Some of the goals of this shift are to
extend the lifecycle of assets, optimize maintenance and renewal, sustain long-term performance, and
develop accurate long-term funding strategies. These practices generally incorporate ideas that allow

Page 54 of 110 | Drinking Water Systems
INDEPENDENT ENGINEERING INSPECTION OF THE DC WATER WASTEWATER AND WATER SYSTEMS
utilities to operate more efficiently, providing the same or increased levels of service to customers with
correspondently less or the same level of funding.
This shift is occurring due to a variety of factors, but aging infrastructure, loss of technical expertise due to
retirements, public resistance to rate increases, and increasing demand on utility services all figure
prominently. When a utility applies AM practices to infrastructure at all levels of the organization, it is
empowered to minimize total costs with limited resources while delivering service levels required by
customers and regulators, all at acceptable levels of organizational risk. AM assesses the total cost of
ownership throughout the asset lifecycle – acquisition, operations maintenance, and renewal.
JMT reviewed DC Water’s Enterprise Asset Management Plan (EAMP) to assess the role of AM within the
organization. Based on this review, DC Water is undertaking its Asset Management implementation with
the assistance of industry leaders and with the guidance of industry standards. ISO 55000, an industry
standard for the management of physical assets, is cited within DC Water’s Enterprise Asset Management
Plan as key guidance “to guide DC Water to eventually achieve world-class AM status”. ISO 55000
identifies high level standards for AM decision making, setting forth tools (reliability engineering, risk
analysis, financial discounting, and life cycle costing analysis) that can be used in the process. In addition,
one of the most important standards it sets is that of decision making criteria that are documented,
transparent, proportionate, and consistently applied.
The EAMP places significant priority upon the systematic assessment of DC Water’s infrastructure assets.
At a high level, this plan accomplishes these goals:
• Groups all major types of operational assets, provides condition and performance assessments of each class indexed with a variety of relevant metrics such as age, length, diameter, estimated useful life, and replacement cost for each.
• Assesses the current, desired, and appropriate service levels for the water, sewer, and wastewater treatment service lines, and establishes key performance indicator (KPI) metrics for each.
• Evaluates the risk levels for each asset class.
• Identifies needed support systems required through role competencies and software support systems. Primary support systems include Geographic Information Systems, existing program level assessment databases, and Maximo, the enterprise asset management solution.
• Historical and forecast capital models, including funding sources.
• Summarized capital investment needs by service line.
ISO 55000 places a high priority on cross-disciplinary teamwork to achieve the organizational goals of AM.
This is best achieved through appropriate engagement in AM by the organizational governance. The EAMP
clearly identifies the DC Water’s organizational governance as it pertains to AM. Exhibit 3-20 shows this
structure.

Page 55 of 110 | Drinking Water Systems
INDEPENDENT ENGINEERING INSPECTION OF THE DC WATER WASTEWATER AND WATER SYSTEMS
Exhibit 3-20 Enterprise Asset Management Program Governance
In addition, the EAMP defines a clear AM policy, which declares the following principles for DC Water’s AM
program.
• Customer Focused by meeting levels of service based on ratepayer and community preferences.
• Whole Life-Cycle Based by considering asset resource and financial requirements from planning, design, construction/acquisition and commissioning, through operation, maintenance and renewal, to retirement and disposal.
• Sustainable and forward-looking by considering social, environmental and financial aspects in present and future service commitments.
• Transparent and defensible by using formal, consistent, scalable, and repeatable approaches.
• System-View by managing assets as interrelated components in a unified system rather than as stand-alone assets.
• Innovative by continually improving asset management processes and procedures using innovative tools, techniques and solutions.
• Reliability-Focused by understanding consequences of asset failure and implementing appropriate maintenance processes to reduce likelihood of asset failure.
• Regulatory-Driven by ensuring compliance with laws, regulations, permits, Consent Decrees, Administrative Orders and other legal requirements.
• Managed Risk by directing resources and priorities to achieve established levels of service while minimizing life cycle costs at an acceptable level of risk.

Page 56 of 110 | Drinking Water Systems
INDEPENDENT ENGINEERING INSPECTION OF THE DC WATER WASTEWATER AND WATER SYSTEMS
AM is being implemented across the DC Water organization in planning, operational, and maintenance
functions. Organizationally, the Linear Asset Manager (within Water Services) is responsible for the linear
(distribution and collections) assets; however, similar functions exist in the Department of Distribution and
Conveyance, and in the Wastewater Treatment Plant Operations. Additionally, the Department of
Engineering and Technology is largely responsible for the strategic planning for these implementations.
In implementing its asset management program, DC Water has performed extensive inventory of its
infrastructure. It has performed condition assessments of the systems and assets it operates and
maintains. They know where assets are and are continually improving this information based upon real
world data collection performed by its operations and maintenance staff. The organization is continually
pursuing and evaluating tools and software systems that further its capabilities to perform these duties. In
doing so, DC Water has integrated its enterprise asset management software into mobile and vehicular
applications that enhance its AM data collection abilities. Throughout numerous interviews with managers
at all levels of the organization, the AM program, software, scheduling capabilities, and analytics enabled
by its systems were cited as improvements and initiatives that enhance DC Water’s abilities to achieve
peak performance.
One excellent example of an AM initiative cited during interviews is that DC Water is currently undertaking
efforts to achieve maintenance in ways that ensure the continued operation of critical infrastructure while
also modeling capital effectiveness. In interviews with management, reliability centered maintenance
(RCM) for critical assets was cited as an example of an initiative that will yield operational efficiencies and
improve service levels.
Other initiatives include pioneering the use of innovative inspection technologies (e.g., SewerBatt, MTA
Pipe-Inspector, drones) and working with contractors to conduct specialty inspections, and condition
assessments (e.g., radar, Redzone Robotics).

INDEPENDENT ENGINEERING INSPECTION OF THE DC WATER WASTEWATER AND WATER SYSTEMS
Page 57 of 110 | Wastewater Systems
SECTION 4 WASTEWATER SYSTEMS
4.1 OVERVIEW
DC Water provides regional wastewater treatment and collection services to the District of Columbia
and for wholesale customers in adjacent Maryland and Virginia Counties. DC Water’s wastewater
service area is shown graphically in Exhibit 4-1. This service area is stable geographically with no
significant expansion foreseen.
Collected wastewater is conveyed to DC Water’s Blue Plains Advanced Wastewater Treatment Plant
(Blue Plains) located in Southeast D.C. near the confluence of the Anacostia and Potomac Rivers. The
Plant is located between Bolling Air Force Base and the Woodrow Wilson Bridge. Collection of
wastewater is conveyed, largely by gravity, through a complex system of pipes and tunnels, which can
exceed 100-years in age, 12 feet in size, and by nine wastewater pumping stations. Wastewater from
areas in Virginia and Maryland is conveyed via the Potomac Interceptor, the Anacostia Interceptor and
the Rock Creek Interceptor. Treatment at Blue Plains includes liquid processes and residual solids
processing. Blue Plains organization and management, as well as this report, are loosely based on
these processes.
DC Water’s Clean Rivers Project manages the Long Term Control Plan (LTCP) and is reviewed in
Section 5 of this report. The combined sanitary and storm collection system located within the older
communities of Washington DC are largely funded by the District and not supported by wholesale
customers outside the District of Columbia.
Exhibit 4-1: DC Water Wastewater System Service Area
Source: DC Water

INDEPENDENT ENGINEERING INSPECTION OF THE DC WATER WASTEWATER AND WATER SYSTEMS
Page 58 of 110 | Wastewater Systems
4.2 WASTEWATER AGREEMENTS
DC Water is party to agreements pertaining to wastewater collection and treatment. These contracts,
are summarized in Exhibit 4-2.
Exhibit 4-2: Wastewater Agreements
Agreement Date
Signed
Parties
Potomac Interceptor
Agreement
1963 • The Authority
• Dulles International Airport
• Department of Navy
• National Park Service
• Town of Vienna
Chesapeake Bay
Agreement
1983 • District of Columbia
• Maryland
• Pennsylvania
• Virginia
• U.S. Environmental Protection Agency
• Chesapeake Bay Commission
Blue Plains
Intermunicipal
Agreement (IMA)
2013 • The Authority
• Fairfax County, VA
• Montgomery County, MD
• Prince George’s County, MD
• Washington Suburban Sanitary
Commission
Loudon County
Sanitation Authority
Agreement
1998 • The Authority
• Loudoun County Sanitation Authority
Most wholesale customers in Virginia and Maryland are allocated a predetermined share of the operating
and capital costs based upon the IMA. A few smaller users of the Potomac Interceptor Agreement pay
through rates that are reconciled and adjusted at three-year intervals. Descriptions of the various
agreements were previously provided in the 2013 Assessment.

INDEPENDENT ENGINEERING INSPECTION OF THE DC WATER WASTEWATER AND WATER SYSTEMS
Page 59 of 110 | Wastewater Systems
4.3 BLUE PLAINS ADVANCED WASTEWATER
TREATMENT PLANT
Blue Plains is the largest wastewater treatment plant in the metropolitan Washington region and is the
largest advanced wastewater treatment plant in the world. In its 80-year history, Blue Plains has undergone
a number of treatment upgrades and advances while expanding both the quality of treatment and the area
of the metropolitan area served. According to the Metropolitan Washington Council of Governments,
approximately 48 percent of the region’s current wastewater treatment capacity is at Blue Plains, serving
millions of residents, businesses, and visitors in its multi-jurisdiction service area that includes the District
of Columbia and significant portions of Montgomery and Prince George’s Counties in Maryland and Fairfax
and Loudoun Counties in Virginia.
Blue Plains has undergone a state of rapid change in treatment and energy recovery enhancements as
significant construction has occurred to meet NPDES permit and Chesapeake Bay Agreement-related
process improvements. These projects are described in more detail and subsequent sections of this report.
Exhibit 4-3 shows the treatment facility layout for Blue Plains.
Exhibit 4-3: Blue Plains Wastewater Treatment Plant Facility Layout

INDEPENDENT ENGINEERING INSPECTION OF THE DC WATER WASTEWATER AND WATER SYSTEMS
Page 60 of 110 | Wastewater Systems
4.3.1 PERMIT COMPLIANCE
Blue Plains operates and subsequently discharges treated effluent into the Potomac River under an
NPDES permit executed September 30, 2010. The 2010 NPDES permit expired on September 30, 2015
but has been administratively extended. A Public Notice Draft Fact Sheet for Permit # DC0021199 was
released September 1, 2017. This new permit will be effective 30 days after final determination, if no
petition for review by the Environmental Appeals Board is filed within 30 days after receipt of the final
determination. Interviews with the Wastewater Treatment Operations personnel on March 2, 2018
confirmed that DC Water is in compliance with its current permit requirements.
The 2010 NPDES permit established discharge limits for the DC Water’s two outfalls at Blue Plains in
accordance with the provisions and implementing regulations of the Federal Water Pollution Control Act
(Clean Water Act, or CWA). The permit standards governing the discharge are among the most stringent
effluent limits.
The Clean Water Act prohibits discharges to United States waters that are not authorized under an NPDES
permit. NPDES permits set numerical discharge limits and establish mandated action schedules for
treatment plants to meet requirements. Permits also require monitoring and monthly Discharge Monitoring
Reports (DMR) be submitted to EPA. In DC Water’s case, when a permit violation occurs, the incident is
reviewed by the EPA Region III, which will require compliance and could resort to punitive measures.
DC Water has performed well, meeting Blue Plains’
NPDES permit requirements and receiving recognition from
the National Association of Clean Water Agencies
(NACWA). NACWA recognizes water agencies for their
NPDES compliance. DC Water received a Platinum Award
in 2016, following five consecutive years’ compliance. The
Platinum Award (pictured at right) is the highest award by
NACWA.
Blue Plains’ two outfalls are regulated by the NPDES
permit. The permit requirements are designed to make
allowances for Combined Sewer System Flow (CSSF)
instances. Outfall 002 discharges effluent that has passed
through complete treatment at Blue Plains; whereas, outfall
001 is designated as an approved CSO-related bypass in
the NPDES permit. During Dry Weather Flow (DWF), only
Outfall 002 is utilized. Construction of the Enhanced
Clarification Facilities, as well as upgrades to the
Nitrification and Denitrification Facilities, was addressed in
the permit with flow limits during construction at Outfall 002.
The flow requirements of the 2010 NPDES permit are detailed in Exhibit 4-4 for Outfall 002 and Exhibit 4-
5 for Outfall 001. These permit limits are the flow metrics used for this review of the 2013-2017 period of
DC Water’s operations.
Image: DC Water File

INDEPENDENT ENGINEERING INSPECTION OF THE DC WATER WASTEWATER AND WATER SYSTEMS
Page 61 of 110 | Wastewater Systems
Exhibit 4-4: Blue Plains Outfall 002 Permit Requirements
Flow Condition and Period Times Measured Influent Flow Rates to
Receive Complete Treatment
A. DWF All times Up to and including 511 mgd
B. CSSF
1. From Effective date of permit and
following placing ECF in operation
unless otherwise authorized or
approved by EPA.
First 4 hours
After 4 hours
Up to and including 555 mgd and
Up to and including 511 mgd
2. Until Completion of Nitrification
Denitrification Facilities upgrade, but no
later than March 1, 2011.
First 4 hours
After 4 hours
Up to and including 511 mgd and
Up to and including 450 mgd
3. During Construction of
Improvements to existing nitrogen
removal facilities, period(s) to be
determined by permittee and EPA from
completion of design and construction
schedules.
First 4 hours
After 4 hours
Up to and including 511 mgd and
Up to and including 450 mgd
4. During Construction of the ECF and
tie-ins to the existing facilities. Periods
to be determined by permittee and EPA
from completion of design and
construction schedules.
First 4 hours
After 4 hours
Up to and including 511 mgd and
Up to and including 450 mgd

INDEPENDENT ENGINEERING INSPECTION OF THE DC WATER WASTEWATER AND WATER SYSTEMS
Page 62 of 110 | Wastewater Systems
Exhibit 4-5: Blue Plains Outfall 001 Permit Requirements
Flow Condition and Period Times Measured Flow Rates for
Outfall 001
A. DWF All
times
No discharge approved
B. CSSF
1. From Effective date of permit and lasting until
ECF is placed in operation
All
times
Up to and including 225 mgd above
rates to receive complete treatment
under Part 1B for Outfall 002
2. Following ECF being placed in operation, for
emptying BPT under an operating routine that
provides for:
All
times
ECF to treat up to 225 mgd with
controlled diversion of effluent to
main plant to maintain a rate of 511
mgd.
a. Conveying flow from BPT through the ECF or
transfer to complete treatment;
b. Regulating the discharge of ECF effluent to
maintain a rate of 511 mgd through complete
treatment while optimizing conditions to maintain
the availability of the storage volume in the BPT
such that the occurrence of CSO is minimized;
c. No discharge of flow from BPT from Outfall
001 when DWF conditions exist; and
d. Limiting discharge of ECF effluent from Outfall
001 to a maximum rate of 225 mgd; provided that
any discharge of ECF effluent from Outfall 001
shall not occur except for the purpose of
maintaining the availability of the storage volume
in the BPT to the extent that the occurrence of
CSOs is minimized
The water quality parameters and limits within the 2010 permit include 4,689,000 pounds per year of total
nitrogen (TN). This is equivalent to 4.2 mg/l of TN at 370 mgd average annual flow. Upgrades to the plant
were placed in operation by July 1, 2014 and were in compliance January 1, 2015. By the fall of 2014, the
Enhanced Nitrogen Removal Facility (ENRF) was in operations. Estimated cost for this reduction in TN is
$950 million. Due to the effect of weather on the Nitrification /Denitrification process, the requirements vary
seasonally for Ammonia Nitrogen. The TN limit and other effluent limits are shown in Exhibit 4-6.

INDEPENDENT ENGINEERING INSPECTION OF THE DC WATER WASTEWATER AND WATER SYSTEMS
Page 63 of 110 | Wastewater Systems
Exhibit 4-6: Blue Plains Outfall Permit Requirements
Parameter Limit
Total Nitrogen 4.2 mg/L
Carbonaceous Biochemical Oxygen Demand 5.0 mg/L
Total Suspended Solids 7.0 mg/L
Total Phosphorus 0.18 mg/L
Ammonia Nitrogen (NH3-N) {seasonal limits}:
5/1 - 10/31 4.2 mg/L
11/1 - 2/14 11.1 mg/L
2/15 - 4/30 12.8 mg/L
Dissolved Oxygen 5.0 mg/L
Total Chlorine Residual 0.02 mg/L
pH 6.0 - 8.5
DC Water’s NPDES permit includes sections with detailed information on meeting the stipulated
requirements. These sections relate to pretreatment, standard sludge conditions,
chlorination/dechlorination, stormwater management, and BOD reduction. The permit also covers
monitoring and operations for different flow conditions with respect to each outfall, scenarios for dealing
with various phases of construction, parameters and monitoring requirements for the Northeast Boundary
Swirl Facility discharge into the Anacostia River. Specific reporting requirements for public accountability
are included in the permit for the combined sewer system, nine minimum controls (NMC) program, water
quality-based requirements for CSOs, the long term control plan, and CSO status reports and schedules.
General conditions in DC Water’s NPDES permit outline the duty to comply with the permit and penalties
for violations of permit conditions. Subjects dealing with toxic pollutants, oil and hazardous substances,
endangered species, and other liability issues are also described in the permit. Operation and Maintenance
of Pollution Controls is specifically covered in the permit under the following topic areas:
• Proper operation and maintenance
• Bypass of treatment facilities
• Upset conditions
There are detailed explanations of definitions and specific actions necessary in handling these areas of
operation and maintenance. There is also a section that covers the specifics on Monitoring and Records.
Details are given under the following topic headings:
• Representative sampling
• Flow measurements
• Monitoring procedures
• Reporting of monitoring results
• Monitoring and analytical equipment maintenance
• Analytical quality control
• Additional monitoring by the permittee
• Retention of records
• Record contents
• Inspection and entry

INDEPENDENT ENGINEERING INSPECTION OF THE DC WATER WASTEWATER AND WATER SYSTEMS
Page 64 of 110 | Wastewater Systems
The Authorization to Discharge under the NPDES permit #DC0021199 is a very comprehensive control for
flow and water quality addressing Outfalls 001 & 002. The permit is structured like other NPDES permits,
with specific stipulations and tiered compliance for Blue Plains operations based on the Consent Decree
and Chesapeake Bay Agreement.
The Blue Plains treatment facilities are meeting or exceeding the permit and reporting requirements
consistently, as evidenced by the NACWA Platinum Award. It is expected that DC Water will continue to
comply with the NPDES permit requirements by following through on schedule with the planned
rehabilitation, replacement and other capital improvements. Exhibit 4-7 shows how the NPDES TN limit is
consistently meet by Blue Plains.
Exhibit 4-7: Effluent Total Nitrogen Loads
With the many capital improvements planned and under way a significant amount of attention is dedicated
in improvements to DC Water facilities. It is therefore important that operations and maintenance needs are
not neglected. DC Water appears to have taken the right steps to keep the plant and facilities in good
working order.
Source: DC Water

INDEPENDENT ENGINEERING INSPECTION OF THE DC WATER WASTEWATER AND WATER SYSTEMS
Page 65 of 110 | Wastewater Systems
4.3.2 TREATMENT PROCESSES
Exhibit 4-8 below is a graphical representation of the Liquid Processing Treatment Program at Blue Plains.
Each is described in more detail in subsequent sections.
Exhibit 4-8: Blue Plains Treatment Process
4.3.3 WASTEWATER PRETREATMENT REQUIREMENTS
DC Water regulates the quality of the wastewater entering Blue Plains from wholesale and large retail
customers to ensure treatment processes and collection systems are not disrupted and the Plant continues
to comply with its NPDES permit. Pretreatment programs are required and approved by the EPA to ensure
compliance with NPDES federal discharge limitations. DC Water permits and monitors each significant
industrial user that has the potential to discharge dangerous levels of pollutants into the sewer system. DC
Water also monitors permitted commercial wastewater (domestic or industrial) haulers that discharge and
dispose hauled wastewater to the Blue Plains.
DC Water levies fees to cover the costs of DC Water’s pretreatment oversight activities. The pretreatment
group provides permitting, sampling and inspections for designated Industrial Users of the wastewater
system. These pretreatment fees include annual permitting and monitoring fees for industrial users and a
permit fee for wastewater trucked or hauled to Blue Plains. The current pretreatment rates and fees went
into effect July 1, 2012. Fees were last updated in 2003. Exhibit 4-9 lists various fees.

INDEPENDENT ENGINEERING INSPECTION OF THE DC WATER WASTEWATER AND WATER SYSTEMS
Page 66 of 110 | Wastewater Systems
Exhibit 4-9: DC Water Pretreatment Rates and Fees
Industrial Permitting Fees
Permit Initial Fee $2,000
Permit Renew Fee $600
Industrial User Annual Compliance Fees
Significant or Non-Significant Categorical Industrial user
1 Outfall $2,500
2 or more Outfalls $3,500
Significant or Non-Categorical Industrial user
1 Outfall $2,500
2 or more Outfalls $3,500
Non-Significant or Non-Categorical Industrial user
1 Outfalls $550
2 or more Outfalls $700
JMT reviewed the Annual Pretreatment Program Reports which are submitted to EPA by DC Water. The
metrics reported by DC Water in the 2016 report (dated March 27, 2017) indicate 51 Significant Industrial
Users (SIUs) with current Control Documents along with 55 facilities inspected in 2011. Enforcement
metrics indicate active control by DC Water. DC Water reported one SIU in significant non-compliance for
reporting discrepancies in 2016. The non-compliant SIU is located in the WSSC service area. JMT
considers the pretreatment program to be managed and funded adequately. The coordination between the
pretreatment programs at DC Water and the wholesale user agencies of the Inter-Municipal Agreement is
compliant and timely.
4.3.4 CONDITION ASSESSMENT AND PLANNED IMPROVEMENTS
DC Water has assessed the Blue Plains facilities for conditions and rehabilitation needs. This information is
used to initiate and/or prioritize projects within the 10-year rolling capital improvement plan (CIP). The 2018
Independent Consulting Engineer Assessment confirms the status of projects that have been completed
and initiated since the 2013 Assessment. The following paragraphs below integrate information obtained
during DC Water personnel interviews, site inspections by JMT engineering staff and the DC Water FY
2017 – FY 2026 CIP.
DC Water categorizes the capital projects at Blue Plains into four program areas:
• Liquid processing
• Plantwide
• Solids Processing
• Enhanced Nitrogen Removal Facilities

INDEPENDENT ENGINEERING INSPECTION OF THE DC WATER WASTEWATER AND WATER SYSTEMS
Page 67 of 110 | Wastewater Systems
4.3.5 LIQUID PROCESSING PROGRAM
4.3.5.1 PRELIMINARY TREATMENT PROCESSES AND FACILITIES
The preliminary treatment process employed at Blue Plains includes:
• Raw wastewater pumping
• Screening
• Grit removal
Wastewater flow collected from parts of Maryland and Virginia suburbs is delivered to two raw wastewater
pump stations (RWWPS1 and RWWPS2) by the Main (sometimes called Bolling) Outfall Sewer, the
Potomac Combined Outfall, and the Potomac Sanitary Outfall sewers. Raw wastewater also enters the
plant though the Upper and Lower Oxon Run sewers.
A system of interconnecting conduits ahead of the two pump stations (including the Equalizing Conduit
inside the fence line) enables each station to receive its intended share of the total load. During preliminary
treatment, incoming pumped raw wastewater is screened as it passes through coarse bar screens.
Following screening, the wastewater is pumped to aerated grit chambers that accelerate the settling of grit
for collection and disposal. While the heavier grit settles, lighter organic solids remain in suspension for
removal later in the treatment process. Screened material and grit are collected and trucked to a permitted
landfill for disposal. Following preliminary treatment, the effluent wastewater proceeds to primary treatment
where more suspended solids and some BOD are removed.
The preliminary processes are split during dry weather between the east side and west side. During peak
wet weather flows, the west side screens and grit removal facilities treat a constant 280 mgd, while the east
side screens and grit removal facilities treat up to 780 mgd. Once the TDPS/ECF is operational, these
processes will assume a less stressful and higher performing wet weather capacity split with the 225 mgd
ECF, for a total plant capacity of 555 mgd for the first 4 hours of wet weather, with capacity for 511 mgd
thereafter. This mode of operation provides a higher level of treatment to the wet weather discharge, made
possible by the combined storage of the tunnel system and the added treatment capacity of the ECF.
Condition Assessment
During the intervening years between the 2013 Assessment and 2018 Assessment, DC Water completed
numerous projects to rehabilitate and replace screening and grit removal. JMT inspected the preliminary
treatment processes that have been upgraded and reviewed the on-going construction activities on March
2 and 5, 2018. The operational units are well maintained and performing within permit limits. Exhibit 4-10
details the projects under construction:

INDEPENDENT ENGINEERING INSPECTION OF THE DC WATER WASTEWATER AND WATER SYSTEMS
Page 68 of 110 | Wastewater Systems
Exhibit 4-10: Preliminary Treatment Processes and Facilities CIP Projects
Project ID Project Title Cost Timeline
IZ Replace/Upgrade Influent Screens $81.2M Completion FY 2032
OZ Grit Chamber Building 1 & 2 –
Upgrades
$15.2M Completion FY 2028
UD Raw Wastewater Pump Station #1
– Rehabilitate pumps and related
pumping equipment.
$15.8M Completion Expected
Dec 2017
BC Headworks Influent Structures $12.1M Completion FY 2023
BP Structural and Architectural
Upgrade of Grit Building (Phase II)
$0.5M Completion FY 2019
Construction activities conform to DC Water standards and procedures.
4.3.5.2 PRIMARY TREATMENT PROCESSES AND FACILITIES
The primary treatment processes and facilities are designed and constructed to remove particles from
wastewater by exploiting the differences in density between the particles and water. The primary treatment
processes and facilities at Blue Plains include oils/grease/scum separation and primary sedimentation.
Two separated primary treatment “trains” are in use at Blue Plains and are designated as the west side
primary process and an east-side primary process, which total 36 primary sedimentation tanks.
Each tank is equipped with solids collection rakes to collect denser, settled wastewater solids. Scum
skimming devices are used in each basin to collect the lighter, floatables from the wastewater surface. To
enhance the settling properties of wastewater suspended solids, metal salts are added to enhance
coagulation of suspended solids. Adding metal salts, such as Ferric Chloride, has the added benefit of
precipitating phosphorous from the wastewater. Phosphorus removal is a requirement of the Blue Plains
NPDES discharge permit.
Following primary treatment, the effluent is conveyed to the secondary treatment processes where
biological processes reduce the BOD in wastewater. Primary solids (or sludge) settled in the primary
sedimentation tanks are pumped to grit removal facilities. Following primary sludge degritting, the sludge is
then pumped to the gravity thickeners and combined with other sludges produced throughout Blue Plains
for treatment.
Condition Assessment
DC Water projects have been completed and are under construction for primary facilities. Additional
projects are scheduled to start construction after 2018. These projects will continue to improve the
condition of the primary sedimentation basins. Exhibit 4-11 provides a tabular list of primary treatment
projects and their status.

INDEPENDENT ENGINEERING INSPECTION OF THE DC WATER WASTEWATER AND WATER SYSTEMS
Page 69 of 110 | Wastewater Systems
Exhibit 4-11: Primary Treatment and Facilities CIP projects
Project ID Project Title Cost Timeline
I7 Primary Treatment 20-Yr Rebuild $54.6M Completion FY 2028
BQ Primary Treatment Facilities Phase II $33.7M Completion FY 2023
B6 Primary Sedimentation Tank Covers $43.6M Completion FY 2028
B7 Primary Tank Odor Scrubbers $45.9M Completion 2032
J2 Replace/Upgrade Primary Treatment
Mech.
$22.7M Completion 2031
The Primary Treatment Processes and Facilities review was performed on December 19, 2017. There
were no additional improvement needs identified and the existing facilities and equipment were operational.
The structural repairs to the Sedimentation Basins (Project BQ) are structurally sound and larger, future
structural rehabilitation work will provide on-going infrastructure stability.
Senior Blue Plains staff anticipates that the preliminary facilities will be in excellent operational order for the
next 10-15 years in keeping with the CIP schedule.
4.3.5.3 SECONDARY TREATMENT PROCESSES AND FACILITIES
The secondary treatment facilities include:
• Step-feed Aeration Basins (Reactors) • Secondary Sedimentation Basins
• Activated Sludge Return System • Waste Sludge Pumping System
• Secondary Blower Facility
Secondary treatment begins as a biological wastewater treatment process that converts dissolved or
suspended materials into relatively dense flocs that can be separated and settled from the water being
treated. Blue Plains uses a modified-aeration step-feed activated sludge process that produces a
wastewater mixed liquor that flows to the secondary sedimentation basins for settling and separation.
Oxygen is supplied to each reactor to support growth of microorganisms which biologically act to consume
suspended and dissolved wastes from the wastewater. The secondary treatment process is an important
step to remove the majority of BOD and remaining suspended solids from wastewater to meet Blue Plains’
NPDES Permit.
The secondary treatment process is divided into a west process train and an east process train, each
receiving effluent from the respective west and east side primary sedimentation basin trains. The settled
mixed liquor in the secondary sedimentation basins constitutes a sludge that is pumped to two different
locations. A large percentage of the pumped sludge (activated sludge) is recycled back to the reactors with
the goal to maintain a desirable concentration of microorganisms. The smaller, remaining percentage of
sludge (waste sludge) is pumped to the plant’s dissolved air flotation thickeners for treatment and disposal.
See the section on Solids/Biosolids Treatment Facilities for a description of the solids treatment processes.

INDEPENDENT ENGINEERING INSPECTION OF THE DC WATER WASTEWATER AND WATER SYSTEMS
Page 70 of 110 | Wastewater Systems
Condition Assessment
DC Water completed projects that remedied some of the structural and mechanical components of the
secondary treatment facilities. Exhibit 4-12 provides a tabular list of projects, which address the continual
renewal of the secondary process.
Exhibit 4-12: Secondary Treatment Process and Facilities CIP Projects
Project ID Project Title Cost Timeline
TO Secondary Treatment Facilities – Structural
rehabilitation of West basins 1-12, improvements to
scum and solids collection equipment (all 24 basins),
overflow troughs and weirs were replaced.
$70.6M Completed FY 2016
PD Secondary East & West Upgrade $9.6M Completion FY 2024
PE Nitrification Reactor/Sediment Upgrades $10.4M Completion FY 2020
4.3.5.3.1 NITRIFICATION/DENITRIFICATION PROCESSES AND FACILITIES
The nitrification/denitrification processes and facilities enable the removal of biological nitrogen. Biological
nitrogen removal is an aerobic process whereby bacteria convert ammonia nitrogen to nitrate nitrogen.
Denitrification uses a different class of bacteria that thrives in an anaerobic environment and converts
nitrite or nitrate ions to nitrogen gas bubbles. The bubbles attach to the biological flocs that buoy the floc to
the surface of the secondary clarifiers.
Effluent from the secondary treatment process flows into a flow distribution basin at the head of the
nitrification/denitrification reactors. Lime or sodium hydroxide is added to the distribution basin to maintain
desired levels of alkalinity. The effluent is distributed to a set of 12 nitrification/denitrification reactors that
are differentiated by odd/even numbering. Nitrification/denitrification is accomplished by a suspended
growth biological system. Each of the 12 reactors has five stages; nitrification takes place in the first three
stages and denitrification in the last two. The conversion of nitrate to nitrogen gas in the denitrification
process requires methanol as a supplemental carbon source in the reaction. Turbine aerators in each
stage of the reactors keep dissolved oxygen at desired levels and provide mixing to ensure uniform
distribution of solids.
The mixed liquor from the nitrification/denitrification reactors flows to 24 sedimentation basins, also
differentiated by odd/even numbering. Waste-activated solids that settle in the sedimentation basin are
recycled back to the reactors to maintain optimal biological activity. Excess biological solids are pumped to
the plant’s dissolved air flotation thickeners for treatment and disposal.
Condition Assessment
DC Water has completed projects. Exhibit 4-13 provides a tabular list of projects, which have improved the
nitrification/denitrification facilities required to meet Total Nitrogen permit limits.

INDEPENDENT ENGINEERING INSPECTION OF THE DC WATER WASTEWATER AND WATER SYSTEMS
Page 71 of 110 | Wastewater Systems
Exhibit 4-13: Nitrification/Denitrification Process and Facilities CIP
Project ID Project Title Cost Timeline
E9
(TN/WW)
ENR Facilities Upgrades – Expands existing
nitrification/denitrification facility for additional
Biological Nitrogen removal.
$272.8M Completion FY 2020
BR Nitrification/Denitrification Facility $52.0M Completion FY 2023
BI Enhanced Nitrogen Removal - North $75.1M Completion FY 2020
E8 Enhanced Clarification Facilities $218.1M Completion FY 2020
EE
(TN/WW)
Centrate Treatment Facilities – de-ammonification of
recycle sludge centrate stream.
$108.5M Completion FY 2021
The March 2, 2018 plant inspection reviewed the completed facilities and the operation and maintenance
practices. The equipment was operational with no major repairs in process with respect to failed
equipment. Housekeeping and safety conditions were excellent.
4.3.5.4 MULTIMEDIA FILTRATION AND DISINFECTION
The final stage of treatment for Blue Plains’ effluent prior to discharge into the Potomac River is tertiary
treatment comprised of filtration, disinfection, and chlorine removal. The treated plant flow is filtered
through sand and anthracite in the world’s largest wastewater filtration facility. The flow is disinfected with
sodium hypochlorite-based chlorination at the filter influent, and the residual chlorine is removed before
discharge with sodium bisulfite. The final plant effluent has the same basic parameters as drinking water
with the exception that the disinfectant (chlorine) is removed as the flora and fauna within the river do not
require the chlorine residual required for public drinking water systems.
The filtration process includes multimedia filtration of effluent from the nitrification and denitrification
process. The filtration facility consists of 40 granular sand and anthracite filters. The final effluent filters are
part of the process which allows Blue Plains to meet NPDES permit limits for phosphorous. Filters are
routinely backwashed to remove clogging and solids from the filter media. Filter backwash is sent to the
gravity thickeners for biosolids treatment.
The disinfection process begins in four disinfection tanks located beneath the 40 multimedia filters.
Gaseous Chlorine is mixed with water and then injected into the disinfection tanks where sufficient contact
time deactivates microbes. The disinfected water is then cleansed of the chlorine prior to discharge into the
Potomac River.
DC Water will complete projects that would improve the Filtration and Disinfection facilities. These have
been long term projects, first reported in the 2008 Assessment. Exhibit 4-14 provides a tabular list of the
two on-going Filtration and Disinfection projects.

INDEPENDENT ENGINEERING INSPECTION OF THE DC WATER WASTEWATER AND WATER SYSTEMS
Page 72 of 110 | Wastewater Systems
Exhibit 4-14: Filtration and Disinfection CIP Projects
Project
ID
Project Title Lifetime
Cost
Timeline
UC Filtration and Disinfection Facilities upgrades
influent pumps and installs a new air-water
backwash system along improved backwash
automation. This project has been continued based
on results of concrete structures reliability study.
$101.8M Completion FY 2022
BT Filtration and Disinfection Facilities (Phase II) –
provides new electrical building and electrical
switchgear and appurtenances.
$25.0M Completion FY 2022
Condition Assessment
The facilities were visited on March 2, 2018. Construction material was observed being stored adjacent to
the large facility. The visit, during extreme wind conditions, showed that stored material was being
protected from the elements.
4.3.6 SOLIDS HANDLING PROCESS
4.3.6.1 SOLIDS/BIOSOLIDS TREATMENT FACILITIES 4.3.6.1.1 PRIMARY SLUDGE SCREENING, GRIT REMOVAL AND GRINDING
Primary sludge from the West and East Sedimentation processes is pumped through screens to remove
rags and debris from the sludge prior to the grit removal facility.
Condition Assessment
DC Water is planning a project to improve operations of the Primary Sludge Screening, Degritting and
Grinding facilities as reported in the 2013 Assessment. Exhibit 4-15 provides more information on the
project.
Exhibit 4-15: Primary Sludge Screening, Degritting and Grinding CIP Project
Project ID Project Title Cost Timeline
YZ Digestion Facilities Site Preparation – Sub-project
YZ01 – Primary Sludge Screening and Degritting
Wet Well Control – Installation of new controls for
primary sludge screens and degritting and grinding
facility wet well.
$2.3 M Completion
FY 2019
The current state of the Primary Sludge Screening, Degritting and Grinding was inspected and no
improvement needs were observed or discussed during an interview and site visit on March 2, 2018.

INDEPENDENT ENGINEERING INSPECTION OF THE DC WATER WASTEWATER AND WATER SYSTEMS
Page 73 of 110 | Wastewater Systems
The existing Primary Sludge Screening, Degritting and Grinding has remained in service for both of the
biosolids treatment and disposal systems: the Cambi Hydrolysis Process and the back-up Lime
Stabilization process.
4.3.6.1.2 GRAVITY THICKENERS
The gravity thickeners (GT) accept primary sludge from the screened and thickened sludge from the
primary clarifiers. The primary sludge enters a central distribution chamber that distributes the sludge
among GTs in operation. Each GT provides volume and residence time to allow the sludge to settle and
thicken. Each thickener is equipped with a collector mechanism that pushes the thickened sludge toward a
central well where the sludge is collected and pumped to the raw sludge blending tanks. Peripheral weirs
and troughs collect clarified water from the surface of the thickeners and discharge it to the primary
sedimentation effluent.
Condition Assessment
DC Water has completed projects that improved the GTs within the interceding years since the 2013
report. Capital Project BX, Gravity Thickener Upgrades Phase II, has been expanded to rehabilitate and
upgrade the Primary Sludge Screening & Degritting Building (PSSDB) and the Gravity Thickeners (GT).
There are ten GTs. The lifetime cost of Project BX has increased to $70.8M and is scheduled to be
completed FY 2036.
The GTs are performing well within the solids train to the Cambi system for digestion. The rehabilitated
GTs are well maintained.
4.3.6.1.3 DISSOLVED AIR FLOTATION THICKENERS
Blue Plains has eighteen (18) flotation thickeners operationally arranged in groups of three or four units fed
from a common splitter box. The dissolved air floatation (DAF) thickeners thicken biological waste activated
sludge from the secondary sedimentation basins and the nitrification/denitrification sedimentation basins.
The DAF’s also thicken scum from primary sedimentation and gravity thickening processes. Thickened
sludge, oils and grease is pushed into a receiving wet well by collectors where pumps convey it to the
sludge blending tanks.
DAF thickeners are used to thicken biological sludges and oils/grease that are less dense and more difficult
to settle. They use a process of injecting fine bubbles into the influent sludge, the bubbles adhere to the
suspended matter, causing the suspended matter to float to the surface. The “froth” layer containing sludge
and oils/grease is then removed by a skimmer. Clarified water passes beneath a baffle and is recycled to
the wastewater treatment process.
Condition Assessment
DC Water has completed a project that has improved the DAF Thickeners. This project is summarized in
Exhibit 4-16.

INDEPENDENT ENGINEERING INSPECTION OF THE DC WATER WASTEWATER AND WATER SYSTEMS
Page 74 of 110 | Wastewater Systems
Exhibit 4-16: DAF Thickeners CIP Project
Project ID Project Title Cost Timeline
XB Biological Sludge Thickener Facility Upgrades –
Project reduces sludge processing and chemical
costs. Also, handle additional sludge produced by
new nitrification/denitrification processes.
$48.7M Completion
FY 2018
The DAF facilities were inspected on March 2, 2018. As with the entire solids handling train, the facilities
are operational and well maintained. Odor controls are working and maintained on a scheduled routine.
In the past, three DAF thickeners were used to thicken nitrification/denitrification sludge while the remaining
units were used to thicken secondary waste activated sludge. Recently, Blue Plains AWTP has
implemented a new single-stream processing scheme that reduces supplemental carbon (Methanol)
injection for denitrification. The new scheme simplifies the process by sending nitrification/denitrification
sludge to the secondary aeration basins. This reduces supplemental carbon (Methanol) by taking waste
nitrifying/denitrifying bacteria, inserting them into the carbon-rich secondary aeration basins and giving
them a “head start” to remove Nitrogen from the wastewater. The secondary sludge, plus any
nitrification/denitrification sludge settled in the secondary sedimentation basin, and then continues to the
DAF Thickeners for thickening.
4.3.6.1.4 SLUDGE DIGESTION FACILITIES
The Walter F. Bailey Bioenergy Facility, which is now operational, significantly reduces DC Water’s carbon
footprint. The innovative Cambi® thermal hydrolysis process uses intense heat and pressure to treat
wastewater solids producing a much cleaner biosolid and onsite generation of up to one third of Blue
Plains’ electricity needs. This process has resulted in operational efficiencies in electricity, biosolids hauling
and chemicals costs. The upgraded process nearly eliminates the need for lime sludge stabilization. The
process produces Class A Biosolids that expand disposal and reuse options. DC Water maintains the lime
stabilization process that produces Class B biosolids as a redundant process for reliability in processing
biosolids. Exhibit 4-17 illustrates the Cambi Thermal Hydrolysis process.

INDEPENDENT ENGINEERING INSPECTION OF THE DC WATER WASTEWATER AND WATER SYSTEMS
Page 75 of 110 | Wastewater Systems
Exhibit 4-17: Typical Cambi® Thermal Hydrolysis Process
This process has provided DC Water with significant cost savings associated with biosolids treatment and
disposal. The sources of cost savings are listed below:
• Digester Gas (140 million BTU/day) produced by this process is used to create steam (Pepco Energy Services process on-site at Blue Plains) applied to influent sludge that destroys pathogens and enhances digestion and solids reduction.
• Excess digester gas produced can be used to produce up to 13 MW of electricity that can be used to supplement Blue Plains electricity needs.
• DC Water can burn outside supplied natural gas with digester gas, when natural gas rates are competitive, and sell the electricity to Pepco.
• Sludge volume reduction has resulted in significantly reduced hauling costs.
• Class A Biosolids are marketed as Bloom®, a soil amendment (pictured), which recovers solids handling costs through product sales.
• Savings associated with the Cambi Process is expected to exceed operational and debt service costs, although this report did not conduct a cost/benefit analysis.

INDEPENDENT ENGINEERING INSPECTION OF THE DC WATER WASTEWATER AND WATER SYSTEMS
Page 76 of 110 | Wastewater Systems
Condition Assessment
The facilities are in good operational order and are well maintained. Operations and maintenance staff
have been trained on the new facilities.
Performance of the Combined Heat and Power (CHP) facility is closely monitored by DC Water managers
and the board. Exhibit 4-18 has been taken from the Environmental Quality and Operations Committee’s
February 15, 2018 report.
Exhibit 4-18: Blue Plains Monthly Average Electric Energy Consumption and Sources
DC Water is completing the CHP project and is scheduled for completion in FY 2020. Exhibit 4-19
discusses the summary details of that project.
Source: DC Water

INDEPENDENT ENGINEERING INSPECTION OF THE DC WATER WASTEWATER AND WATER SYSTEMS
Page 77 of 110 | Wastewater Systems
Exhibit 4-19: Sludge Digestion CIP Project
Project ID Project Title Cost Timeline
XA New Sludge Digestion (Cambi) Facilities –
Installation of 4 new Cambi Thermal Hydrolysis
trains, new sludge digesters, new sludge screening
facility, belt presses/truck loading and modifications
to existing sludge blending tanks to enhance
flexibility of feed sludge to Cambi System.
$551.5M Completion
FY 2020
4.4 COLLECTION AND CONVEYANCE
DC Water collects and conveys separate and combined wastewater to Blue Plains for treatment. This
includes wastewater generated by jurisdictions included in the IMA, the Potomac Interceptor Agreement
(PIA) and Loudoun Water. Wastewater conveyance systems include: sanitary sewers and combined
sewers and nine sewer pumping stations. In 2016, the first section of an elaborate and sophisticated wet
weather storage tunnel system was placed in service that will convey wet weather sewage to Blue Plains.
DC Water is responsible for operating, maintaining and making improvements to sewer lines serving the
District of Columbia and the major trunk sewers that convey wastewater from the IMA, PIA and Loudoun
Water served communities.
4.4.1 SEWER FACILITIES PLAN
The 2015 Sewer System Facilities Plan was prepared for DC Water by the Engineering Program
Management Consultant. The report’s “Notes to Readers” states:
This Facilities Pan provides a comprehensive evaluation of the DC Water sewer
system infrastructure, which provides collection and treatment for the District of
Columbia, and treatment for parts of suburban Virginia and Maryland. This
Facilities Plan focuses on DC Water’s sewer system pipeline network, pumping
stations, sewer structures, inflatable dams, and outfalls, and presents a strategy for
improvements that will enable DC Water to extend the service life of its sewer
system. This Facilities Plan:
• Outlines the current status of the DC Water sewer system.
• Provides an update of the sewer system inventory.
• Identifies infrastructure improvement needs.
• Presents recommendations for the current operation of the system.
This 2018 Assessment evaluated the efficacy of the Facilities Plan and the measures taken by DC
Water to implement the plan.
INDEPENDENT ENGINEERING INSPECTION OF THE DC WATER WASTEWATER AND WATER SYSTEMS
Page 78 of 110 | Wastewater Systems
4.4.2 SEWER COLLECTION
DC Water collects wastewater from the District, covering 61 square miles. Separate storm water and
sanitary collection systems account for 41 square miles, while a combined storm water and sanitary sewer
collection system covers 20 square miles.
The following lists DC Water’s collection system characteristics in numbers:
• 41 square miles of separate sewage • 20 square miles of combined sewage
• approximately 1,800 miles of sanitary and combined sewers
• 125,000 building laterals
• 22 permanent flow metering stations • 1810 – year sewer system began construction
Like most utilities around the country, DC Water is responsible for lateral sewer connections from the main
sewer to the right-of-way/property lines regardless of the property owner. For large water and sewer users,
DC Water meters each wholesale customer. Each wholesale customer permit/agreement establishes
discharge limits with respect to the average wastewater flow rate and peak wastewater flow rate. Sewers
constructed 50 years ago or more were constructed of vitrified clay, brick, and concrete. More recent,
separated sewer installations use PVC, ductile iron, and concrete for sewer construction. The force mains
are typically constructed of iron, steel, or concrete.
DC Water continues to use the services of an EPMC to manage projects improving the sanitary sewer
system. The mission of the EPMC is to determine sewer system condition, confirm system capacity and
develop new capital projects. A condition and criticality assessment of sewers will result in the most urgent
repairs and rehabilitation taking place first. In turn, this has resulted in efficient and prioritized use of DC
Water money and resources.
The condition of the aged sewer system is typical for a system of this size and age. Because many sewers
date back to the late 1800s, DC Water will need to continually invest in repair, replacement, and
rehabilitation. An average of $51.3M per year will be spent on sewer system improvements over the next
10 years as presented in the FY 2017 – FY 2026 Disbursement Plan. Projects in the CIP are indicative of
DC Water’s efforts to keep the system in good operating condition. Discussions with management indicate
a high level of productivity in conjunction with the Asset Management Program initiative that should
continue to yield efficiencies in this area of business operations. Asset Management is discussed in
Section 3.6.8.
The 2015 Sewer System Facility Plan
This plan is the result of in-depth study of the existing collection facilities, which included sewer inspections
and condition assessments, development of a GIS database, and hydraulic monitoring and modeling to
determine system capacity. Due to time and budgetary constraints, DC Water has limited inspections to
sewers identified as critical due to their location, tendency to be problematic, and criticality in the system.
Sewer conditions were assessed using the National Association of Sewer Service Companies’ (NASSCO)
defect coding system. Uniform and consistent descriptions of pipe defects were accomplished using the
Pipeline Assessment Certification Program (PACP).

INDEPENDENT ENGINEERING INSPECTION OF THE DC WATER WASTEWATER AND WATER SYSTEMS
Page 79 of 110 | Wastewater Systems
This 2018 Independent Engineer’s Review agrees with the Facilities Plan’s findings that though the sewer
pipe infrastructure is sufficient to meet current and future demands, investment and upgrades to the system
are needed.
Targeted performance measures identified and reported in DC Water’s FY2018 Operating Budget indicate
that Sewer Services has been meeting their goals. Since 2008 approximately 28,000 catch basins have
been cleaned annually, 2,200 laterals have been investigated/relieved annually, 424 tons of floatable
debris have been removed from the river annually, 365 sewer lateral have been repaired or replaced
annually, 1,900 linear feet of sewer mains have been replaced annually, and 400 PI meters have been
inspected. However, this productivity could not be verified within this assessment. JMT recommends
establishing the appropriate metrics to track preventive measures against corrective maintenance needs.
As discussed in Section 3.6.8, Asset Management, DC Water has transitioned from corrective maintenance
to an effective proactive maintenance being implemented and performed by a highly motivated staff. This
was apparent through the various interviews conducted over the winter of 2017-2018 as part of this
assessment and in earlier contacts with DC Water personnel during the years between reports.
4.4.3 COLLECTION SYSTEM CIP
DC Water has undergone a comprehensive risk assessment of linear assets to prioritize rehabilitation
projects. The Sanitary Sewer programmed improvements are categorized into five components:
• Collection Sewers
• On-Going
• Pumping
• Program Management
• Interceptor/Trunk Force Sewers
Collection Sewers projects include studies and projects to effectively eliminate stormwater, groundwater,
and other infiltration and inflow to the sewer system; to separate stormwater flows; and to reduce other
extraneous flows to Blue Plains. This category also includes projects to rehabilitate sanitary sewer pipes.
On-going replacement projects include replacements managed by the force account work performed by
Department of Sewer Services.
The FY 2017 – FY2026 10-Year Disbursement Plan totals $104.8M for collection sewers under 20
structures rehabilitation projects. On-Going projects account for $104.1M within 14 active fiscal year
projects.
4.4.4 INTERCEPTOR/TRUNK FORCE SEWER
The aging infrastructure concern is paramount in the interceptor, trunk, and force mains within urban areas
and the District’s original sewers are no exception. Due to their roles within the sewer system, these pipes
are often critical assets, with vulnerabilities and risks greater than those of a typical sewer pipe. The ten-
year disbursement identified in the 2015 Sewer Facilities plan for FY 2017 – FY 2026 totals $228.0M. The
significant project is LZ – Potomac Interceptor – Rehab Phase 2. This regional interceptor is funded mainly

INDEPENDENT ENGINEERING INSPECTION OF THE DC WATER WASTEWATER AND WATER SYSTEMS
Page 80 of 110 | Wastewater Systems
by other jurisdictions with 3.29% funded by DC. The ten-year disbursement for LZ is $38.6M. Project JI –
Oxon Run Sewer rehabilitation has $14.0M allocated within the CIP. The Piney Branch Trunk sewer has
$16.8M allocated.
4.4.5 PUMPING FACILITIES
Nine pump stations convey wastewater to Blue Plains. These pump stations are listed in Exhibit 4-20. The
3rd and Constitution pump station is currently out of service.
Exhibit 4-20: Wastewater Pumping Stations
Facility Date Installed Installed Capacity
Main
1905 300 mgd (Sanitary)
480 mgd (Stormwater)
Poplar Point 1915 64.8 mgd
Rock Creek 1921 60 mgd
Earl Place 1926 0.86 mgd
O Street
1963 60 mgd (Sanitary)
600 mgd (Stormwater)
Potomac 1965 576mgd
East Side 1967 60 mgd
Upper Anacostia 1970 15 mgd
3rd and Constitution
(out of Service)
1983 7.85 mgd
The combined pumping capacity of these pumping stations is approximately 1150 million gallons per day.
The pumping stations are sized to handle both sanitary and combined sanitary and stormwater flows.
A number of pump stations have recently been upgraded. These upgrades were done in part to meet new
code standards and regulations. The improvements have boosted the efficiency and effectiveness of the
pump stations.
DC Water has completed major pumping station upgrades during the interceding report years. Two
significant upgrades to sewer pumping stations remain active projects. Exhibit 4-21 lists the remaining
upgrades:
Exhibit 4-21: Sewer Pumping Facilities
Project ID Project Title Cost Timeline
MB 3rd St & Constitution Ave NW PS $7.4M Completion FY 2021
PM East Side Pumping Station $4.0M Completion FY 2022
4.4.6 DEPARTMENT OF SEWER SERVICES (DSS)
During the years between independent reporting, DSS was reorganized. The pumping station
(conveyance) responsibilities were combined with the Water System’s pumping station and storage

INDEPENDENT ENGINEERING INSPECTION OF THE DC WATER WASTEWATER AND WATER SYSTEMS
Page 81 of 110 | Wastewater Systems
facilities responsibilities. This separate department is the Department of Distribution & Conveyance
Systems. The organizational structure of these departments is presented in Exhibit 4-22.
Exhibit 4-22: Sewer Services Organization Chart
Assistant General
Manager, Customer
Care & Operations
Director, Utility
Services - Sewer
Director,
Distribution and
Conveyance
Systems
Inspection and
Maintenance
(56 positions)
Pumping
Operations
(28 positions)
Construction and
Repair
(54 positions)
SCADA Process
Control
(15 positions)
Maintenance
(33 positions)
Potomac
Interceptor
(5 positions)
DSS is currently responsible for the inspection and maintenance of the sewers and sewer laterals. Another
major responsibility is the construction and repair of sewer mains and stormwater appurtenances. The
managers of DSS were interviewed on February 6, 2018 and provided a comprehensive review of
operations and maintenance metrics according to the Enterprise Asset Management Plan discussed in
Section 3.6.8. DSS employs technologies within the inspection of underground linear assets and performs
construction activities using various trenchless technologies that minimize at grade disruptions within the
District’s R.O.W.s and easements. Presently, DSS is located on the O Street property and plans are
progressing for relocating DSS to new, modern facilities at Ames Place within the District.
Condition Assessment
Confined spaces were not entered for this assessment; however, the general at-grade conditions for large
trunk sewers were inspected during various inspections within the District. B Street/NJ Avenue and Tiber
Creek trunk sewers did not display signs of failure. The frailty of the aging arched sewers was prominent in
discussions with staff and the proper monitoring of conditions is occurring. Earlier in the intervening years,
the Piney Branch Trunk sewer was evaluated by JMT and the CIP addresses the appropriate rehabilitation.

INDEPENDENT ENGINEERING INSPECTION OF THE DC WATER WASTEWATER AND WATER SYSTEMS
Page 82 of 110 | Wastewater Systems
4.4.7 DEPARTMENT OF DISTRIBUTION & CONVEYANCE
SYSTEMS (DDCS)
DDCS is responsible for both water and sewer facilities. The sewer pumping station and wet weather
conveyance responsibilities are addressed in the organizational chart presented in Section 4.4.6.
Interviews and site inspections occurred in March 2018 and previously during the interceding years.
Preventive maintenance for both vertical and linear assets is the responsibility of DDCS. SCADA has
improved as funded by earlier capital projects and the Instrumentation and Controls section is well-trained
and motivated. New monitoring responsibilities for the Combined Sewer Overflow facilities, which are
scheduled to be commissioned at the end of March 2018, have been assimilated into DDCS’s operations
and maintenance. The Potomac Interceptor is operated and maintained by DDCS, along with the metering,
odor control, and easement stewardship for the asset along its alignment in Maryland and Virginia.
4.4.7.1 MAIN & O STREET PUMPING STATIONS
Built in 1905, the Main Pumping Station pumps from the Tiber Creek and B Street/New Jersey Avenue,
which includes flows from the Potomac/Rock Creek system that enter the B Street/New Jersey Avenue
Trunk Sewer, to Blue Plains under the Anacostia River. The pump station has an installed capacity of 300
mgd for sanitary sewer and 480 mgd for stormwater. Firm capacity (with the largest pump out of service) is
240 mgd and 400 mgd for sanitary and stormwater respectively.
The O Street Pumping Station, built next to the Main Pumping Station in 1963, is designed to pump flows
to Blue Plains. One side of the facility pumps storm water while the other side is dedicated to sanitary
pumping. The pumps allocated to sanitary flow pump wastewater from the Southwest Interceptor, whereas
the stormwater side pumps combined flow from the B Street/New Jersey Avenue Relief Sewer to the
Anacostia River. Currently the construction of the new Administrative Headquarters building is occurring at
the pumping station. Access is being properly controlled for operations and maintenance staff to perform
duties. The Main and O Street Pumping stations have had major construction for the Clean Rivers Project
for seven years and DC Water has been adept at coordinating new construction in and around existing
facilities without major disruptions occurring.
Condition Assessment
Field inspections were performed for Potomac PS, Main and O Street PSs, and East Side PS. The stations
are well maintained and, as earlier stated, capital projects have rehabilitated the stations with the East Side
PS scheduled for additional upgrades to facilitate more efficient operations. SCADA equipment is well
maintained at all stations and safety equipment is present and operable.
4.4.7.2 UPPER ANACOSTIA PUMPING STATION
The Upper Anacostia Pumping Station (UAPS), built in 1934, has an installed capacity of 15 mgd and a
firm capacity of 10 mgd. The UAPS was not inspected and was recently rehabilitated.

INDEPENDENT ENGINEERING INSPECTION OF THE DC WATER WASTEWATER AND WATER SYSTEMS
Page 83 of 110 | Wastewater Systems
4.4.7.3 POTOMAC PUMPING STATION
The Potomac Pumping Station, placed in service in 1963, has an installed capacity of 576 mgd and a firm
capacity of 460 mgd. Wastewater from the Potomac/Rock Creek system is pumped via force mains under
the Anacostia River to Blue Plains. The Potomac Pumping Station was recently upgraded. Improvements
included, among other items, replacement of existing screens and gate valve actuators.
4.4.7.4 EASTSIDE PUMPING STATION
The Eastside Pumping Station, brought on line in 1967, has an installed capacity of 60 mgd and firm
capacity of 45 mgd. This station separately pumps wastewater from the Eastside Interceptor Sewer and
transports the material removed by the Northeast Boundary Swirl Facility. As part of the CIP, the Eastside
Pumping Station was replaced FY 2009. No operational deficiencies were observed in March 2018.
4.5 STORMWATER
4.5.1 STORMWATER BACKGROUND
The stormwater sewer system consists of approximately 8,200 catch basins, 600 hundred miles of storm
sewers, over 400 separate storm sewer discharge points, and fifteen stormwater pumping stations; some
of the stormwater sewer facilities exceed 100 years old. DC Water is responsible for maintenance and
replacement of several combined stormwater and sanitary sewer facility discharge points on the Potomac
River, Anacostia River, Rock Creek and other water courses in the District.
In 2000, U.S. EPA Region III issued a Municipal Separate Storm Sewer System (MS4) Permit to the
District of Columbia Government for management of the separate storm sewer system. DC Water was
designated the lead agency responsible for coordination of permit compliance activities with the D.C.
Departments of Public Works and Health. Since inception of the District Department of Energy and
Environment (DDOEE), the District of Columbia’s separate stormwater system has been regulated by an
EPA MS4 permit that ensures compliance with the Clean Water Act. The goal of the MS4 stormwater
NPDES permitting program is to improve the quality of stormwater discharged to water bodies. Currently,
stormwater permits have specific requirements for control and monitoring of discharges from industrial and
construction sites. Some of the results from the MS4 include an Anacostia TMDL Compliance Plan and the
Rock Creek TMDL Compliance Plan estimated at approximately $7 million per year to meet all the
requirements of the permit.
Although DC Water has reduced responsibility for the separate stormwater system other than collecting
fees and transferring those fees to DDOEE, DC Water continues to support other agencies (e.g. DDOT)
that participate in the MS4 taskforce and monitors the impact of other MS4 NPDES requirements on DC
Water and its ratepayers. DC Water continues to operate and repair stormwater pumping stations at
underpasses.

INDEPENDENT ENGINEERING INSPECTION OF THE DC WATER WASTEWATER AND WATER SYSTEMS
Page 84 of 110 | Wastewater Systems
4.5.2 STORMWATER PROJECTS
Stormwater projects are categorized into six components within the CIP:
• Local Drainage
• On-Going
• Pumping Facilities
• DDOT
• Research and Program Management
• Trunk/Force Sewers
The Ten-Year Disbursement Plan (FY 2017 – FY 2026) totals $23.0M. The Lifetime costs total $84.0M.
Selected stormwater CIP projects are listed below in Exhibit 4-23 displaying lifetime costs:
Exhibit 4-23: Stormwater CIP Projects
Project ID Project Cost Schedule
Stormwater Local Drainage $22.8 M
• A6
• GY
• IE
• Lining, 22nd & P Sts., NW
• Storm Rehab @ Various
Locations
• Storm Sewer Rehabilitation 3
• Completed FY
2015
• Completion
2020
• Completion
2026
Stormwater On-going Projects $12.4 M
Various FY
Programs
DSS Stormwater Projects Completion FY 2016 –
FY 2026
Stormwater Pumping Facilities $25.0 M
NG Pump Station Rehab N/A
DDOT Stormwater Projects $3.2 M
Various FY
Programs
DDOT projects Completion FY 2017 –
FY 2019
Stormwater Research and Program Management $12.0 M
AT Stormwater Program
Management
Completion FY 2025
Stormwater Trunk/Force Sewers $15.6 M
BO Future Stormwater Projects Completion FY2020
4.5.3 STORMWATER OPERATIONS AND MAINTENANCE
DSS inspects, cleans, installs, and repairs the 8,200 catch basins and storm mains associated with the
combined sewers. DSS oversees the maintenance program for stormwater structures, filter bio-retention
and water quality and catch basins.

INDEPENDENT ENGINEERING INSPECTION OF THE DC WATER WASTEWATER AND WATER SYSTEMS
Page 85 of 110 | Wastewater Systems
During the DSS managers’ interviews on February 6, 2018, a comprehensive review of the asset
management records was conducted. The productivity metrics were highly valued by staff. DSS has
undergone an analysis of their catch basin cleaning protocols, discovering that mechanical cleaning is
more efficient and environmentally sound than comparable flushing and vacuuming methodologies and
equipment favored throughout the industry. The capturing of the debris and sediment is more complete and
doesn’t cause a flushing of material downstream while cleaning the catch basin. A major drawback to
vacuuming is the depth of many catch basins, which negate the ability to maintain suction to vacuuming
equipment. This is anecdotal to DC Water’s overall approach to operational research and development,
which provides innovation to the water and wastewater industry.
4.5.4 FINDINGS
DSS approaches stormwater management responsibilities in a professional manner. The environmental
aspects of their mission and O&M protocols are a source of pride. Productivity levels are steady and meet
the stipulated requirements.

INDEPENDENT ENGINEERING INSPECTION OF THE DC WATER WASTEWATER AND WATER SYSTEMS
Page 86 of 110 | Clean Rivers Project
SECTION 5 CLEAN RIVERS PROJECT
5.1 OVERVIEW
DC Water entered into a Consent Decree with the EPA in March 2005 for the Combined Sewer Overflow
Long Term Control Plan (CSO-LTCP). The objective of the 2005 Consent Decree is to ensure DC Water’s
compliance with the Clean Water Act, all applicable federal and local regulations, the terms of DC Water’s
National Pollution Discharge Elimination System (NPDES) permit, and the 1994 EPA CSO objectives. To
meet these objectives the Consent Decree contains compliance requirements, milestone and completion
timelines, and reporting requirements. The requirements included in the consent decree and their current
statuses are summarized below in Exhibit 5-1. In the interceding 12 years between the establishment of
the CSO-LTCP and the present, DC Water has achieved a majority of the milestones and has aggressively
pursued the planning, financing, design and construction of the remaining requirements in accordance with
the multi-year schedule for the CSO-LTCP. The modified Consent Decree discussed in Section 5.2 has
placed more emphasis on Green Infrastructure (GI) to meet the goals of the CSO-LTCP.
Exhibit 5-1: Status of Clean Rivers Compared to Amended LTCP Consent Decree (As of March 8, 2018)
Amended Consent
Decree Item Requirements Status
System Wide Low Impact Development –
Retrofit (LID-R) Implement LID-R projects on WASA facilities where feasible. Complete
Anacostia River
Rehabilitate Pumping
Stations
Rehabilitate existing pumping stations:
• Rehabilitate Main Pumping Station to 240 mgd firm sanitary capacity.
• Rehabilitate Eastside and ‘O’ Street Pumping stations to 45 mgd firm sanitary capacity
Complete
Storage/Conveyance Tunnel
from Blue Plains to CSO 019
Minimum 105 million gallon storage tunnel between Blue Plains and
CSO 019
Constructed, to be placed in
operation March 23, 2018
Northeast Boundary
Storage/Conveyance Tunnels
Storage/Conveyance Tunnel in Northeast Boundary and First Street
Branch Tunnel in area of First Street NW and Rhode Island Ave. The
total system storage of these tunnels and Storage/Conveyance Tunnel
from Blue Plains to CSO 019 shall not be less than 157 million gallons.
First Street Tunnel is completed
and Northeast Boundary Tunnel
is under construction
M Street (CSO 016 and 017)
and CSO 018 Diversion
Sewers
Consolidate the following CSOs in the Anacostia Marina area:
CSO 016, 017 and 018 Complete
Separate CSO 006 Separate this CSO in the Fort Stanton Drainage Area Complete
Poplar Point Pumping Station Replace the existing Poplar Point Pumping station with a new facility Constructed, to be placed in
operation March 23, 2018
Rock Creek
Separate Luzon Valley Separation was completed in 2002 Complete
Separation Separate CSOs 031, 037, 053, and 058. Complete
Monitoring at CSO 033, 036,
047 and 057
Conduct monitoring to confirm prediction of overflows. If overflows
confirmed, then perform the following:
Regulator Improvements: Improve regulators for CSO 033, 036, 047
and 057
Complete
Rock Creek Green
Infrastructure Project 1
Control 20 impervious acres to the 1.2” retention standard using green
infrastructure and targeted sewer separation In progress

INDEPENDENT ENGINEERING INSPECTION OF THE DC WATER WASTEWATER AND WATER SYSTEMS
Page 87 of 110 | Clean Rivers Project
Amended Consent
Decree Item Requirements Status
Rock Creek Green
Infrastructure Project 2
Control 75 impervious acres to the 1.2” retention standard using green
infrastructure and targeted sewer separation Not started
Rock Creek Green
Infrastructure Project 3
Control 90 impervious acres to the 1.2” retention standard using green
infrastructure and targeted sewer separation Not started
Rock Creek Green
Infrastructure Project 4
Control 90 impervious acres to the 1.2” retention standard using green
infrastructure and targeted sewer separation Not started
Rock Creek Green
Infrastructure Project 5
Control 90 impervious acres to the 1.2” retention standard using green
infrastructure and targeted sewer separation Not started
Potomac River
Rehabilitate Potomac
Pumping Station Rehabilitate station to firm 460 mgd pumping capacity Complete
Potomac Storage Tunnel 30 million gallon storage tunnel for CSO 020, 021, 022 and 024 NEPA documentation and
Facility Planning underway
CSO Outfall Separation Separate CSO 025 and 026 Not started
Potomac Green Infrastructure
Project 1
Control 44 impervious acres to the 1.2” retention standard using green
infrastructure and targeted sewer separation In progress
Potomac Green Infrastructure
Project 2
Control 46 impervious acres to the 1.2” retention standard using green
infrastructure and targeted sewer separation Not started
Potomac Green Infrastructure
Project 3
Control 43 impervious acres to the 1.2” retention standard using green
infrastructure and targeted sewer separation Not started
Blue Plains Wastewater Treatment Plant
Wet Weather Treatment
Improvements Tunnel Dewatering Pumping Station and Enhanced Clarification Facility
Constructed, to be placed in
operation March 23, 2018
The CSO-LTCP is a component of the overall Chesapeake Bay Program. DC Water (along with many
other wastewater agencies within the Chesapeake Bay region) is required to improve wastewater treatment
facilities and remediate combined wastewater system overflows to prevent BOD and nutrient rich
wastewater from entering tributaries of the Bay. The improvements by DC Water (and other nutrient
contributors) prevent these nutrients from entering the Bay. When a CSO event occurs, harmful bacteria
and pollutants are released into the water system. The pollutants include floatable debris, BOD and
nutrients loads which can negatively impact the river, decreasing the dissolved oxygen content, raising
turbidity, and lowering the water quality. The aesthetics of the river are affected by floating debris and algae
blooms cause by the nutrient loads.
The TN/WW Plan, as stated in Section 2 of this report, is a highly complex undertaking at Blue Plains. The
CSO-LTCP and the TN/WW Plan are linked in the goal of increasing water quality in the Chesapeake Bay
watershed. The CSO-LTCP has been modified to appropriately address the overall goals. The
organizational structure of the program management for the CSO-LTCP was enhanced several years into
the Consent Decree by DC Water.
The creation of the DC Clean Rivers Project (DCCR) placed the CSO-LTCP efforts directly under the DC
Water Chief Engineer and enhanced public outreach and participation by providing a transparent
organization. DCCR has a visible profile within the community and the DCCR team is highly motivated in
pursuing the completion of the components remaining in DCCR.
The DCCR and TN/WW Plan combined efforts are summarized as:

INDEPENDENT ENGINEERING INSPECTION OF THE DC WATER WASTEWATER AND WATER SYSTEMS
Page 88 of 110 | Clean Rivers Project
• DC Clean Rivers Project: $2.6 Billion
• Nitrogen Removal: $950 Million
• Total > $ 3.5 Billion
• 25-year implementation (2005 – 2030)
• 96% reduction in CSOs & flood relief in Northeast Boundary
• Approximately 1 million lbs/year nitrogen reduction predicted
5.2 CONSENT DECREE MODIFICATIONS
On January 14, 2016, the Court entered the First Amendment to the CD (Amended CD) in Consolidated
Civil Action No. 1:CV00183TFH. The Amended CD incorporates changes to the selected CSO controls to
substitute Green/Gray CSO Controls in the Potomac sewershed and Green CSO Controls in the Rock
Creek sewersheds. The Amended CD also extended the time for implementation of the controls from 20
years to 25 years (to 2030). The Amended CD requires DC Water to construct the first Green Infrastructure
(GI) project in the Potomac and in Rock Creek, to perform post construction monitoring for one year and
then to determine the practicability of GI. If GI is determined to be practicable, then DC Water will construct
the remainder of the GI projects. If GI is determined to be impracticable, DC Water is required to construct
gray controls.
5.2.1 GREEN/GRAY CSO CONTROLS
5.2.1.1 POTOMAC SEWERSHED
The Green/Gray CSO Controls in the Potomac sewershed are designed to build upon the additional
conveyance and treatment capacity provided by the Blue Plains Tunnel, the Tunnel Dewatering Pump
Station (TDPS), and the Enhanced Clarification Facility (ECF). DC Water will construct Green Infrastructure
(GI) and perform targeted sewer separation to treat 1.2” of rainfall over 133 impervious acres in the
Potomac sewershed to control CSO outfalls 027, 028, and 029 prior to 2027. For Outfalls 020, 021, 022
and 024, a smaller 30 million gallon Potomac storage tunnel will be constructed. Outfalls 025 and 026 will
be controlled by sewer separation. After the first project is completed, DC Water will evaluate the Potomac
GI plan based on constructability, operability, efficacy, public acceptability and cost effectiveness. Based
on this evaluation, if GI is determined to be impracticable for control of CSO 027, 028, and 029, the
Potomac Tunnel will be extended to control these CSOs, and the Potomac tunnel’s storage capacity will be
increased to 40 million gallons.
5.2.1.2 GREEN/GRAY CSO CONTROLS FOR THE ROCK CREEK
SEWERSHED
DC Water will substitute Green Infrastructure (GI) for the Piney Branch Storage Tunnel. DC Water will
construct GI and perform targeted sewer separation to treat 1.2” of rainfall over 365 impervious acres in the
Rock Creek sewersheds to control CSO 049 prior to 2030. After the first project is completed, DC Water
will evaluate the GI plan based on constructability, operability, efficacy, public acceptability and cost
effectiveness. Based on this evaluation, if GI proves impracticable after the first project, DC Water will
construct a 9.5 million gallon gray storage facility in lieu of GI to control this CSO.

INDEPENDENT ENGINEERING INSPECTION OF THE DC WATER WASTEWATER AND WATER SYSTEMS
Page 89 of 110 | Clean Rivers Project
5.2.2 AMENDED TOTAL NITROGEN LIMIT
In addition to substituting GI for gray controls, the Amended CD incorporated controls required to achieve a
new total nitrogen effluent limit for Blue Plains of 4.689 million pounds per year. The total nitrogen limit was
developed by EPA to achieve the goals of the Chesapeake Bay Total Maximum Daily Load (TMDL) for
nutrient reductions. The TN/WW Plan incorporates these major components:
• Complete treatment capacity – Blue Plains will provide complete treatment up to 555 mgd for the first four hours and 511 mgd thereafter.
• Enhanced nitrogen removal (ENR) – ENR facilities will be constructed with capacity to provide complete treatment for the flow rates identified above and to meet the new total nitrogen effluent limit.
• Enhanced Clarification Facility (ECF) – A 225 mgd facility will be constructed at Blue Plains.
• Tunnel to Blue Plains and System Storage Volume – A new tunnel is being constructed from Poplar Point to Blue Plains. The total tunnels system storage volume will be increased from 126 MG to 157 MG. This new tunnel segment will not only serve as a flow equalization facility but will also allow a reduction in the required capacity of the ECF and the peak flow rates that receive complete treatment at the Plant
• Tunnel Dewatering Pumping Station (TDPS) – Under the Final LTCP, a tunnel dewatering pumping station was proposed to be constructed at the tunnel terminus at Poplar Point. As part of the TN/WW plan, the same tunnel dewatering pumping station is relocated to the new terminus of the tunnel at Blue Plains. The TDPS will be sized to have a minimum firm capacity of 225 mgd, equal to the capacity of the ECF. In addition, the facility will have the ability to dewater the tunnel system up to the new ECF and be able to discharge ECF effluent to complete treatment and discharge at Outfall 002 or at Outfall 001.
A map of the amended plan is presented in Exhibit 5-2.
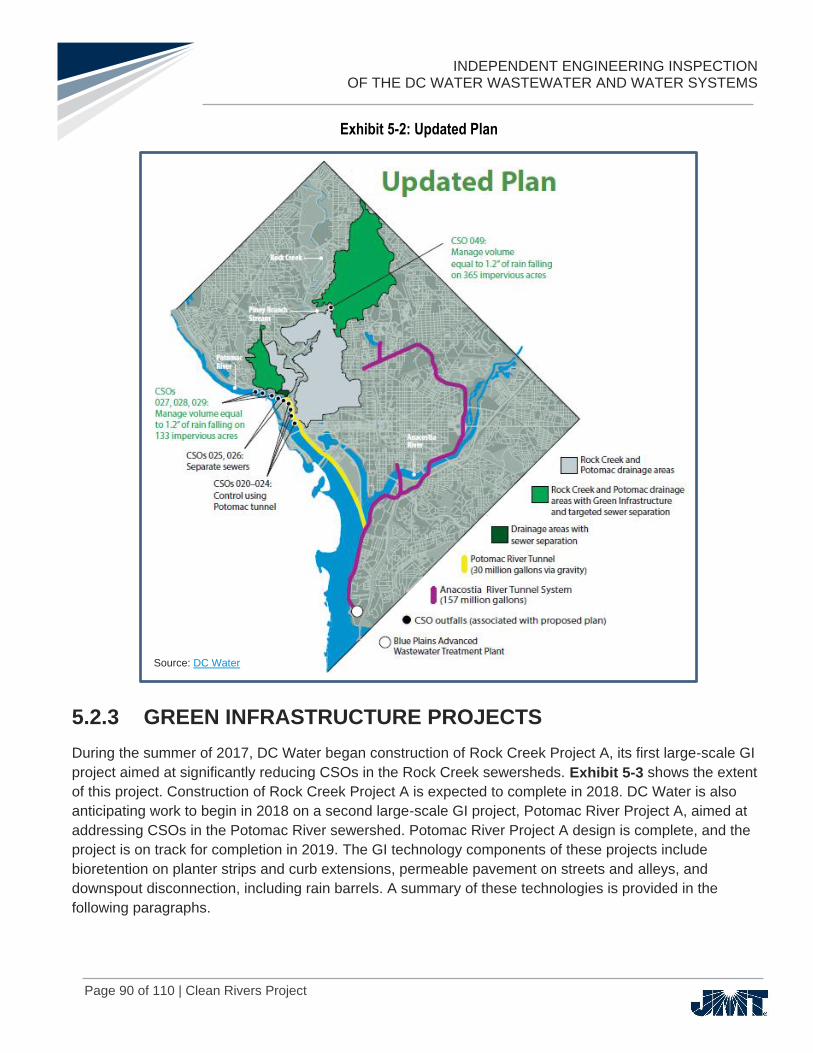
INDEPENDENT ENGINEERING INSPECTION OF THE DC WATER WASTEWATER AND WATER SYSTEMS
Page 90 of 110 | Clean Rivers Project
Exhibit 5-2: Updated Plan
5.2.3 GREEN INFRASTRUCTURE PROJECTS
During the summer of 2017, DC Water began construction of Rock Creek Project A, its first large-scale GI
project aimed at significantly reducing CSOs in the Rock Creek sewersheds. Exhibit 5-3 shows the extent
of this project. Construction of Rock Creek Project A is expected to complete in 2018. DC Water is also
anticipating work to begin in 2018 on a second large-scale GI project, Potomac River Project A, aimed at
addressing CSOs in the Potomac River sewershed. Potomac River Project A design is complete, and the
project is on track for completion in 2019. The GI technology components of these projects include
bioretention on planter strips and curb extensions, permeable pavement on streets and alleys, and
downspout disconnection, including rain barrels. A summary of these technologies is provided in the
following paragraphs.
Source: DC Water

INDEPENDENT ENGINEERING INSPECTION OF THE DC WATER WASTEWATER AND WATER SYSTEMS
Page 91 of 110 | Clean Rivers Project
Exhibit 5-3: Rock Creek Green Infrastructure Project A
5.2.4 GREEN INFRASTRUCTURE PRACTICES
Bioretention generally consists of a pooling or ponding basin where runoff accumulates until it absorbs
naturally into the soil, preventing, or significantly reducing runoff and contributing back into the natural
hydrologic cycle. Bioretention also generally incorporates a planted vegetation component and a filtration
media, such as mulch, at a minimum. The vegetation serves several purposes, as it slows and retains the
water runoff until it can absorb, while also mobilizing water through evapotranspiration, another key
component of the natural hydrologic cycle. The mulch assists in removing any pollutants from stormwater,
reducing pollution that is contributed through stormwater back into the local aquifers and waterways.
Permeable pavements function similarly to bioretention, allowing the stormwater to absorb into the ground
surface beneath the pavement, while maintaining a hardscape that is necessary in urban environment,
such as alleys, sidewalks, and parking lots. In graded applications, the permeable pavement designs
incorporate check dams to increase the retention and infiltration of the stormwater over the surface area.
Source: DC Water

INDEPENDENT ENGINEERING INSPECTION OF THE DC WATER WASTEWATER AND WATER SYSTEMS
Page 92 of 110 | Clean Rivers Project
Downspout disconnection is the practice of disconnecting building downspouts from interconnection with
the combined sewer system, instead discharging the rainwater over a vegetated area or retaining it
temporarily in a rain barrel. Rain barrels will retain rain water between storms allowing users to water lawn
and garden plantings without use of metered water, saving costs.
Other green infrastructure practices employed by DC Water in these projects include landscape
infiltration gaps, grated boardwalk crossings, recessed landscape planters, among other sustainable
practices. These practices generally seek to avoid impervious surfaces, maximizing areas where
stormwater can be naturally absorbed.
Examples of various GI practices are illustrated in Exhibit 5-4.
Exhibit 5-4: Green Infrastructure Examples
In DC Water’s applications, infiltrative GI practices such as bioretention and permeable pavements are tied
to underdrain systems that convey excess stormwater from the GI practices back to the combined sewer
system. This reduces the risk of flooding in GI areas during significant storm events (greater than the
designed 1.2”) due to retention. DC Water uses sewer flow monitoring to quantify the reduction of
stormwater contribution to the CSO system by the GI practices.
Source: DC Water

INDEPENDENT ENGINEERING INSPECTION OF THE DC WATER WASTEWATER AND WATER SYSTEMS
Page 93 of 110 | Clean Rivers Project
5.2.5 GREEN INFRASTRUCTURE INNOVATION AND PUBLIC-
PRIVATE COOPERATION
DC Water has hosted cooperative design challenges for several green infrastructure projects within the
Rock Creek area. These challenges have engaged the private sector to yield innovative modern designs
that incorporate concentrated GI practices into useful public spaces. An example is the challenge park
design presented as Exhibit 5-5.
Exhibit 5-5: Green Infrastructure Challenge Park Design
Source: DC Water
INDEPENDENT ENGINEERING INSPECTION OF THE DC WATER WASTEWATER AND WATER SYSTEMS
Page 94 of 110 | Clean Rivers Project
5.2.6 STRATEGIC PARTNERSHIPS
To enhance its effectiveness in completing GI projects, DC Water has also pursued strategic partnerships
with public agencies holding jurisdiction over the public spaces where GI practices will be implemented in
the District. An example is the Green Alley Partnership with the District Department of Transportation
(DDOT), the District’s public space steward. Additionally, DC Water has effectively partnered with
permitting agencies to enhance its ability to obtain permits and quickly mobilize to achieve the goals of the
GI projects and Clean Rivers.
5.2.7 OPERATIONS AND MAINTENANCE
In addition to its efforts toward constructing the GI practices, DC Water has placed a high priority on the
ongoing maintenance requirements of GI after the installation. DC Water has developed and procured the
operations and maintenance expertise necessary to ensure the ongoing success of GI practices on a large
scale. Additionally, GI maintenance is being managed through Maximo, DC Water’s enterprise asset
management software. Through Maximo, routine maintenance is set and then routinely will be assigned on
the assigned schedule. DC Water is applying an adaptive management approach to its implementation of
GI. Analytics will be applied to the results of O&M and the overall GI practices. Future iterations will be
adjusted or enhanced as needed account for any noted deficiencies.
5.3 PROJECTS
DC Water Clean Rivers projects include a variety of improvements within the combined sewer system
within the District. Similar to 750 cities across the United States, Washington DC has a combined
sewerage system that allows a mixture of storm water and sewage to overflow into the Anacostia and
Potomac Rivers and Rock Creek when it rains. The first phase of the Clean Rivers Project plan focused on
reducing combined sewer overflows into the Anacostia River by constructing major elements of the
Anacostia River Tunnel (ART) System. A large portion of the Anacostia River Tunnel System is to be
commissioned (placed in service) by March 23, 2018 and on schedule to meet the Federal Consent Decree
requirements which DC Water currently has with USEPA, DOJ and the District.
The FY 2017 – FY 2026 CIP identifies the lifetime budget of the Clean Rivers Project as $2.76 billion.
Exhibit 5-6 shows the Anacostia River Tunnel System designated by divisions and these designations will
be used in this section of the report. All ART work from Divisions C to Y will be placed into service by
March 23, 2018.

INDEPENDENT ENGINEERING INSPECTION OF THE DC WATER WASTEWATER AND WATER SYSTEMS
Page 95 of 110 | Clean Rivers Project
Exhibit 5-6: Tunnel System and Contract Divisions Map
Progress through 2017 is represented by Exhibit 5-7, indicating the reduction in the annual combined
sewer flow in the watersheds. Exhibit 5-3 includes the measured effect of Green Initiatives to date (2017)
and the projected results upon completion of the CSO-LTCP.

INDEPENDENT ENGINEERING INSPECTION OF THE DC WATER WASTEWATER AND WATER SYSTEMS
Page 96 of 110 | Clean Rivers Project
Cover of ENR Magazine, March 6,
2017 - Lady Bird TBM Launch
Exhibit 5-7: Volumetric CSO per Annum
5.3.1 CONTRACT DIVISIONS
5.3.1.1 BLUE PLAINS TUNNEL (DIVISION A)
The Blue Plains Tunnel (BPT) was the first (and hydraulically at
the lowest datum) to be constructed. A more detailed description
of the tunnel is in the 2013 Assessment. The project has received
several awards and was a successful design/build contract,
which established a culture of design/build within DC Water. The
BPT will be placed in service on March 22, 2018. On March 5,
2018, JMT inspected the tunnel’s conclusion at Blue Plains (the
tunnel dewatering pump station), which was being operationally
tested prior to the upcoming commissioning.
Source:
DC Water

INDEPENDENT ENGINEERING INSPECTION OF THE DC WATER WASTEWATER AND WATER SYSTEMS
Page 97 of 110 | Clean Rivers Project
DC Water File
Photo
5.3.1.1.1 DIVISIONS D & Z
Division D (Div. D), JBAB Overflow & Diversion
Structure is a new CSO constructed to divert
excessive storm surges in a controlled manner.
The new structure allows the demolition of the
existing CSO 003. The structure incorporates a
scenic overlook for the personnel on the joint
military base.
Div. D provides the following:
• Divert flow from the existing Potomac Outfall Sewers through a new diversion chamber located on JBAB and convey the diverted flow into the BPT through a shaft constructed by the BPT contract.
• Provide new hydraulic internals within the shaft constructed by the BPT contract
• Provide an overflow from the BPT through a new overflow structure on the bank of the Potomac River adjacent to the BPT.
• Demolish an existing overflow - CSO 003 - and abandon its outfall pipe. These facilities are located on JBAB and District property south of the new diversion and overflow facilities.
• Install instrumentation at various facilities on other Anacostia River Project contracts and at new sites.
• Start-up Services include a variety of work that is required to place diversion, instrumentation and other facilities constructed under Division D and other contracts in service and coordination with other contracts as to the timing, sequencing and testing required for start-up of the Anacostia River Projects.
Division Z (Div. Z) is the new Poplar Point Pumping Station (PP-PS) constructed to provide the following
services:
• New 55 mgd Poplar Point Sewage Pumping Station (PP-PS):
• Divert flow from the existing Anacostia Main Interceptor (AMI) via the proposed AMI Diversion Chamber (AMI-DC) and direct diverted flow through the proposed AMI Diversion Sewer (AMI-DS) to the Emergency Overflow Structure (EOS);
• Convey dry weather flows from the EOS to the newly constructed PP-PS where the flow will be lifted and conveyed via a 42” diameter force main to the location of discharge into the gravity sewer system at the proposed Discharge Connection Chamber (DCC);
• Provide conveyance of sewage from the sewer collection system located in Barry Road to the EOS via the Barry Road Sewer Extension (BRSE);
• Provide wet weather overflow from the EOS to the Poplar Point Junction Shaft (PP-JS) and the underlying Blue Plains Tunnel (BPT);
• Provide a wet weather overflow from the Main Outfall Sewers (MOS) through the proposed MOS Diversion Chamber (MOS-DC) to the BPT via an approach channel and a vortex drop structure currently under construction in DCCR Division A;
• Provide access to the newly constructed PP-PS from the northbound lane of South Capitol Street;
• Provide parking, vehicular movement area, drainage, landscaping and other site amenities to the proposed PP-PS site;
• Provide start-up and operational training services for the newly constructed PP-PS.

INDEPENDENT ENGINEERING INSPECTION OF THE DC WATER WASTEWATER AND WATER SYSTEMS
Page 98 of 110 | Clean Rivers Project
The existing pumping station will be decommissioned when Div. Z is complete. Although PP-PS is a
wastewater conveyance asset, this project is incorporated into the DCCR based on the Poplar Point
Junction Chamber and Shaft being the confluence structure for the Blue Plains Tunnel and Anacostia River
Tunnel. This structure incorporates local sanitary and storm water to overflow into the BPT via a drop shaft.
The PP-PS conveys wastewater conventionally within the CSO system during dry weather conditions.
Condition Assessments
Division D was not inspected due to security
restrictions at the Joint Base Anacostia
Bolling. Div. Z was inspected on March 2,
2018. PPPS remains under construction. The
construction contractor is behind schedule.
This condition is atypical of DCCR
construction projects. It does highlight the
proactive and solution-focused corrective
actions of DCCR. The project challenges
were differing site conditions, limited site
confined by highway traffic, and interruption
by pumping operations during wet weather, and competition for labor in an expanding economy. The CRP
mitigated the impact by increasing communications with the contractor, implementing a 2nd shift, focusing
more resources on identifying better methods and scheduling efficiencies, and also assuming project work
by the Program Consultant Organization (PCO) to avail Div. Z of expertise gained from the overall DCCR.
The March 2nd inspection saw evidence of the increased efforts by DCCR. Safety measures were in place
and operational testing was being performed.
5.3.1.2 ANACOSTIA RIVER TUNNEL (DIVISION H)
The Anacostia River Tunnel (ART) is the continuation upstream of the
BPT. As completed, the ART is a 12,500-linear foot, 23-foot diameter
tunnel that starts at the drop shafts (north and south) located at CSO
019 (adjacent to RFK Stadium), the ART’s discharges to the Blue
Plains Tunnel - Poplar Point Drop Junction Chamber. The ART is
approximately 100-feet below the surface.
Like the BPT, the ART stores and conveys excess combined storm
and sanitary wastewater during and following a wet weather event
preventing these excessive flows from inhibiting treatment at the treatment plant and protecting the
Anacostia River against pollution from CSO events. The BPT and ART have combined storage capacity of
approximately 100 million gallons.
DC Water File Photo
JMT Photo

INDEPENDENT ENGINEERING INSPECTION OF THE DC WATER WASTEWATER AND WATER SYSTEMS
Page 99 of 110 | Clean Rivers Project
The ART tunnel includes four intermediate drop shafts (aside from the two terminal drop shafts) that
convey wet weather overflows from surface CSO combined sewer pipes down to the ART. These shafts
may also serve as an emergency overflow to the Anacostia River in rare storm event when the ART and
BPT are overwhelmed.
• CSO 018 Diversion • M Street Drop Shaft (Div. E)
• CSO 007 Drop Shaft (Div. G) • CSO 005 Drop Shaft (Div. G)
CSOs - 015, 016, 017, & 018 have been bulk-headed and are no longer active outfalls. Other diversion
facilities are incorporated in the tunnel design for major storm events.
Condition Assessments
5.3.1.2.1 M STREET DIVERSION SEWER SITE (DIVISION E)
All operational work at CSOs 015, 016, and 017 Diversion Facility sites has been completed. Minor site
restoration work remains.
5.3.1.2.2 CSO-018 DIVERSION FACILITY
This site is operationally complete. During the assessment tour, a mobile crane, a small manhole chamber,
and recently delivered stop logs were on site. DCCR personnel were up-to-date on the status of the
installation of the stop logs for the March 23, 2018 commissioning of the diversion. This site mainly awaits
aesthetic work such as completion of the bridge’s stone work and landscaping.
5.3.1.2.3 CSO-007 DROP SHAFT (DIVISION G)
The CSO 007 diversion was constructed several years ago by the 11th Street Bridge design/build team.
The site remains an active construction site and is secured as such.
5.3.1.2.4 CSO-005 DROP SHAFT (DIVISION G)
CSO-005 is a completed facility on federal property and operationally ready for
the tunnel commissioning.
5.3.1.3 CSO-019 OVERFLOW AND DIVERSION
STRUCTURE
CSO-019 is a large overflow structure designed to dampen the impact of
diverted flows to the Anacostia River. The 120-yard width allows the diversion
to have a limited exit velocity to the Anacostia River, which is a flow normal
(perpendicular) to the river’s flow. Constructed on National Park Service lands,
the structure is architecturally compatible with the Anacostia Riverwalk Trail
(pictured at right).

INDEPENDENT ENGINEERING INSPECTION OF THE DC WATER WASTEWATER AND WATER SYSTEMS
Page 100 of 110 | Clean Rivers Project
The tunnel/CSO schematic is included in this 2018 report. This area of construction is currently the largest
active construction as the ART and CSO-019 are brought on line March 22, 2018. The upstream Northeast
Boundary Tunnel (NEBT) is awaiting the arrival of the refurbished tunnel boring machine (TBM) to
commence the tunneling portion from the north drop shaft currently under construction. Exhibit 5-8 shows
the layout of the CSO – 019 facilities that are under construction.
Exhibit 5-8: CSO – 019 Improvements (Ongoing)
Condition Assessment
CSO-019 is complete and the ground restoration and the landscaping on National Park Service lands
conform to the overall Anacostia Riverwalk Trail. The at-grade access hatches and hardscaping blend well
with the riverbank pedestrian and vehicular traffic byways.
DC Water File Photo

INDEPENDENT ENGINEERING INSPECTION OF THE DC WATER WASTEWATER AND WATER SYSTEMS
Page 101 of 110 | Clean Rivers Project
5.3.1.4 NORTHEAST BOUNDARY TUNNEL (DIVISION J)
The Northeast Boundary Tunnel (NEBT) is DC Water’s largest project to date and is the largest component
of DCCR. The NEBT is a large, deep, sewer tunnel that will increase the capacity of the existing sewer
system in the District, significantly mitigating sewer flooding and improving the water quality of the
Anacostia River. The NEBT comprises 27,000 feet of 23-foot diameter soft ground tunnel ranging in depth
between 80 and 160 feet. The project also includes: seven deep shafts; five diversion chambers; seven
adits; several storm water inlets; two ventilation control vaults; one 80,000cfm above ground ventilation
control facility, constructed near Amtrak Yard; and two 3,000cfm below grade ventilation control facilities.
The overall project will have 11 construction sites.
The NEBT will connect with the First Street Tunnel and Anacostia River Tunnel to provide a complete
gravity system from Northwest DC to Blue Plains Advanced Wastewater Treatment Plant, where all flows
captured by the tunnel system will be delivered for treatment prior to discharge to the Potomac River.
Completion is scheduled for 2023. Once the NEBT is connected to the other Clean Rivers tunnels,
combined sewer overflows to the Anacostia River will be reduced by 98 percent. In addition to controlling
combined sewer overflows, the construction of the Northeast Boundary Tunnel will reduce the chance of
flooding in the areas it serves from approximately 50 to 7 percent in any given year.
The NEBT design/build contract was awarded in July 2017 and the Notice to Proceed (NTP) issued in
September 2017. The $580M contract amount is within the $500M - $600M estimated cost range in the
2013 edition of this report. This most recent procurement was during an expanding economy not
experienced during the previous tunnel procurements. JMT reviewed the evaluation and selection process.
Clean Rivers evaluated the design/build bidders’ technical proposal prior to opening the price proposals.
The awarded contractor possessed the highest technical score and had the lowest price bid. The Multi-
Jurisdictional Cost Allocation is projected to be 7.1% of the NEBT contract. The cost allocation may be
revised subsequently to this report.
Condition Assessment
The NEBT construction site is the upper portion of the CSO-019 site and is the junction of the ART &
NEBT. This site was very active with many levels of above and below grade activity with machinery and
labor forces on the surface. There is still about a month of site demobilization and restoration (clean-up,
landscaping and hardscaping) associated with the south drop shaft. The exposed concrete covers to the
ART shaft were being covered with impermeable membranes; however, this work only requires a few days
effort.
5.3.1.4.1 NORTH SHAFT
The North Shaft is being prepared for the launching of the Tunnel Boring Machine (TBM), northerly, to mine
the NEBT. Essentially the same Design/Build contractor team (except change of design engineer) was
awarded the work for the ART and the NEBT work. This facilitated the ‘hand-off’ from one contractor on-
site to another contractor starting work on the identical ground. This allowed bypassing the inefficient
efforts of restoring the South Drop Shaft (ART) and then excavating the North Drop Shaft (ART) sites under
two separate contracts.

INDEPENDENT ENGINEERING INSPECTION OF THE DC WATER WASTEWATER AND WATER SYSTEMS
Page 102 of 110 | Clean Rivers Project
During the interview with the Clean Rivers staff, the Director explained Clean Rivers’ practice of having the
exiting design/build team for one division contract negotiate with the arriving team on the adjoining division
contract. The negotiated hand-off eliminates site restoration to fulfill a specification of site conditions at the
end of one contract and assumed by the bidders for the next contract. The hand-off is approved by Clean
Rivers after the contractors agree on site conditions (and intra-costs) at the hand-off. This eliminates
unnecessary work, which is required for Design-Bid-Build contracts and adds Risk Management concerns
on the owner (DC Water.)
The shared work within this site allowed the contractor’s engineers to re-design the work in this area for
maximum efficiency and reduced cost. This scheme also allowed the contractor to send the TBM to the
Herrenknecht factory in Germany for remanufacturing as they simultaneously restored/excavated the two
contiguous drop shaft sites.
The Tunnel Odor Control Facility was inspected and appeared to be functionally operational, without any
apparent odors.
5.3.1.4.2 FIRST STREET TUNNEL AND TEMPORARY PUMPING STATION
Following four severe summer storms in 2012 that caused flooding throughout the Bloomingdale
neighborhood, DC Water and the District government accelerated and modified the First Street Tunnel to
mitigate flooding in the area. This modification required a temporary pumping station to dewater the First
Street Tunnel, which acts as stormwater storage until the NEBT is completed and the temporary pumping
station is demolished. This expedited construction within a tight urban setting was completed in October
2016. $58M of the project cost is being reimbursed to DC Water by the District over a ten-year period.
Condition Assessment
A site assessment was performed from the
surface. The air release chambers were
viewed from above and it was noted that
the grates over the chambers were all in
good condition. Some of the lifting rings
seemed to show signs of corrosion. Still
evident are the decommissioned McMillan
water treatment plant sand filters on this
historical site. This location serves as the
headworks for the First Street Tunnel.
There is a small amount of landscaping to
be finished on this site. The contractor
stabilized the area around the structures for
future maintenance by using a cellular confinement system that will allow vehicular traffic while also limiting
impervious surface, a noted concern in an area with flooding potential. The electrical/mechanical control
center facing First Street was designed and built for easy access of personnel and equipment from the
street and blends well with the streetscape.
DC Water File Photo
V St. NW - 1st St. Tunnel

INDEPENDENT ENGINEERING INSPECTION OF THE DC WATER WASTEWATER AND WATER SYSTEMS
Page 103 of 110 | Clean Rivers Project
All construction efforts in the neighborhoods for the First Street Tunnel and temporary pumping station
have been completed. The only visible signs of work having occurred in this community are the surface
access hatches and manholes. The pavement and sidewalk restoration work is noteworthy and indicative
of the success of this project that included proactive community participation.
5.3.1.5 BLUE PLAINS DEWATERING PUMPING STATION AND ENHANCED
CLARIFICATION FACILITIES (DIVISION Y)
The Blue Plains Tunnel Dewatering Pumping Station (TDPS) and the Enhanced Clarification Facility (ECF)
are part of the TN/WW Plan under the modified Consent Decree. During wet weather events these facilities
will receive and pump the combined sewage effluent from storage in the tunnel system to treatment in the
ECF. The effluent of the ECF can either vector to Outfall 002 (Blue Plains) or to the secondary processes
within Blue Plains for dry weather processing. The launching of Lady Bird TBM was at the bottom of the
TDPS. Subsequently the TDPS was built over the terminus of the tunnel and then the ECF was
constructed at ground level as a vertical structure, similar to other facilities at Blue Plains.
The TDPS/ECF is essential to the March 22, 2018 commissioning of the ART facilities coming on line. The
inspection of March 5, 2018 found the large, complex facilities under going operational testing. The TDPS
is a significant engineering achievement within the large and highly visible Clean Rivers Project.
Condition Assessment
5.3.1.5.1 TUNNEL DEWATERING PUMPING STATION
The TDPS is operational. All six levels were inspected, and it was evident that it was an active construction
site with some housekeeping required inside the below-ground station and on the surface (where there is
still quite a bit of small equipment and materials). The size and complexity of the work comprising this
structure were notable to the assessment team. The contractor’s
superintendent pointed out structural and mechanical achievements
that solved conditions associated with very large equipment and
structures capable of pumping and treating 225 mgd of combined
sewer flow. There were no workers within the structure at the time of
the inspection. All systems, including Life Safety, were completed.
The TDPS/ECF is operational and can be safely occupied. There are
remaining completion punchlist items to be performed such as
removing the construction elevator, construction equipment and
plywood protecting the metal stairways.
5.3.1.5.2 ENHANCED CLARIFICATION FACILITY
The Enhanced Clarification Facility (ECF), located on top and surrounding the TDPS is also operational
with treatment process testing occurring. Outstanding work items at the time of the inspection appear to be
minor in comparison to the scale of the project. Clean Rivers and the contractor’s superintendent both
conveyed that the facility is expected to be commissioned in a ceremony with the Mayor’s office before the
LTCP deadline of March 23, 2018.
JMT Photo
JMT Photo

INDEPENDENT ENGINEERING INSPECTION OF THE DC WATER WASTEWATER AND WATER SYSTEMS
Page 104 of 110 | Security
SECTION 6 SECURITY
6.1 OVERVIEW
Historically, DC Water has had a security presence at Blue Plains and other major facilities typical of other
large and significant campuses in the DC Metro Area. Since the events of 9/11/2001, Vulnerability
Assessments for water utility agencies have identified and developed best practices to safeguard the
United States’ drinking water and wastewater facilities. Both DC Water and the Washington Aqueduct have
invested significantly in physical security measures and have developed best practices with an increased
presence of security personnel.
The Department of Security has 9 full-time employees (FTEs) and the Director of Security reports to the
Assistant General Manager, Support Services. The FY 2018 Operating Budget for the department is
$7.5M, increased from $6.9M in FY 2017. The increase is mainly in contractual services and the transfer of
2 FTEs from Facilities group. The department is well managed and maintains a high degree of training and
high morale. The department administers program development, implementation and evaluation of the DC
Water's security program. This program strives to achieve the highest level of security for both staff and
assets while maintaining a low risk of loss and liability to DC Water and its customers.
During a March 2, 2018 interview, the Director of Security explained in detail the goals and objectives of
DC Water to ensure continued operations of both the water and sewer systems in order to keep the federal
government operating within the District and not having to disrupt operations by transferring to emergency
offsite locations. This mission of serving the large federal government presence increases the role of
security at DC Water beyond the benchmarks for other utilities where the important, and shared,
benchmark is that of ensuring the public health within a utility’s customer base. This additional benchmark
mainly requires a more significant safeguard for sanitary services.
DC Water has developed and implemented a comprehensive Emergency Management Plan (EMP) under
the auspices of the Emergency Management Chief under the Director of Customer Care and Operations.
The EMP contains procedures and scenarios to safeguard the mission of DC Water under emergency
conditions. EMP details how DC Water will respond to an emergency. It contains planned actions based on
emergency conditions.
6.2 PHYSICAL SECURITY
6.2.1 CAPITAL IMPROVEMENT BUDGET
A new Security Facility was completed in FY 2016 as part of the new Inventory Warehouse project at Blue
Plains. The total project cost was $18.4M. Additional capital projects involved both water and sewer
facilities security upgrades. Security upgrades started in FY 2010. Some components of the security
improvements have been completed while others are scheduled for completion between FY 2020 – FY
2022.

INDEPENDENT ENGINEERING INSPECTION OF THE DC WATER WASTEWATER AND WATER SYSTEMS
Page 105 of 110 | Security
The water system security projects upgrade security systems at water pumping stations, water storage
reservoirs and elevated tanks, and other water distribution system structures and sites. Components
consists of installing CCTV cameras, access card readers, intrusion sensors, fencing, network and
communications, and other control surveillance devices and systems to protect the water facilities and
infrastructure against vandalism, criminal activity, and possible future terrorism while protecting DC Water
personnel in accordance with the recommendations of the Vulnerability Assessment (VA) Study. The
combined capital projects have a Lifetime Cost of $4.2M.
The Sewer Facilities projects provide for a security assessment, placement of exterior and interior cameras throughout Sewer Services Facilities, installation of traffic control devices to include bollards & speed bumps, and installation of perimeter fencing and barriers. The Lifetime Cost in the FY 2017 – FY 2026 CIP is a combined $3.3M. Capital Equipment outlays in the FY 2017 – FY 2026 CIP are $1.4M for the ten-year program. These funds are for infrastructure connectivity, cameras, card readers, door/window/hatch sensors, fence-line detection systems, automated entry/exit data capture and software support.
6.2.2 FACILITIES CONDITION ASSESSMENT
During the interceding years between Independent Engineer Reviews, the physical security measures have
been inspected and reviewed on numerous occasions and for other DC Water assessment tasks. The
physical measures are maintained and provide an appropriate level of control. The March 2, 2018 escorted
tour of the Security Facility reviewed in detail the supervisory control center and security capabilities
supported by the physical plant and assets.
6.3 SECURITY OPERATIONS
6.3.1 OPERATIONS
Security forces providing DC Water security presence and measures are contracted to a licensed
protective services firm. DC Water and its contractor have police powers to arrest within the District. Total
contractual costs for security in FY 2018 are $3.8M. The Security Director estimates a cost of $300,000 per
each 24-hr manned station at the various facilities. The 157 security guards are armed. This is an increase
from 50% armed over the last several years as security measures evolve from having a presence to being
an effective deterrent.
The functions of staff and contractual services are:
• Identification and Badge Control Electronic security asset testing and maintenance
• Guard force and traffic management
• Management of the security-related CIP
• Emergency Management & First Response and community awareness/training

INDEPENDENT ENGINEERING INSPECTION OF THE DC WATER WASTEWATER AND WATER SYSTEMS
Page 106 of 110 | Security
• Loss prevention, asset protection, vulnerability assessments, and hazardous threat
training/awareness
• Investigations, local and federal liaison, and security
work order requests
• Information security and site surveys
A key metric in the successful security operations is the low turnover rate in the contracted security forces.
The turnover rate for 2018 has been lowered to 10%, which is lower than industry-wide turnover exceeding
25%. The low turnover rate experienced prevents higher training costs and productivity interruptions. This
allows for competitive bidding as security agencies recognize the attractive working environment for the
regional security workforce.
6.3.2 DEPARTMENT OF HOMELAND SECURITY (DHS)
DHS conducted a Site Assistance Visit to DC Water during the week of November 13, 2013. The
evaluation of security and resilience postures, along with providing guidance in mitigating vulnerabilities,
were the main objectives of the assistance. The wastewater collection system was the targeted facility.
Over 22 sites were evaluated. Exhibit 6-1 has been taken from the December 20, 2013 DHS report (which
is the DHS report’s Figure 9). This exhibit shows five categories as utility sector ‘highs’ with an overall DC
Water Protective Measures Index of 74 out of 100 whereas the average for 25 other pump stations
assessed elsewhere was 39 out of 100.
Exhibit 6-1: Preventive Measures Index – DC Water

Page 107 of 110 | Bibliography
INDEPENDENT ENGINEERING INSPECTION OF THE DC WATER WASTEWATER AND WATER SYSTEMS
BIBLIOGRAPHY
Aklile Tesfaye. (2017). Pretreatment Program 2016 Annual Report. Washington, DC: DC Water.
Arcadis. (2015). Sewer System Facilities Plan. Washington, DC: DC Water.
Black & Veatch. (2014). PHASE 1 ‐ EVALUATION OF TRAVILAH QUARRY FOR WATER SUPPLY
STORAGE. Interstate Commission on the Potomac River Basin. Retrieved January 3, 2018, from
https://www.potomacriver.org/wp-content/uploads/2015/11/PRC14-3_Black.pdf
Black & Veatch. (2015). PHASE 2 ‐ EVALUATION OF TRAVILAH QUARRY FOR WATER SUPPLY
STORAGE. Interstate Commission on the Potomac River Basin. Retrieved January 3, 2018, from
https://www.potomacriver.org/wp-content/uploads/2015/11/PRC14-4_Black.pdf
Braveboy, C., Regis, D., & Sharp, S. (2018, February 6). Director Utility Services - Sewer Interview. (R.
Beringer, & G. Creighton, Interviewers) Washington, DC.
Caitlin Feehan. (2013). A Survey of Green Infrastructure Maintenance Programs in the United States. New
Haven, CT: Yale School of Forestry and Environmental Studies. Retrieved February 28, 2018, from
https://hixon.yale.edu/sites/default/files/files/fellows/paper/feehan_hixonpaper20131.pdf
Caitlin Feehan; DC Water. (2015). DC Water’s DC Clean Rivers Project Drivers for Long-term Success:
Green Infrastructure Asset Management. College Park, MD: The University of Maryland
Environmental Finance Center. Retrieved February 28, 2018, from
https://efc.umd.edu/assets/green_infrastructure/session_7b_turning_common_pitfalls_into_success
es_dc_water.pdf
CH2M. (2016). Sewer System Asset Management Plan. Washington DC: DC Water.
CH2M. (2017). Enterprise Asset Management Plan. Washington, DC: DC Water.
CH2M. (2017). Water System Asset Management Plan. Washington, DC: DC Water.
Dandach, D. (2018, January 17). Director Wastewater Engineering Interview. (R. Beringer, & G. Creighton,
Interviewers) Washington, DC.
DC Water. (n.d.). Kansas and 3rd GI Park. Retrieved from
https://www.dcwater.com/sites/default/files/Render%20Kansas%20and%203rd%20GI%20Park.png
DC Water. (2013). Blue Horizon 2020 - DC Water Strategic Plan. Washington, DC: District of Columbia
Water and Sewer Authority. Retrieved from
https://www.dcwater.com/sites/default/files/blue_horizon_2020_strategic_plan.pdf
DC Water. (2013, May 2). Board Resolution 13-57. Retrieved from
https://www.dcwater.com/sites/default/files/board-resolutions/resolution-13-57.pdf
DC Water. (2015). Blue Horizon 2020 Strategic Plan Framework. Washington, DC: District of Columbia
Water and Sewer Authority. Retrieved from
https://www.dcwater.com/sites/default/files/blue_horizon_2020_strategic_plan_revised_2015.pdf
DC Water. (2015). Long Term Control Plan Modification for Green Infrastructure. Washington, DC: District
of Columbia Water and Sewer Authority. Retrieved November 6, 2017, from
https://www.dcwater.com/sites/default/files/green-infrastructure-ltcp-modificaitons.pdf
DC Water. (2016). Approved FY 2018 Budgets Adopted December 1, 2016. Washington, DC: District of
Columbia Water and Sewer Authority. Retrieved December 13, 2017, from
https://www.dcwater.com/budget-and-financial-planning
DC Water. (2016, April). Biannual Report April. 2016 Clean Rivers Project News. Retrieved from
https://www.dcwater.com/sites/default/files/documents/CSO_apr_2016.pdf

Page 108 of 110 | Bibliography
INDEPENDENT ENGINEERING INSPECTION OF THE DC WATER WASTEWATER AND WATER SYSTEMS
DC Water. (2016). Biannual Report October, 2016 Clean Rivers Project News. Washington, DC: District of
Columbia Water and Sewer Authority. Retrieved from
https://www.dcwater.com/sites/default/files/documents/CSO_Oct_2016_web.pdf
DC Water. (2016). Emergency Management Plan. Washington, DC: DC Water.
DC Water. (2017). 2016 Annual Report. Washington, DC: District of Columbia Water and Sewer Authority.
Retrieved from https://www.dcwater.com/sites/default/files/2016annual_1.24.17_lo.pdf
DC Water. (2017). Biannual Report April, 2017 Clean Rivers Project News. Washington, DC: District of
Columbia Water and Sewer Authority. Retrieved from
https://www.dcwater.com/sites/default/files/CSO_apr_2017_web_0.pdf
DC Water. (2017). Biannual Report October, 2017 Clean Rivers Project News. Washington, DC: District of
Columbia Water and Sewer Authority. Retrieved from
https://www.dcwater.com/sites/default/files/CSO_Oct_2017_PRINT2_0.pdf
DC Water. (2017, November 16). Board of Directors Meeting of the Environmental Quality and Operations
Committee. Committee Agenda. Washington, DC. Retrieved from
https://dcwater.com/sites/default/files/event_attachment/November%2017%2C%202017%20%282
%29%20Environmental%20Quality%20and%20Operations%20Committee%20Meeting%20agenda.
DC Water. (2017, December 21). Board of Directors Meeting of the Environmental Quality and Operations
Committee. Committee Agenda. Washington, DC: DC Water. Retrieved from
https://www.dcwasa.com/sites/default/files/event_attachment/EQ Ops 12-21-2017_0.pdf
DC Water. (2017, November 6). Green Infrastructure Plan. Retrieved from DC Water Clean Rivers Project:
https://www.dcwater.com/green-infrastructure
DC Water. (2018). 2017 Annual Report. Washington, DC: District of Columbia Water and Sewer Authority.
Retrieved from https://www.dcwater.com/sites/default/files/2017_annual_report_0.pdf
DC Water. (2018). 2017 Comprehensive Annual Finance Report. Retrieved from
https://www.dcwater.com/sites/default/files/2017%20CAFR%20FINAL%202-8-18.pdf
DC Water. (2018, 03 01). Board of Directors (240th Meeting). Meeing Agenda. Washington, DC. Retrieved
from
https://www.dcwater.com/sites/default/files/event_attachment/DC%20Water%20Board%20of%20Di
rectors%2003-01-2018%20_Website.pdf
DC Water. (2018, January 18). Board of Directors Meeting of the Environmental Quality and Operation
Committee. Committee Agenda. Washington, DC. Retrieved from
https://www.dcwater.com/sites/default/files/1-18-
2018%20EQ%20and%20Ops%20Meeting%20Agenda_0.pdf
DC Water. (2018, February 15). Board of Directors Meeting of the Environmental Quality and Operations
Committee. Committee Agenda. Washington, DC. Retrieved from
https://dcwater.com/sites/default/files/event_attachment/EQ%20Ops%2002-15-2018.pdf
DC Water. (2018, March 7). Drinking Water is Distributed by Elevation Levels. Retrieved from DC Water:
https://www.dcwater.com/water-distribution-system
DC Water. (2018, February 22). Finance and Budget Committee. Meeting Agenda. Retrieved from
https://www.dcwater.com/sites/default/files/Finance%20and%20Budget%2002-22-
2018%20_Website.pdf
DC Water. (2018, March 1). FY 2019 Proposed Budget Review Presentation to the Finance and Budget
Committee on February 22, 2018. Budget and Financial Planning, Department of Finance.
Page 109 of 110 | Bibliography
INDEPENDENT ENGINEERING INSPECTION OF THE DC WATER WASTEWATER AND WATER SYSTEMS
Retrieved from dcwater.com: https://www.dcwater.com/sites/default/files/finance/FY 2019 Budget
Summary Presentation_Website.pdf
DC Water. (2018, February 15). Meeting of the DC Water Board of Directors, Environmental Quality and
Operations Committee. Meeting Agenda. Retrieved from
https://www.dcwater.com/sites/default/files/event_attachment/EQ%20Ops%2002-15-2018.pdf
DC Water. (Adopted December 1, 2016). Executive Budget Summary - Approved FY 2018. Washington,
DC. Retrieved from
https://www.dcwater.com/sites/default/files/documents/executive_budget_summary.pdf
DC Water. (n.d.). Fall 2017 Green Alleys Partnership Factsheet. Retrieved from
https://www.dcwater.com/sites/default/files/project/documents/Fall%202017%20Green%20Alleys%
20Partnership%20Factsheet.pdf
DC Water. (n.d.). Green Bonds. Retrieved from https://www.dcwater.com/green-bonds
DC Water; DC Council. (2018, March 7). Budget Oversight 2019 - Transportation and the Environment -
District of Columbia Water and Sewer Authority. Retrieved from dccouncil.us:
http://dccouncil.us/files/user_uploads/budget_responses/dcw_Part1.pdf
deBarbadillo, C. (2017, December 17). Wastewater Treatment Technology Interview - Director of Clean
Water and Technology. (R. Beringer, & K. Baxter, Interviewers)
Environmental Protection Agency. (2015, May 19). First Amendment to Consent Decree to District of
Columbia Water and Sewer Authority, et al. and The District of Columbia. Retrieved from
www.epa.gov: https://www.epa.gov/sites/production/files/2015-05/documents/firstamendment-
dcwasa-cd.pdf
Fricke, C. (2018, February 20). Director Engineering & Technical Services Interview. (R. Beringer, & G.
Creighton, Interviewers) Washington, DC.
Hatch Mott MacDonald. (2015). Water System Facilities Plan. Washington, DC: DC Water.
Hawkins, G. (February 27, 2018). Public Oversight Hearing Testimony to DC Council Committee on
Transportation and the Environment. Washington, DC: DC Council. Retrieved December 7, 2017,
from http://dccouncil.us/files/user_uploads/budget_responses/ws.pdf
Hughes, J. (2018, February 6). Director Utility Services - Water Interview. (R. Beringer, & G. Creighton,
Interviewers) Washington, DC.
International Organization for Standardization. (2016). ISO 55000 Asset Management - What to do and
why? Geneva, Switzerland.
Interstate Commission on the Potomac River Basin. (2016, November 29). Contamination Seen in Upper
Potomac. Retrieved January 2, 2018, from https://www.potomacriver.org/:
https://www.potomacriver.org/news/contamination-seen-upper-potomac/
Jacobus, T., & Cole, N. (2017, November 30). Interview and Inspection of Washington Aqueduct Facilities
at Dalecarlia Reservoir and Water Treatment Plant. (R. Beringer, & G. Creighton, Interviewers)
Kharkar, S., & Smith, W. (2018, March 2). Blue Plains Plant Inspection and Operations Interview. (R.
Beringer, & G. Creighton, Interviewers)
Nolan, L. J. (2018, February 21). Inspection of McMillan Water Treatment Plant. (R. Beringer, & G.
Creighton, Interviewers)
Ray, C., & Bezak, B. (2018, March 5). DC Clean Rivers Interview. (R. Beringer, G. Creighton, & G.
Gordillo, Interviewers)
Sowell, N. (2018, February 21). Manager Linear Asset Management Interview. (R. Beringer, & G.
Creighton, Interviewers) Washington, DC.

Page 110 of 110 | Bibliography
INDEPENDENT ENGINEERING INSPECTION OF THE DC WATER WASTEWATER AND WATER SYSTEMS
Sweeney, C. (2018, February 28). Distribution and Conveyance Systems Inspection and Interview. (R.
Beringer, & G. Creighton, Interviewers)
Tesfaye, A. (2017, December 19). Blue Plains Operations Interview - Assistant General Manager, Blue
Plains. (B. Beringer, & K. Baxter, Interviewers)
US Environmental Protection Agency. (2018, 03 12). Best Practices for Water Conservation and Efficiency
as an Alternative for Water Supply Expansion. Retrieved from epa.gov:
https://www.epa.gov/sustainable-water-infrastructure/best-practices-water-conservation-and-
efficiency-alternative-water
Veolia North America. (2014, June 2). Press Release. DC Water, Washington Aqueduct and Veolia Partner
in nation’s capital to save up to $12 million per year through efficiencies in water production
management. Washington, DC. Retrieved November 29, 2017, from
https://www.veolia.com/en/veolia-group/media/press-releases/dc-water-washington-aqueduct-and-
veolia-partner-nation-s-capital-save-12-million-year-through-efficiencies-water-production-
management
Water Environment Federation. (2015). Evolving Green Infrastructure Through Asset Management.
Alexandria, VA: Water Environment Federation. Retrieved February 28, 2018, from
http://stormwater.wef.org/2015/11/evolving-green-infrastructure-asset-management/
Water Environment Research Foundation (WERF). (n.d.). The Fundamentals of Asset Management - A
Hands on Approach. WERF. Retrieved from werf.org:
http://simple.werf.org/simple/media/EPAAsset/Overview.pdf
Wone, M., & Flora, B. (2018, March 5). DC Clean Rivers Program Construction Condition Assessments.
(R. Beringer, G. Creighton, & G. Gordillo, Interviewers)


![Research Article The Experimental Studies on Behavior of ...FRP were studied by Zohrevand and Mirmiran [ ]. e results indicated that the ductility of this hybrid column increases with](https://static.documents.pub/doc/80x56/60da833cdcc7880019136fa0/research-article-the-experimental-studies-on-behavior-of-frp-were-studied-by.jpg)


