FR-08-12 Independent Evaluation of the California High School Exit Examination (CAHSEE): Fourth Biennial Report D. E. (Sunny) Becker and Christa Watters (Editors) Prepared for: California Department of Education Sacramento, CA Contract Number: 00-07 January 17, 2008
Transcript
FR-08-12
Independent Evaluation of the California High School Exit Examination (CAHSEE): Fourth Biennial Report
D. E. (Sunny) Becker and Christa Watters (Editors)
Prepared for: California Department of Education Sacramento, CA Contract Number: 00-07
January 17, 2008
ndimopoulos
Note
Accepted set by ndimopoulos
Executive Summary
Executive Summary
Independent Evaluation of the California High School Exit Exam
In 1999, the California legislature established the requirement that students pass a graduation exam in English-language arts (ELA) and mathematics beginning with the Class of 2004. Some modifications to the requirement for the California High School Exit Examination (CAHSEE) were passed in 2002. (For more details on the bills establishing this test and the basis for continuing evaluations and reports, including this one, see Chapter 1 of this report.) In July 2003, after the completion of the 2002–03 school year CAHSEE testing, the State Board of Education (Board) voted to defer the CAHSEE requirement until 2006.
The legislation establishing the CAHSEE in 1999 also called for an independent evaluation of the impact of the CAHSEE requirement. HumRRO has been evaluating the CAHSEE and its impact since January 2000. The legislation also called for biennial reports to the legislature. The 2008 Biennial Report describes evaluation activities and results through January 20081. Findings the evaluation activities have implications for most aspects of the CAHSEE, from the development of the test itself to how it is used and its impact on specific groups of students. Evaluation activities and key findings are summarized briefly here, along with recommendations derived from the findings. Evaluation activities and findings are reported in more detail in the main body of the report under the following chapters:
• Chapter 1: Overview • Chapter 2: Results from the 2006–07 Administrations • Chapter 3: A Closer Look at Specific Populations • Chapter 4: Principal and Teacher Survey Responses • Chapter 5: Trends in Educational Achievement and Persistence During the
CAHSEE Era • Chapter 6: Summary and Recommendations
Analyses of Data from the 2006–07 CAHSEE Administrations
The CAHSEE was administered in July 2006, October 2006, November 2006, December 2006, February 2007, March 2007, and May 2007 to 11th and 12th graders who had not yet passed it. All 10th graders in the Class of 2009 were required to participate in the February, March, or May 2007 administration. HumRRO merged results from these administrations with CAHSEE results from previous years. There was some imprecision in matching due to differences in how identifying information was coded. The resulting matched files provide good estimates, but not exact counts, of the cumulative number of students in each high school class who have met the CAHSEE requirements. HumRRO reported results for 12th graders who were facing a June 2006
1 This report is nearly identical to the 2007 Evaluation report which described activities through October 2007. This report described additional analyses of students seeking to obtain a General Education Diploma (GED).
Human Resources Research Organization (HumRRO) Page i
Independent Evaluation of the CAHSEE: Fourth Biennial Report
graduation deadline for passing the CAHSEE after the Fall 2005 administrations and after each of the Winter (February) and Spring (March and May) 2006 administrations.
Detailed analyses of results for 12th graders and comparisons of 10th and 11th
grade results to corresponding results in 2005 are reported in Chapter 2. HumRRO also examined factors related to school-level passing rates and analyzed responses to the student questionnaire that accompanied each of the CAHSEE tests.
CAHSEE Test Score Quality
HumRRO verified the accuracy of the scoring and equating of the CAHSEE test forms. Scoring consistency for the essay improved this year. HumRRO performed independent psychometric analyses of the March 2007 CAHSEE test form. Using nonproprietary software, we replicated the estimation of item difficulty parameters, the equating of total scores to the constant reporting scale, and the raw-to-scale score conversion tables. Replication of ETS results demonstrates that their psychometric processes are working properly.
Scorer agreement on the essays increased. In 70 percent of the cases, the two independent scorers agreed exactly on the score to be assigned. In less than 0.5 percent of the cases did the two scorers disagree by more than one score-point. This is an increase in scoring consistency from last year.
CAHSEE Test Results
Last year’s seniors continued to test after their original target graduation date. Roughly 40 percent of students in the Class of 2006 who had not passed the CAHSEE by June of their senior year continued to take the CAHSEE. More than a quarter of those still testing completed the CAHSEE requirement this year.
Passing rates through 12th grade for the Class of 2007, the 11th grade for the Class of 2008, and the 10th grade for the Class of 2009 were similar to the corresponding rates for previous classes. Cumulative passing rates for seniors in the Class of 2007 were the same as for the Class of 2006 (91.2 percent passing both parts) when all current seniors were counted. The rates were about 2 percentage points higher when this year’s repeat 12th graders were excluded. Passing rates for 12th
graders continuing to test were closely related to their level of performance on the end-of-course test that they took in 11th grade. More students reported taking Algebra I. More of those who did not pass were older, English learners, African American or Hispanic, and low-SES compared to all 10th graders in 2005.
Cumulative passing rates for 11th graders in the Class of 2008 decreased slightly compared to 11th grade passing rates for the classes of 2006 and 2007 for all groups except Hispanic students and students with disabilities, which showed slight increases in CAHSEE passing rates.
Page ii Human Resources Research Organization (HumRRO)
Executive Summary
Just over 65 percent of 10th graders completed the CAHSEE requirement, the same as in the past 2 years. This year, we were able to identify about 2 percent of the current 10th graders that were repeating the 10th grade. Of these repeaters, only 21 percent met the CAHSEE requirement by the end of this year compared to 66 percent of the first-time 10th graders.
More students are taking Algebra I by 10th grade. Taking Algebra I and higher level mathematics courses continued to be associated with success in passing the CAHSEE mathematics test. A significant change this year was that the proportion of 10th graders who had taken Algebra I increased sharply for all demographic groups except students with disabilities.
Students in demographic groups with low pass rates (e.g., minorities, economically disadvantaged students, and students with disabilities) in schools with a high proportion of similar students continue to have lower passing rates than students in these groups in schools with fewer similar students. Average CAHSEE scores for 10th grade African American students in schools where they were less than 2.1 percent of the total 10th grade enrollment were 10 points higher than average scores for African American students in schools where they constituted more than 13 percent of the 10th grade enrollment. Similarly, scores for Hispanic students in schools where they were 14 percent or less of the 10th grade enrollment were nearly 20 points higher than scores for Hispanic students in schools where they were more than two thirds of the 10th grade enrollment. Similar mean score differences were found for low-income students, for English learners, and, to a somewhat lesser extent, for students with disabilities.
Results for Specific Populations
In our 2007 analyses, we again took a closer look at two populations of students that have had particular difficulty meeting the CAHSEE requirement—English learners and students with disabilities. We examined additional information on the characteristics of students in each of these populations and on the nature of the services they receive. This year, we also conducted further analyses of low-income and racial/ethnic minority students who have had difficulties meeting the CAHSEE requirement.
As noted previously, many students are still classified as English learners after as many as 10 years of education in this country. Students in this group appeared to have more severe problems, many participating in special education programs as well as English language development programs. Another important finding was that students who were enrolled within the last few years had lower CAHSEE passing rates compared to students who had been in English language development programs for a longer time. Students who had been English learners but were subsequently reclassified as fluent had relatively little difficulty with the CAHSEE.
In our current analyses, we obtained and merged data from the 2005 and 2006 administrations of the California English Language Development Test (CELDT) (2007
Human Resources Research Organization (HumRRO) Page iii
Independent Evaluation of the CAHSEE: Fourth Biennial Report
results are not yet available). Success on the CELDT closely tracked success on the CAHSEE.
For students with disabilities, participation in regular classroom instruction is closely related to meeting the CAHSEE requirement. Participation in regular instruction and also the specific services students receive vary by type of disability. These 2007 findings were consistent with our findings in 2005 and 2006. Both participation in regular instruction and CAHSEE success vary considerably for students in different primary disability categories. Students with mental retardation are unlikely to spend much time in regular classroom instruction. Very few pass the CAHSEE, and relatively few even continue to take the CAHSEE after 10th grade. The types of services students receive also vary by primary disability category, although provision of these services is not closely related to CAHSEE outcomes, independent of time spent in regular instruction. It is likely that the value of these services is balanced by the greater needs of the students who receive them.
California Standards Test (CST) end-of-course test results and CAHSEE results provide consistent conclusions about students with disabilities. This year, we examined 2006 CST end-of-course test results for students with disabilities. CST score levels in 2006 were a very good predictor of success on the corresponding CAHSEE test in 2007: ELA students who progressed on pace from 9th grade to 10th
grade ELA tests passed the CAHSEE at higher rates than repeat 10th grade test-takers. Similarly, students who took the General Mathematics end-of-course test in 2006 passed the CAHSEE mathematics test at much lower rates than students who took the Algebra I end-of-course test in 2006.
Performance gaps for low-income and racial/ethnic minority students persist and these groups tend to be clustered in low-performing schools. Performance gaps for low-income and racial/ethnic minority students are large and cut across most groups of students defined by type of disadvantage (e.g., students with disabilities, English learners, and low-income students). Low-income and racial/ethnic minority students tend to be clustered in low performing schools and their performance in schools at each overall performance level examined here was lower than other students in these schools. While there has been an overall decrease in the total number of students in the lowest-performing schools (about 5 percent), the demographic composition of schools at each level has been relatively unchanged since 2004.
Teacher and Principal Survey Responses
In 2000, we identified a representative sample of about 100 California public high schools and asked them to participate in a survey that included responses from principals and from ELA and mathematics teachers. We have continued to survey this same sample of schools in the spring of each year, except for 2003 and 2005 when we conducted a larger study of instruction, with a few replacements as needed. Results from the 2007 survey, including both responses to some new questions and trend
Page iv Human Resources Research Organization (HumRRO)
Executive Summary
information for continuing questions (reported in detail in Chapter 4), provide information on what schools and teachers are doing to help prepare students for the CAHSEE and to help those who do not initially pass.
Many teachers continue to be unaware of state-provided CAHSEE resources such as the CDE Web site and Teacher Guide, while teachers who reported familiarity with these sources indicated they were useful. Implementation of activities to support teacher knowledge and readiness did not increase commensurate with the increases observed for students. In fact, results suggest that adequate preparatory activities for teachers might be lacking. Many teachers continue to be unaware of the CAHSEE resources of the CDE Web site (36%) and the Teacher Guide (18%). Those teachers who reported familiarity with these sources tended to find them useful, suggesting benefits to ensuring that all teachers gain familiarity with these resources.
Survey results suggest that the CAHSEE is reported to be useful for guiding instruction in schools where performance is lowest. Principals and teachers rated the impact of the CAHSEE on instructional activities. Overall, the trend in responses regarding the CAHSEE’s impact on instruction has been positive. A cross-analysis of the impact on instruction with actual performance data suggests teachers and principals from lower-performing schools perceive an increased positive impact of the CAHSEE on instruction. These results suggest the CAHSEE is most useful for guiding instruction for students and schools that need the most assistance.
Principals and ELA and math teachers did not agree on whether teachers in other subjects perceive that they share in responsibility for students’ success on the CAHSEE. Surveyed principals and ELA and math teachers rated how responsible they believed non-CAHSEE teachers considered themselves to be for student performance. Trends for principals increased substantially, while the trend for teachers decreased substantially. These results suggest a disconnect in the amount of responsibility teachers and principals believe is felt by non-CAHSEE teachers.
Trends in Educational Achievement and Persistence During the CAHSEE Era
Observed trends in important student outcomes over the past several years may reflect, in part, the far-reaching effects of the CAHSEE requirement for standards-based education and accountability. This year, we were able to examine graduation rates for the Class of 2006, the first class required to pass the CAHSEE for graduation. We continued to analyze participation in Advanced Placement tests and performance on college entrance tests to identify changes for students subject to the CAHSEE requirement.
Graduation rates declined by about 4 percentage points for the Class of 2006 (the most recent data available), the first year students were required to pass the CAHSEE to obtain a diploma. Similarly, dropout rates increased, most markedly in Grade 12. One important indicator of the impact of the CAHSEE
Human Resources Research Organization (HumRRO) Page v
Independent Evaluation of the CAHSEE: Fourth Biennial Report
requirement is whether the proportion of students who leave high school without a diploma changes in some way. CDE publishes two graduation rates: the rate at which the incoming senior class successfully completes high school and the graduation rate from Grade 9 to graduation. Both of these rates declined by 4 percentage points in 2006. Rates from 2007 were not available in time for this report.
While we found that 2007 fall enrollment figures showed that a larger percentage of students stayed in school and proceeded to the next class in the following fall, from grades 9 through 12, nonetheless we found that the official CDE dropout rate in Grade 12 increased markedly in the 2005–06 school year (the most recent year available).
College preparation activities hint at a broader interest among high school students in going to college. Participation in the SAT college entrance examination increased notably in the 2005–06 school year, at 40.5 percent, compared to 35.9 percent in the previous year. Over the same period the mean score among SAT examinees dropped by 4–5 points on both the verbal and math scales, and the percentage of students earning a combined score of 1000 or better declined from 19.3 to 19.2 percent. This combination of factors may indicate that a broader pool of students is considering continuing its formal education beyond high school.
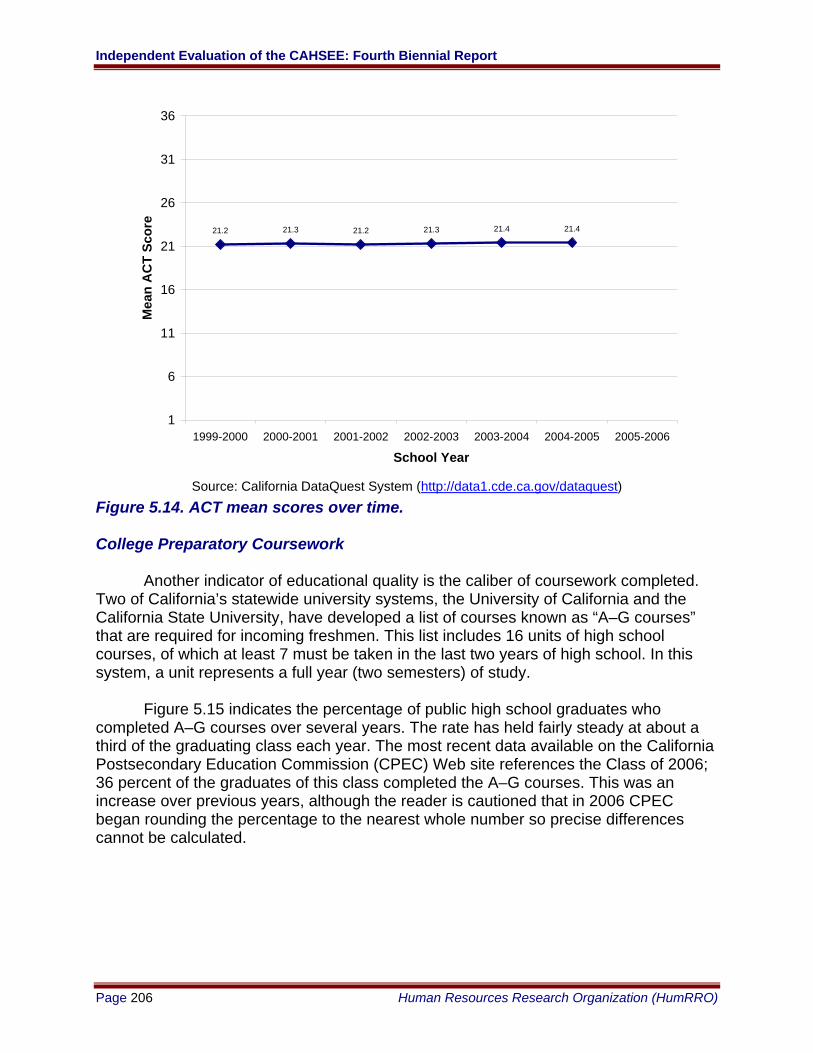
Rates of completion of A–G courses (which are identified as preparatory to California colleges) increased in 2005 over previous years; 2006 and 2007 data are not yet available. Meanwhile, participation in Advanced Placement (AP) exams, and scores of 3 or greater on those exams, have steadily increased since 2000. AP exam participation and pass rates increased markedly in 2006.
Recommendations
As in past years, we offer several general recommendations based on observations and findings from our evaluation activities. These recommendations are targeted to the Board and the legislature as they consider additions or modifications to policies concerning the CAHSEE and its use. At this time, we are not recommending overall changes to the CAHSEE requirement. Our first two recommendations concern the need for more information to identify programs that might mitigate negative consequences for students who are not able to pass the CAHSEE by the end of their senior year and to support further consideration of whether the CAHSEE passing score levels are set appropriately.
Recommendation 1: CDE should work with districts to track students who do not graduate on time.
A key question concerning the impact of the CAHSEE requirement is what happens to students who do not graduate on time. This year, we found that roughly 40 percent of students in the Class of 2006 who had not met the CAHSEE requirement continued to take the test. Most were shown as repeat 10th graders; some were in adult education programs. Little else is know specifically about Class of 2006 members who
Page vi Human Resources Research Organization (HumRRO)
Executive Summary
did not graduate in June 2006. It would be important to know which of them also failed to meet other graduation requirements. Also, what are the other 60 percent who are not taking the CAHSEE doing? Have some gone on to community college anyway? How many are pursuing a General Education Diploma (GED)? How many are employed? Key policy questions include whether the programs these nongraduates are pursuing are effective and whether more students should be aware of some of these programs. One or more special studies would be needed to address these questions.
Recommendation 2: For students who do graduate, it would be useful to link their high school test scores to information on community college, state college, and university experiences.
More information is needed on the subsequent success of students who pass the CAHSEE and graduate with their class. For students who attend California’s community colleges and state colleges and universities, it should be possible to link first year college records to CAHSEE test scores using the new statewide student identifier. How closely are CAHSEE scores linked to whether students required remedial work in reading or mathematics before being able to take credit-bearing courses? To what extent would raising (or lowering) the CAHSEE passing score reduce (or increase) the proportion of students who have to take remedial courses? What would be the likely effect of changes in the CAHSEE passing score on first-year grades, particularly in the community college system?
Our next two recommendations call for further investigation of factors that make CAHSEE a more difficult requirement for some groups of disadvantaged students.
Recommendation 3: Reasons for low performance in schools with higher densities of minorities and low-income students should be studied to identify possible remedies.
A persistent and perplexing problem is the finding of a strong relationship between the density of minority and low-income students in a school and low performance on the CAHSEE. More detailed studies are needed to identify causal factors and plausible remedies. New school finance data may make it possible to identify differences in the level and allocation of funding for facilities, books, teacher salaries, libraries, and other factors that differentiate higher and lower performing schools among those serving high densities of disadvantaged students. Better measures of teacher quality, school management, and parent and peer support for academic achievement might further indicate differences between high and low performing schools. Most importantly, programs and systems used in higher performing schools might be identified and tested for applicability in a wider range of schools.
Recommendation 4: Now that statewide student identifiers are generally in use, CDE should analyze student progress at earlier grades as measured by CSTs and, for English Learners, the CELDT to see where and when students begin to get off track.
Human Resources Research Organization (HumRRO) Page vii
Independent Evaluation of the CAHSEE: Fourth Biennial Report
While many students who are not initially fluent in English benefit from current English language development programs, many do not. More detailed studies of the large number of students who persist as English learners from early grades into high school are needed. Similarly, many students, particularly students with disabilities, come to high school unprepared to take Algebra I. When and how do these students begin to get off track in developing the skills necessary to be successful in high school mathematics?
The availability of statewide student identifiers makes it possible to track student scores on the California Standards Tests and, for English learners, the California English Language Development Test from one grade to the next and identify points at which students fail to make expected progress. CDE might work with school districts to collect targeted additional information about students and their programs at these key points when needed in order to suggest remedies.
While our most urgent recommendations above concern the need for more information, we conclude with three recommendations for ways to student success with the CAHSEE.
Recommendation 5: California should explore options for supporting and improving professional development programs for high school teachers.
A persistent finding from our teacher and principal surveys is the suggestion of the questionable quality of professional development programs for teachers. Continued efforts to improve effectiveness in standards-based instruction for teachers at all levels are needed. Teachers in lower-performing schools, particularly, should be helped and encouraged to participate in such programs. Professional development programs to help teachers of English learners and students with disabilities to improve instructional methods would be particularly useful.
Recommendation 6: Districts, schools, and IEP teams should make all possible efforts to provide access to the general curriculum to students with disabilities so that these students can obtain the skills needed to pass the CAHSEE.
For the past 3 years, our findings have demonstrated a clear link between participation in regular classroom instruction for students with disabilities and their success on the CAHSEE. Increased participation in regular instruction would very likely lead to increases in CAHSEE passing rates for students with disabilities. For students who truly cannot participate in regular instruction, providing alternative instruction that is still standards-based is key to success on the CAHSEE. For a very small number of students with more profound disabilities, such as severe mental retardation, alternative goals and ways of recognizing them are still needed.
Page viii Human Resources Research Organization (HumRRO)
Executive Summary
Recommendation 7: California should continue to explore alternate routes to demonstrating proficiency. Programs that consider grades and other factors besides test scores, introduced in Massachusetts and Washington, provide examples for consideration.
Several states have recognized alternative ways that students may demonstrate the proficiency needed for high school graduation. Such programs consider coursework and grades as well as test scores. While evidence to date suggests that such programs lead to only a small number of additional students demonstrating proficiency, California might nonetheless consider whether to adopt similar policies for allowing students to meet the CAHSEE requirement.
Summary
With a few exceptions, students in the Class of 2006 were required to pass the CAHSEE to receive a high school diploma. This requirement appears to have led to a modest decrease in graduation rates for the Class of 2006 compared to other recent high school classes. Even though it has now been 8 years since the original CAHSEE legislation was passed, we are just at the beginning of understanding fully the consequences of this requirement. Evaluation results to date suggest that the CAHSEE requirement has led to improved alignment of curriculum to the California Content Standards, improved remedial opportunities for students who do not master these standards in their initial coursework, and increased motivation for students to work hard in their classes. The attention focused on the CAHSEE requirement has not led to any decline in student participation in Advanced Placement courses or any decline in participation in and success with college entrance examinations.
Notwithstanding positive impacts of the CAHSEE requirement, failure to earn a high school diploma can have very negative consequences. Many of the students who did not graduate with their classmates last year are continuing to work to earn the diploma. Recent legislation, signed by the Governor this year, ensures that students have access to at least 2 more years of schooling to earn their diplomas. It remains to be seen whether benefits from the additional skills mastered by students who work to pass the CAHSEE will, in the end, outweigh costs to those students who are not successful in earning a diploma because of the CAHSEE requirement.
Human Resources Research Organization (HumRRO) Page ix
Table of Contents
Independent Evaluation of the California High School Exit Examination (CAHSEE): Fourth Biennial Report
Table of Contents
Page Executive Summary......................................................................................................................... i
: Introduction....................................................................................................................1Chapter 1The California High School Exit Examination ........................................................................... 1 Prior Evaluation Activities and Outcomes.................................................................................. 2 Organization and Contents of 2007 Evaluation Report ............................................................ 16
: Results from the 2006–07 Administrations .................................................................19Chapter 2Introduction............................................................................................................................... 19 Analysis of the Test Score Data................................................................................................ 21 Test Results............................................................................................................................... 39 School-Level Effects................................................................................................................. 66 Student Questionnaire Responses ............................................................................................. 73 Summary of Test Results .......................................................................................................... 81
Chapter 3: A Closer Look At Specific Populations.......................................................................83 Introduction............................................................................................................................... 83 Results for English Learners..................................................................................................... 83 Results for Reclassified Fluent English Proficient Students..................................................... 93 CELDT Scores for EL and RFEP Students .............................................................................. 96 Results for Students in Special Education Programs ................................................................ 97 Accommodations and Modifications ...................................................................................... 108 CST Scores.............................................................................................................................. 111 Racial/Ethnic Minorities and Low-Income Students.............................................................. 112 Summary of Findings.............................................................................................................. 124
Chapter 4: Principal and Teacher Survey Responses ..................................................................127 Introduction............................................................................................................................. 127 Survey Development............................................................................................................... 127 Sampling and Administration ................................................................................................. 127Survey Findings ...................................................................................................................... 128 Summary ................................................................................................................................. 180
Chapter 5: Trends in Educational Achievement and Persistence During the CAHSEE Era.......185 Introduction............................................................................................................................. 185 Students Who Leave High School Prematurely...................................................................... 185 Graduation Rates..................................................................................................................... 201 Student Plans After High School ............................................................................................ 202 College Preparation (SAT/ACT/UC & CSU courses)............................................................ 203 College/University Enrollment ............................................................................................... 210Summary Findings .................................................................................................................. 211
Human Resources Research Organization (HumRRO) Page xi
Independent Evaluation of the CAHSEE: Fourth Biennial Report
Table of Contents (Continued)
Page Chapter 6: Summary and Recommendations ..............................................................................213
Page xii Human Resources Research Organization (HumRRO)
Table of Contents
Page
List of Tables
Table 2.1. Number of CAHSEE 2006–07 Answer Documents and Number Passing Each Test by Administration Date............................................................................ 23
Table 2.2. Number of Students Participating in One or More 2006–07 CAHSEE Administration by Grade and Test
Table 2.12. Zone of Uncertainty for 2002 and 2007 Test Forms in Percent Correct Units
............................................................................ 24Table 2.3. Number of Students with Matching Prior Year Data by Grade and Test ...... 25Table 2.4. Number of Students Matched to Prior-Year Records by Current and Prior
Grade....................................................................................................................... 26Table 2.5. Tenth Grade Enrollment Estimates from California Basic Data Education
Data System (CBEDS), STAR, and CAHSEE* ........................................................ 27Table 2.6a. Comparison of Item Difficulty Parameter Estimates (Multiple Choice) ....... 29Table 2.6b. Comparison of Item Difficulty Parameter Estimates (Essay Question)....... 30Table 2.7a. Raw-to-Scale Score Conversions for the 2006–07 ELA Tests ................... 31Table 2.7b. Raw-to-Scale Score Conversions for the 2006–07 Mathematics Tests...... 32Table 2.8. Scoring Consistency for Student Essays...................................................... 34Table 2.9. Percent of 10th Grade Essays Assigned Each Score Level by Each Rater in
the February Through May 2007 Administrations .................................................... 35Table 2.10. Percent of 11th Grade Essays Assigned Each Score Level by Each Rater in
the 2006–07 Administrations ................................................................................... 35Table 2.11. Percent of 12th Grade Essays Assigned Each Score Level by Each Rater in
the 2006–07 Administrations ................................................................................... 35
................................................................................................................................. 36Table 2.13. Percent of Students in Each Score Range ................................................. 38Table 2.14. Estimated Number and Percent of Students in the Class of 2006 Passing
Both CAHSEE Tests Through May 2007 ................................................................. 39Table 2.15. Estimated Number and Percent of Students in the Class of 2006 Passing
the CAHSEE ELA Test Through May 2007 ............................................................. 40Table 2.16. Estimated Number and Percent of Students in the Class of 2006 Passing
the CAHSEE Mathematics Test Through May 2007 ................................................ 41Table 2.17. Estimated Number and Percent of Students in the Class of 2007* Passing
Both CAHSEE Tests Through May 2007 ................................................................. 42Table 2.18. Estimated Number and Percent of Students in the Class of 2007* Passing
the CAHSEE ELA Test Through March 2007 .......................................................... 43Table 2.19. Estimated Number and Percent of Students in the Class of 2007* Passing
the CAHSEE Mathematics Test Through May 2007 ................................................ 44Table 2.20. Estimated Number and Percent of Students in the Class of 2007* Passing
Both CAHSEE Tests Through May 2007 — Excluding Repeat 12th Graders.......... 45Table 2.21. Estimated Number and Percent of Students in the Class of 2007* Passing
the CAHSEE ELA Test Through May 2007 — Excluding Repeat 12th Graders ...... 46Table 2.22. Estimated Number and Percent of Students in the Class of 2007* Passing
the CAHSEE Mathematics Test Through May 2007 — Excluding Repeat 12th Graders.................................................................................................................... 47
Human Resources Research Organization (HumRRO) Page xiii
Independent Evaluation of the CAHSEE: Fourth Biennial Report
Table 2.23. Comparison of Estimated Passing Rates for the Classes of 2006 and 2007 Through May of Their Senior Year........................................................................... 48
Table 2.24. Distribution of 12th Graders and Percent Passing Mathematics by Highest Mathematics Course Taken ..................................................................................... 49
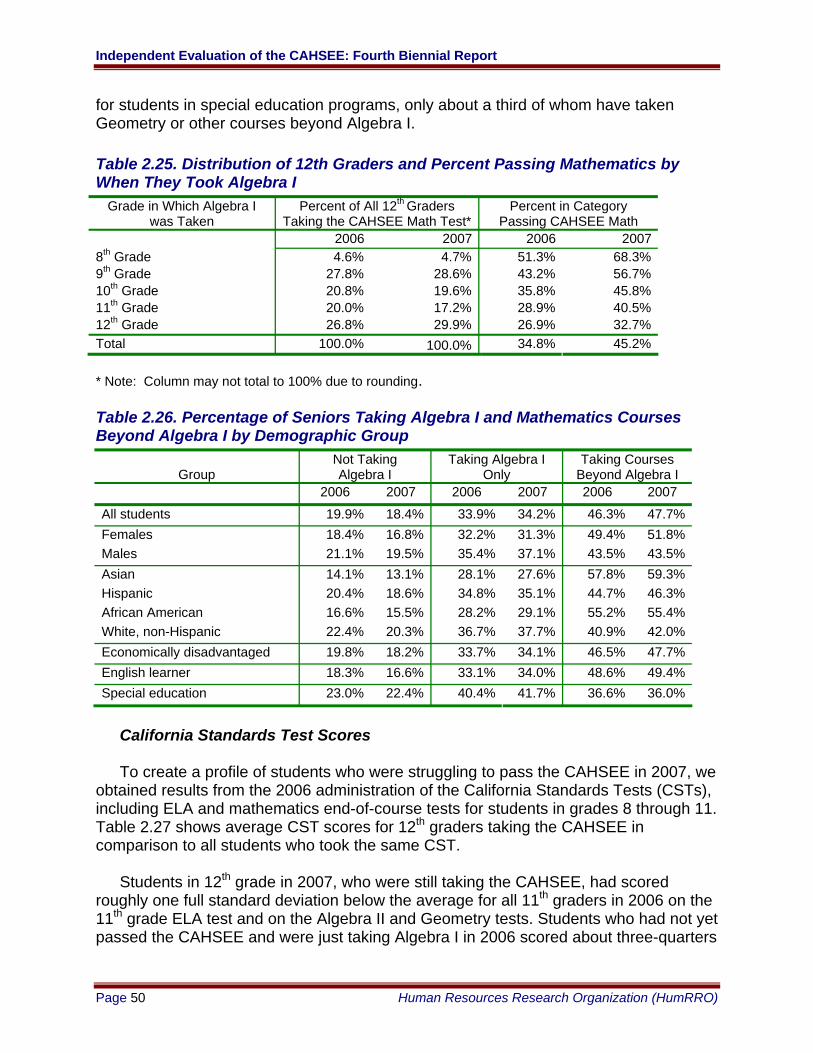
Table 2.25. Distribution of 12th Graders and Percent Passing Mathematics by When They Took Algebra I................................................................................................. 50
Table 2.26. Percentage of Seniors Taking Algebra I and Mathematics Courses Beyond Algebra I by Demographic Group............................................................................. 50
Table 2.27. 2006 CST Score Means, Standard Deviations, and Correlation WithCAHSEE Scores for Students Taking the CAHSEE in 2007.................................... 51
Table 2.28. Percentage of Current 12th Grade Students at Each CST Performance Level in 2006 Who Completed the CAHSEE Requirement in 2007................................... 51
Table 2.29. Distribution of 12th Graders and Percent Passing Mathematics by Responses to Mathematics Questionnaire Items..................................................... 52
Table 2.30. Mathematics Courses Taken by Responses to Mathematics Questionnaire Items ........................................................................................................................ 53
Table 2.31. Demographic Characteristics of Non-SE 12th Graders Not Passing the CAHSEE in 2007 Compared to All 10th Graders in 2005 ........................................ 55
Table 2.32. Estimated Number and Percent of Students in the Class of 2008 Passing Both CAHSEE Tests Through 11th Grade................................................................ 56
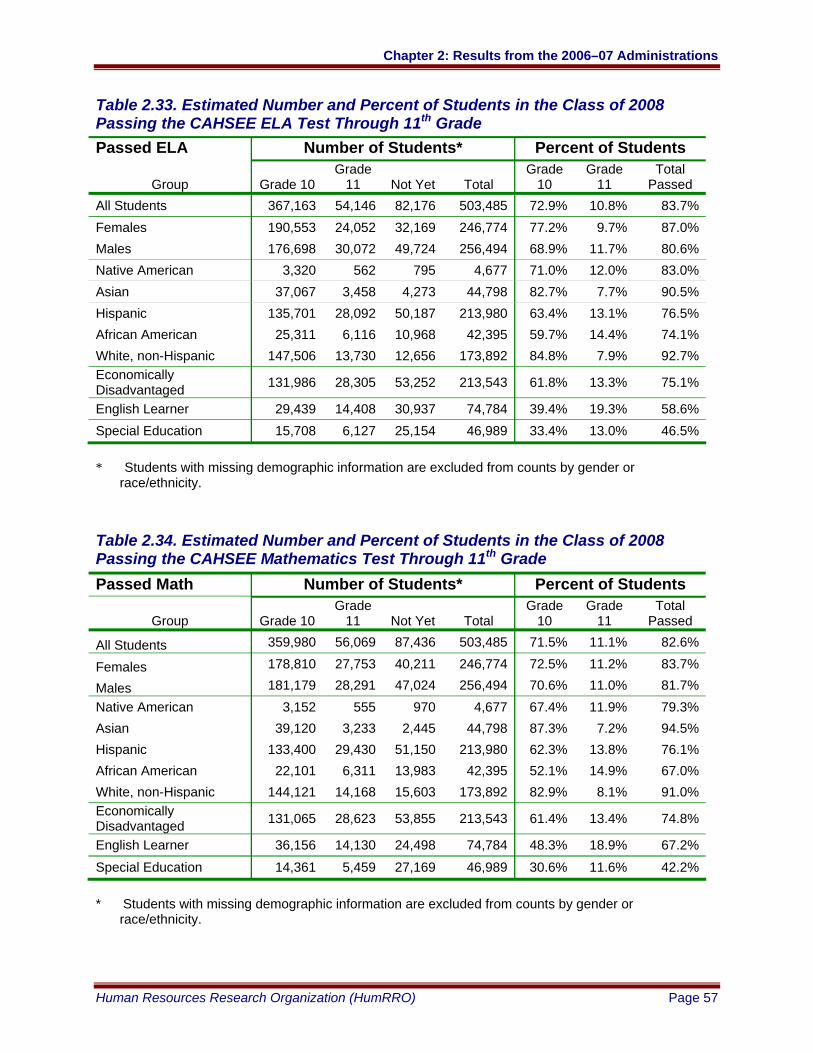
Table 2.33. Estimated Number and Percent of Students in the Class of 2008 Passing the CAHSEE ELA Test Through 11th Grade ............................................................ 57
Table 2.34. Estimated Number and Percent of Students in the Class of 2008 Passing the CAHSEE Mathematics Test Through 11th Grade............................................... 57
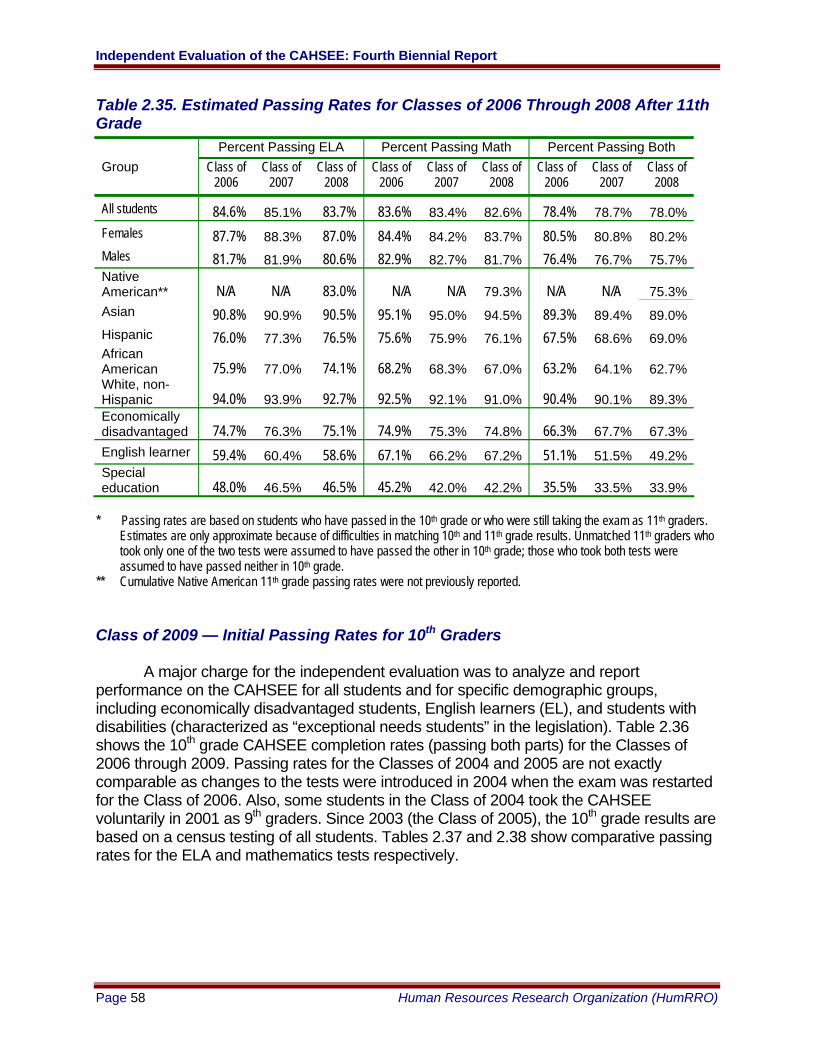
Table 2.35. Estimated Passing Rates for Classes of 2006 Through 2008 After 11th Grade....................................................................................................................... 58
Table 2.36. Percent of 10th Grade Students Passing Both Parts of the CAHSEE by Demographic Group................................................................................................. 59
Table 2.37. Initial 10th Grade Passing Rates by Demographic Group—English-Language Arts ......................................................................................................... 60
Table 2.38. Initial 10th Grade Passing Rates by Demographic Group—Mathematics ... 61Table 2.39. Percent of First-Time and Repeat 10th Grade Students Passing the
CAHSEE by Demographic Group ............................................................................ 63Table 2.40. Distribution of 10th Grade Students by Highest Math Course Taken .......... 64Table 2.41. Trends in Math Courses Taken by Demographic Group ............................ 65Table 2.42. Initial Mathematics Passing Rates by Class and Highest Math Course
Taken....................................................................................................................... 66Table 2.43. 2006 10th Grade ELA Passing Rates for Schools With Different
Concentrations of Minority or At-Risk Students* ...................................................... 68Table 2.44. Variance Decompositions for 10th Graders’ CAHSEE Math and ELA Scores,
March 2007 .............................................................................................................. 72Table 2.45. Regression Coefficients for Student Characteristics in Random Coefficients
Model Analysis......................................................................................................... 72Table 2.46. Regression Coefficients for School Characteristics in Conditional Means
Model Analysis......................................................................................................... 73Table 2.47. Student Responses: How Did You Prepare for This Test?......................... 74
Page xiv Human Resources Research Organization (HumRRO)
Table of Contents
Table 2.48. Student Responses: How Important Is This Test for You? ......................... 74Table 2.49. Student Responses: Do You Think You Will Graduate From High School?75Table 2.50. Student Responses: What Might Prevent You From Graduating? ............. 75Table 2.51. Student Responses: What Do You Think You Will Do After High School?. 76Table 2.52. Student Responses: How Sure Are You About What You Will Do After High
School?.................................................................................................................... 76Table 2.53. Student Responses: How Well Did You Do On This Test? ........................ 76Table 2.54. Student Responses: What Reasons Prevented You From Doing As Well As
You Could Have On This Test? ............................................................................... 77Table 2.55. Student Responses: Were The Topics on the Test Covered in Courses You
Have Taken? ........................................................................................................... 77Table 2.56. Student Responses: Were Any of the Questions on the Test Different From
What You Have Encountered in Classes? ............................................................... 78Table 2.57. Student Responses: Were the Questions on the Test More Difficult Than
Questions You Have Encountered in Classes? ....................................................... 78Table 2.58. Student Responses: If Some Topics on the Test Were Difficult for You, Was
It Because…. ........................................................................................................... 79Table 2.59. Student Responses: Have You Worked … To Learn the English-language
Arts Skills Tested by the CAHSEE?......................................................................... 79Table 2.60. Student Responses: If You Do Not Pass the CAHSEE in This
Administration, What Are You Most Likely To Do? .................................................. 80Table 2.61. Student Responses: Have You Passed Part of the CAHSEE Already, Prior
to This Administration? ............................................................................................ 80Table 2.62. Student Responses: What Grade Were You In During the Past School
Table 3.1. Number of Answer Documents and CAHSEE Passing Rates by Grade and Language Fluency ................................................................................................... 84
Table 3.2. Number of 10th Grade EL Students and CAHSEE Passing Rates by Number of Years in US Schools ............................................................................................ 85
Table 3.3. Number of 10th Grade EL Students and CAHSEE Passing Rates by Primary Language ................................................................................................................. 88
Table 3.4. Number of 10th Grade EL Students and CAHSEE Passing Rates by Type of EL Program.............................................................................................................. 90
Table 3.5. Number of 10th Grade EL Students and CAHSEE Passing Rates by Type of Program ................................................................................................................... 91
Table 3.6. Number of 10th Grade EL Students and CAHSEE Passing Rates Receiving EL Accommodations ................................................................................................ 92
Table 3.7. Characteristics of Students with Recent and Earlier EL Enrollment Dates ... 93Table 3.8. Number of RFEP Students and CAHSEE Passing Rates by Year of
Reclassification ........................................................................................................ 94Table 3.9. Number of 2007 CAHSEE Examinees With Matching CELDT Records....... 96Table 3.10. ELA Passing Rates by CELDT Performance Level .................................... 96Table 3.11. Number of Students in the Matched CAHSEE-CASEMIS Files by Grade on
Each File.................................................................................................................. 99
Human Resources Research Organization (HumRRO) Page xv
Independent Evaluation of the CAHSEE: Fourth Biennial Report
Table 3.12. Number of 10th Grade Students and Percent Passing by Time Away fromRegular Instruction (2005 and 2006 Students with CASEMIS Data)...................... 101
Table 3.13. Testing and Passing Rates for Students in Regular Classroom Instruction Less than 20 Percent of Time by Primary Disability* ............................................. 102
Table 3.14. Testing and Passing Rates for Students in Regular Classroom Instruction at Least 80 Percent of Time by Primary Disability* .................................................... 103
Table 3.15. Testing and Passing Rates for Students in Regular Classroom Instruction Less than 20 Percent of Time by Primary Disability* and Service ......................... 104
Table 3.16. Testing and Passing Rates for Students in Regular Classroom Instruction at Least 80 Percent of the Time by Primary Disability* and Service .......................... 105
Table 3.17. Number of Students, Average Prior Year (Grade 10) Scores, and Average Score Gain by Time Away from Regular Instruction for 11th Grade Students Taking the CAHSEE in 2005 through 2007 ....................................................................... 107
Table 3.18. Average 2007 Score Gains for 11th Grade Students with Low and High Participation in Regular Classroom Instruction by Primary Disability Code ........... 108
Table 3.19. Frequency of Accommodations and Modifications and Percent Scoring 350 or More – ELA........................................................................................................ 109
Table 3.20. Frequency of Accommodations and Modifications and Percent Scoring 350 or More – Mathematics .......................................................................................... 110
Table 3.21. Frequency and Percent of SWD Passing the CAHSEE ELA Test in 2007 by 2006 ELA CST Performance Level – 10th Graders in Special Education Programs............................................................................................................................... 111
Table 3.22. Frequency and Percent of SWD Passing the CAHSEE Mathematics Test in 2007 by 2006 Mathematics CST Performance Level – 10th Graders in Special Education Programs .............................................................................................. 112
Table 4.1. Longitudinal Survey Response Rates ........................................................ 129Table 4.2. T-1: Educational Attainment in Teacher Samples (Percentages) ............... 132Table 4.3. T-8: Percentage of Teachers Indicating Their Students Spend Time Each
Week on Selected Classroom Activities................................................................. 134Table 4.4. PR-3: Major Staff Changes Over the Last Three Years as Reported in 2006
and 2007 Principal Samples (Percentages)........................................................... 135Table 4.5. PR-4: Percent of Schools Offering Specialty Education Programs and
Estimated Percentage of Students Participating in Each ....................................... 136Table 4.6. PR-5: Mean (Median) Estimated Graduation Rates as Reported in 2006 and
2007 Principal Samples ......................................................................................... 137Table 4.7a. CAHSEE 2007 Student Performance Data - Teacher Sample (Percentages)
............................................................................................................................... 138Table 4.7b. CAHSEE 2007 Student Performance Data - Principal Sample (Percentages)
............................................................................................................................... 139Table 4.8a. CAHSEE 2007 Pass Rates for First-Time Test Takers in Schools With (and
Without) Large Proportions of At-Risk Students - Teacher Sample (Percentages)*............................................................................................................................... 140
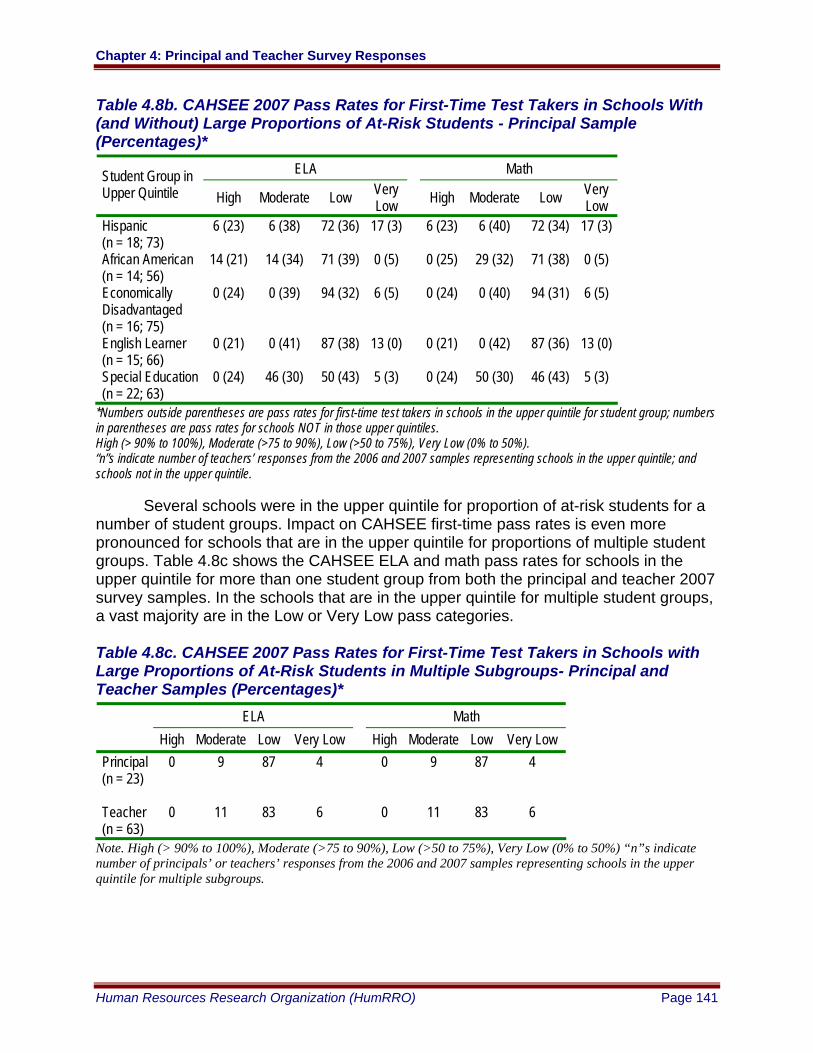
Table 4.8b. CAHSEE 2007 Pass Rates for First-Time Test Takers in Schools With (and Without) Large Proportions of At-Risk Students - Principal Sample (Percentages)*............................................................................................................................... 141
Page xvi Human Resources Research Organization (HumRRO)
Table of Contents
Table 4.8c. CAHSEE 2007 Pass Rates for First-Time Test Takers in Schools with Large Proportions of At-Risk Students in Multiple Subgroups- Principal and TeacherSamples (Percentages)* ........................................................................................ 141
Table 4.9. PR-14: Principals’ Report of Activities Offered and Ranked Most Important for CAHSEE Preparation............................................................................................. 143
Table 4.10. PR-32: Percentage of Principals Reporting Actions Implemented to Promote Learning for All Students........................................................................................ 145
Table 4.11. T-16: Teachers’ Report of Activities Offered and Ranked Most Important for CAHSEE Preparation............................................................................................. 146
Table 4.12a. T-11: Percentage of Teachers Indicating Coverage of ELA Standards by Curriculum ............................................................................................................. 147
Table 4.12b. T-12: Percentage of Teachers Indicating Coverage of Mathematics Standards by Curriculum ....................................................................................... 147
Table 4.13a. PR-28: Principals’ 2001–06/07 Estimates of the Percentage of Students with Instruction on ELA Content Standards ........................................................... 148
Table 4.13b. PR-29: Principals’ 2001–06/07 Estimates of the Percentage of Students with Instruction on Math Content Standards .......................................................... 149
Table 4.14. T-13: Teachers’ Ratings of Preparedness of Students in the 10th Grade (Percentages) ........................................................................................................ 151
Table 4.15. PR-32: Percentage of Principals Reporting Actions Implemented to Promote Learning for All Students........................................................................................ 152
Table 4.16. T-9, T-10: Teacher Ratings of Usefulness of CAHSEE Resources (Percentages) ........................................................................................................ 152
Table 4.17. T-15: Teachers’ Quality Ratings of Local and State Professional Development Experiences (Percentages).............................................................. 153
Table 4.18. PR-9, PR-10: Principals’ Responses on Relationships between State and District Standards (Percentages) ........................................................................... 154
Table 4.19. PR-11: Principals’ Reported Percentages of Preparations for District Alignment with California Content Standards......................................................... 155
Table 4.20. PR-16, PR-17: Percentage of Principals Reporting Teachers Have and Use CST/CAHSEE Blueprints ....................................................................................... 156
Table 4.21. PR-18: Percentage of Principals Who Gather Evidence That ELA and Math Teachers Are Teaching to the Standards .............................................................. 156
Table 4.22a. PR-26, T-18: Teachers’ and Principals’ Estimated Impact of the CAHSEE on Student Motivation Prior to Taking the Exam for the First Time (Percentages) 158
Table 4.22b. PR-26, T-18: Teachers’ and Principals’ Estimated Impact of the CAHSEE on Students Who Pass on Their First Attempt (Percentages)................................ 158
Table 4.22c. PR-26, T-18: Teachers’ and Principals’ Estimated Impact of the CAHSEE on Students Who Do Not Pass on Their First Attempt (Percentages).................... 158
Table 4.23a. PR-26, T-18: Teachers’ and Principals’ Estimated Impact of the CAHSEE on Parental Involvement for Parents of Students Who Have Not Yet Taken the CAHSEE (Percentages)......................................................................................... 160
Table 4.23b. PR-26, T-18: Teachers’ and Principals’ Estimated Impact of the CAHSEE on Parental Involvement for Parents of Students Who Pass the CAHSEE (Percentages) ........................................................................................................ 160
Human Resources Research Organization (HumRRO) Page xvii
Independent Evaluation of the CAHSEE: Fourth Biennial Report
Table 4.23c. PR-26, T-18: Teachers’ and Principals’ Estimated Impact of the CAHSEE on Parental Involvement for Parents of Students Who Do Not Pass the CAHSEE (Percentages) ........................................................................................................ 160
Table 4.24. T-14: Teacher Time Spent in CAHSEE-Related Classroom Instruction and Total CAHSEE-Related Activities (Percentages) ................................................... 161
Table 4.25. PR-25: Principals’ Reports of the Extent to Which the CAHSEE Draws Resources Away From Various Categories of Courses (Percentages).................. 162
Table 4.26. PR-19, T-17: Respondent Ratings of How Teachers Other than ELA and Math View Themselves as Responsible for Student Success ............................... 163
Table 4.27. PR-27, T-20: Principal and Teacher Ratings of CAHSEE Influence on Instructional Practices (Percentages) .................................................................... 164
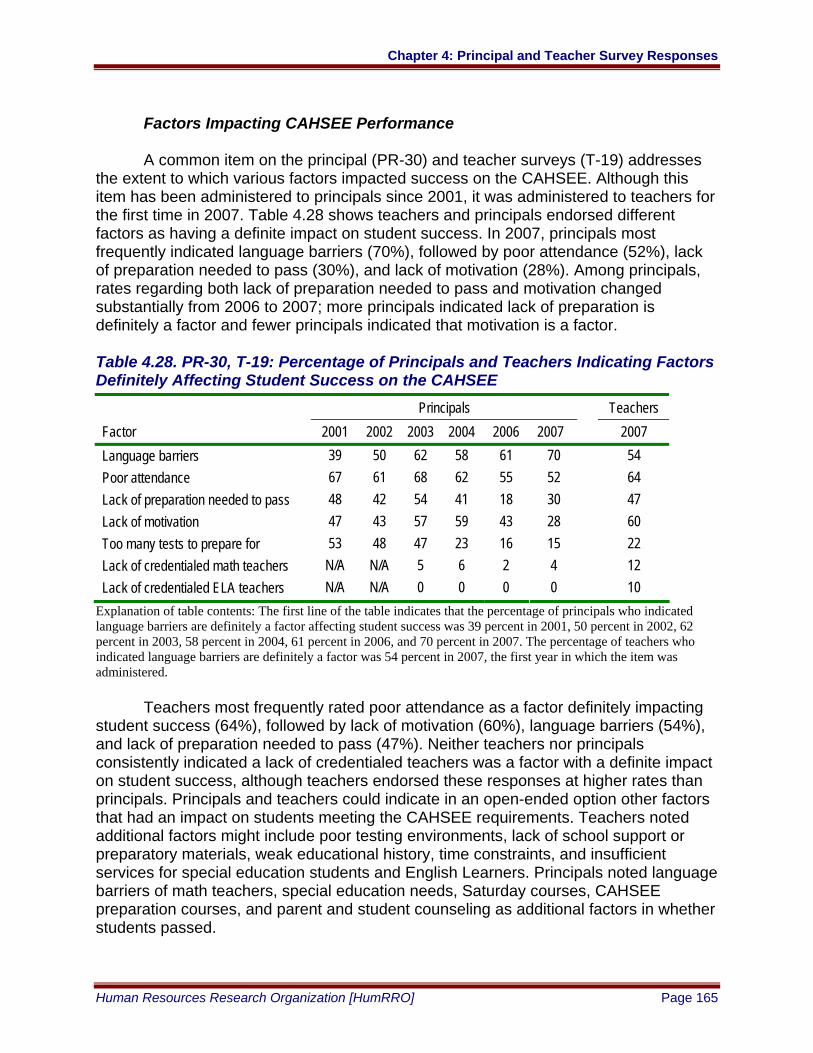
Table 4.28. PR-30, T-19: Percentage of Principals and Teachers Indicating Factors Definitely Affecting Student Success on the CAHSEE........................................... 165
Table 4.29. T-21: Teacher-Reported Specific Benefits, Challenges, and Recommendations to Help Schools and Students Succeed on the CAHSEE (continued) ............................................................................................................. 168
Table 4.30. PR-13: Principals’ Reports of Various Information Sources to Identify At-Risk Students (Percentages) ................................................................................. 169
Table 4.31. PR-20: Percentage of Principals Indicating Implementation Status of Plans to Assist High School Students Who Do Not Pass or Do Not Seem Prepared to Take the CAHSEE .......................................................................................................... 171
Table 4.31. PR-20: Percentage of Principals Indicating Implementation Status of Plans to Assist High School Students Who Do Not Pass or Do Not Seem Prepared to Take the CAHSEE (continued) ....................................................................................... 172
Table 4.32. PR-23: Principals Reporting Availability of Options for Seniors Who Do Not Pass the CAHSEE (Percentages).......................................................................... 173
Table 4.33. PR-31: Extent to Which Principals Indicate Financial Constraints Limited Providing Services in the Past Four Years (Percentages) ..................................... 174
Table 4.34. PR-21: Principals Reporting Percentages of Seniors Unlikely to Graduate Due to Various Requirements ................................................................................ 176
Table 4.35a. PR-26, T-18: Teachers’ and Principals’ Estimated Impact of the CAHSEE on Student Retention Rates (Percentages) ........................................................... 177
Table 4.35b. PR-26, T-18: Teachers’ and Principals’ Estimated Impact of the CAHSEE on Student Dropout Rates (Percentages) .............................................................. 177
Table 4.36. Percentage of Principals with Schools in Each Pass Category on the ELA Test Rating Various Factors Impacting Success on the CAHSEE as Not a Factor or Definitely a Factor .................................................................................................. 179
Table 4.37. Percentage of Principals with Schools in Each Pass Category on the Math Test Rating Various Factors Impacting Success on the CAHSEE as Not a Factor or Definitely a Factor .................................................................................................. 179
Table 5.1. CDE 4-Year Dropout Rates by Race/Ethnicity (Percentages) .................... 190Table 5.2. Enrollment Declines From 9th to 10th Grade by High School Class ............ 193Table 5.3. Enrollment Declines From 10th Grade to 11th Grade .................................. 194Table 5.4. Enrollment Declines From 11th Grade to 12th Grade .................................. 195Table 5.5. Number of First-time GED Examinees Under the Age of 21, by Year ........ 196
Page xviii Human Resources Research Organization (HumRRO)
Table of Contents
Table 5.6. Number of GED Examinees Under the Age of 21, by Year, Sex, and Race/Ethnicity ........................................................................................................ 197
Table 5.7. Passing Rates of GED Examinees Under the Age of 21, by Year and Race/Ethnicity ........................................................................................................ 198
Table 5.8. Expectations of High School Graduation Indicated by 10th Grade Students in 2004, 2005, and 2006 ............................................................................................ 200
Table 5.9. Expectations of High School Graduation Indicated by 10th Grade Students in 2004, 2005, and 2006 ............................................................................................ 202
Table 5.10. Post-High School Plans Indicated by 10th Grade Students in 2004, 2005, and 2006 ................................................................................................................ 203
Table 5.11. A–G Course Completions as a Percentage of Freshmen 4 Years Earlier, by Race/Ethnicity and Gender .................................................................................... 207
Table 5.12. California Postsecondary Education Commission (CPEC) Counts of High School Graduates and FTF Enrollments................................................................ 211
Human Resources Research Organization (HumRRO) Page xix
Table of Contents
Page List of Figures
Figure 2.1. Percent of students in 2002 and 2007 below, within, and above the zone of uncertainty. .............................................................................................................. 38
Figure 2.2. Trends in 10th grade CAHSEE passing rates. ............................................ 62Figure 2.3. Trends in overall passing rates for selected groups. ................................... 62Figure 2.4a. Average scores for Hispanic students by percent of Hispanics in the
school. ..................................................................................................................... 69Figure 2.4b. Average scores for African American students by percent of African
Americans in the school. .......................................................................................... 69Figure 2.4c. Average scores for Low-SES students by percent of Low-SES students in
the School. ............................................................................................................... 70Figure 2.4d. Average Scores for English learners by percent of English learners in the
school. ..................................................................................................................... 70Figure 2.4e. Average scores for students with disabilities (SE) by percent of students
with disabilities in the school. ................................................................................... 71
Figure 3.1. Number of 10th Grade EL students by number of years enrolled in US schools..................................................................................................................... 86
Figure 3.2. CAHSEE passing rates for 10th Grade EL students by number of years enrolled in US schools. ............................................................................................ 86
............... 89Figure 3.3. Number of 10th Grade EL students by home language. .............................. 88Figure 3.4. ELA passing rates for 10th grade EL students by home languageFigure 3.5. Math passing rates for 10th grade EL students by home language. ............ 89Figure 3.6. Number of 10th grade RFEP students by estimated grade at reclassification.
................................................................................................................................. 95Figure 3.7. CAHSEE passing rates for 10th grade RFEP students by estimated grade at
reclassification. ........................................................................................................ 95Figure 3.8. Percent of students passing both parts of the CAHSEE by percent of time in
regular class instruction for all students with disabilities and for students with specific learning disabilities (SLD). ..................................................................................... 100
Figure 3.9. Percent passing ELA for students in schools sorted by 2004 average passing levels. ....................................................................................................... 116
Figure 3.10. Percent passing mathematics for students in schools sorted by 2004 average passing levels. ......................................................................................... 116
Figure 3.11. Number of 10th grade students in schools sorted by 2004 average passing levels...................................................................................................................... 118
Figure 3.12. Percent of low-income students in schools sorted by 2004 average passing levels...................................................................................................................... 118
Figure 3.13. Percent of Hispanic students in schools sorted by 2004 average passing levels...................................................................................................................... 119
Figure 3.14. Percent of African American students in schools sorted by 2004 average passing levels. ....................................................................................................... 119
Figure 3.15. Percent of all and low-income students in each 2004 school performance level. ...................................................................................................................... 120
Human Resources Research Organization (HumRRO) Page xxi
Independent Evaluation of the CAHSEE: Fourth Biennial Report
Figure 3.16. Percent of Hispanic and African American students in each 2004 school performance level. ................................................................................................. 120
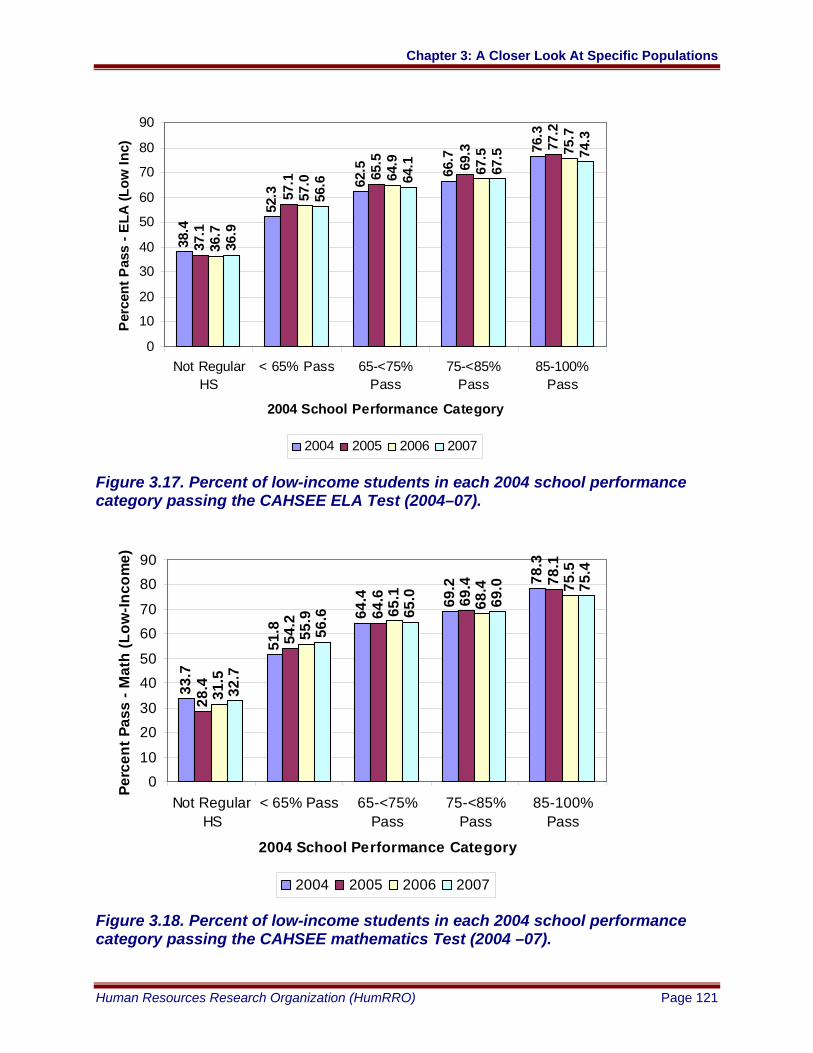
Figure 3.17. Percent of low-income students in each 2004 school performance category passing the CAHSEE ELA Test (2004–07)............................................................ 121
Figure 3.18. Percent of low-income students in each 2004 school performance category passing the CAHSEE mathematics Test (2004 –07). ............................................ 121
Figure 3.19. Percent of Hispanic students in each 2004 school performance category passing the CAHSEE ELA Test (2004 –07)........................................................... 122
Figure 3.20. Percent of Hispanic students in each 2004 school performance category passing the CAHSEE Mathematics Test (2004 –07). ............................................ 122
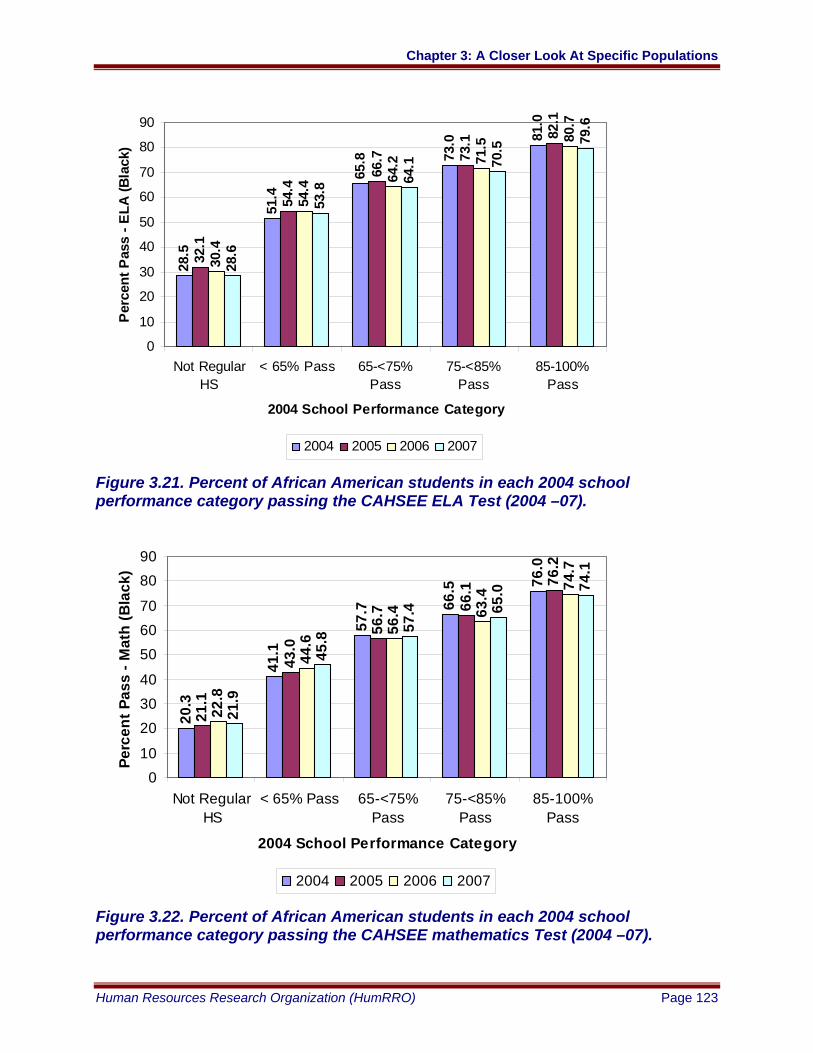
Figure 3.21. Percent of African American students in each 2004 school performance category passing the CAHSEE ELA Test (2004 –07). ........................................... 123
Figure 3.22. Percent of African American students in each 2004 school performance category passing the CAHSEE mathematics Test (2004 –07)............................... 123
Figure 5.1. CDE explanation of dropout definition prior to October 2003. ................... 187Figure 5.2. CDE explanation of dropout definition as of October 2003. ...................... 187Figure 5.3. Single-year dropout rates according to CDE. ............................................ 189Figure 5.4. Single-year dropout counts by grade level according to CDE. .................. 189
................ 193Figure 5.5. 4-year dropout rates by race/ethnicity. ...................................................... 191Figure 5.6. Enrollment declines from 9th to 10th grade by high school classFigure 5.7. Enrollment declines from 10th to 11th grade by high school class.............. 194Figure 5.8. Enrollment declines from 11th to 12th grade by high school class.............. 195Figure 5.9. Number of first-time GED examinees under age 21, by year and
race/ethnicity.......................................................................................................... 197Figure 5.10. Number of passing GED examinees under age 21, by year and
race/ethnicity.......................................................................................................... 198Figure 5.11. Graduation rates based on grade 9 and 12 fall enrollments.................... 201Figure 5.12. SAT and ACT participation rates and success rates over time. .............. 204Figure 5.13. SAT mean math and verbal scores over time. ........................................ 205Figure 5.14. ACT mean scores over time.................................................................... 206Figure 5.15. A–G course completion over time. .......................................................... 207Figure 5.16. AP participation rates over time. ............................................................. 208Figure 5.17. AP pass rates over time (i.e., number of AP exam scores >=3 as a
percentage of student enrollment). ........................................................................ 209
Figure 6.1. Percent of 10th graders who have not yet taken Algebra 1 by assessment year........................................................................................................................ 214
Page xxii Human Resources Research Organization (HumRRO)
Chapter 1: Introduction
INDEPENDENT EVALUATION OF THE CALIFORNIA HIGH SCHOOL EXIT EXAMINATION (CAHSEE): FOURTH BIENNIAL REPORT
Chapter 1: Introduction
D. E. (Sunny) Becker
The California High School Exit Examination
In 1999, the California legislature enacted the requirement that students pass a graduation exam in English language arts (ELA) and mathematics beginning with the Class of 2004 (Senate Bill (SB)-2X, written into the California Education Code as Chapter 9, Sections 60850–60856). This requirement was modified in 2002 through the passage of Assembly Bill (AB) 1609. The revised legislation gave the State Board of Education (the Board) authority to postpone the California High School Exit Examination (CAHSEE) requirement, based in part on the results of a study that examined the extent to which both test development and standards-based instruction met standards for this type of examination (Wise et al., 2003a). In July 2003, after completion of the 2002–03 CAHSEE testing, the Board voted to defer the CAHSEE requirement until the graduating class of 2006.
The original legislation mandating the requirements for the graduation exam also specified an independent evaluation of the CAHSEE. The original contract period operated from 1999 through 2004; an additional contract was awarded to continue the evaluation through 2007. The California Department of Education (CDE) awarded both evaluation contracts to the Human Resources Research Organization (HumRRO). HumRRO’s efforts have focused on analyses of data from tryouts of test questions and from the annual administrations of the CAHSEE. Reports have focused on trends in pupil performance, retention, graduation, dropout, and college attendance rates. The legislation also specified that evaluation reporting would include recommendations to improve the quality, fairness, validity, and reliability of the examination. The legislation required an initial evaluation report in June 2000 and biennial reports to the Governor, the Legislature, the Board, and the CDE in February of even-numbered years. This 2008 Biennial Report adds to findings and recommendations described in previous biennial reports submitted in February 2002, February 2004, and February 2006.2
In addition to the legislatively mandated evaluation reports, the contracts for the evaluation required an annual report of evaluation activities. This report also adds to results and recommendations included in prior annual reports. Findings and recommendations from prior reports are summarized briefly in the next sections to provide a context for the continuing evaluation activities.
2 2 This report is nearly identical to the 2007 Evaluation report which described activities through October 2007. This report described additional analyses of students seeking to obtain a General Education Diploma (GED).
Human Resources Research Organization (HumRRO) Page 1
Independent Evaluation of the CAHSEE: Fourth Biennial Report
Prior Evaluation Activities and Outcomes
Summary of Year 1 Evaluation Activities (June 2000)
The Year 1 evaluation report reviewed and analyzed three types of information:
Test Developer Plans and Reports. No formal reports were available during the first year; thus, HumRRO attended meetings and attended presentations by the development contractor, American Institutes for Research (AIR), and by the CDE. We also monitored various presentations to the High School Exit Examination (HSEE) Panel and to the Board, and had direct conversations with members of each of these groups.
Statewide Data Sources. An initial source of information for the evaluation was data from the CAHSEE pilot administration. HumRRO also examined 1999 Standardized Testing and Reporting (STAR; for details see http://www.cde.ca.gov/ta/tg/sr/index.asp) results with plans to monitor trends in STAR results over the course of the evaluation.
District and School Sample. HumRRO selected a representative sample of 24 districts and 84 of their high schools to establish a longitudinal study group. The baseline surveys, which were administered to principals and ELA and mathematics teachers, provided an initial look at schools’ perspectives of the impact of CAHSEE on their programs. We also recruited teachers and curriculum experts from these schools and their districts to review test items and tell us whether they covered knowledge and skills not all students would be taught in their current curriculum.
The following summarizes the specific recommendations made at the end of the Year 1 evaluation activities:
Recommendation 1. The Legislature and Governor should give serious consideration to postponing full implementation of the CAHSEE requirement by 1 or 2 years.
Recommendation 2. The CDE should develop and seek comment on a more detailed timeline for CAHSEE implementation activities. This timeline should show responsibility for each required task and responsibility for oversight of each task’s performance. The plan should show key points at which decisions by the Board or others would be required along with separate paths for alternative decisions made at each point.
Recommendation 3. The CDE and the Board should work with districts to identify resource requirements associated with CAHSEE implementation. The Legislature must be ready to continue to fund activities supporting the
Page 2 Human Resources Research Organization (HumRRO)
Chapter 1: Introduction
preparation of students to meet the ambitious challenges embodied in the CAHSEE.
Recommendation 4. The Board should adopt a clear statement of its intentions in setting CAHSEE content and performance standards. This statement should describe the extent to which these standards are targeted to ensure minimum achievement relative to current levels or to significantly advance overall expectations for student achievement.
Recommendation 5. The Board should exhibit moderation in selecting content standards and setting performance standards for the initial implementation of CAHSEE. Subsequently, standards should be expanded or increased based on evidence of improved instruction.
Recommendation 6. Members of the HSEE Panel and its Technical Advisory Committee should participate in developing recommendations for minimum performance standards.
Recommendation 7. The CDE should move swiftly to establish an independent Technical Issues Committee (TIC) to recommend approval or changes to the CAHSEE development contractor’s plans for item screening, form assembly, form equating, scoring, and reporting.
Complete details of the Year 1 evaluation, including selection procedures for the longitudinal sample, are presented in a primary and a supplemental report describing evaluation activities, findings, and recommendations (Wise et al., June 2000a; Wise et al., August 2000b). These two evaluation reports emphasize both the positive aspects of the results, as indicated by several measures of the quality of the test questions, and the amount of work remaining to be done before operational administration of the CAHSEE. The primary apprehension noted in these reports was educators’ concern that, at that time, students were not well prepared to pass the exam.
District Baseline Survey Resulting from Year 1 Activities (December 2000)
The results of the baseline survey of teachers and principals in the longitudinal sample of high schools indicated concern with the degree to which students were provided sufficient opportunities to learn the material covered by the CAHSEE. After reviewing these concerns, the Board and the CDE requested an additional survey of all California public high schools and unified districts. The contract required that a CAHSEE District Baseline Survey be conducted prior to October 1, 2000. HumRRO developed and administered the survey shortly after the Board adopted specifications for the CAHSEE. The survey covered plans for changes in curriculum and other programs to help students pass the examination. We asked that each district have the survey completed by an Assistant Superintendent or Director of Curriculum and Instruction, or by the individual at the district level who was most knowledgeable about the CAHSEE.
Human Resources Research Organization (HumRRO) Page 3
Independent Evaluation of the CAHSEE: Fourth Biennial Report
The survey, which built on and benefited from the results of the longitudinal sample survey, addressed five critical topics:
• awareness of the CAHSEE, its content, administration plans, and requirements for student participation;
• alignment of the district’s curriculum to statewide content standards, particularly those to be covered by the CAHSEE;
• plans and preparation for increasing opportunities for all students to learn the material covered by the CAHSEE and to help students who do not initially pass the examination;
• expectations for passing rates and for the effect of the CAHSEE on instruction and the status of specific programs offered in the district; and
• outcome baselines, including retention and graduation rates and students’ post-graduation plans.
The following general conclusions were drawn from results of the district survey:
1. General awareness of the CAHSEE was high, but more information was needed, particularly for students and parents, about (a) the knowledge and skills covered by the CAHSEE and (b) plans for administration and reporting.
2. Districts reported high degrees of alignment of their own content standards to the state content standards. The survey addressed this question at a general level; we concluded more work was needed to assess and document the degree to which each district’s curriculum covered the content standards tested by the CAHSEE and the degree of student access to courses that offered such coverage.
3. Districts had implemented or planned a number of programs to prepare students and teachers for the CAHSEE and to assist students who did not initially pass. The most frequently planned activities included more summer school, tutoring, and matching student needs to specific courses.
4. Districts believed the CAHSEE would have a positive impact on curriculum and instruction. Most expected at least half of their students to pass the CAHSEE on their first attempt.
5. Outcome baselines would be used in future years.
Complete details of the district-wide survey effort were presented in a final technical report describing evaluation activities, findings, and recommendations (Sipes, Harris, Wise, & Gribben, 2001).
Summary of Year 2 Evaluation Activities (June 2001)
The Year 2 evaluation reviewed and analyzed three types of information:
Page 4 Human Resources Research Organization (HumRRO)
Chapter 1: Introduction
1. Developer Plans and Reports. HumRRO continued to monitor test development activities, ranging from observation of and presentations to the HSEE Panel to observation of the standard-setting workshops to develop recommendations for minimum passing scores for each of the two portions of the CAHSEE test: mathematics and ELA. We reviewed and participated in numerous discussions concerning equating of alternate forms, the score scale used, and minimum passing levels.
2. Analysis of Field-Test and Operational CAHSEE Data. HumRRO analyzed results from a second field test of new CAHSEE questions, conducted in Fall 2000, and began analyses from the operational administrations of CAHSEE in March and May of 2001. Initial analyses of technical characteristics of the test form used in the March administration and the resulting passing rates were described in our Year 2 Evaluation Report (Wise et al., June 2001).
3. Longitudinal Surveys of District and School Sample Personnel. The representative sample of 24 districts and approximately 90 of their high schools required replacement of one district with three schools. The surveys, which were administered to principals and ELA and mathematics teachers, provided a continuing look at schools’ perspectives of the impact of the CAHSEE on their programs. In addition, testing coordinators were surveyed to identify issues with administration of the CAHSEE.
The following summarizes the two general and six specific recommendations made in HumRRO’s report of Year 2 evaluation activities:
Recommendation 1. Stay the course. The Legislature and Board should continue to require students in the Class of 2004 to pass the exam, but monitor schools’ progress in helping most or all of their students to master the required standards.
Recommendation 2. The Legislature and Board should continue to consider options for English learners and students receiving special education services.
Recommendation 3. Provide more technical oversight for the continued development and administration of the CAHSEE.
Recommendation 4. For future classes, delay testing until the 10th grade.
Recommendation 5. Construct a practice test of released CAHSEE items for districts and schools to administer to 9th graders to identify students at risk of not passing the CAHSEE.
Recommendation 6. Monitor test administration more extensively and develop a system for identifying and resolving issues.
Human Resources Research Organization (HumRRO) Page 5
Independent Evaluation of the CAHSEE: Fourth Biennial Report
Recommendation 7. Develop and implement a more comprehensive statewide information system that will allow the CDE to monitor individual student progress.
Recommendation 8. The Superintendent, the Board, and the Legislature should specify in more detail the treatment of students in special circumstances (e.g., students receiving special education services and English learners) under CAHSEE requirements.
Complete details of the Year 2 effort were presented in the annual evaluation report and first biennial report describing evaluation activities, findings, and recommendations (Wise et al., June 2001; Wise et al., January 2002a). These two reports described results of the first administration of the CAHSEE to 9th graders in the Class of 2004. The reports also described preparation for and reactions to the CAHSEE as reported by principals and teachers. A key concern described in these reports was the relatively low passing rate for the mathematics portion of the exam, particularly for students receiving special education services and English learners.
Summary of Year 3 Evaluation Activities (June 2002)
The first biennial report of the CAHSEE evaluation was released in February 2002 (Wise et al., January 2002a). This report supplemented information on the 2002 administrations from the Year 2 report and included specific recommendations to the Legislature, the Governor, and the Board. These were:
General Recommendation 1. Stay the course. The Legislature and the Board should continue to require students in the Class of 2004 to pass the exam, but monitor schools’ progress in helping most or all of their students to master the required standards.
General Recommendation 2. The Legislature and the Board should continue to consider options for students with disabilities and for English learners.
The first biennial report also included several specific recommendations:
• Provide more technical oversight.
• Delay testing of future classes until the 10th grade.
• Construct a practice test of released CAHSEE items for districts and schools to administer to 9th graders to identify students at risk of failing the CAHSEE.
• Monitor test administration more extensively and develop a system for identifying and resolving issues.
• Develop a more comprehensive information system that will allow the state to monitor individual student progress.
Page 6 Human Resources Research Organization (HumRRO)
Chapter 1: Introduction
• Specify (the Superintendent, the Board, and Legislature working in concert) in more detail how students in special circumstances will be treated by the CAHSEE requirements.
Other Year 3 evaluation activities involved reviewing and analyzing four types of information:
Test Developer Plans and Reports. HumRRO continued to monitor test development activities and reports. These included changes to test administration procedures, equating alternate forms, and changes to reporting procedures.
Independent review of test questions. HumRRO assembled two panels of experts in curriculum and instruction, most of whom taught either ELA or mathematics. We asked them to review and analyze questions from recent CAHSEE administrations as well as questions from the (then) new test development contractor that had not yet been used operationally. Ratings indicated the extent to which the questions fairly and completely assessed targeted content standards. In addition, we asked the reviewers to note any specific issues with the quality of the questions or the response options.
Operational CAHSEE Data. HumRRO analyzed results from the operational administration of CAHSEE to 10th graders in March of 2002. We presented our initial analyses of technical characteristics of the test form used in the March administration and the resulting passing rates in our Year 3 Evaluation Report (Wise et al., June 2002b).
Longitudinal Surveys of District and School Sample Personnel. The representative sample of 24 districts and approximately 90 of their high schools required replacement of two districts (the original districts dropped out). The surveys, which were administered to principals and ELA and mathematics teachers, provided a continuing look at schools’ perspectives of the impact of the CAHSEE on their programs. In addition, we surveyed testing coordinators to identify issues with administration of the CAHSEE.
The Year 3 report of evaluation activities summarized findings from the data that HumRRO analyzed (Wise, et al., June, 2002b). We reported that available evidence suggested the CAHSEE had not yet had any impact on retention, dropout rates, or expectations for graduation and post-high school plans. Progress in developing the exam continued to be noteworthy. We found no significant problems with the development, administration, or scoring of the March 2002 exam. Students had made significant progress in mastering the required ELA skills, but less progress in mathematics. For disadvantaged students, initial passing rates continued to be low and progress for repeat test-takers was limited. Teachers and principals remained positive about the CAHSEE’s impact on instruction. We found more of them now expected positive impact on student motivation and parental involvement. Finally, teachers and principals reported planning and/or implementing a number of constructive programs to help students master the skills covered by the CAHSEE.
Human Resources Research Organization (HumRRO) Page 7
Independent Evaluation of the CAHSEE: Fourth Biennial Report
Based on these findings, HumRRO offered the following two general and four specific recommendations:
General Recommendation 1. Schools need to focus attention on effective ways of helping students master the required skills in mathematics. The CDE might consider a “what works” effort with respect to remedial programs, and disseminating information about effective programs and practices.
General Recommendation 2. State policymakers need to engage in a discussion about reasonable options for those students receiving special education services who were unlikely to pass the test.
Specific Recommendation 1. The score scale needs to be changed for students scoring below 300 (chance levels). As a short-term solution HumRRO recommended recoding scores below 300 to 299. Teachers, students, and parents would need to be cautioned against interpreting differences below the 300 level. (Our analysis indicated that the CAHSEE tests are acceptably accurate in determining whether students meet the achievement requirements. However, CAHSEE scores do not provide meaningful distinctions for students scoring below chance levels (about 300 on the current score scale). The recommendation refers to a potential danger that students, parents, and teachers could incorrectly interpret a gain below the 300 level as an indicator of significant progress when it is not).
Specific Recommendation 2. Districts and schools should be asked to supply more complete information on who had taken, was taking, and still needed to take the CAHSEE.
Specific Recommendation 3. The CDE should work with schools to collect more information on documentation of student needs for accommodations or modifications.
Specific Recommendation 4. Educational Testing Service (ETS) should follow up on (a) specific test question issues identified in our item review workshops and (b) specific suggestions to improve their new scoring process from our review of their current online training.
Summary of Year 4 Evaluation Activities (September 2003)
The Year 4 evaluation activities included reviewing and analyzing three types of information:
Test Developer Plans and Reports. We continued to monitor test development activities and reports. These included changes to test administration procedures, equating alternate forms, and changes to reporting procedures.
Page 8 Human Resources Research Organization (HumRRO)
Chapter 1: Introduction
Operational CAHSEE Data. We analyzed results from the six operational administrations of CAHSEE from July 2002 through May 2003. These included continued administration to 11th graders in the Class of 2004 who had not yet passed one or both parts of the CAHSEE and a census administration to 10th
graders in the Class of 2005.
Longitudinal Surveys of District and School Sample Personnel. The representative sample of 24 districts and approximately 90 of their high schools required replacement of one district with three schools. The surveys, which were administered to principals and ELA and mathematics teachers, provided a continuing look at schools’ perspectives of the impact of the CAHSEE on their programs. In addition, testing coordinators were surveyed for the second year to identify issues with administration of the CAHSEE.
The Year 4 report (Wise et al., September 2003b) of evaluation activities summarized findings from the data that were analyzed. The report stated that available evidence indicated the CAHSEE had not led to an increase in dropout rates. Passing rates for students in the Class of 2005 were slightly lower than passing rates for students in the Class of 2004. Yet in comparison with Class of 2004 students when they were in the 10th grade, more students in the Class of 2005 believed the CAHSEE was important to them. Schools were continuing efforts to ensure the California academic content standards were covered in instruction and to provide support for students who needed additional help to master these standards. Professional development in teaching the content standards had not yet been extensive. Teacher and principal expectations for the impact of CAHSEE on students was largely unchanged from prior years. There were no significant problems with local understanding of test administration procedures, but some issues remained with providing student data and assigning testing accommodations.
Subsequent to the 2003 administrations, the Board deferred implementation of the CAHSEE requirement to the Class of 2006. Based on information summarized in our general findings, we offered four recommendations for future administration of the CAHSEE:
Recommendation 1. Restarting the exam with the Class of 2006 would provide some opportunities for improvement; however, careful consideration should be given to any changes that were implemented.
Recommendation 2. The CDE and the State Board of Education should continue to monitor and encourage efforts by districts and schools to implement effective standards-based instruction.
Recommendation 3. Professional development for teachers offered a significant opportunity for improvement.
Human Resources Research Organization (HumRRO) Page 9
Independent Evaluation of the CAHSEE: Fourth Biennial Report
Recommendation 4. Further consideration of the CAHSEE requirements for students receiving special education services was needed, in light of the low passing rates for this group. Apparent disparities between racial and ethnic groups within the special education population required further investigation.
Year 4 evaluation activities also included a special study of standards-based instruction, as specified under AB 1609 legislation, which included several changes to the CAHSEE. Among other things, this bill called for a special study of the extent to which the development of the CAHSEE and standards-based instruction met the requirements for a high school graduation test. Evaluation activities were expanded to meet the requirements for this study. A detailed description of the study, along with findings and recommendations, was included in a report to the Board, May 1, 2003 (Wise et al., May 2003a). Key findings from the study were:
Finding 1. The development of the CAHSEE met all of the test standards for use as a graduation requirement.
Finding 2. The CAHSEE requirement had been a major factor leading to dramatically increased coverage of the California academic content standards at both the high school and middle school level and to development or improvement of courses providing help for students having difficulty mastering these standards.
Finding 3. Available evidence indicated many courses of initial instruction and remedial courses had only limited effectiveness helping students master the required standards.
Finding 4. Lack of prerequisite skills may have prevented many students from receiving the benefits of courses that provided instruction in relevant content standards. Lack of student motivation and lack of strong parental support may have played contributing roles in limiting the effectiveness of these courses.
Finding 5. Many factors suggested the effectiveness of standards-based instruction would improve for each succeeding class after the Class of 2004, but the speed with which passing rates will improve remained unknown.
The report did not offer a specific recommendation on whether the CAHSEE requirement should be deferred. The report suggested the Board consider the issue in terms of the following tradeoffs:
1. Schools might lose motivation for continued attention to students not achieving critical skills if the requirement were deferred.
Or: 2. Educators might become distracted by debates and legal actions
concerning the adequacy of current instruction if the requirement were continued.
Page 10 Human Resources Research Organization (HumRRO)
Chapter 1: Introduction
Balancing these tradeoffs required the Board to make a policy decision. The report offered several specific suggestions to consider if the requirement were continued and other suggestions in the case that the requirement was deferred. Ultimately, the Board decided to defer the requirement until the Class of 2006. (Please see the CDE Web site [http://www.cde.ca.gov/ta/tg/hs/evaluations.asp] for further details on this special study.)
The second biennial report of the CAHSEE evaluation was issued in February 2004 (Wise et al., February 2004a). This report summarized evaluation activities and findings since the first biennial report (Wise et al., January 2002a). The report included information on the 2002 and 2003 administrations and the AB 1609 study. It also included specific recommendations to the Legislature, the Governor, and the Board as presented in the Summary of Year 4 Activities above.
Summary of Year 5 Evaluation Activities (September 2004)
The Year 5 evaluation activities, which constituted the final year of the original evaluation contract, included reviewing and analyzing three types of information:
Test Developer Plans and Reports. HumRRO continued to monitor test development activities and reports. These included changes to test administration procedures, equating alternate test versions, and changes to reporting procedures.
Operational CAHSEE Data. HumRRO analyzed results from the three operational administrations of CAHSEE in February, March, and May of 2004. These were the first administrations to students in the Class of 2006, the first class now required to pass the CAHSEE for high school graduation.
Longitudinal Surveys of District and School Sample Personnel. We began in 2000 with a representative sample of 24 districts and approximately 90 of their high schools. The number varied slightly from year to year as districts and or schools declined to participate for the year or dropped out completely and were replaced. The 2004 sample included 26 districts (a result of contacting two districts in 2003 as replacements and one declining district agreeing to participate) and 86 schools that did not require any replacements. The surveys, which were administered to principals and ELA and mathematics teachers, provided a continuing look at schools’ perspectives of the impact of the CAHSEE on their programs. In addition, testing coordinators were surveyed for the third year to identify issues with administration of the CAHSEE.
The Year 5 report (Wise et al., September 2004b) of evaluation activities summarized findings from the data that were analyzed for students in the Class of 2006 who took the CAHSEE as 10th graders during the 2003–04 school year. The report compared these findings to results from the 2002–03 administrations for 10th grade
Human Resources Research Organization (HumRRO) Page 11
Independent Evaluation of the CAHSEE: Fourth Biennial Report
students in the Class of 2005 to look at trends across these two classes. The report stated that performance on the CAHSEE mathematics test improved significantly for the Class of 2006 relative to the Class of 2005 (accounting for differences in score scales). Passing rates for ELA were largely unchanged. Overall, 64 percent of the 10th graders in the Class of 2006 passed both parts, and performance improved for all demographic groups except students receiving special education services. We found no increase in dropout and retention rates despite teachers’ and principals’ predictions the CAHSEE requirement would lead to such increases. Principals reported significant increases from 2002 to 2004 in full implementation of programs and practices to help students who are not prepared to pass the CAHSEE and to promote learning for all students. Principal estimates of parents’ knowledge of the CAHSEE increased significantly in 2004. Finally, about 90 percent of the students tested reported most or all topics on the test were covered in courses they had taken.
Based on these findings and those included in prior reports, HumRRO offered the following four general recommendations and one specific recommendation:
General Recommendation 1. Keep the CAHSEE requirement in place for the Class of 2006 and beyond.
General Recommendation 2. Continue efforts to help students prepare for and take more challenging courses.
General Recommendation 3. Encourage efforts to identify remedial programs that work and disseminate information about these programs to all schools.
General Recommendation 4. Continue to explore options for students receiving special education services (e.g., set realistic expectations, allow more time, investigate curricula, and collect accommodation information).
Specific Recommendation 1. Work to implement a system of student identifiers and student records that provide information, including (a) CAHSEE passing status, (b) students on track to graduate with their class, (c) students who have been retained, and (d) students who have dropped out.
Senate Bill 964 (California Education Code Section 60852.5 (d)) required a study to assess options and provide recommendations for alternatives to the CAHSEE for students with disabilities to be eligible for a diploma. WestEd was awarded the contract and the State Superintendent of Public Instruction appointed a 15-member advisory panel to complete a report in May 2005.
Summary of Year 6 Evaluation Activities (September 2005)
The first year of the evaluation continuation contract included reviewing and analyzing the same three types of information as in previous years plus some additional requirements:
Page 12 Human Resources Research Organization (HumRRO)
Chapter 1: Introduction
Test Developer Plans and Reports. HumRRO continued to monitor test development activities and reports. These included changes to test administration procedures, equating alternate forms, and changes to reporting procedures. As part of our review, we conducted independent analyses leading to the conversion tables used to place number-correct scores from the February 2005 administration on the common, equated reporting scale. Results confirmed the conversion tables proposed by ETS. We also attended meetings of the Technical Advisory Group where technical issues relating to CAHSEE development, administration, and reporting were discussed.
Operational CAHSEE Data. We analyzed results from the operational administrations of CAHSEE to 11th graders in September and November of 2004 and to both 10th and 11th graders in February, March, and May of 2005. Tenth grade students took the CAHSEE for the first time in February, March, or May of 2005. Eleventh grade students who had not yet passed could take the CAHSEE twice more in any of the five administrations. In addition to investigating test score reliability, a key issue was the degree of progress made by students in the Class of 2006 who had not yet met the CAHSEE requirement. A second key issue involved the success rates for students in different demographic groups, most notably English learners and students receiving special education services. The operational test data also included a brief survey that students completed after each testing day.
Instruction Study—Academic Standards Tested by the CAHSEE. We conducted a study similar to one conducted in 2003 and specified under AB 1609 legislation. The current study included surveys to all districts with high schools that had CAHSEE results (467), a representative sample of 400 high schools, and a sample of 97 feeder middle schools. We also sampled 50 high schools and 24 associated feeder middle schools through site visits.
Item Review Workshops: HumRRO conducted two sets of item review workshops in early June 2005 – one held in the northern part of the state and one in the southern. Participants were teachers and curriculum specialists familiar with the ELA and mathematics content standards. The reviews covered item quality, universal test design, content alignment, depth of knowledge, and overall coverage. The items reviewed were the most recent ones available, including some operational items.
Policymakers faced critical decisions about the CAHSEE as the Class of 2006 neared graduation. As in past years, the 2005 report offered several general recommendations based on observations and findings from evaluation activities. These recommendations were targeted to the Board and the Legislature as they considered additions or modifications to policies concerning the CAHSEE and its use. In addition, several technical recommendations were intended for the continued improvement of the CAHSEE, and were targeted to the CDE and to the test developer. The Year 6 report (Wise et al., September 2005) of evaluation activities included the following recommendations:
Human Resources Research Organization (HumRRO) Page 13
Independent Evaluation of the CAHSEE: Fourth Biennial Report
General Recommendation 1: Keep the CAHSEE requirement in place for the Class of 2006 and beyond.
General Recommendation 2: Identify specific options for students who are not able to satisfy the CAHSEE requirement and implement them by June 2006.
General Recommendation 3: Accelerate efforts to implement a statewide system of student identifiers, and develop and maintain a database with information on students who have and have not satisfied the CAHSEE requirements.
General Recommendation 4: Collect data from districts on students who are not able to satisfy the CAHSEE requirement by June 2006 and use this information to further refine options for students having difficulty mastering the skills assessed by the CAHSEE.
Specific Recommendation 1: The test development contractor might find it useful to consider a number of suggestions to improve specific test questions, particularly with respect to making them accessible to all students. These suggestions, based on the item review, provide useful insights on how to continue to improve and enhance item development and review procedures.
Specific Recommendation 2: Statistical review of test items should include checks for differential item functioning for students with disabilities.
Specific Recommendation 3: The CDE may want to link information on the curriculum and services received by students in special education programs to CAHSEE results on a more regular basis to support analysis, as this information was found to be quite useful
Specific Recommendation 4: Conduct a field trial or demonstration project with a small number of districts that already use student identification codes to model the design and use of detailed student data.
In January 2006 CDE documented options for students unable to pass the CAHSEE examination, in a paper titled California High School Exit Examination (CAHSEE) Options for Students not Passing the Exam (available at http://www.cde.ca.gov/ta/tg/hs/documents/options.doc).
The third biennial report of the CAHSEE evaluation was issued in February 2006 (Wise et al., February 2006a). This report summarized evaluation activities and findings since the second biennial report (Wise et al., February 2004a). It also included specific recommendations to the Legislature, the Governor, and the Board as presented in the Summary of Year 6 Activities above.
Page 14 Human Resources Research Organization (HumRRO)
Chapter 1: Introduction
Summary of Year 7 Evaluation Activities (September 2006)
The second year of the evaluation continuation contract included reviewing and analyzing the same three types of information as the previous year:
Test Developer Plans and Reports. HumRRO continued to monitor test development activities and reports.
Operational CAHSEE Data. HumRRO analyzed results from the 2005–06 CAHSEE administrations. As this was the first school year for which the CAHSEE took effect, with the consequence that seniors who were unable to pass both parts of the CAHSEE did not receive a diploma, a special emphasis was placed on the senior class.
Longitudinal Surveys of District and School Sample Personnel. We began in 2000 with a representative sample of 24 districts and approximately 90 of their high schools. The number varied slightly from year to year as districts and or schools declined to participate for the year or dropped out completely and were replaced. The 2006 sample included 26 districts and 99 high schools. In an effort to boost response rates, three drawings for iPod Shuffle music players were held to reward survey respondents. The surveys, which were administered to principals and ELA and mathematics teachers, provided a continuing look at schools’ perspectives of the impact of the CAHSEE on their programs. In addition, testing coordinators were surveyed for the third year to identify issues with administration of the CAHSEE.
This report was the first to include results for a graduating class. Policymakers faced critical decisions about the CAHSEE as members of the Class of 2006 reached its graduation date. As in past years, the 2006 report offered several general recommendations based on observations and findings from evaluation activities. These recommendations were targeted to the Board and the Legislature as they considered additions or modifications to policies concerning the CAHSEE and its use. In addition, two specific recommendations were intended for the continued improvement of the CAHSEE, and were targeted to the CDE and to the test developer. The Year 7 report (Wise et al., September 2006) of evaluation activities included the following recommendations:
General Recommendation 1: Having worked to publicize options for students who do not complete the CAHSEE requirement in time to graduate with their class, the CDE now needs to collect data on how many students take advantage of the various programs and on the effectiveness of each program in helping students to learn essential skills and earn their diploma.
General Recommendation 2: In addition to continued efforts to help seniors who have not yet passed the CAHSEE, the school system needs to
Human Resources Research Organization (HumRRO) Page 15
Independent Evaluation of the CAHSEE: Fourth Biennial Report
improve programs for juniors who did not pass in the 10th grade and, even more importantly, to improve programs to prepare students to be ready to pass on their first try as 10th graders.
General Recommendation 3: Research is needed on why many students remain classified as English learners for long periods of time. The CDE should gather lessons from districts and schools that have been successful in helping students achieve proficiency in English and make this information available to those with lower rates of success.
General Recommendation 4: Districts and the state should provide support and guidance to individualized education program (IEP) teams in making key decisions about whether students in special education programs can meaningfully participate in the regular curriculum. Students who can participate in the regular high school curriculum should be held to the same high expectations as the rest of their classmates. At the same time, districts and the state should identify alternative goals and ways of recognizing the accomplishment of these goals for students who are not able to participate meaningfully in the regular curriculum.
General Recommendation 5: Research is needed on factors that lead to lower CAHSEE passing rates in schools with higher concentrations of at-risk students. Programs in schools with high concentrations of at-risk students who are successful in passing the CAHSEE should be identified, and information about these programs should be disseminated widely.
General Recommendation 6: CDE should soon begin collecting data on success in college and other endeavors for students who pass the CAHSEE to determine whether the CAHSEE requirements are sufficiently rigorous.
Specific Recommendation 1: The CDE and ETS should seek ways to improve scoring consistency for the CAHSEE essays during high volume administrations.
Specific Recommendation 2: CDE should consider ways to increase teacher familiarity with and use of the CAHSEE Web site, as it includes a wealth of information about the CAHSEE that teachers should find useful.
Organization and Contents of 2007 Evaluation Report
The 2007 Evaluation Report covers activities performed in the independent evaluation through September 30, 2007.
Chapter 2 presents analyses of the 2006–07 CAHSEE administrations. Analyses include results for the 12th graders in the Class of 2007, as well as a comparison of the
Page 16 Human Resources Research Organization (HumRRO)
Chapter 1: Introduction
performance of 12th graders in the Class of 2007 to passing rates among 12th graders in the Class of 2006. In addition, the results include passing rates for 10th graders in the Class of 2009 in comparison to passing rates for 10th graders in previous classes; passing rates and score gains for 11th graders in the Class of 2008 who did not meet the CAHSEE requirements during their sophomore year; analyses of test modifications and accommodations; and analyses of factors such as the relationship between mathematics courses taken and success on the CAHSEE mathematics test.
In addition, brief questionnaires were administered to students upon completion of each CAHSEE test. Analyses include comparisons of current year responses to response patterns in previous years, as well as comparisons among distinct groups of students (e.g., students who passed the CAHSEE versus those who did not).
Chapter 3 provides a closer look at specific student populations, including students with disabilities, English learners, and students retained in grade. Taken as a whole, these populations face specific challenges with respect to the high school exit examination. Analyses include a targeted examination of CAHSEE test results.
Chapter 4 summarizes input from two sets of stakeholders: high school principals and high school ELA and mathematics teachers. We administered surveys to principals and teachers in a longitudinal sample of California high schools. In this chapter, we present responses to the Spring 2006 and Spring 2007 surveys alongside responses to previous years’ surveys. In addition to the recent responses, this allowed for identification of trends before and after the CAHSEE and illustrates the impact on graduating classes. HumRRO continued to organize the evaluation information into four critical areas:
• Knowledge and preparation for the CAHSEE
• Alignment of the districts’ curricula to state/CAHSEE content standards
• Impact of the CAHSEE
• CAHSEE as a graduation requirement
Chapter 5 presents trends in educational achievement and persistence through analyses of data on year-by-year high school enrollment trends, graduation and dropout rates, college preparation, and Advanced Placement (AP) test achievement. While these do not directly reflect effects of the CAHSEE, trends over time can be informative in assessing shifts in student achievement.
Finally, Chapter 6 presents our findings and recommendations based on the data analyses and results presented in previous chapters.
Human Resources Research Organization (HumRRO) Page 17
Chapter 2: Results from the 2006–07 Administrations
Chapter 2: Results from the 2006–07 Administrations
Lauress L. Wise and Ning Rui
Introduction
The legislation establishing the CAHSEE called for the first operational forms of the exam to be administered in Spring 2001 to 9th graders in the Class of 2004. At the first administration 9th graders could volunteer, but were not required, to take both portions of the exam. Students who did not pass the exam in that administration were required to take the exam as 10th graders in Spring 2002. Preliminary results from the CAHSEE Spring 2001 and 2002 administrations were reported in the 2001 and 2002 evaluation reports (Wise et al., June 2001; Wise et al., June 2002b). Results from the 2001 administration were reported more fully in the first of the biennial evaluation reports to the Legislature, the Governor, the Board, and the CDE (Wise et al., Jan. 2002a).
The CAHSEE was administered six more times from July 2002 through May 2003 to students in the Class of 2004 who had not yet passed one or both parts. In addition, students from the Class of 2005 were required to take the CAHSEE for the first time as 10th graders in March or May of 2003. Analyses of results from these administrations were reported in the 2003 evaluation report (Wise, et al., Sep. 2003) and in the second biennial evaluation report (Wise et al., 2004).
Subsequent to the 2003 administrations, the requirement to pass the CAHSEE was deferred to the Class of 2006. In 2004, the CAHSEE was modified slightly and administered in Spring 2004 to all 10th graders in the Class of 2006. Results from the 2004 administrations were reported in Chapter 2 of the 2004 evaluation report (Wise, et al., Sep. 2004).
The 2004–05 administrations included both 10th graders in the Class of 2007 taking the CAHSEE for the first time and 11th graders in the Class of 2006 who had not passed the CAHSEE as 10th graders. The 11th graders took the CAHSEE one or more times in September 2004, November 2004, February 2005, March 2005, and May 2005. The 10th graders participated in the February, March, or May 2005 administrations. In addition, a small number of adult education students took the CAHSEE during the 2004–05 school year. Analyses of results from the 2004–05 administrations were reported in Chapter 3 of the 2005 evaluation report (Wise, et al., Sep. 2005).
The 2005–06 CAHSEE administrations included 10th graders in the Class of 2008, 11th graders in the Class of 2007, and 12th graders in the Class of 2006. Except for students in special education programs who could meet the CAHSEE requirement in other ways, 12th graders who still had not passed the CAHSEE by the end of the 2005– 06 test year were denied diplomas. Analyses of results from the 2005–06 administrations were reported in Chapter 2 of the 2006 evaluation report (Wise, et al.,
Human Resources Research Organization (HumRRO) Page 19
Independent Evaluation of the CAHSEE: Fourth Biennial Report
Sep. 2006). All of these reports are available on the CDE Web site at http://www.cde.ca.gov/ta/tg/hs/evaluations.asp.
The 2006–07 CAHSEE administrations were the most complex yet in that three separate classes of high school students, 2007 through 2009, as well as many students from the Class of 2006 who did not pass the CAHSEE by the end of their senior year, took the tests. Essentially, all 10th grade students in the Class of 2009 were tested for the first time in February, March, or May of 2007. Eleventh grade students in the Class of 2008 who had not yet passed the CAHSEE had multiple opportunities to take the CAHSEE in the July, October, November, or December 2006 administrations and in the February, March, or May 2007 administrations. Twelfth grade students in the Class of 2007 who still needed to pass the CAHSEE had as many as three opportunities to take the CAHSEE during these same administrations. In addition, many students from the Class of 2006 continued to take the CAHSEE, either as repeat 12th graders or as adult education students. As a result of a settlement agreement in the Chapman case3, Class of 2006 and 2007 students with IEPs or Section 504 plans were allowed to satisfy graduation requirements in other ways, although many of them continued to take the CAHSEE.
Analyses of results from the 2006–07 CAHSEE administrations are organized around four main questions:
1. How many students from the Class of 2006 who had not met the CAHSEErequirement continued to try to pass the CAHSEE? How many of thempassed?
2. How many first-time 12th graders in the Class of 2007 who had not passed theCAHSEE were able to pass in their senior year, and how many did not meetthe CAHSEE requirement by June 2007? How did these numbers compare tolast year’s results for the Class of 2006?
3. How did performance improve for 11th graders in the Class of 2008 who hadnot yet passed the CAHSEE and what can we expect for those who have notyet passed by the end of 11th grade? Also, how did improved performance for11th graders in the Class of 2008 compare to improvements seen last year for11th grade students in the classes of 2006 and 2007?
4. How did this year’s results for 10th graders in the Class of 2009 compare toresults for the classes of 2005 through 2008 when those students took theCAHSEE for the first time as 10th graders in 2003 through 2006 respectively?
Each of these questions is answered for students in specific demographic categories defined by gender, race/ethnicity, economic disadvantage, English-learner or special
3 The Chapman case was a lawsuit filed on behalf of students with disabilities. The parties reached agreement that students with disabilities in the Class of 2006 could receive a diploma even if they did not pass the CAHSEE as long as they met other requirements.
Page 20 Human Resources Research Organization (HumRRO)
Chapter 2: Results from the 2006–07 Administrations
education status. Results for adult education students are reported briefly, but are not the primary policy focus of these analyses.
As in prior years, some difficulties were encountered in these analyses. Students taking the CAHSEE for the first time were sometimes unable to take both parts in the same administration and so had separate, albeit incomplete, records from two different administrations. In addition, a few students appear to have used two different answer sheets in the same administration, again generating separate incomplete records.
Beginning with the February 2006 administration, most CAHSEE test result records (about 95%) contained a new student identifier that should uniquely identify each student and remain constant over future test administrations. For the 2006–07 administrations, however, data from each answer document still had to be matched across administrations and test years by name and birth date and, in some cases, by district-level student identifiers. Inconsistencies or omissions in coding these fields complicated the process of linking separate records for the same student. Any failure in linking such records led to an overcount of the number of different students tested.
For the 11th and 12th graders, linking problems were even more complicated. First, they may have taken each portion of the CAHSEE two, or in many cases, three times during the 2006–07 school year. Second, it was necessary to match the 2006–07 results for these students to results from 2005 and 2006 to determine which students had passed both parts. Many districts appeared to have changed their student identifiers one or more times between the 2004–05 and 2006–07 school years. In addition, many students changed schools between years, while others did not progress normally from one grade to the next. Accurate linking for the 11th and 12th graders is essential to answering questions such as “How many students in the Class of 2006 who did not pass last year are still taking the CAHSEE?” and “Where did students who appear to have taken the CAHSEE for the first time as 11th or 12th graders come from?”
Analysis of the Test Score Data
A number of potential issues with the test data were investigated before we analyzed the score results. First, we took steps to match records for students who participated in more than one testing session during the year and then matched this year’s records to records from prior years. We wanted to remove duplication in counts of the total number of students tested, to be able to estimate the number of students who passed both parts of the CAHSEE, and to track students who did not progress normally from one grade to the next. Second, we replicated the scaling and equating of the March 2007 test form, checked the score conversion tables for all forms, and looked at the consistency with which the essays were scored.
ETS provided test results, including student responses to individual test questions and to the student questionnaire items, after each of the 2006– 07administrations and a total file containing corrections for the year as a whole. While
Human Resources Research Organization (HumRRO) Page 21
Independent Evaluation of the CAHSEE: Fourth Biennial Report
this last file did not contain student responses to individual test questions or questionnaire items, it did include corrections to demographic information provided by schools and districts as part of a routine verification process. Except as noted, the analyses of student test results reported here are based on the updated file.
Table 2.1 shows the number of test records from each of the seven CAHSEE administrations during the 2006–07 school year that were included in the data files received from ETS. As noted above, many students participated in more than one administration so the number of students tested was fewer than the number of answer documents processed. We describe our attempts to count individual students, rather than just answer documents, in the next section.
Matching Student Records from Different Administrations
In response to data analysis requirements in the 2001 federal No Child Left Behind (NCLB) Act, the state legislature passed SB 1453 requiring the establishment of student identifiers for all California public or charter school students. When the statewide student identifiers called for by SB 1453 are fully implemented by the California School Information Services (CSIS), matching records for students participating in different test administrations will be “relatively” easy (CSIS, 2004). CSIS student identifiers were introduced for nearly all students (over 90 percent) in the February 2006 CAHSEE administration. CSIS codes were filled in for some students in the Fall 2005 administrations, but many schools had not yet begun using these identifiers. In the 2006-07 test administrations, CSIS codes were available for nearly all students except those in adult education programs. For about 0.5 percent (or one-half of one percent) of the records, two or more different students had the same CSIS code, indicating a likely data entry error. Codes are missing altogether for another 2 to 3 percent of the records. The CSIS codes are extremely useful, but not yet infallible.
We used the CSIS codes as part of our process for matching records in the 2006–07 administrations, but also matched records on other identifiers (school codes with student names and birth dates and, in some cases, the district’s own student identifiers). In matching student records to results from prior years, when CSIS codes were not yet fully available, we had to rely more heavily on the more fallible other identifiers. As usual, there were numerous cases in which student names and birth dates were not coded consistently across different administrations. In addition, the student identifiers supplied by districts were sometimes coded incorrectly or inconsistently.
Page 22 Human Resources Research Organization (HumRRO)
Chapter 2: Results from the 2006–07 Administrations
Table 2.1. Number of CAHSEE 2006–07 Answer Documents and Number Passing Each Test by Administration Date
Blank ELA Math Test Total Answer Answer Number Number Number Number Date Grade* Sheets Sheets Taking Passing Taking Passing
Total All Records Processed 1,043,749 61,125 800,699 460,706 823,611 459,491
Human Resources Research Organization (HumRRO) Page 23
Independent Evaluation of the CAHSEE: Fourth Biennial Report
We matched records in two phases. In the first phase, we matched records for 10th graders within and across the February, March, and May administrations and matched records for 11th and 12th graders within and across all seven administrations. Results of this phase are shown in Table 2.2. In the second phase, we matched the merged records from the 2006–07 administrations with records for from the 2004–05 and 2005–06 administrations. For the most part 12th graders from the 2006–07 administrations were matched to 11th graders in the 2005–06 administrations, and 10th
graders in the 2004–05 administrations. Similarly, 11th graders in the 2006–07 administrations were matched to 10th graders in the 2005–06 administrations. There were, however, a number of cases where students appear to have either skipped or repeated a grade from one year to the next. We described the matching process in more detail in our 2005 annual report (Wise, et al., 2005).
Table 2.2. Number of Students Participating in One or More 2006–07 CAHSEE Administration by Grade and Test
Grade Count 10 11 12 AE* Unknown Total
Total unique students 501,238 171,883 107,568 17,797 1981 800,467 Blank answer documents 17,707 10,878 10,464 640 38 39,727 Number taking ELA 476,224 121,911 69,334 12,800 1,894 682,163 Number passing ELA 365,373 55,111 28,463 7,404 1,559 457,910 Percent passing ELA 76.7% 45.2% 41.1% 57.8% 82.3% 67.1% Number taking math 476,780 128,871 74,234 13,740 1,916 695,541 Number passing math 360,301 56,606 31,111 6,642 1,522 456,182 Percent passing math 75.6% 43.9% 41.9% 48.3% 79.4% 65.6%
* Note: AE=Adult education.
Table 2.3 shows the number of answer documents for each test and grade, the number of students tested in each subject and grade (after accounting for students who tested more than once during the 2006–07 school year), and the number of students for whom prior-year records were identified. Prior-year matches were found for about 2 percent of the current 10th graders, and over 80 percent of the current 11th and 12th
graders. Prior-year data were not found for students who were new to the state or new to public education and for students whose identifiers were significantly miscoded. The match rate for 12th graders increased significantly compared to the 2005–06 test year. In 2006, students who were repeating the 12th grade had not been required to take the CAHSEE previously and so had no prior test records. In 2007, repeat 12th graders had been subject to the CAHSEE requirement and so prior-year test records were available for most of these students.
Page 24 Human Resources Research Organization (HumRRO)
Chapter 2: Results from the 2006–07 Administrations
Table 2.3. Number of Students with Matching Prior Year Data by Grade and Test Grade
Test 10 11 12 Number of Answer Documents
With ELA test 489,591 239,050 177,608 With math test 489,193 240,494 177,039 Total (either or both) 504,471 257,771 192,131
Number of Students With ELA test 481,936 158,415 96,759 With math test 481,505 158,598 96,516 Total (either or both) 487,487 164,642 100,990
Number of Students Matched to Prior-Year Records With ELA test 9,309 130,121 80,113 With math test 9,308 130,615 80,402 Total (either or both) 9,826 134,377 82,982
Total Percent with Prior-Year Records 2.0% 81.6% 82.2%
Table 2.4 shows the relationship between current grade on the 2006–07 test records and their grade during the 2005–06 school year4. As expected, most of the current 11th graders were 10th graders in 2004–05 and most of the current 12th graders were 11th graders. However, our analysis found that more than 10,000 students (about 2%) were in the 10th grade both years, just over 7,000 students were in the 11th grade for both years, and nearly 15,000 students were in the 12th grade for both years. This last group is particularly significant as they represent over half of the students in the Class of 2006 who had not passed the CAHSEE by the end of their senior year. In addition to students who repeated a grade, a few appear to have skipped ahead of normal grade progression. For example, nearly 4,000 students appear to have skipped from the 10th grade directly to the 12th grade. Because of these non-normal grade progressions, the composition of different high school classes changes from year to year, creating issues in tracking passing rates for different classes across years.
4 For students with matching records from prior years the grade indicated in those records was used. For students with no matching prior-year record, responses to student questionnaire item 16, asking for prior-year grade, were examined. Lacking other information normal grade progression was assumed.
Human Resources Research Organization (HumRRO) Page 25
Independent Evaluation of the CAHSEE: Fourth Biennial Report
Table 2.4. Number of Students Matched to Prior-Year Records by Current and Prior Grade
Number of Students with Prior-Year (2005–06) Grade*
Total 490,864 179,605 99,121 20,409 9,254 1,214 800,467
* Note: Prior grade was assumed to be 9 for unmatched 10th grade records. For other 2007 grades, prior grade was inferred from responses to student Question 16 where possible.
Computing Passing Rates
A key issue in computing and reporting passing rates for the CAHSEE is what to use as the denominator. The two main choices are the number of students who took each test and the number of students subject to the CAHSEE requirement. In this report, as in our prior reports, we have opted for the latter, reporting the proportion of all students in the target populations who have passed. However, the number of students in the target populations fluctuates with daily enrollment changes. Table 2.5 compares fall enrollment counts (reported by DataQuest), enrollment counts from the STAR tests that occurred closer in time to the CAHSEE testing dates, and record counts from the CAHSEE. The CAHSEE is now also being used for 10th grade accountability under NCLB requirements. Essentially all students must be tested to meet NCLB participation requirements, so the CAHSEE counts appear to be reasonably complete. Total CAHSEE record counts were used in computing passing rates for this report. STAR reports include the number of students tested in different demographic groups, but do not include separate enrollment counts for these groups. The CAHSEE data provide for consistent counts for each demographic group of interest. Note that the CAHSEE record counts used here were based on matching records across administrations within each testing year to avoid counting students more than once.
Page 26 Human Resources Research Organization (HumRRO)
Chapter 2: Results from the 2006–07 Administrations
Table 2.5. Tenth Grade Enrollment Estimates from California Basic Data Education Data System (CBEDS), STAR, and CAHSEE*
Percent of fall enrollment 90.1% 93.7% 94.7% 97.9% 96.9%
CAHSEE students taking the ELA Test 402,594 450,479 461,957 477,705 476,224
CAHSEE students taking the math test 414,903 451,138 462,158 480,577 476,780
CAHSEE students taking both tests 392,431 442,418 453,224 473,192 469,473
Percent of students taking both tests 92.3% 96.3% 96.2% 93.7% 93.5%
* Note: CBEDS and STAR data were retrieved online through CDE’s Dataquest facility at http://dq.cde.ca.gov/dataquest. **Note.CAHSEE student counts, after merges to remove duplication, were used in computing passing rates.
Human Resources Research Organization (HumRRO) Page 27
Independent Evaluation of the CAHSEE: Fourth Biennial Report
Equating the 2006 Test Forms
We conducted checks on the equating of the March 2007 CAHSEE operational form. Using commercially available software, we computed item parameter estimates and scoring tables for both the ELA and mathematics tests that matched the values used operationally5. Tables 2.6a and 2.6b provide a comparison for multiple-choice questions of our item difficulty parameter estimates and those computed by ETS after equating adjustments. The ELA raw score also includes a component that is a multiple (4.5) of the average of the two 4-point ratings of the student’s essay. Details of the item parameters and their use in assembling and equating test forms are provided in ETS’ technical documentation.
These analyses, along with analyses conducted in prior years, verify the accuracy of the procedures used by ETS to ensure that scores are comparable across test forms. The equating procedures result in a table that maps number correct (raw) scores onto the 275–450 reporting scale. These mappings vary slightly across the forms used with the different administrations to reflect small differences in the overall difficulty of the different test forms. We also checked that the scoring tables generated by ETS equating procedures were applied properly. Tables 2.7a and 2.7b show the raw-to-scale score conversions used with each of the 2006–07 CAHSEE ELA and mathematics test forms.
5 Operational values were computed by ETS using proprietary software to estimate the item parameters (difficulties).
Page 28 Human Resources Research Organization (HumRRO)
Chapter 2: Results from the 2006–07 Administrations
Table 2.6a. Comparison of Item Difficulty Parameter Estimates (Multiple Choice) Mathematics ELA Mathematics ELA
Page 30 Human Resources Research Organization (HumRRO)
Chapter 2: Results from the 2006–07 Administrations
Table 2.7a. Raw-to-Scale Score Conversions for the 2006–07 ELA Tests Raw Scale Score Raw Scale Score Score Jul Oct Nov Dec Feb Mar May Score Jul Oct Nov Dec Feb Mar May
Note. Shaded numbers reflect minimum scores for passing the diploma requirement (the first (yellow) shaded number in each column) and for proficiency as used in school accountability (the second (green) shaded number); underlined scale scores indicate expected scores from guessing alone (chance).
Human Resources Research Organization (HumRRO) Page 31
Independent Evaluation of the CAHSEE: Fourth Biennial Report
Table 2.7b. Raw-to-Scale Score Conversions for the 2006–07 Mathematics Tests Raw Scale Score Raw Scale Score Score Jul Oct Nov Dec Feb Mar May Score Jul Oct Nov Dec Feb Mar May
Note. Shaded numbers reflect minimum scores for passing the diploma requirement (the first (yellow) shaded number in each column) and for proficiency as used in school accountability (the second (green) shaded number); underlined scale scores indicate expected scores from guessing alone (chance).
Page 32 Human Resources Research Organization (HumRRO)
Chapter 2: Results from the 2006–07 Administrations
Scoring Consistency
In past reports we have examined the accuracy of the scores generated from parallel forms of the exam. During the Year 5 evaluation we monitored ETS’ analysis of item-level statistics from each administration and found no significant changes from the results for prior forms. More complete information on test accuracy may be found in technical documentation provided by ETS.
For the 2006–07 test administrations we continued to analyze consistency in the scoring of student essays. Prior to the 2003–04 school year each student taking the ELA test was required to write two essays, the first involving analysis of an associated text and the second in response to a freestanding question that did not involve text processing. Beginning in 2004, the ELA test was shortened and students were required to write only one essay. In the 2004–05 test year the type of essay prompt varied across administrations. In the 2005–06 and 2006–07 testing years, stand-alone prompts were used in each administration.
As in prior years, each essay was graded by at least two different raters following a four-point rubric that indicated the essay response characteristics required for each score level. Four was the highest score; a score of zero was assigned to responses that were off-topic, illegible, or left blank. Since the scoring rubrics vary from question to question, we monitored the level of agreement between independent raters for each question used with each administration. Table 2.8 shows, for the 2006–07 test forms and for test forms from prior years: (a) how often (what percent of the time) there was exact agreement, (b) how often there was a difference of just one score point, and (c) how often there was a difference of more than one score point. Whenever there was an initial difference of more than one score point, the essay was read again by a third, more experienced reader and, if necessary, a fourth so that all operational scores resulted from two raters who agreed to within a single score point.
This year, we again analyzed scoring consistency separately for 10th, 11th, and 12th grade students. While the questions and the scoring process were identical for these groups, the quality of the papers they produced was not. Tenth grade students generated many more essays rated as 3 or 4 in comparison to 11th and 12th grade students.
Overall agreement rates were higher compared to last year. For 10th graders, exact agreement rose from 66.9 to 69.9 percent while disagreement by more than one score point dropped from 0.7 to 0.4 percent. Exact agreement on the 11th and 12th
grade essays increased to over 77 percent (an increase of about four percentage points). Last year, we suggested targets of at least 70 percent exact agreement with no more than 0.5 percent disagreement by more than one score point. ETS met these targets in the 2006–07 testing year.
Human Resources Research Organization (HumRRO) Page 33
Independent Evaluation of the CAHSEE: Fourth Biennial Report
Table 2.8. Scoring Consistency for Student Essays Percent of Essays at Each Level of Agreement
Administration Exact +/- 1 +/- > 1 Summary Agreement Statistics for 2004-05 and 2005-06 Administrations
Tables 2.9 through 2.11 provide more detailed information on scores assigned by each of the two independent raters for 10th graders, 11th graders, and 12th graders in the 2006–07 administrations. There was near perfect agreement on the essays judged to be unscorable (score level 0). There was generally good agreement on essays assigned to score levels 1 through 3. If the first reader assigned a score at one of these levels, the second reader was most likely to assign the same score. For 11th and 12th
graders, most of whom had taken but not passed the ELA test previously, very few essays were assigned a score of 4. For all three grades, agreement at the highest level was lower than at other levels. If the first reader assigned a score of 4, the second reader was most likely to assign a score of 3.
Page 34 Human Resources Research Organization (HumRRO)
Chapter 2: Results from the 2006–07 Administrations
Table 2.9. Percent of 10th Grade Essays Assigned Each Score Level by Each Rater in the February Through May 2007 Administrations
Average score from first rater 2.5 Average score from second rater 2.5 Percent Exact Agreement (sum of diagonal elements) 69.9 Percent with differences greater than one point 0.4 Note. Bolded numbers indicate perfect agreement between the two raters.
Table 2.10. Percent of 11th Grade Essays Assigned Each Score Level by Each Rater in the 2006–07 Administrations
Average score from first rater 2.0 Average score from second rater 2.0 Percent Exact Agreement (sum of diagonal elements) 77.4 Percent with differences greater than one point 0.2 Note. Bolded numbers indicate perfect agreement between the two raters.
Table 2.11. Percent of 12th Grade Essays Assigned Each Score Level by Each Rater in the 2006–07 Administrations
Average score from first rater 2.0 Average score from second rater 2.0 Percent Exact Agreement (sum of diagonal elements) 77.7 Percent with differences greater than one point 0.3 Note. Bolded numbers indicate perfect agreement between the two raters.
Human Resources Research Organization (HumRRO) Page 35
Independent Evaluation of the CAHSEE: Fourth Biennial Report
Test Score Accuracy
ETS technical documentation provides extensive analyses of the accuracy (reliability) of CAHSEE test scores. A key question not fully addressed in these analyses is the accuracy of pass/fail decisions based on the CAHSEE scores. The most common approach to assessing classification accuracy (Livingston and Lewis, 1995) yields a percent accurate classification statistic that is dependent on the particular pool of examinees taking the test as well as on the reliability of the test itself. In our initial evaluation of the CAHSEE (Wise, et al., 2001, page 44), we used an approach to classification accuracy that separates characteristics of the test questions and characteristics of the examinees. Specifically, we identified the point below the passing level where the item response model predicts an examinee with that true score will have a 10 percent chance of passing. We also identified the point above the passing level where the examinee would have exactly a 90 percent chance of passing. The area between these two points is labeled the “zone of uncertainty.” Candidates with true scores in this zone would have at least a 10 percent chance of being misclassified. The definition of the zone of uncertainty depends only on characteristics of the test questions and is independent of the number of examinees whose true score falls below, within, or above this zone. It is up to policy-makers to decide whether scores at the boundary of this zone are sufficiently different from scores at the passing level to be of concern.
Table 2.12 shows the estimated zone of uncertainty for the March 2007 CAHSEE test form in comparison to the March 2002 test form. This comparison is significant because test form characteristics were changed in 2004. The ELA test was shortened, dropping one of the two essays, and the mathematics test was revised to include more easy questions. The impact of these changes on classification accuracy has not been previously investigated.
Table 2.12. Zone of Uncertainty for 2002 and 2007 Test Forms in Percent Correct Units
Mathematics English/Language Arts (ELA)
Test Form
Decision Cut = 55% of Total Decision Cut = 60% of Total Minimum
P (Pass) =10% Maximum
P (Pass) =90% Minimum
P (Pass) =10% Maximum
P (Pass) =90% March 2002 47.0% 63.5% 57.5% 65.0% March 2007 48.8% 63.8% 54.4% 66.7%
For the mathematics test, there was little change. The zone of uncertainty extended from about 8 percentage point below the 55 percent passing level to about 8 percentage points above this level. Changes to the difficulty of the test questions had little effect on the accuracy of pass/fail classifications. For the ELA test, the zone of uncertainty expanded from a range of 7.5 percentage points to a range of 12.3 percentage points. The new ELA test has fewer multiple-choice questions than the new mathematics test (72 compared to 80), but the essay carries considerable information. The result is that the zone of uncertainty is smaller for the ELA test (a range of 12.3 percentage points) than for the mathematics test (a range of 15.0 percentage points). Changes introduced in 2004 appear to have somewhat equalized the classification accuracy of the two tests.
Page 36 Human Resources Research Organization (HumRRO)
Chapter 2: Results from the 2006–07 Administrations
In deciding whether the current level of score accuracy is sufficient, policy-makers should consider the consequences of different types of classification errors. Students only slightly above the minimum score (e.g., 55 to 64 percent correct for mathematics) have only marginally mastered the required material. When, due to measurement error, students in this range are incorrectly classified as not passing, they are required to study harder and try again. Given a marginal level of initial mastery, there is some benefit to this outcome as well as a “cost” to the student. Similarly, students who are only slightly below the minimum score (e.g., 49 to 54 percent correct for mathematics) have mastered much of the required material. When some of these students are erroneously classified as passing, the consequence of the classification error is less than it would be if the students were far below the required level of mastery.
Table 2.13 shows the percentage of 10th grade students below, within, and above the zone of classification uncertainty for each of the CAHSEE tests in 2002 and 2007. The examinee distributions are very different for these two years for several reasons. In 2001, 9th graders were allowed to participate in the first CAHSEE administrations on a voluntary basis. In 2002, all 10th
graders who had not already taken and passed the CAHSEE as 9th graders were required to take the tests. Students who passed as 9th graders were excluded, reducing the number of students near the top of the achievement distribution. Second, standards-based instruction has improved since 2002, at both the middle school and high school levels, leading to better performance on the CAHSEE. Finally, particularly for mathematics, the new test was somewhat easier, also leading to higher passing levels in 2007.
As a result of examinee population changes, the percent of students falling in the zone of uncertainty decreased even while the zone was widened, particularly for the ELA test. The percent of students in the zone of uncertainty decreased from 35 percent down to 16 percent for ELA and from 33 percent down to 18 percent for mathematics. For both tests, roughly two-thirds of the students were above the zone of uncertainty and classified clearly as passing in 2007 compared to only 20 percent in mathematics and 37 percent in ELA in 2002. Figure 2.1 shows this graphically.
Human Resources Research Organization (HumRRO) Page 37
Independent Evaluation of the CAHSEE: Fourth Biennial Report
Table 2.13. Percent of Students in Each Score Range Score Range 2002 2007
Mathematics Below zone of uncertainty 47.6 19.4 Within zone of uncertainty and 19.9 4.8 below the decision cut Within zone of uncertainty and 12.7 13.0 above the decision cut Above the zone of uncertainty 19.6 62.8
English/Language Arts Below zone of uncertainty 28.1 15.8 Within zone of uncertainty and 17.5 7.4 below the decision cut Within zone of uncertainty and 17.1 8.4 above the decision cut Above the zone of uncertainty 37.3 68.4
100%
60%
80%
20%
40%
Perc
ent o
f Stu
dent
s
0% ELA-2002 ELA-2007 Math-2002 Math-2007
13
28.1 15.8
47.6 19.4
17.5
7.4
19.9
4.8
17.1
8.4
12.7 37.3
68.4
19.6
62.8
ll l lWe Be ow Cut Just Be ow Cut Just Above Cut Well Above Cut
Figure 2.1. Percent of students in 2002 and 2007 below, within, and above the zone of uncertainty.
Page 38 Human Resources Research Organization (HumRRO)
Chapter 2: Results from the 2006–07 Administrations
Test Results
Class of 2006 – Many Students Continued to Try to Pass the CAHSEE
Tables 2.14 through 2.16 show the number of students in the Class of 2006 who are now estimated to have passed the CAHSEE through May 2007. We are continuing to report students in special education programs separately, but exclude them from the other student groups, including the counts for all students. In 2006–07, 20,409 examinees were judged to have been in the Class of 2006 in the previous year (4,134 in special education and 16,275 other students). We found matched records in the 2005– 06 test data for 91 percent. The other 9 percent were students in adult education or with an invalid grade code who could not be matched to prior records, but responded in student questionnaire item 16 that they had been in the 12th grade in the 2005–06 school year. If these students with no matching prior-year record took only one of the two CAHSEE tests, we imputed that they had passed the other test in estimating the cumulative numbers of students passing both tests.
Table 2.14. Estimated Number and Percent of Students in the Class of 2006 Passing Both CAHSEE Tests Through May 2007
By May 2006 July 2006–May 2007 Cumulative Total Not Yet Not Not Not Percent
Group Passed Passed* Pass Passed Tested Passed Passed Pass
All students 399,344 38,574 3,893 10,864 23,817 403,237 34,681 92.1%
English learner 53,851 16,989 1,376 4,932 10,681 55,227 15,613 78.0% Special education* 19,017 20,790 313 2,660 17,817 19,330 20,477 48.6%
* Students in special education programs who had not passed the CAHSEE by the end of 11th grade were allowed to meet the CAHSEE requirement in other ways. These students were excluded from all rows of the table except for the last row.
Explanation of table contents: The first line of the table indicates that 399,344 students who were in the Class of 2006 last year passed both CAHSEE tests by the May 2006 administration and 38,574 students did not. Of the 38,574 who had not passed, 3,893 had passed by May 2007, 10,864 had taken the CAHSEE test again but not passed both parts and 23,817 had not taken the CAHSEE test again. A cumulative total of 403,237 had passed the ELA test by May 2007 (the sum of those passing by May 2006 and those passing since then). The cumulative number not passing was reduced to 34,681 (those testing and not passing plus those not testing since May 2006). The cumulative percent passing is the total passing (403,237) divided by the sum of those passing and those not passing (403,237 plus 34,681) and expressed as a percent. This same format is used for Tables 2.15 and 2.16 as well.
Human Resources Research Organization (HumRRO) Page 39
Independent Evaluation of the CAHSEE: Fourth Biennial Report
Table 2.15. Estimated Number and Percent of Students in the Class of 2006 Passing the CAHSEE ELA Test Through May 2007
Group
By May 2006 July 2006–May 2007 Cumulative Total
Passed Not Yet Passed* Pass
Not Passed
Not Tested Passed
Not Passed
Percent Pass
All students 412,513 25,405 3,042 10,905 11,458 415,555 22,363 94.9%
Females Males
208,743 10,652 203,559 14,846
1,419 5,973 3,260 1,621 4,924 8,301
210,162 9,233 95.8% 205,180 13,225 93.9%
Asian Hispanic African American White, non-Hispanic
English learner 57,284 13,556 1,182 4,953 7,421 58,466 12,374 82.5%
Special education 23,725 16,082 373 2,536 13,173 24,098 15,709 60.5% * Students in special education programs who had not passed the CAHSEE by the end of 11th grade
were allowed to meet the CAHSEE requirement in other ways. These students were excluded from all rows of the table except for the last row.
Results from the July 2006 through May 2007 CAHSEE administrations for students in the Class of 2006 are reasonably encouraging in that, as shown in the first rows of Tables 2.14 through 2.16 above, about 40 percent of the students who did not pass the CAHSEE in time to graduate with their class are continuing to take the CAHSEE. It is likely that many of these students failed to meet other requirements, leading them to repeat the 12th grade. More than a quarter of the students from the Class of 2006 still testing have now passed the CAHSEE as shown in the first line of Table 2.14.
Page 40 Human Resources Research Organization (HumRRO)
Chapter 2: Results from the 2006–07 Administrations
Table 2.16. Estimated Number and Percent of Students in the Class of 2006 Passing the CAHSEE Mathematics Test Through May 2007
Group
By May 2006 July 2006-May 2007 Cumulative Total
Passed Not Yet Passed* Pass
Not Passed
Not Tested Passed
Not Passed
Percent Pass
All students 410,362 27,556 3,109 10,803 13,644 413,471 24,447 94.4%
English learner 60,804 10,036 829 5,034 4,173 61,633 9,207 87.0% Special education* 22,111 17,696 318 2,557 14,821 22,429 17,378 56.3%
* Students in special education programs who had not passed the CAHSEE by the end of 11th grade were allowed to meet the CAHSEE requirement in other ways. These students were excluded from all rows of the table except for the last row.
**The number of Asian students testing this year is slightly greater than the estimate for the number who had not passed by May of 2006. This discrepancy may be due to recent immigrants who had not previously tested, changes in race/ethnicity codes, or to uncertainty in identifying Class of 2006 students when no matching prior-year record was found.
Class of 2007– This Year’s Seniors Struggle to Meet Graduation Deadline
HumRRO worked with CDE to analyze test results for seniors after each of the 2005–06 administrations. The department issued press releases based on HumRRO’s findings counting down the numbers of students who still had to complete the CAHSEE requirement, overall and for specific subgroups (see http://www.cde.ca.gov/nr/ne/yr07/). HumRRO used corrected data files received in September to reanalyze results through May 2007. Tables 2.17 through 2.19 show estimated cumulative passing rates for the Class of 2007 after including results from the CAHSEE administrations of July 2006 through May 2007. In computing the estimates shown in these tables, several adjustments were made to previous estimates of the numbers who had not passed both parts in prior years.
• First, students with disabilities who had not passed by the end of 11th grade were reported separately since these students were eligible for an exemption if they met other criteria. This was a change from our report of the July 2006 results. Legislation enacted after July 2006 extended the exemption for students with disabilities to the Class of 2007 and our reporting was changed accordingly.
• Next we removed students who appeared to shift from the Class of 2007 to a different high school class, either because they were retained in the 11th grade between the
Human Resources Research Organization (HumRRO) Page 41
Independent Evaluation of the CAHSEE: Fourth Biennial Report
2005–06 and 2006–07 school years or, in a few cases, dropped back to 10th grade or entered an adult education program.
• We then added in students who joined the target class because of grade skipping (from 10th grade in the 2005–06 school year to 12th grade in the 2006–07 school year) or because they were retained in 12th grade from last year. Note that 14,935 of the students from the Class of 2006 (included in Tables 2.14 through 2.16 above) are shown as being retained in 12th grade and are thus also included in analyses of the Class of 2007.
• Finally, we removed (from prior-year counts) Class of 2007 students in the 2005–06 test files who had not passed both parts, but were not matched to a test record from the July 2006–May 2007. These were judged to be students no longer trying to pass the CAHSEE. We also added back counts for Class of 2007 students in the July 2006–May 2007 administrations who could not be matched to prior-year records. These were either new students who had not tested previously, or some of the students from the 2005–06 test files who could not be matched due to coding errors.
The percentages in these tables are subject to some debate due to differences of opinion as to the appropriate denominator (the base for computing the percentages). For example, students who passed the CAHSEE, but subsequently left the state or dropped out, are included in the denominator, since we have no basis for estimating the number of such students. Students who are still trying to pass the CAHSEE are also included in the denominator.
Table 2.17. Estimated Number and Percent of Students in the Class of 2007* Passing Both CAHSEE Tests Through May 2007
Passed Both Estimated Numbers of Students Percent of Students Grade Grade Grade Not Revised Grade Grade Grade Total
Group 10 11 12** Yet** Total 10 11 12** Passing
All students 307,963 65,741 32,216 39,178 445,098 69.2% 14.8% 7.2% 91.2%
* Current 12th graders who also tested as 12th graders in 2005–06 are included in this table as well as in Tables 2.12–2.14.
**Students in special education programs who had not passed the CAHSEE by the end of 11th grade were allowed to meet the CAHSEE requirement in other ways. These students were excluded from the Grade 12 passing and not yet passing counts for all rows of the table except for the last row.
Page 42 Human Resources Research Organization (HumRRO)
Chapter 2: Results from the 2006–07 Administrations
Table 2.18. Estimated Number and Percent of Students in the Class of 2007* Passing the CAHSEE ELA Test Through March 2007
Passed ELA Estimated Numbers of Students Percent of Students Grade Grade Grade Not Revised Grade Grade Grade Total
Group 10 11 12** Yet** Total 10 11 12** Passing
All students 348,020 49,203 23,918 23,957 445,098 78.2% 11.1% 5.4% 94.6%
* Current 12th graders who also tested as 12th graders in 2005–06 are included in this table as well as in Tables 2.12–2.14.
**Students in special education programs who had not passed the CAHSEE by the end of 11th grade were allowed to meet the CAHSEE requirement in other ways. These students were excluded from the Grade 12 passing and not yet passing counts for all rows of the table except for the last row.
Human Resources Research Organization (HumRRO) Page 43
Independent Evaluation of the CAHSEE: Fourth Biennial Report
Table 2.19. Estimated Number and Percent of Students in the Class of 2007* Passing the CAHSEE Mathematics Test Through May 2007
Passed Math Estimated Numbers of Students Percent of Students Grade Grade Grade Not Revised Grade Grade Grade Total
Group 10 11 12** Yet** Total 10 11 12** Passing
All students 337,376 55,206 27,033 25,483 445,098 75.8% 12.4% 6.1% 94.3%
* Current 12th graders who also tested as 12th graders in 2005–06 are included in this table as well as in Tables 2.12–2.14.
**Students in special education programs who had not passed the CAHSEE by the end of 11th grade were allowed to meet the CAHSEE requirement in other ways. These students were excluded from the Grade 12 passing and not yet passing counts for all rows of the table except for the last row.
Tables 2.20 through 2.22 show the passing rates of current seniors excluding students known to have previously been in the Class of 2006. The students included in these tables are essentially first-year seniors, although a few students repeating 12th
grade may not have tested last year or may not have been matched to prior test records and thus are also included in these tables. Excluding the repeat 12th graders and also excluding students who had not previously passed the CAHSEE but have not yet taken it this year leads to the smallest denominator for computing the passing percentages and the most optimistic estimate of the percent of students in the Class of 2007 who have met the CAHSEE requirement.
Page 44 Human Resources Research Organization (HumRRO)
Chapter 2: Results from the 2006–07 Administrations
Table 2.20. Estimated Number and Percent of Students in the Class of 2007* Passing Both CAHSEE Tests Through May 2007 — Excluding Repeat 12th Graders
Passed Both Estimated Numbers of Students Percent of Students Grade Grade Grade Not Revised Grade Grade Grade Total
Group 10 11 12** Yet** Total 10 11 12** Passing
All students 307,963 65,741 27,782 28,981 430,467 71.5% 15.3% 6.5% 93.3%
* Current 12th graders who also tested as 12th graders in 2005—06 are included in Tables 2.12–-2.14, but excluded from this table.
**Students in special education programs who had not passed the CAHSEE by the end of 11th grade were allowed to meet the CAHSEE requirement in other ways. These students were excluded from the Grade 12 passing and not yet passing counts for all rows of the table except for the last row.
Human Resources Research Organization (HumRRO) Page 45
Independent Evaluation of the CAHSEE: Fourth Biennial Report
Table 2.21. Estimated Number and Percent of Students in the Class of 2007* Passing the CAHSEE ELA Test Through May 2007 — Excluding Repeat 12th Graders
Passed ELA Estimated Numbers of Students Percent of Students Grade Grade Grade Not Revised Grade Grade Grade Total
Group 10 11 12** Yet** Total 10 11 12** Passing
All Students 348,020 45,251 20,132 17,064 430,467 80.8% 10.5% 4.7% 96.0%
* Current 12th graders who also tested as 12th graders in 2005–06 are included in Tables 2.12–2.14, but excluded from this table.
**Students in special education programs who had not passed the CAHSEE by the end of 11th grade were allowed to meet the CAHSEE requirement in other ways. These students were excluded from the Grade 12 passing and not yet passing counts for all rows of the table except for the last row.
Page 46 Human Resources Research Organization (HumRRO)
Chapter 2: Results from the 2006–07 Administrations
Table 2.22. Estimated Number and Percent of Students in the Class of 2007* Passing the CAHSEE Mathematics Test Through May 2007 — Excluding Repeat 12th Graders
Passed Math Estimated Numbers of Students Percent of Students Grade Grade Grade Not Revised Grade Grade Grade Total
Group 10 11 12** Yet** Total 10 11 12** Passing
All students 337,376 51,341 22,956 18,794 430,467 78.4% 11.9% 5.3% 95.6%
* Current 12th graders who also tested as 12th graders in 2005—06 are included in Tables 2.12–2.14, but excluded from this table.
**Students in special education programs who had not passed the CAHSEE by the end of 11th grade were allowed to meet the CAHSEE requirement in other ways. These students were excluded from the Grade 12 passing and not yet passing counts for all rows of the table except for the last row.
Table 2.23 shows a comparison of cumulative passing rates for the Classes of 2006 and 2007 through May of their senior year. Passing rates for the Class of 2007 are shown in one column for all students indicated as current 12th graders by their CAHSEE records and in another column with 12th graders who were previously in the Class of 2006 excluded. The overall passing rate (both parts) for the Class of 2007 is the same as the corresponding percentage for the Class of 2006 last year (91.2%) when prior-year 12th graders are included. The overall Class of 2007 passing rate is estimated to be 2.1 points higher than for the Class of 2006 when repeat 12th graders are excluded (93.3% compared to 91.2%).
The 2006 and 2007 12th grade passing rates are similar for all demographic groups except English learners and students in special education programs. The 2007 passing rate for English learners is lower than the corresponding rate for the Class of 2006 at this point in the school year if all current 12th graders are included (72.3% compared to 76.0%), but higher when repeat 12th graders are excluded from the Class of 2007 estimates (77.1% compared to 76.0%). For students in special education programs, the estimated overall passing rate for the Class of 2007 is similarly lower if all current 12th graders are included (44.5% compared to 47.8%) but again higher when repeat 12th graders are excluded (48.8% compared to 47.8%). It is possible that the lower passing rate for students in special education indicates a drop in the number of
Human Resources Research Organization (HumRRO) Page 47
Independent Evaluation of the CAHSEE: Fourth Biennial Report
these students who continued to take the CAHSEE, as the exemption for these students was available to Class of 2007 students much earlier in their senior year.
Neither of the rates for the Class of 2007 is exactly comparable to last year’s passing rates for the Class of 2006. The Class of 2006 figures included some unknown number of repeat 12th graders, but these students had not previously been subject to the CAHSEE requirement. The repeat 12th graders in the Class of 2007 were previously subject to the CAHSEE requirement and had many opportunities to pass. Most of the repeat 12th graders included in the Class of 2007 testing were those who had not passed several times previously. Consequently, the passing rate for repeat 12th graders in the Class of 2007 continuing to take the CAHSEE was undoubtedly much lower than the passing rate for repeat 12th graders in the Class of 2006 who had taken the CAHSEE previously.
Table 2.23. Comparison of Estimated Passing Rates for the Classes of 2006 and 2007 Through May of Their Senior Year
Passed ELA Passed Mathematics Passed Both Last All 2007 Last All 2007 Last All 2007
Year’s Current Without Year’s Current Without Year’s Current Without
Group*
12th
Graders (2006)
12th
Graders (2007)
Repeat 12th
Graders
12th
Graders (2006)
12th
Graders (2007)
Repeat 12th
Graders
12th
Graders (2006)
12th
Graders (2007)
Repeat 12th
Graders
All students 94.2% 94.6% 96.0% 93.7% 94.3% 95.6% 91.2% 91.2% 93.3%
* Students in special education programs who did not pass the CAHSEE by the end of 11th grade are excluded from each demographic category except the last.
Further Analyses of 12th Graders Testing in 2006–07
We conducted further analyses to investigate the relationship of what we knew about seniors’ coursework to their success on the CAHSEE. There is a great deal of variation in the mathematics curriculum of different students and the CAHSEE answer document asks in which grade various mathematics courses are taken. For the most part, student responses to this question appear to be reliable, although students sometimes mark multiple grades for the same course. When this happens, the ETS software treats it as
Page 48 Human Resources Research Organization (HumRRO)
Chapter 2: Results from the 2006–07 Administrations
an invalid response even though students may have, in fact, repeated a course. Some students did not respond to this question.
We looked at the highest mathematics course taken for all seniors in the Class of 2007 in comparison to similar analyses for the Class of 2006 last year. Table 2.24 shows the percentage of students at each course level and also the percentage of students in the category that passed the CAHSEE math test during their senior year. The percentage of students whose highest course was Algebra I increased from 34 percent to about 41 percent, while the percentage of student whose highest course was less than Algebra decreased substantially (from 20 percent down to 9 percent). Apparently, more of the students struggling to pass the CAHSEE are taking an Algebra course by their senior year.
At each level, the percentage of 12th graders passing the CAHSEE mathematics test was smaller in 2007 than in 2006. This may be due, in part, to the inclusion of repeat 12th graders in these figures. So while more students are taking higher level mathematics courses, many are not yet benefiting fully from these courses, as evidenced by lower CAHSEE passing rates.
Table 2.24. Distribution of 12th Graders and Percent Passing Mathematics by Highest Mathematics Course Taken
Percent of All 12th Graders Highest Mathematics Taking the CAHSEE Math Percent in Category
Course Taken Test* Passing CAHSEE Math 2006 2007 2006 2007
1. General Math 5.7% 3.5% 32.4% 19.7% 2. Pre-Algebra 13.8% 5.2% 39.7% 26.1% 3. Algebra I/Integrated Math 1 33.7% 41.4% 39.2% 36.3% 4. Geometry/Integrated Math 2 25.5% 27.8% 55.5% 49.3% 5. Algebra II/Integrated Math 3 19.0% 19.8% 59.6% 55.7% 6. Advanced Math 2.2% 2.3% 83.7% 82.7% Total 100.0% 100.0% 47.9% 43.7%
* Note: Column totals may not add to 100 due to rounding.
We also looked at when seniors had taken Algebra I. Table 2.25 shows the grades at which Algebra I was taken and the CAHSEE math passing rate for seniors taking Algebra I at each of these grades. Students who took mathematics earlier in high school appear to have been more prepared to master the required material, particularly in comparison to students who were just taking Algebra I in 12th grade or who had not taken it at all.
Table 2.26 shows how students in different demographic groups differed in whether they had taken Algebra I and courses beyond Algebra I. Among students who had not passed the CAHSEE mathematics test by the end of 11th grade, females were more likely to have taken courses beyond Algebra I. Not surprisingly, the striking difference is
Human Resources Research Organization (HumRRO) Page 49
Independent Evaluation of the CAHSEE: Fourth Biennial Report
for students in special education programs, only about a third of whom have taken Geometry or other courses beyond Algebra I.
Table 2.25. Distribution of 12th Graders and Percent Passing Mathematics by When They Took Algebra I
Grade in Which Algebra I was Taken
Percent of All 12th Graders Taking the CAHSEE Math Test*
To create a profile of students who were struggling to pass the CAHSEE in 2007, we obtained results from the 2006 administration of the California Standards Tests (CSTs), including ELA and mathematics end-of-course tests for students in grades 8 through 11. Table 2.27 shows average CST scores for 12th graders taking the CAHSEE in comparison to all students who took the same CST.
Students in 12th grade in 2007, who were still taking the CAHSEE, had scored roughly one full standard deviation below the average for all 11th graders in 2006 on the 11th grade ELA test and on the Algebra II and Geometry tests. Students who had not yet passed the CAHSEE and were just taking Algebra I in 2006 scored about three-quarters
Page 50 Human Resources Research Organization (HumRRO)
Chapter 2: Results from the 2006–07 Administrations
of a standard deviation below the average for all Algebra I students on the Algebra I end-of-course test. That they had not yet passed the CAHSEE was an indication that these students lacked some more fundamental skills, so it should not be surprising that they did not do well in the more advanced courses.
Table 2.27. 2006 CST Score Means, Standard Deviations, and Correlation With CAHSEE Scores for Students Taking the CAHSEE in 2007 Course/Population
11th Grade ELA N Mean S.D. Corr. CAHSEE 12th Graders 58,294 255.65 35.22 0.37 All CST Examinees 41,4220 324.44 70.40 Diff (in S.D. Units) -0.98
Algebra I N Mean S.D. Corr. CAHSEE 12th Graders 23,453 261.86 32.36 0.28 All CST Examinees 700,847 308.65 62.74 Diff (in S.D. Units) -0.75
Geometry N Mean S.D. Corr. CAHSEE 12th Graders 11,498 250.76 32.02 0.32 All CST Examinees 358,054 312.75 65.94 Diff (in S.D. Units) -0.94
Algebra II N Mean S.D. Corr. CAHSEE 12th Graders 4,666 248.38 42.40 0.38 All CST Examinees 213,125 312.60 64.16 Diff (in S.D. Units) -1.00
CST results are also reported in terms of five performance levels, numbered 1 for the lowest to 5 for the highest. Table 2.28 shows the percentage of students taking the CAHSEE in 2007 at each 2006 CST level who completed the CAHSEE requirement in their senior year.
Table 2.28. Percentage of Current 12th Grade Students at Each CST Performance Level in 2006 Who Completed the CAHSEE Requirement in 2007
Human Resources Research Organization (HumRRO) Page 51
Independent Evaluation of the CAHSEE: Fourth Biennial Report
Analyses of 12th Grader Responses to the Student Questionnaire
We also looked at responses to two of the student questionnaire items that included information on courses taken. Table 2.29 shows the distribution of 12th grade student responses to questions 9 and 12 on the questionnaire completed after the mathematics test, along with the math passing rates for students selecting each response.
Table 2.29. Distribution of 12th Graders and Percent Passing Mathematics by Responses to Mathematics Questionnaire Items
Student Questionnaire Items and Percent of All 12th Graders Percent in Category Response Categories Taking the CAHSEE Math Passing CAHSEE
Test Math Question 9: Were the topics on the test covered in courses you have taken? 2006 2007 2006 2007 A. Yes, all of them. 25.5% 26.6% 52.9% 48.0% B. Most (2/3rds or more) 56.5% 56.3% 45.8% 42.3% C. Many topics were not covered 17.8% 17.0% 34.6% 32.2%
Question 12: If some topics on the test were difficult for you, was it because: 2006 2007 2006 2007 A. I did not take courses that covered 20.6% 27.6% 39.2% 44.9%
these topics. B. I had trouble with these topics in the 36.6% 27.6% 43.1% 41.1%
courses I took. C. I have forgotten things I was taught 33.3% 37.6% 51.0% 54.9%
about these topics. D. None of the topics was difficult for me. 7.8% 5.6% 47.8% 54.1%
In response to Question 9, about a quarter of the 12th graders taking the CAHSEE math test said that all of the topics on the test were covered in their courses and 53 percent of the students who gave this responses ended up passing. By contrast, 18 percent said that many topics were not covered and only 35 percent of these students passed. In response to question 12, just over 20 percent of the 12th graders said that they did not take courses covering topics on the mathematics test and fewer than 40 percent of these students passed. About 37 percent of 12th graders responding to question 12 said that they had trouble with the topics in the courses they took and about 43 percent of these students passed. It should not be surprising that very few students (8 percent) still taking the CAHSEE mathematics test in 12th grade reported that none of the topics were difficult.
We also compared the responses to the student questionnaire items on coverage of test content to their report of mathematics courses taken. Table 2.30 shows the percentage of 12th grade students at different course levels and the percentage of students taking or not taking Algebra I at different times for students selecting each response category on questionnaire items 9 and 12.
Page 52 Human Resources Research Organization (HumRRO)
Chapter 2: Results from the 2006–07 Administrations
Table 2.30. Mathematics Courses Taken by Responses to Mathematics Questionnaire Items
Highest Math Course Taken When Was Algebra I Taken? Student Questionnaire Less than Algebra I More than Before During Have Not Items and Response Algebra I Only Algebra I 12th 12th Taken
Categories Grade Grade Algebra I Question 9: Were the topics on the test covered in courses you have taken? A. Yes, all of them. 15.0% 28.8% 56.2% 47.2% 14.9% 37.9%
B. Most, but not all of them 17.8% 34.2% 48.0% 43.6% 16.9% 39.5% (2/3rds or more) C. Many topics were not 23.2% 39.3% 37.5% 37.6% 19.9% 42.5% covered Question 12: If some topics on the test were difficult for you, was it because: A. I did not take courses 22.6% 40.4% 37.0% 37.5% 20.7% 41.8% that covered these topics. B. Had trouble with topics 17.8% 33.1% 49.1% 43.8% 16.3% 39.9% in the courses I took. C. Forgot things I was 16.1% 31.3% 52.6% 46.2% 15.7% 38.2% taught about these topics. D. None of the topics was 14.6% 28.3% 57.1% 47.3% 14.6% 38.2% difficult for me.
Over half of the 12th graders (56%) who said that all of the topics on the CAHSEE mathematics test were covered in their courses had taken courses beyond Algebra I compared to only 38 percent of the students who reported that many topics were not covered in their courses. About 47 percent of the students who said that all of the topics on the math test were covered had completed Algebra I before 12th grade compared to 38 percent of the students who said that many topics were not covered. More than 40 percent of the students who said that many topics were not covered had not taken Algebra I at all.
In response to the question of why some of the topics on the mathematics test were difficult (Question 12), 23 percent of the 12th graders who said they did not take courses that covered these topics had not taken Algebra I and only 37 percent had taken courses beyond Algebra I. By comparison, only 15 percent of the students who said none of the topics was difficult had yet to take Algebra I, and 57 percent had taken courses beyond Algebra I.
Profile of 12th Graders Not Yet Passing
We conclude our analyses of results for 12th graders in 2007 with a profile of the students who were not able to pass the CAHSEE by June of their senior year. For these analyses, students in special education (SE) programs are excluded because we cannot determine which of these students took advantage of the exemption from the CAHSEE requirement.
Table 2.31 shows the number of non-SE 12th grade students (Class of 2007) attempting, but not passing the CAHSEE in the 2006–07 school year by gender and
Human Resources Research Organization (HumRRO) Page 53
Independent Evaluation of the CAHSEE: Fourth Biennial Report
race and also the numbers of students who were low socio-economic status (SES) and English learners. The numbers in each category are also expressed as a percent of the total. For comparison, the numbers and percents of all non-SE 10th graders testing in the 2004–05 school year (when we first encountered the Class of 2007) are also shown.
The last column in Table 2.31 shows an odds-ratio indicating how much more likely it was for the student to be in that demographic category among 12th graders not passing than among all 10th graders two years earlier. The odds-ratios are greater than 1.5 for Hispanic and Low-SES students, indicating that relatively more of these students are having difficulty passing the CAHSEE. Even greater odds-ratios were found for African American students (nearly 2.0) and for English Learners (over 2.5). Finally, the odds-ratio for students more than a year older than most of their classmates was more than 3.0 and the odds-ratio for students more than two years older than their classmates was nearly 10. These students were, most likely, retained in grade one or more times suggesting significant difficulty mastering required material at some point in their schooling.
Page 54 Human Resources Research Organization (HumRRO)
Chapter 2: Results from the 2006–07 Administrations
Table 2.31. Demographic Characteristics of Non-SE 12th Graders Not Passing the CAHSEE in 2007 Compared to All 10th Graders in 2005
Non-SE 12th Graders All Non-SE 10th
Demographic Group Not Passing in 2007 Graders in 2005 Ratio of
Percents** N* Percent N* Percent All students 39,496 100.0% 428,214 100.0% 1.00
* Counts for subgroup do not add to totals because of missing demographic information. ** Ratios greater than 1.5 are shown in bold italic.
Human Resources Research Organization (HumRRO) Page 55
Independent Evaluation of the CAHSEE: Fourth Biennial Report
Class of 2008 — Improvement for Students Who Retested in 11th Grade
We analyzed the number of 11th grade students (Class of 2008) who passed each part of the CAHSEE and the number completing the requirement to pass both parts and added these to the corresponding numbers for last year’s 10th graders. Students shown as 11th graders in the 2005–06 CAHSEE administrations included some students who were repeating 11th grade, thus moving from the Class of 2007 cohort last year to the Class of 2008 Cohort. This year’s 11th graders also included some students new to the state and other students who were 9th graders in 2006. Students who repeated the 10th
grade in 2006–07 were dropped from the Class of 2008 cohort as were students who did not pass in 2006 and failed to test at all during the 2006–07 school year. The net of these differences was that the estimated number of students in the Class of 2008 decreased by 1,587 from about 505,045 at the end of 10th grade to 503,458 at the end of 11th grade. The impact of this change on passing rate estimates is negligible.
Tables 2.32 through 2.34 show the estimated number of students in the Class of 2008 passing the ELA test, the mathematics test, and both tests respectively. Table 2.35 compares the 11th grade passing rates for the Class of 2008 with the 11th grade passing rates for the Classes of 2006 and 2007. Overall, the cumulative percentage of students who passed both parts of the CAHSEE by the end of 11th grade dropped about one percentage point. A similar trend was found for most demographic groups. The drop was slightly larger for English learners, just over two percentage points. The passing rate for students in special education, although still quite low, increased very slightly.
Table 2.32. Estimated Number and Percent of Students in the Class of 2008 Passing Both CAHSEE Tests Through 11th Grade Passed Both Number of Students* Percent of Students
Group Grade 10 Grade 11 Not Yet Total Grade
10 Grade
11 Total
Passed All Students 328,939 63,559 110,987 503,485 65.3% 12.6% 78.0%
English Learner 22,597 14,169 38,018 74,784 30.2% 18.9% 49.2% Special Education 10,673 5,273 31,043 46,989 22.7% 11.2% 33.9%
* Students with missing demographic information are excluded from counts by gender or race/ethnicity.
Page 56 Human Resources Research Organization (HumRRO)
Chapter 2: Results from the 2006–07 Administrations
Table 2.33. Estimated Number and Percent of Students in the Class of 2008 Passing the CAHSEE ELA Test Through 11th Grade Passed ELA Number of Students* Percent of Students
Grade Grade Grade Total Group Grade 10 11 Not Yet Total 10 11 Passed
English Learner 29,439 14,408 30,937 74,784 39.4% 19.3% 58.6% Special Education 15,708 6,127 25,154 46,989 33.4% 13.0% 46.5%
* Students with missing demographic information are excluded from counts by gender or race/ethnicity.
Table 2.34. Estimated Number and Percent of Students in the Class of 2008 Passing the CAHSEE Mathematics Test Through 11th Grade Passed Math Number of Students* Percent of Students
Grade Grade Grade Total Group Grade 10 11 Not Yet Total 10 11 Passed
All Students 359,980 56,069 87,436 503,485 71.5% 11.1% 82.6%
* Passing rates are based on students who have passed in the 10th grade or who were still taking the exam as 11th graders. Estimates are only approximate because of difficulties in matching 10th and 11th grade results. Unmatched 11th graders who took only one of the two tests were assumed to have passed the other in 10th grade; those who took both tests were assumed to have passed neither in 10th grade.
** Cumulative Native American 11th grade passing rates were not previously reported.
Class of 2009 — Initial Passing Rates for 10th Graders
A major charge for the independent evaluation was to analyze and report performance on the CAHSEE for all students and for specific demographic groups, including economically disadvantaged students, English learners (EL), and students with disabilities (characterized as “exceptional needs students” in the legislation). Table 2.36 shows the 10th grade CAHSEE completion rates (passing both parts) for the Classes of 2006 through 2009. Passing rates for the Classes of 2004 and 2005 are not exactly comparable as changes to the tests were introduced in 2004 when the exam was restarted for the Class of 2006. Also, some students in the Class of 2004 took the CAHSEE voluntarily in 2001 as 9th graders. Since 2003 (the Class of 2005), the 10th grade results are based on a census testing of all students. Tables 2.37 and 2.38 show comparative passing rates for the ELA and mathematics tests respectively.
Page 58 Human Resources Research Organization (HumRRO)
Chapter 2: Results from the 2006–07 Administrations
Table 2.36. Percent of 10th Grade Students Passing Both Parts of the CAHSEE by Demographic Group
Group
Students Tested Percent Passing
Class of Class of Class of Class of Class of Class of Class of Class of 2006 2007 2008 2009 2006 2007 2008 2009
*Note. The numbers in different demographic categories may not add to the total because of missing demographic information.
Figure 2.2 shows the trend in passing rates for the CAHSEE as a whole and for the ELA and Mathematics test separately. Figure 2.3 displays trends in the overall 10th grade passing rates for demographic groups that have had particular difficulties in passing the CAHSEE. As illustrated by these charts, 10th grade passing rates increased about 2 to 4 percentage points for all groups except English learners and students in special education programs. Tenth grade passing rates for these last two groups are unchanged.
The CAHSEE is administered to the complete census of 10trh graders. However, as shown in Table 2.4 above, some students repeat 10th grade and are thus included in more than one census testing. The new statewide student identifiers make it possible to identify repeat 10th graders more exactly than was previously the case. Table 2.39 shows the numbers of first-time and repeat 10th graders in the 2006–07 CAHSEE administration and their CAHSEE passing rates by demographic group. In this table, we have also shown gender breakouts within the larger race/ethnicity groups.
Human Resources Research Organization (HumRRO) Page 61
Independent Evaluation of the CAHSEE: Fourth Biennial Report
59% 72
%
66%
64% 73
%
72%
65% 75
%
72%
65% 73
%
72%
65%
73%
78%
0%
20%
40%
60%
80%
100%
Cl Cl Cl Cl Cl
Both ELA Math
10th
Gra
de P
ass
Rat
e
ass of 2005 ass of 2006 ass of 2007 ass of 2008 ass of 2009
Figure 2.2. Trends in 10th grade CAHSEE passing rates.
100%
61%
43%
40% 41%
24%
20%
64%
49%
45% 48%
30%
19%
65%
51%
46% 50
%
31%
20%
65%
52%
46% 51
%
27%
21%
65%
53%
48% 51
%
26%
21%
10th
Gra
de P
ass
Rat
e
80%
60%
40%
20%
0% All Hispanic Afr-Amer ED EL SE
2005 2006 2007 2008 2009
Figure 2.3. Trends in overall passing rates for selected groups. Note: ED = Economically disadvantaged, EL = English Learner, SE = students in special education.
Page 62 Human Resources Research Organization (HumRRO)
Chapter 2: Results from the 2006–07 Administrations
Table 2.39. Percent of First-Time and Repeat 10th Grade Students Passing the CAHSEE by Demographic Group
Number of Students Tested1
Percent Passing ELA
Percent Passing Mathematics
Percent Passing Both
First- First- First- First-Time 10th
Repeat 10th
Time 10th
Repeat 10th
Time 10th
Repeat 10th
Time 10th
Repeat 10th
Group Graders Graders Graders Graders2 Graders Graders2 Graders Graders2
Special education 47,748 1,739 31.0% 22.1% 29.6% 15.1% 21.6% 8.2% students
*Notes 1. A small number of students shown as first-time 10th graders may actually be repeat test takers for whom no 2006 CAHSEE
test records could be found. 2. Passing rates for repeat 10th graders include students who passed previously. Also, a small number of students shown as
first-time 10th graders may actually be repeat test takers for whom no 2006 CAHSEE test records could be found.
Human Resources Research Organization (HumRRO) Page 63
Independent Evaluation of the CAHSEE: Fourth Biennial Report
Analysis of Results by Mathematics Courses Taken
We analyzed passing rates on the mathematics part of the CAHSEE for students who had completed different levels of math courses. Table 2.40 shows the distribution of the highest level of mathematics course completed by students in the Class of 2009 compared to students in the classes of 2005 through 2008. A striking change noted in this table is that nearly all students have now taken Algebra I by Grade 10.
Table 2.40. Distribution of 10th Grade Students by Highest Math Course Taken Class of Class of Class of Class of Class of
2005 2006 2007 2008 2009 General Math Pre-Algebra Algebra I/Int. Math I Geometry/Int. Math II Algebra II/Int. Math III Advanced Math None/MissingNo. of Students
414,903 450,928 470,891 502,874 502,501 * Note: Column percents may not add to 100 percent due to rounding.
Table 2.41 shows the percentage of students in key demographic groups who have not yet taken Algebra I (well below expectation at Grade 10) and the percentage that have taken courses beyond Algebra I (meets expectation at Grade 10). Students following the expected curriculum would be taking at least geometry by the 10th grade. There appears to have been a very dramatic drop in the percent of 10th graders who have not yet taken Algebra I for all groups, except students in special education. The percentage of students in special education who have not yet taken Algebra I dropped two percentage points to 16.2. Nearly two-thirds of the 10th graders had taken or were taking mathematics courses beyond Algebra I. For Asian students, 85 percent were taking courses beyond Algebra I. For most groups, the percent taking courses beyond Algebra I increased only modestly, if at all.
Page 64 Human Resources Research Organization (HumRRO)
Chapter 2: Results from the 2006–07 Administrations
Table 2.41. Trends in Math Courses Taken by Demographic Group Percent of 10th Graders Not Yet Taking Algebra I Percent of 10th Graders Taking Math Courses Beyond
Algebra I Class of Class of Class of Class of Class of Class of Class of Class of Class of Class of
Human Resources Research Organization (HumRRO) Page 65
Independent Evaluation of the CAHSEE: Fourth Biennial Report
Table 2.42 shows the CAHSEE mathematics passing rates for students at each course level. Passing rates dropped dramatically for students who had not yet taken Algebra I. There were many fewer students in the categories below Algebra I and those that remained had little success on the CAHSEE mathematics test. Passing rates rose for students in the Algebra I and higher level categories, in many cases back to the rates estimated for the Classes of 2006 and 2007.
Table 2.42. Initial Mathematics Passing Rates by Class and Highest Math Course Taken
Highest Math Class of Class of Class of Class of Course Taken 2006 2007 2008 2009
General Math 31.2% 31.0% 35.9% 17.0% Pre-Algebra 53.8% 54.8% 57.0% 34.3% Algebra I/Int. Math I 58.1% 57.5% 53.5% 59.0% Geometry/Int. Math II 87.2% 85.2% 81.3% 84.2% Algebra II/Int. Math III 95.3% 96.0% 91.9% 95.4% Advanced Math 99.4% 99.5% 96.4% 98.9% None/Missing 50.0% 41.2% 49.0% 35.4% No. of Students 414,903 450,928 470,891 502,501
School-Level Effects
A key question now being debated in the courts is whether schools vary significantly in their effectiveness in preparing students to pass the CAHSEE. It is, of course, difficult to separate school-level effects of curriculum and instruction from effects associated with differences in the type and preparation of students served by these schools. In this section, we first examine differences in passing rates for targeted groups of disadvantaged students by the density of these students within the school. Then we turn to statistical models to examine student, school, and district differences in CAHSEE passing rates and achievement gains over time while controlling for other variables in each of the three levels.
Difference in School-Level Passing Rates
In the past two annual evaluation reports (Wise, et al. 2005 and Wise, et al., 2006), we noted that low-income and racial ethnic minority students in schools with high density of such students had lower CAHSEE passing rates in comparison to low income and racial/ethnic minorities in schools with lower density of such students. In analyzing the 2006–07 CAHSEE results, we again looked at CAHSEE differences across school composition categories. We focused on five demographic groups with below-average CAHSEE passing rates among all 10th graders: Hispanic students, African American students, Low-SES students, English learners, and students with disabilities. For each group, we identified six school categories. The first included non-regular high schools such as alternative schools, continuation schools, community day schools, and juvenile
Page 66 Human Resources Research Organization (HumRRO)
Chapter 2: Results from the 2006–07 Administrations
or correctional facility schools. The other five groups were defined by sorting the remaining schools (high schools and K–12 schools) by the density of the target population and selecting cut points that put roughly equal numbers of schools into each of five density levels.
Table 2.43 shows the percentage of schools with very low (0–50%), low (> 50– 75%), moderate (>75–90%), and high (> 90%) ELA passing rates for minority or at-risk students in schools with different concentrations of minority or at-risk students. Passing rates were not computed for schools with fewer than 10 students in the targeted group and these schools were excluded. Table 2.40 shows the equivalent results for mathematics. With the possible exception of English Learners in general (who also have low passing rates), students in schools with high concentrations of at-risk students are far less likely to pass the CAHSEE.
Human Resources Research Organization (HumRRO) Page 67
Independent Evaluation of the CAHSEE: Fourth Biennial Report
Table 2.43. 2006 10th Grade ELA Passing Rates for Schools With Different Concentrations of Minority or At-Risk Students*
Results for Hispanic Students ELA Mathematics
School Density Category No. of Students 2006 2007 2006 2007 (Percent Hispanic) 2006 2007 Mean S.D. Mean S.D. Mean S.D. Mean S.D.
Figure 2.4e. Average scores for students with disabilities (SE) by percent of students with disabilities in the school. Note: The passing level is 350.
Further analyses of school-level differences in CAHSEE outcomes were organized around Raudenbush and Willms (1995)’s decomposition of school-level factors that influence student learning outcomes (in addition to student-level factors) into practice effects (factors that educators can control, e.g., leadership, organization, instructional skills) and context effects (uncontrollable factors, e.g., social environment, school composition). Parents are usually interested in the combinative effect of both practice and context. Lazear (2001) has shown that peer group effects (social spillover) are important in individual education process, even though they are unrelated to school practices. For an objective assessment of school effectiveness, it is important to detect the practice effect that explains variation in student achievement above and beyond the school context effect.
To further understand sources of school-level differences in CAHSEE outcomes, we used hierarchical linear modeling (Raudenbush & Bryk, 2002) that assumes test performance may be predicted by both student-level factors and school-level factors. We analyzed the annual data on about 500,000 10th graders across 2,475 public high schools. A total of 496,176 students met the qualifications for inclusion in this analysis, including 51.2% boys and 48.8% girls. The race/ethnicity distribution is: 32.3% white, 8.1% African American, 45.1% Hispanic, 8.8% Asian, and 5.7% other races.
First, variation in CAHSEE scores was divided into student-level (within school) and school-level (between school) components. The results shown in table 2.44 indicate that a significant proportion in the variation of student scores, nearly 30 percent, is accounted for by school-level differences.
Human Resources Research Organization (HumRRO) Page 71
Independent Evaluation of the CAHSEE: Fourth Biennial Report
Table 2.44. Variance Decompositions for 10th Graders’ CAHSEE Math and ELA Scores, March 2007
Within Schools Between Schools
Variance Percent Variance Percent
Math
ELA
1240.5
1137.9
70.6%
70.6%
516.0
474.8
29.4%
29.4%
Next, we introduced student-level variables to examine the within-school variance. Table 2.45 shows the results of these analyses. Overall, about 25 percent of the within-school variation in mathematics and 30 percent of the within-school variation in ELA scores was explained by the student characteristics analyzed. The remainder of the within-school variation is explained by factors not included in these analyses. For example, student motivation, prior preparation, and parental influence not related to the student characteristics analyzed likely explain much of the remaining variation.
Table 2.45. Regression Coefficients for Student Characteristics in Random Coefficients Model Analysis
Student Characteristics Math ELA Estimate SE Estimate SE
Eligible for free/reduced price lunch -5.76*** .11 -8.19*** .10
Female -3.92*** .09 7.60*** .08
Race/ethnicity
Black -21.97*** .19 -18.41*** .18
Hispanic -11.07*** .13 -10.08*** .12
Asian 17.29*** .19 4.52*** .17
English learners -25.42*** .14 -33.71*** .12
Students with disabilities -37.81*** .17 -35.89*** .15
Random Effects
Intercept 328.66*** 11.22 268.86*** 9.40
Residual 938.64*** 1.94 779.78*** 1.61
Model Statistics
N 472,352 471,771
% of within-schools variance explained 24.3% 31.5%
Note: *** p < .0001, ** p < .01, * p <.05.
Page 72 Human Resources Research Organization (HumRRO)
. …
. .
…
Chapter 2: Results from the 2006–07 Administrations
Finally, we examined school-level variables to understand their role in between-school variance. All of the variables analyzed were context variables, characteristics of the student-body (context effects). Together, these variables accounted for nearly 60 percent of the between-school variation in mathematics scores and 65 percent of the between-school variation in ELA scores. Relatively little of the between-school variation in CAHSEE outcomes is left to be explained by current differences in school practices.
The relatively modest impact of current school practices does not mean that school practices are not important. New practices, particularly those sensitive to the important influence of student and school context factors, could still change student outcomes dramatically.
Table 2.46. Regression Coefficients for School Characteristics in Conditional Means Model Analysis.
School Characteristics Math Estimate SE
ELA Estimate SE
Intercept 353.03*** 3.60 349.01*** 3.31 Percentage of students eligible for free/reduced price lunch -22.07*** 1.57 -22.66*** 1.42
Percentage of female students 23.68*** 2.42 35.74*** 2.21
Percentage of students by race/ethnicity
White 26.72*** 3.78 27.54*** 3.48
Black -13.21** 4.30 -5.46 3.94
Hispanic 12.79** 3.78 12.51** 3.47
Asian 96.77*** 4.96 69.72*** 4.51
Percentage of English learners -5.85 3.19 -17.77*** 2.89
Percentage of students with disabilities -33.94*** 2.04 -33.76*** 1.88
Model Statistics
Number of schools 2,398 2,398
% of between-schools variance explained 58.8% 64.5%
Note: *** p < .0001, ** p < .01, * p <.05.
Student Questionnaire Responses
In addition to analyzing CAHSEE test results, we examined responses to a student questionnaire administered to students at the end of each of the CAHSEE tests. The questions covered several important topics, including how students prepared for the CAHSEE, how topics on the test were covered in their courses, factors that may have prevented them from performing well on the tests, and their expectations for graduation and post-high-school plans. The questionnaire has been administered since
Human Resources Research Organization (HumRRO) Page 73
Independent Evaluation of the CAHSEE: Fourth Biennial Report
2001. Some significant changes were made to the questionnaire in 2005, so only results from the 2005 through 2007 administrations were analyzed this year.
The 2005–06 and 2006–07 CAHSEE administrations included 10th grade students taking the CAHSEE for the first time and also 11th and 12th grade students who had yet to pass the CAHSEE. The 2004–05 CAHSEE administrations included only 10th and 11th grade students. In analyzing the questionnaire responses, we focused on specific comparisons between the cohorts (classes of 2007 through 2009) based on the census testing of 10th graders in 2005 through 2007. Overall comparisons of responses for 10th graders are presented here. Relevant questions are analyzed further in Chapters 3 through 5.
Responses to question 1 shown in Table 2.47 suggest that teachers and counselors are increasingly emphasizing the importance of the CAHSEE.
Table 2.47. Student Responses: How Did You Prepare for This Test? 1. How did you prepare for this test?
ELA Percent Responding
Change 2005–
Math Percent Responding
Change 2005–
(Mark all that apply.) 2005 2006 2007 07 2005 2006 2007 07 A. A teacher or counselor told me about the purpose and importance of 29.1 30.9 34.4 5.3 26.7 28.2 31.6 4.9 the test. B. I practiced on questions similar to those on the test.
31.1 32.4 33.8 2.7 31.3 32.6 33.3 2.0
C. A teacher spent time in class helping me to get ready to take the 40.5 40.3 36.4 -4.1 26.5 26.3 24.3 -2.2 test. D. I took a special class during the regular school day that covered the n/a n/a 5.1 n/a n/a n/a 4.5 n/a topics on the CAHSEE E. I took a special class after school or during the summer that covered the n/a n/a 3.1 n/a n/a n/a 2.8 n/a topics on the CAHSEE F. I did not do anything in addition to regular course work to prepare for this 29.6 29.3 20.6 -9.0 37.7 37.2 37.3 -0.4 test.
Student ratings of the importance of the CAHSEE, shown in table 2.48, decreased somewhat from last year, but were up compared to 2005.
Table 2.48. Student Responses: How Important Is This Test for You? 2. How important is this test for ELA Percent Change Math Percent Change you? Responding 2005– Responding 2005–
2005 2006 2007 07 2005 2006 2007 07 A. Very important 75.5 90.2 78.4 2.9 74.8 89.9 78.5 3.7
20.6 7.3 17.8 -2.9B. Somewhat important 20.2 6.9 18.1 -2.1 C. Not important 4.4 2.9 3.5 -1.0 4.6 2.9 3.7 -0.9
Page 74 Human Resources Research Organization (HumRRO)
Chapter 2: Results from the 2006–07 Administrations
There were no changes in expectation for graduation, as shown in Table 2.49. Table 2.49. Student Responses: Do You Think You Will Graduate From High School?
3. Do you think you will graduate from high school?
ELA Percent Responding
2005 2006 2007
Change 2005–-
07
Math Percent Responding
2005 2006 2007
Change 2005–
07 A. Yes 88.7 86.0 88.7 0.0 87.9 84.9 87.9 0.0 B. No 1.4 1.4 1.3 -0.1 1.8 1.8 1.7 -0.1 C. Not sure 9.9 12.6 10.0 0.0 10.2 13.3 10.4 0.2
The question on reasons why a student might not graduate was changed in 2006 and again in 2007 as shown in Table 2.50. Overall, 63 percent of the students were confident of graduating after the ELA test and 60 percent after the mathematics test. Concern about passing the CAHSEE declined significantly from 2006 to 2007, although this could be due, in part, to changes in the response options.
Table 2.50. Student Responses: What Might Prevent You From Graduating? 4. What might prevent you from graduating? (Mark all that apply.)
ELA Percent Responding
Change 2005–
Math Percent Responding
Change 2005–
2005 2006 2007 07 2005 2006 2007 07 A. I may not pass all the required courses. n/a 25.1 19.7 n/a n/a 26.7 21.4 n/a
B. I may not pass the CAHSEE exam. n/a 38.4 20.6 n/a n/a 41.1 23.3 n/a
C. I may drop out before the end of 12th grade n/a 13.3 2.5 n/a n/a 11.8 2.8 n/a
D. I may not meet some other graduation requirement n/a 23.2 13.4 n/a n/a 20.4 12.6 n/a
E. I am confident I will graduate on time. n/a n/a 63.3 n/a n/a n/a 59.8 n/a
There were few changes in post-high school plans, as shown in Table 2.51.
Human Resources Research Organization (HumRRO) Page 75
Independent Evaluation of the CAHSEE: Fourth Biennial Report
Table 2.51. Student Responses: What Do You Think You Will Do After High School? 5. What do you think you will do after high school?
ELA Percent Responding
Change 2005–
Math Percent Responding
Change 2005–-
2005 2006 2007 07 2005 2006 2007 07 A. I will join the military. 5.0 4.9 4.1 -1.0 5.4 5.5 4.4 -1.0 B. I will go to a community college.
18.4 18.5 18.5 0.1 18.3 18.6 18.2 -0.1
C. I will go to a 4-year college or university. 55.9 54.8 53.8 -2.1 55.0 54.1 53.2 -1.8
D. I will go to a vocational, technical, or trade school. 4.0 3.7 3.5 -0.5 4.0 3.6 3.4 -0.6
E. I will work full-time. 3.5 3.9 3.6 0.1 3.7 4.0 3.8 0.0 F. I really don’t know what I will do after high school. 13.2 14.2 13.8 0.6 13.6 14.1 14.2 0.6
Note: Column percents do not add to 100 because of missing data.
Students were slightly less sure of their post-high school plans in 2007 compared to 2005, as shown in Table 2.52.
Table 2.52. Student Responses: How Sure Are You About What You Will Do After High School? 6. How sure are you about what you will do after high school?
ELA Percent Responding
Change 2005–
Math Percent Responding
Change 2005–
2005 2006 2007 07 2005 2006 2007 07 A. Very sure 43.4 40.3 41.1 -2.3 44.4 41.7 42.2 -2.2 B. Somewhat sure 44.2 47.4 46.8 2.6 42.9 46.3 45.5 2.6 C. Not sure at all 12.4 12.2 12.0 -0.4 12.7 12.1 12.2 -0.5
The proportion of students reporting that they did as well as they could on the CAHSEE increased for mathematics (recall that more have now taken Algebra I) and slightly for ELA, as shown in Table 2.53.
Table 2.53. Student Responses: How Well Did You Do On This Test? 7. How well did you do on this test? ELA Percent
Responding Change 2005 2006 2007 2005–07
A. I did as well as I could. 86.9 88.1 88.5 1.6 B. I did not do as well as I could have. 13.1 11.9 11.5 -1.6
Math Percent Responding
2005 2006 2007 Change 2005–07
81.0 83.7 85.4 4.4 19.0 16.3 14.5 -4.5
Of the students reporting that they did not do as well as they could, more cited nervousness, particularly after the mathematics test, as shown in Table 2.54. Also, fewer cited testing room conditions. Fewer students reported difficulty in remembering topics they had been taught after the mathematics test, but slightly more did after the ELA test.
Page 76 Human Resources Research Organization (HumRRO)
Chapter 2: Results from the 2006–07 Administrations
Table 2.54. Student Responses: What Reasons Prevented You From Doing As Well As You Could Have On This Test? Of those who answered B ELA Percent Math Percent to #7: Responding Responding 8. The main reasons I did not do as well on this test as I could have are (mark all that apply): 2005 2006 2007
Change 2005–07 2005 2006 2007
Change 2005–07
A. I was too nervous to do as well as I could. 28.1 28.3 32.2 4.1 21.6 23.4 28.6 7.0
B. I was not motivated to do well. 21.9 20.4 17.6 -4.3 16.8 16.8 16.1 -0.7
C. I did not have time to do as well as I could. 8.2 8.0 5.9 -2.3 5.1 5.4 5.3 0.2
D. Conditions in the testing room made it difficult to 18.5 18.3 12.0 -6.6 13.1 13.0 9.9 -3.2 concentrate. E. There are questions on this test that cover topics I was taught, but I did not 19.0 20.0 23.4 4.4 51.0 51.9 38.9 -12.1 remember how to answer them. F. There were other reasons why I did not do as well as I 41.0 43.6 30.2 -10.8 31.6 32.9 25.5 -6.2 could.
Slightly more students reported that most or all of the topics on the test were covered in courses they had taken, as shown in Table 2.55.
Table 2.55. Student Responses: Were The Topics on the Test Covered in Courses You Have Taken? 9. Were the topics on the test covered in courses you have taken?
ELA Percent Responding
2005 2006 2007 Change 2005–07
A. Yes, all of them. B. Most, but not all of them (two-thirds or more were
92.2 93.3 93.7 1.5
covered). C. Many topics on the test were not covered in my courses (less than two-thirds 7.7 6.7 6.3 -1.5
were covered).
Math Percent Responding Change
2005 2006 2007 2005–07 88.9 90.6 91.5 2.6
11.1 9.4 8.4 -2.7
More students reported that the questions on the CAHSEE mathematics test were similar to questions encountered in homework assignments and classroom tests, as shown in Table 2.56. Slightly more student reported that the ELA test questions were different from anything they had seen before.
Human Resources Research Organization (HumRRO) Page 77
Independent Evaluation of the CAHSEE: Fourth Biennial Report
Table 2.56. Student Responses: Were Any of the Questions on the Test Different From What You Have Encountered in Classes? 10. Were any of the questions on the test different from the types of questions or answer options you have encountered in your homework assignments or classroom tests?
ELA Percent Responding
2005 2006 2007 Change 2005–07
A. Yes, many were different from anything I had seen before. 9.3 11.9 11.4 2.1
B. Yes, a few were different from anything I had seen before. 49.5 48.9 47.8 -1.7
C. No, all were similar to ones used in my classes 41.2 39.1 40.7 -0.5
Math Percent Responding
Change 2005 2006 2007 2005–07
14.4 13.5 12.6 -1.8
51.0 49.2 47.2 -3.8
34.7 37.3 40.1 5.4
Fewer students reported that the CAHSEE test questions were more difficult than ones they were given on classroom tests or homework assignments as shown in Table 2.57.
Table 2.57. Student Responses: Were the Questions on the Test More Difficult Than Questions You Have Encountered in Classes? 11. Were the questions on this test more difficult than questions you were given in classroom tests or homework assignments?
A. Yes, the test questions were generally more difficult than the questions I encountered in my course work. B. The test questions were generally about as difficult as the questions I encountered in my course work. C. The test questions were generally easier than the questions I encountered in my course work.
Percent Responding
Change 2005 2006 2007 2005–07
17.5 16.3 16.5 -1.1
82.5 83.7 83.5 1.0
Percent Responding
Change 2005 2006 2007 2005–07
22.3 20.8 19.2 -3.1
77.7 79.2 80.7 3.0
Note. Test options changed across years.
As shown in Table 2.58, more students reported having forgotten topics on the ELA test. Also, slightly fewer said that topics on the mathematics test were not covered in courses they took.
Page 78 Human Resources Research Organization (HumRRO)
Chapter 2: Results from the 2006–07 Administrations
Table 2.58. Student Responses: If Some Topics on the Test Were Difficult for You, Was It Because…. 12. If some topics on the test were difficult for you, was it because:
ELA Percent Responding
2005 2006 2007 Change 2005–07
A. I did not take courses that covered these topics. 8.2 7.6 7.2 -1.0
B. I had trouble with these topics when they were covered in 18.1 17.5 17.2 -0.9 courses I took. C. I have forgotten things I was taught about these topics. 37.9 37.8 41.6 3.7
D. None of the topics was difficult for me. 35.8 37.1 33.3 -2.5
Math Percent Responding
Change 2005 2006 2007 2005–07
13.5 12.6 10.8 -2.7
22.6 23.8 21.9 -0.7
44.7 43.8 45.0 0.3
19.2 19.8 20.8 1.6
More students are reporting working harder in the courses they are taking to learn the ELA skills tested by the CAHSEE as shown in Table 2.59.
Table 2.59. Student Responses: Have You Worked … To Learn the English-language Arts Skills Tested by the CAHSEE? 13. Have you worked or will you work harder to learn the English-language arts skills tested by the CAHSEE? (Mark all that apply.)
Percent Responding
2005 2006 2007 Change
2005—07
Percent Responding
2005 2006 2007 Change
2005—07 A. I do not have to work any harder to meet the CAHSEE n/a 35.3 40.8 n/a n/a 39.1 39.0 n/a requirement. B. I am taking additional courses. n/a 3.9 6.2 n/a n/a 5.0 6.5 n/a
C. I am working harder in the courses I am taking. n/a 33.0 47.3 n/a n/a 39.9 46.3 n/a
D. I am getting help outside of the classroom. n/a 7.2 8.3 n/a n/a 9.4 8.0 n/a
E. I am repeating a course to learn the material better. n/a 3.9 5.3 n/a n/a 6.5 9.3 n/a
F. I will stay in school an additional year to learn the required material.
n/a n/a n/a n/a n/a 3.4 7.3 n/a
Almost none of the students responding reported that they would give up trying to get a diploma if they did not pass the CAHSEE, as shown in Table 2.60.
Human Resources Research Organization (HumRRO) Page 79
Independent Evaluation of the CAHSEE: Fourth Biennial Report
Table 2.60. Student Responses: If You Do Not Pass the CAHSEE in This Administration, What Are You Most Likely To Do? 14. If you do not pass the CAHSEE in this administration, what are you most likely to do? (Mark the most likely option.)
ELA Percent Responding
2005 2006 2007 Change 2005–07
Math Percent Responding
2005 2006 2007 Change 2005–07
A. I will stay in school and try to pass the CAHSEE again. n/a n/a 68.2 n/a n/a n/a 70.7 n/a
B. I will take courses at a community college and try to pass CAHSEE again.
n/a n/a 5.0 n/a n/a n/a 4.9 n/a
C. I will participate in some other type of program that will n/a n/a 9.4 n/a n/a n/a 8.2 n/a help me to pass the CAHSEE. D. I will try to get a GED certificate. n/a n/a 1.8 n/a n/a n/a 1.8 n/a
E. I will give up trying to get a diploma altogether. n/a n/a 1.1 n/a n/a n/a 1.3 n/a
F. I really do not know what I will do. n/a n/a 5.4 n/a n/a n/a 5.8 n/a
The last two questions, shown in Tables 2.61, were added to provide checks on efforts to match student records across years.
Table 2.61. Student Responses: Have You Passed Part of the CAHSEE Already, Prior to This Administration? 15. Have you passed part of the CAHSEE already, prior to this administration?
ELA Percent Responding
2005 2006 2007 Change 2005–07
Math Percent Responding
2005 2006 2007
Change 2005–07
A. Yes, I passed the English-language arts tests n/a n/a 7.9 n/a n/a n/a 9.1 n/a
B. Yes, I passed the mathematics test. n/a n/a 4.2 n/a n/a n/a 4.7 n/a
C. No, I have not passed either test. n/a n/a 87.6 n/a n/a n/a 85.9 n/a
Table 2.62. Student Responses: What Grade Were You In During the Past School Year? 16. What grade were you in ELA Percent Math Percent Change during the past school year? Responding Change Responding 2005–07
2005 2006 2007 2005–07 2005 2006 2007 A. 9th grade n/a n/a 64.6 n/a n/a n/a 62.8 n/a B. 10th grade n/a n/a 31.6 n/a n/a n/a 33.2 n/a C. 11th grade n/a n/a 1.3 n/a n/a n/a 1.4 n/a D. 12th grade n/a n/a 1.0 n/a n/a n/a 1.0 n/a E. Adult Education n/a n/a 0.5 n/a n/a n/a 0.5 n/a F. Some other grade or not in
n/a n/a 0.9 n/a n/a 0.9 n/aschool n/a
Page 80 Human Resources Research Organization (HumRRO)
Chapter 2: Results from the 2006–07 Administrations
Summary of Test Results
Test accuracy was satisfactory. Our analyses of CAHSEE test results for the 2006-07 school year began with a confirmation in the accuracy of the scoring and equating of the CAHSEE tests. Scorer agreement for the essays increased this year and met a reasonable standard (70 percent exact agreement with less than 0.5 percent differences by more than one score point). We replicated and confirmed ETS’ analyses of item response data and equating of scores from the March 2007 administration. In analyzing the accuracy of pass-fail decisions, we found that the zone of uncertainty for the ELA test had increased since the test was shortened, but that, for both ELA and mathematics, the proportion of students falling in this zone of uncertainty decreased significantly.
Last year’s seniors continued to test. Roughly 40 percent of students in the Class of 2006 who had not passed the CAHSEE by June of their senior year continued to take the CAHSEE. More than a quarter of those still testing completed the CAHSEE requirement this year.
Cumulative passing rates for seniors were unchanged. Cumulative passing rates for seniors in the Class of 2007 were the same as for the Class of 2006 (91.2 percent passing both parts) when all current seniors were counted. The rates were about 2 percentage points higher when this year’s repeat 12th graders were excluded. Passing rates for 12th graders continuing to test were closely related to the end-of-course test that they took in 11th grade and to their level of performance on that test. More students reported taking Algebra I. More of those who did not pass were older, English learners, African American or Hispanic, and low-SES compared to all 10th graders in 2005.
graders in the Class of 2008 decreased slightly compared to 11th grade passing rates for the Classes of 2006 and 2007 for all groups except Hispanic students and students with disabilities.
Passing rates for 10th graders were unchanged. Just over 65 percent of 10th
graders completed the CAHSEE requirement, the same as in the past two years. This year, we were able to identify about 2 percent of the current 10th graders that were repeating the 10th grade. Of these repeaters, only 21 percent met the CAHSEE requirement by the end of this year.
More students are taking Algebra I by 10th grade. The proportion of 10th graders who had not yet had Algebra I declined sharply for all demographic groups except students with disabilities.
School-level differences. We continued to find differences in CAHSEE outcomes for low-income and racial/ethnic minority students who were in schools with higher densities of low-income or racial/ethnic minority students. Overall, nearly two-thirds of
Human Resources Research Organization (HumRRO) Page 81
Independent Evaluation of the CAHSEE: Fourth Biennial Report
the variation in CAHSEE outcomes across schools was associated with school compensation factors.
Student questionnaire responses. Responses to the student questionnaire items by 10th graders are reported in this chapter. More specific analyses are reported in Chapters 4 and 5 in conjunction with more targeted analyses.
Page 82 Human Resources Research Organization (HumRRO)
Chapter 3: A Closer Look At Specific Populations
Chapter 3: A Closer Look At Specific Populations
Lauress L. Wise
Introduction
Over the past several years, the CAHSEE has posed a particularly significant barrier for two special populations of students—English learners (EL) and students with disabilities (SWD). In 2005 and 2006, we merged additional data on students in special education programs from the California Special Education Management Information System (CASEMIS) with CASHEE results. Our 2005 and 2006 annual reports included analyses providing descriptive information on students in this population and also analyses of differences by curriculum, services, and disability in the rates at which these students passed the CAHSEE. We conducted similar analyses again in 2007, the results of which are described later in this chapter.
Last year, we also conducted additional analyses of EL and of former EL who have been reclassified as having fluent English proficiency (RFEP). We examined CAHSEE 10th grade passing rates for EL with different home languages, in different curricular programs, and with varying amounts of time in US schools. One finding of particular significance was that roughly half of the 10th grade EL had been in US schools since kindergarten. This year we repeated these same analyses of EL students and also merged results from 2005 and 2006 administrations of the California English Language Development Test (CELDT).
In the fall, we will be conducting site visits at schools that appear to have particularly positive outcomes for both EL and SWD to identify potentially effective programs and practices. Results from this special study will be reported separately in December 2007.
This year we are also reporting additional analyses for students from low-income families and for racial/ethnic minorities, specifically African American and Hispanic students. The CAHSEE has presented a somewhat greater barrier for these students, as well as for English learners and students with disabilities, as evidenced by lower passing rates.
Results for English Learners
Our analyses of English learners focused on the 10th grade assessment, where all students participated; thus results are representative of a whole high school class. The passing rates for 10th grade EL students were 34.2 percent for the ELA test and 43.9 percent for the mathematics test. Analyses reported in this section are based on answer documents (test administrations). A few 10th grade students tested more than once and their EL status may have changed between administrations. Counting test administrations rather than students results in 2006 total counts that are slightly greater, leading to passing rates that are thus lower in comparison to the analyses based on
Human Resources Research Organization (HumRRO) Page 83
Independent Evaluation of the CAHSEE: Fourth Biennial Report
students reported in Chapter 2. On the other hand, denominators in this section are based on those tested rather than on estimates of the total number of students enrolled, since we do not have language fluency information on students who were not tested.
Table 3.1 shows the numbers of answer documents and the ELA and mathematics passing rates for EL and RFEP students in comparison to students who spoke English only or were initially fluent in English. Again, counts are based on answer documents, so students testing more than once during the 2005–06 school year are included multiple times. Nearly all 10th graders tested only once during the 2005–06 school year, but many 11th and 12th grade students tested multiple times. In addition, 11th and 12th grade students who did not take one of the tests but who were coded as having previously passed a test are counted as “pass” along with students who took the test and achieved a passing score.
Table 3.1. Number of Answer Documents and CAHSEE Passing Rates by Grade and Language Fluency
Grade
English Language Fluency
English-Language Arts Mathematics Number of Tests* Percent Passing Number of Tests* Percent Passing
2006 2007 2006 2007 2006 2007 2006 2007 10 English only
Initially fluent English learner Reclassified fluent
Unknown 2,160 3,018 40.2% 33.2% 2,430 3,418 36.0% 29.6% 12 English only
Initially fluent English learner Reclassified fluent
53,470 52,327 5,606 5,187
52,549 56,830 4,802 4,950
35.7% 29.3%39.1% 31.7%22.2% 18.0%40.6% 32.8%
70,187 69,940 7,401 6,973
40,622 41,708 7,486 8,047
29.3% 25.5% 33.4% 30.1% 24.4% 22.5% 37.1% 34.2%
Unknown 2,271 2,513 35.7% 27.6% 2,692 2,945 32.2% 26.9% * Note: Counts for each test exclude blank answer documents.
As in prior administrations, students who were reclassified as fluent in English had higher passing rates for both the ELA and mathematics tests than students who spoke English only or were initially fluent in English. Scoring well on the ELA test is not surprising since most had to pass a similar test to be reclassified. It is more noteworthy that RFEP students also had higher passing rates on the mathematics test. Eleventh and 12th grade students who were reclassified as fluent English proficient also had higher passing rates than any other group. As shown in Table 3.1, ELA and mathematics passing rates for EL students decreased by 1 or 2 percentage points at
Page 84 Human Resources Research Organization (HumRRO)
Chapter 3: A Closer Look At Specific Populations
each grade level except for the Grade 12 ELA passing rate, which dropped over 4 percentage points.
The remainder of the analyses of EL and RFEP students focuses on results from the census testing of 10th graders.
EL Enrollment Date
We examined the year of enrollment coded for English learners who tested as 10th graders in 2006. Instructions on the answer document ask for the date the EL student was first enrolled in a school in the United States or its territories, not necessarily in their current school. Table 3.2 shows the number of 10th grade EL students and their ELA and Math passing rates by number of years in US schools. This information is displayed graphically in Figures 3.1 (number of students) and 3.2 (CAHSEE passing rates).
Table 3.2. Number of 10th Grade EL Students and CAHSEE Passing Rates by Number of Years in US Schools
Number of Years in English-Language Arts Mathematics
Number Tested Percent Pass Number Tested Percent Pass US Schools 2006 2007 2006 2007 2006 2007 2006 2007
> 11 11,152 12,293 33.8% 30.7% 11,144 12,346 33.7% 32.1% *Note. The estimated grade level at which student enrolled in US schools is based upon normal grade progression assuming no
grade retention or skipped grade. This is a rough group-level estimate only. Students shown enrolled before 1995 (and some others) were likely to have been retained in grade one or more times. Students in the first row enrolled during the second half of the 2006–07 school year.
Human Resources Research Organization (HumRRO) Page 85
Independent Evaluation of the CAHSEE: Fourth Biennial Report
0
Freq
uenc
y
5,000
10,000
15,000
20,000
25,000
30,000
< 1 1 2 3 4 5 6 7 8 9 10 11 > 11
Years Since First Enrollment in U.S. Schools
2006 2007
Figure 3.1. Number of 10th Grade EL students by number of years enrolled in US schools.
0%
10%
20%
30%
40%
50%
60%
70%
Perc
ent P
assi
ng
< 1 1 2 3 4 5 6 7 8 9 10 11 > 11
Years Since First Enrollment in U.S. Schools
2006 ELA 2007 ELA 2006 Math 2007 Math
Figure 3.2. CAHSEE passing rates for 10th Grade EL students by number of years enrolled in US schools.
Many students enrolled early. It appears that a significant number of EL students have been enrolled for a considerable time, essentially since kindergarten. Tenth grade students in US schools for more than 10 years would mostly have been in US schools since kindergarten. Students enrolled more than 11 years, and some of the students enrolled for fewer years, most probably repeated one or more grades.
Page 86 Human Resources Research Organization (HumRRO)
Chapter 3: A Closer Look At Specific Populations
Students enrolled more than 11 years were struggling academically, as indicated by significantly lower passing rates. Figure 3.2 shows a similar dip in passing rates for students enrolled more than 11 years.
EL students did better on the math test than on the ELA test. For EL students enrolled for 8 or more years, ELA and math passing rates were virtually identical. For students who were more recently enrolled, passing rates were considerably lower on the ELA test. For students enrolled for 1 to 10 years, the math passing rates were essentially 50 percent or higher, while ELA passing rates dropped from above 40 percent for students enrolled more than four years to 22 percent for students enrolled only one year and 16 percent for students enrolled less than one year. Even for very recently enrolled students (2006), the math passing rate was above 40 percent, while the ELA passing rate was only 16 percent. Recently enrolled EL students clearly had difficulty with the CAHSEE ELA test, but less difficulty with the math test.
Recently enrolled students performed less well. Tenth grade students enrolled in the last six or seven years (since 2001) had significantly lower ELA passing rates (below 40%) compared to students who had been enrolled for longer periods. Students enrolled in the last two years (2005 or later) had passing rates below 30 percent and the passing rate for students first enrolled in 2006 was only 15 percent.
Home Language
The primary language of EL students was recorded on the CAHSEE answer documents. Table 3.3 shows the number of students and CAHSEE passing rates for different primary languages. Only languages with at least 250 10th grade students are shown; the remaining ones are grouped under “other.” We also combined two separately coded Chinese dialects (Mandarin and Cantonese) as passing rates for these two dialects were similar. Except for Other and English, the categories are ordered by their ELA passing rates. Figures 3.3 through 3.5 show the passing rates graphically.
There are many linguistic minorities, but most English learners speak Spanish. At least a dozen diverse languages were spoken by a substantial number (more than 300) of the 10th grade EL students. As shown by Figure 3.3, however, Spanish was by far the dominant language spoken in the homes of EL students. More than 80 percent of 10th grade EL students indicated Spanish as their home language. We do not exactly know what to make of the EL students who reported English as their primary language, except that their relatively low ELA passing rates did indicate potential difficulties with English.
Human Resources Research Organization (HumRRO) Page 87
Independent Evaluation of the CAHSEE: Fourth Biennial Report
Table 3.3. Number of 10th Grade EL Students and CAHSEE Passing Rates by Primary Language
English-Language Arts Mathematics Home No. of Students Percent Pass No. of Students Percent Pass
Figure 3.3. Number of 10th Grade EL students by home language.
Page 88 Human Resources Research Organization (HumRRO)
70%
60%
50%
40%
30%
20%
10%
0%
Per
cent
Pas
sing
ELA
Perc
ent P
assi
ng M
ath
Chapter 3: A Closer Look At Specific Populations
48%
42%
36% 37%
36% 39
% 44% 50
%
51% 53%
54%
54% 59
% 61%
47%
45%
33%
31%
43%
40%
38%
50% 54
%
52% 55
%
49%
58% 63
%
Other
English
Spanish
Khm
er Arab
ic
Punjabi
Hmong
Chinese
Armeni
an Farsi
Russian
Filipino
Vietnam
ese
2006 2007
Figure 3.4. ELA passing rates for 10th grade EL students by home language.
61% 63%
51%
50
%
43%
41% 48
%
49%
51%
61%
62% 64%
59% 61%
88%
88%
67%
63% 67
%66
%
67%
78%
62%
62%
83% 86% 95
%
95%
100%
90% 80%
70%
60% 50%
40%
30%
20% 10%
0%
Other
English
Spanish
Khm
er Arab
ic
Punjabi
Hmong
Armeni
an Fars
i
Russian
Filipino
Vietnam
ese
Chinese
2006 2007
Figure 3.5. Math passing rates for 10th grade EL students by home language.
Spanish speakers had the most difficulty with the CAHSEE tests among linguistic minorities. Tenth grade EL students whose home language was Spanish had the lowest passing rates on both the ELA and mathematics tests. EL students who spoke a more linguistically complex language (relative to English), such as Chinese, had some difficulty with the ELA test, but little difficulty with the mathematics test.
Human Resources Research Organization (HumRRO) Page 89
Korean
Korean
Independent Evaluation of the CAHSEE: Fourth Biennial Report
However, it could well be that differences in passing rates were due to differences in factors other than the language spoken, such as economic conditions or parent education levels.
English Language Development Program
The answer documents contained information about the programs to learn English in which EL students participated. Schools were asked to indicate the best description of the student’s program. The alternatives were:
� English language development (ELD) only � English language development plus Specially Designed Academic
Instruction in English (SDAIE) � ELD and SDAIE with primary language support (PLS) � ELD with other subjects taught in the student’s primary language � Some other English language program� No ELD program
Table 3.4 shows the number of answer documents for 10th grade students indicating each program type and the ELA and math passing rates for students coded in each of the program type categories.
Table 3.4. Number of 10th Grade EL Students and CAHSEE Passing Rates by Type of EL Program
EL
English-Language Arts Mathematics
Number of Tests Percent Passing Number of Tests Percent Passing Program 2006 2007 2006 2007 2006 2007 2006 2007
ELD only 10,488 10,239 39.2% 37.7% 10,440 10,192 44.8% 48.3% ELD+SDAIE 39,594 39,521 39.0% 36.1% 39,414 39,425 41.1% 45.7% ELD+SDAIE+PLS 7,558 8,550 22.7% 20.6% 7,532 8,510 37.3% 40.1% ELD+Other subjects in primary language 2,270 1,845 13.9% 10.2% 2,253 1,841 39.0% 38.7% Other EL program 7,523 8,428 40.8% 42.9% 7,492 8,401 41.6% 48.1% None 5,698 6,103 50.7% 47.1% 5,667 6,121 46.6% 51.8% Not indicated 11,933 10,783 45.2% 44.4% 11,927 10,831 41.5% 50.1% Total 79,366 79,366 37.8% 35.9% 79,058 79,200 47.0% 46.1%
Students receiving instruction in their primary language had the lowest ELA passing rates, but their mathematics passing rates were not lower. It is, of course, not appropriate to attribute outcome differences to the program of instruction alone, without controlling for important differences in the students participating in the program. It is likely, for example, that students receiving primary language support in English language development and in other subjects were the ones having the most difficulty in English to begin with, or those newest to the system. Similarly, students with no indicated program had the highest ELA passing rates, not because no instruction was better than some but more likely because they did not need as much assistance in learning English.
Page 90 Human Resources Research Organization (HumRRO)
Chapter 3: A Closer Look At Specific Populations
Other Programs
Table 3.5 shows the number of EL students participating in other educational programs, including migrant and Indian education, programs for the gifted, and Title I.
Table 3.5. Number of 10th Grade EL Students and CAHSEE Passing Rates by Type of Program
English-Language Arts Mathematics Special Number of Tests Percent Passing Number of Tests Percent Passing
More than half of the students participated in Title I and their passing rates were about the same as the rates for 10th grade EL students in general. Students who participated in migrant education programs had slightly lower ELA passing rates, but slightly higher math passing rates. Not surprisingly, students in gifted programs had much higher passing rates, but only about 1 percent of all EL students were in these programs.
EL Accommodations
Beginning with the 2005–06 administrations, CAHSEE answer documents included new information on accommodations provided to EL students in taking the CAHSEE. Table 3.6 shows the frequency with which various EL accommodations were used and CAHSEE passing rates for student receiving each of these accommodations. As described in the Test Coordinator’s Manual, the four types of accommodations offered specifically to EL students were:
• Hear the test directions printed in the test administration manual translated into the student’s primary language
• Additional supervised breaks within a testing day or within a test part (separately timed section)
• Have the opportunity to be tested separately with other ELs provided that the student is directly supervised by an employee of the school
• Access to translation glossaries/work lists, not including definitions or formulas
Students requiring EL accommodations had lower ELA passing rates compared to other EL students, but nearly the same passing rates for mathematics. EL accommodations were indicated for a relatively small proportion of the 10th grade EL students taking the CAHSEE. Those that did receive accommodations had relatively low ELA passing rates, ranging from 15 percent to 25 percent, even with the accommodation. In all cases but Directions in Primary Language, the mathematics passing rates were above 40 percent.
Human Resources Research Organization (HumRRO) Page 91
Independent Evaluation of the CAHSEE: Fourth Biennial Report
Table 3.6. Number of 10th Grade EL Students and CAHSEE Passing Rates Receiving EL Accommodations
Special English-Language Arts Mathematics Programs Number of Tests Percent Passing Number of Tests Percent Passing
Table 3.7 compares characteristics of students who were enrolled as English learners within the past 7 years and students who have been enrolled for more than 7 years. Students more recently enrolled were slightly less likely to be Hispanic and more likely to be Asian or White, non-Hispanic. Students enrolled for more than 7 years were somewhat more likely to be economically disadvantaged (80% compared to 76%) and decidedly more likely to be enrolled in special education programs (20% compared to 6%) and to be coded as having a Specific Learning Disability. Finally, more recently enrolled EL students were more likely to be receiving primary language support, while earlier enrollees were more likely to be in SDAIE programs or to be receiving other EL services.
Page 92 Human Resources Research Organization (HumRRO)
Chapter 3: A Closer Look At Specific Populations
Table 3.7. Characteristics of Students with Recent and Earlier EL Enrollment Dates
Characteristic
Enrolled in the Last 7 Years
Enrolled More than 7 Years
Difference in Percents
2006 2007 2006 2007 2006 2007 Number of Students 35,808 31,959 55,792 54,299 N/A N/A
Gender and Race/Ethnicity Male 54.0% 54.1% 55.8% 56.7% 1.8% 2.6%
Economically Disadvantaged or in Special Education Programs Economically Disadvantaged 75.7% 75.7% 79.8% 80.7% 4.1% 5.0% Special Education 6.1% 5.3% 19.6% 19.4% 13.5% 14.1% Specific Learning Disability 3.7% 3.4% 14.9% 15.0% 11.2% 11.6%
English Learner Program
SDAIE (2) 44.4% 45.3% 55.1% 58.1% 10.7% 12.8% EL+SDAIE with prim. lang. support (3) 17.5% 20.6% 4.6% 6.4% -12.9% -14.2% EL+Acad. support in primary lang (4) 5.8% 6.1% 0.8% 0.5% -5.0% -5.5%
Other EL services (5) 6.7% 7.7% 11.2% 13.3% 4.5% 5.7% No EL program participation (6) 5.1% 6.8% 9.8% 9.2% 4.7% 2.4%
Results for Reclassified Fluent English Proficient Students
Next we examined results for 10th grade students who had been reclassified as having fluent English proficiency (RFEP). More extensive analyses of results for RFEP students were included in the 2006 evaluation report (Wise, et al., 2006). Several of the variables analyzed last year, such as English language development program or accommodations, were largely missing or inapplicable for RFEP students this year; hence analyses of these variables are not repeated here.
Human Resources Research Organization (HumRRO) Page 93
Independent Evaluation of the CAHSEE: Fourth Biennial Report
Reclassification Date
We examined the year of reclassification for RFEP students. Table 3.8 shows the number of 10th grade EL students and their ELA and mathematics passing rates for each year of enrollment. This information is displayed graphically in Figures 3.6 (number of students) and 3.7 (CAHSEE passing rates). Reclassification dates span a range from 1995 (kindergarten for most of these 10th graders) through the present. A decided dip in the number of students reclassified in 2002 may have been related to the introduction of new reclassification policies based on the California English Language Development Test (CELDT).
Reclassified students did slightly better on the ELA test than on the math test. Similar to students in general, RFEP students had higher passing rates on the ELA test than on the math test. Passing rates for RFEP students were considerably higher than the passing rates for EL students, particularly on the ELA test.
Table 3.8. Number of RFEP Students and CAHSEE Passing Rates by Year of Reclassification
Estimated English-Language Arts Mathematics Grade at Reclass- Number Tested Percent Pass Number Tested Percent Pass ification* 2006 2007 2006 2007 2006 2007 2006 2007
10.5 581 354 77.5% 81.1% 585 352 71.6% 75.3% *Note. Estimated grade level is based upon normal grade progression and 10th grade status in 2005–2006, assuming no grade retention or skipped grade. This is a rough group-level estimate only and does not take into account month of reclassification.
Page 94 Human Resources Research Organization (HumRRO)
Chapter 3: A Closer Look At Specific Populations
0
2,000
4,000
6,000
8,000
10,000
12,000 Fr
eque
ncy
< K K 1 2 3 4 5 6 7 8 9 10 10.5
Estimated Grade at Reclassification
2006 2007
Figure 3.6. Number of 10th grade RFEP students by estimated grade at reclassification.
0%
20%
40%
60%
80%
100%
Per
cent
Pas
sing
< K K 1 2 3 4 5 6 7 8 9 10 10.5
Estimated Grade at Reclassification
ELA 2006 ELA 2007 Math 2006 Math 2007
Figure 3.7. CAHSEE passing rates for 10th grade RFEP students by estimated grade at reclassification.
Recently reclassified students performed less well. Tenth grade students reclassified in 9th and particularly 10th grade had lower ELA passing rates (below 85%) compared to students who had been enrolled for longer periods (above 90%). Passing
Human Resources Research Organization (HumRRO) Page 95
Independent Evaluation of the CAHSEE: Fourth Biennial Report
rates for students reclassified after 6th grade (fewer than 4 years ago) are lower for both subjects than the passing rates for students reclassified during or before 6th grade.
CELDT Scores for EL and RFEP Students
We obtained scores from the 2005 and 2006 administrations of the California English Language Development Test (CELDT) for students in grades 8 through 11 and merged these data with results from the 2007 CAHSEE administrations. Table 3.9 shows the number of matching records by grade and language fluency. Matches were found for over 80 percent of the CAHSEE 10th graders.
Table 3.9. Number of 2007 CAHSEE Examinees With Matching CELDT Records Number of Matched Records
Grade EL RFEP Other 10 67,745 19,636 4,402 11 45,755 4,649 2,258 12 30,851 1,627 1,541 AE 709 22 56 U 699 136 45
TOTAL 145,759 26,070 8,302
Five performance levels are defined for the CELDT. Districts may base the decision to reclassify an EL student as proficient in English (RFEP), in part, on whether students score at the 4th or 5th performance level. Table 3.10 shows ELA passing rates for 10th grade EL and RFEP students by their 2005 or 2006 CELDT performance level. As can be seen, CELDT scores are highly predictive of the ability to pass the CAHSEE ELA test.
Table 3.10. ELA Passing Rates by CELDT Performance Level CELDT EL Students RFEP Students
Performance Level N % Pass N % Pass
1 5,347 7.8% 51 45.1%
2 5,544 11.0% 55 30.9%
3 18,445 19.1% 369 45.8%
4 25,444 45.8% 5,511 73.2%
5 7,334 71.3% 3,998 89.4%
Missing 5,631 30.7% 9,652 80.8% Total 67745 34.2% 19636 79.5%
Page 96 Human Resources Research Organization (HumRRO)
Chapter 3: A Closer Look At Specific Populations
Results for Students in Special Education Programs
One of the most vexing problems for the CAHSEE has been the low passing rate for students with disabilities. As noted in Chapter 1, prior evaluation reports have highlighted particular difficulties in meeting the CAHSEE requirement faced by students in special education programs. We have several times recommended consideration of alternatives for these students. In 2004, the California legislature passed Senate Bill (SB) 964, calling for a panel to identify options or alternatives for students in special education program and requiring a contractor to support the work of this panel and report on options that are identified.
Pursuant to requirements of SB 964, a report was submitted to the California legislature in Spring 2005 recommending alternative graduation assessments and requirements for students receiving special education services (Rabinowitz, Crane, Ananda, Vasudeva, Youtsey, Schimozato, & Schwager, April 2005). The SB 964 report identified three types of options for students receiving special education services.
1. Options for alternate forms of testing ensure that students receiving special education services have adequate opportunities to demonstrate what they know and can do.
2. Options for modifying the CAHSEE requirement: The main recommendation in this area, to defer the requirement for students receiving special education services, is based on the premise that instructional opportunities have not been adequate to provide sufficient opportunity for students receiving special education services to learn the required material. The deferral is also recommended to allow time to develop alternative requirements, such as coursework, that special education students might pass in order to receive a diploma.
3. The report offers options for alternative types of diplomas for students who are not able to demonstrate full mastery of the CAHSEE standards.
Subsequent to the SB 964 report, the legislature did vote to delay the CAHSEE requirements for students with disabilities for the Class of 2006 and then for the Class of 2007, providing other criteria were met. Last year, the legislature also passed a requirement that the Superintendent, with agreement from the State Board of Education, recommend appropriate application of the CAHSEE requirement for students with disabilities. The Superintendent recommended strengthening waivers for students with disabilities who achieve a score equivalent to passing with a required test modification. Unless there is further legislative intervention, students with disability in the Class of 2008 will be required to meet the CAHSEE requirement.
Our 2005 and 2006 CAHSEE evaluation reports described efforts to investigate characteristics of students with disability and the types of services that they received in relation to success in passing the CAHSEE (Wise, et al., 2005b, Chapter 7; Wise et al., 2006, Chapter 3). The primary results from these investigations were:
1. Nearly half of the students in special education programs receive relatively non-intensive services (e.g., in-class accommodations, resource specialists)
Human Resources Research Organization (HumRRO) Page 97
Independent Evaluation of the CAHSEE: Fourth Biennial Report
and participate in the regular curriculum 80 percent of the time or more. About half of these students pass the CAHSEE on the first try and, perhaps with additional time and resources, the others are capable of passing and should be held to the CAHSEE requirement.
2. About one quarter of the students in special education programs require more intensive assistance (e.g., special day programs) and spend less than 50 percent of their time in regular instruction. Very few of these students are able to pass the CAHSEE. Other goals may be more appropriate for these students. It is worth noting, however, that 10 percent of the students in this category do pass the CAHSEE, so expectations for meeting the CAHSEE requirement should not lightly be abandoned.
Efforts to match additional data on special education students to their CAHSEE results were repeated in 2007. The approach, analyses, and, for the most part, results parallel what was reported last year.
Supplemental Data on Students Receiving Special Education Services
A first step in our analysis was to gather and analyze more information on differences in special education services and the degree to which students receiving these various services are having difficulty passing the CAHSEE. To this end, CDE again provided data from the California Special Education Management Information System (CASEMIS). The December 2006 CASEMIS data included several significant changes in variables and codes. For example, the services received by each student were provided in a separate file (table) with varying numbers of records per student rather than being stored in multiple fields, most of which were blank, in each student’s record.
The common statewide student identifier (SSID) was not provided with the CASEMIS data. Several passes were required to match the CASEMIS and CAHSEE files using school code, name, birth date, sex, special education status, and English learner status. In the first pass, we matched all of the CASEMIS data (including grade levels) to all of the CAHSEE results for a given grade (including students not flagged as special education). We used a relatively strict criterion in accepting matches to minimize the number of false matches. In subsequent passes, the unmatched cases were limited to those for which a match should exist. For the CASEMIS, this meant only unmatched cases in the target grade. For the CAHSEE, we used only unmatched cases flagged as special education students. We used a less strict criterion for accepting matches to reduce the number of false non-matches.
Table 3.11 shows the number of records from the December 2006 CASEMIS data that were matched to the 2006–07 CAHSEE 10th grade, 11thgrade, and 12th grade results. Overall, we were able to match 86 percent of the 10th grade CASEMIS records to CAHSEE records—a 1 percentage point increase over the matching rate reached last year. In a relatively small number of cases, these students were shown as 11th graders
Page 98 Human Resources Research Organization (HumRRO)
Chapter 3: A Closer Look At Specific Populations
at the time of the CAHSEE administration several months later. The match rates were lower for 11th and 12th grade students in the CASEMIS file (68% and 53% respectively). This is not surprising, since many 11th and 12th grade students had already passed the CAHSEE previously and did not participate in the 2006–07 CAHSEE testing. Again, the grade level shown on the CAHSEE test records was sometimes different from the grade level on the CASEMIS records. Where they were different, we used the grade shown at the time of CAHSEE testing in our analyses.
Table 3.11. Number of Students in the Matched CAHSEE-CASEMIS Files by Grade on Each File Grade on CAHSEE File Grade According to December 2006 CASEMIS File
(Winter/Spring 2007) 9* 10 11 12 Post-12 Total
Original number of CASEMIS records 53,408 50,541 46,720 43,954 861 195,484
Total records matched 1,802 43,417 31,924 23,054 41 100,238 Percent of CASEMIS records matched 3.4% 85.9% 68.3% 52.5% 4.8% 51.3% * Note. When matched, these were 9th grade students in the CASEMIS data file who were 10th graders in the CAHSEE data file.
Passing Rates for Students Receiving Different Special Education Services
We examined a number of variables describing the nature and extent of special education services provided and some characteristics of the students receiving these services. The first variable indicated the percentage of time during the day that the student was in the general education class6. Figure 3.8 shows a plot of the percentage of students with each value of the time-in-class variable that passed both parts of the CAHSEE. The plot shows results for all students as well as separate results for students with specific learning disabilities, the most common primary disability code.
From 40 up to 100 percent time in regular classroom instruction, there is a very linear relationship between percent of time in instruction and percent passing the CAHSEE. From 20 to 40 percent time, the curve is flat due to a strong floor effect – virtually none of the students in this range passed both parts of the CAHSEE. Below 20 percent time in regular instruction, however, there is a negative relationship with percent passing the CAHSEE. It is not the case that these are students with different disabilities, as the same relationship is found for students with specific learning disabilities as for all
6 Previously, this variable was coded as the percentage of time the student spent outside the regular classroom. Consequently, our analyses of this variable are reversed from those reported in 2006.
Human Resources Research Organization (HumRRO) Page 99
Independent Evaluation of the CAHSEE: Fourth Biennial Report
students with disabilities. Apparently, many of these students are receiving alternative instruction that helps them to pass the CAHSEE.
0
10
20
30
40
50
0 20 40 60 80 100
Perc
ent P
assi
ng th
e C
AH
SEE
Percent of Time in Regular Class
(All) ( )Percent Pass Percent Pass SLD
Figure 3.8. Percent of students passing both parts of the CAHSEE by percent of time in regular class instruction for all students with disabilities and for students with specific learning disabilities (SLD).
Table 3.12 shows comparisons to the number and percent passing for 10th grade students in 2005 through 2007 based on the time they were away from the regular classroom. Roughly 40 percent (15,560 of 38,936) of students receiving special education services are able to spend at least 80 percent of their day in regular instruction. Nearly half of these students passed the CAHSEE ELA requirement in the 10th grade and over 45 percent passed the mathematics requirement. Except at the extreme, CAHSEE passing rates declined as students spent more time outside of regular instruction. Less than 10 percent of students who are in regular instruction at least 10 percent but less than 50 percent of the time were able to pass the ELA requirement and even fewer passed the mathematics requirement. As shown below, students who participated in regular instruction less than half of the time were likely to be receiving different types of services. Some of these students may have participated in an alternate curriculum that was as rigorous as the regular curriculum.
Page 100 Human Resources Research Organization (HumRRO)
Chapter 3: A Closer Look At Specific Populations
Table 3.12. Number of 10th Grade Students and Percent Passing by Time Away from Regular Instruction (2005 and 2006 Students with CASEMIS Data) Percent of Time Away from Regular Class (2005)
with 37,604 38,243 38,936 31.5% 32.4% 31.4% 29.0% 28.7% 29.9%
Note. This question was reversed in the December 2006 file. Here the percents in regular instruction have been mapped back into the prior reporting categories.
Table 3.13 shows the primary disability codes for which a significant of portion of students (at least 30 percent) spent less than 20 percent of their time in regular classroom instruction. For each disability code, Table 3.13 shows the total number of students with that disability code and the percent of those students who spend less than 20 percent time in regular instruction. For each of the two CAHSEE tests, Table 3.13 also shows the percent of students spending less than 20 percent time in regular instruction who: (a) do not take the test, (b) take and pass the test, and (c) take the test with a modification and earn a score of 350 or better, qualifying them for a waiver.
More than 80 percent of the students with primary disability codes indicating deafness or emotional disturbance who are in regular instruction classes less than 20 percent time take the CAHSEE. Over 20 percent of these students pass the mathematics test. Deaf students have greater trouble with the ELA test; only about 10 percent pass. At the other extreme are students with primary disability codes indicating mental retardation. Nearly half of these students participate in regular instruction less than 20 percent time. Nearly 90 percent of these students who do not receive much regular classroom instruction do not even take the CAHSEE. Less than 1 percent of this group passes each of the tests. One other noteworthy result shown in Table 3.13 is that fewer than 1 percent of the students with these disability codes who participate less than 20 percent in regular instruction are able to earn a passing score using a test modification.
Table 3.14 shows the primary disability codes of a significant number of students (again more than 30 percent) with disabilities who receive regular classroom instruction at least 80 percent of the time. Nearly 33,000 of these students (three quarters of the roughly 43,000 10th grade students for whom data are available) are included in these
Human Resources Research Organization (HumRRO) Page 101
Independent Evaluation of the CAHSEE: Fourth Biennial Report
disability groups and 43 percent of these student are in regular classroom instruction 80 percent or more of the time. Nearly all of the students in regular instruction take each of the CAHSEE tests. With the exception of Specific Learning Disabilities, well over half of the students in each disability group pass each of the CAHSEE tests. When modification waivers are included, roughly 40 percent of the students with specific learning disabilities pass each of the CAHSEE tests. A significant portion of these students (3%) takes advantage of a test modification (most often, use of a calculator) to meet the mathematics requirement. Except for students with visual impairment, relatively few use a modification to meet the ELA requirement.
Table 3.13. Testing and Passing Rates for Students in Regular Classroom Instruction Less than 20 Percent of Time by Primary Disability*
*Note: Limited to disabilities where at least 30 percent of the students are in regular classroom instruction less than 20 percent of the time.
Next we examined the services received by students with disabilities who did and who did not participate in regular classroom instruction. Table 3.15 shows the most common services received by students who spent less then 20 percent time in regular instruction for each of the primary disability groups where this was common (i.e., at least 30 percent were in regular instruction less than 20 percent time). Statistics are shown for services received by at least 5 percent (and at least a total of 50 students in our data file) in each disability category. With the exception of autism, the services received were relatively unrelated to CAHSEE participation and passing rates. Autistic students receiving counseling, participated and passed at considerably higher rates than autistic students who received other services. This result likely indicates that students who received counseling had a less severe disability. Counseling would not necessarily have helped the 95 percent of the autistic students who did not receive this service.
Page 102 Human Resources Research Organization (HumRRO)
Chapter 3: A Closer Look At Specific Populations
Table 3.14. Testing and Passing Rates for Students in Regular Classroom Instruction at Least 80 Percent of Time by Primary Disability*
Percent ELA Math
Primary Disability Total
Students
In Class 80–
100% Time
Pct. Not
Testing
Pct. Pass,
No Mod
Pct. Pass With
a Mod
Pct. Not
Testing
Pct. Pass,
No Mod
Pct. Pass
With a Mod
020 Hard of Hearing 435 51.3% 2.2% 61.9% 0.0% 2.2% 64.6% 1.3% 040 Speech
* Note: Limited to disabilities where at least 30 percent of the students are in regular classroom instruction at least 80 percent of the time.
Table 3.16 shows similar statistics for students with disability who participated in regular instruction most of the time (at least 80 percent). Again, students in each disability category receiving different services did not have very different CAHSEE participation and passing rates. Where there were some differences (e.g., hard of hearing students receiving audio services or students with speech impairment who receive speech and language services), higher outcomes may have been associated with less severe disabilities. This is not to say that the services provided did not help the students who received them, only that more carefully controlled studies are needed to gauge the true impact of these services.
Human Resources Research Organization (HumRRO) Page 103
Independent Evaluation of the CAHSEE: Fourth Biennial Report
Table 3.15. Testing and Passing Rates for Students in Regular Classroom Instruction Less than 20 Percent of Time by Primary Disability* and Service
* Limited to disabilities where at least 30 percent of the students are in regular classroom instruction less than 20 percent of the time.
** Limited to services received by at least 5 percent (and at least 50) of the students in the primary disability group who are in the regular classroom less than 20 percent of the time.
*** Many students received multiple services and are included in more than one row under their primary disability code.
Page 104 Human Resources Research Organization (HumRRO)
Chapter 3: A Closer Look At Specific Populations
Table 3.16. Testing and Passing Rates for Students in Regular Classroom Instruction at Least 80 Percent of the Time by Primary Disability* and Service
* Note: Limited to disabilities where at least 30 percent of the students are in regular classroom instruction at least 80 percent of the time.
** Limited to services received by at least 5 percent (and at least 50) of the students in the primary disability group who are in the regular classroom at least 80 percent of the time.
*** Many students received multiple services and are included in more than one row under their primary disability code.
Results for Students Receiving Special Education Services Who Retested in 11th
We also matched 11th and 12th grade students in the December 2005 CASEMIS file with CAHSEE results from the 2006–07 administrations. In 2007, as in 2005 and 2006, we had CASEMIS information and CAHSEE data from the student’s initial attempt in the 10th grade and retest(s) in the 11th grade for more than 20,000 students. We also had CASEMIS data and CAHSEE test for 12th grade students in 2006 and 2007, but chose not to analyze score gains for these students because of the exclusion of students with disabilities who received an exemption from the CAHSEE requirement in these years.
Human Resources Research Organization (HumRRO) Page 105
Independent Evaluation of the CAHSEE: Fourth Biennial Report
Table 3.17 shows the average prior-year score and retest gain score for students by the percent of time students were away from regular instruction during the day7. The prior-year scores indicate how close they were to passing in the prior year (usually 10th
grade) and the gain scores indicate how much they learned in the current year. As with 10th grade passing rates, students who were away from regular instruction over half of the time had initial scores that were considerably lower than those of students who were away from regular instruction less than 20 percent of the time and also showed considerably smaller gains.
Average gains for students receiving regular instruction were about half of the difference between the 10th grade mean and the score needed to pass (350). With another year of similar gains, the average for these students would be very near the passing level. For students mostly outside of regular instruction, however, it would take three or four years of similar gains for the average to reach the passing level, so that roughly half of the students in this category would pass.
7 In the December 2006 CASEMIS file, the question was reversed to ask for the percent of time the student was in regular classroom instruction. The 2006 variable was reversed in these analyses for comparability with prior results.
Page 106 Human Resources Research Organization (HumRRO)
Chapter 3: A Closer Look At Specific Populations
Table 3.17. Number of Students, Average Prior Year (Grade 10) Scores, and Average Score Gain by Time Away from Regular Instruction for 11th Grade Students Taking the CAHSEE in 2005 through 2007 Percent of Number of Matched Students Average Prior Year Score
Time* (How Close to Passing) Average Gain Away from 2005 2006 2007 2004 2005 2006 2005 2006 2007
Note. Numbers differ for the ELA and mathematics tests because some students took only one of the tests. For all matched students, the standard deviations of the prior year scores and the gains are shown in the last row of each section. * For 2007, the variable indicating time spent in regular instruction was reversed to match analyses from the 2005 and 2006
assessments where this question coded differently.
Tables 3.18 shows average score gains for students receiving little and considerable classroom instruction by primary disability code. Very few students with mental retardation took the CAHSEE as 11th graders and those who did showed no score gain. Students whose primary disability group was deafness had only small gains on the ELA test, but larger gains on the mathematics test. All other disability categories showed significant gains on both tests. Gains were larger for students receiving regular instruction with the one exception that students in the emotional disturbance category who received little regular instruction showed slightly larger gains than those who received considerable regular instruction.
Human Resources Research Organization (HumRRO) Page 107
Independent Evaluation of the CAHSEE: Fourth Biennial Report
Table 3.18. Average 2007 Score Gains for 11th Grade Students with Low and High Participation in Regular Classroom Instruction by Primary Disability Code
ELA Mathematics Average Average
Disability N Gain N Gain Students Spending 10 Percent or Less Time in Regular Instruction
The CAHSEE allows a number of accommodations for students who need them. In addition, some students take the CAHSEE with modifications specified in their IEPs, even though these modifications invalidate their scores. Students who test with modifications and score at or above the passing level are allowed to petition for a waiver from the CAHSEE requirement. Tables 3.19 and 3.20 list the various accommodations and modifications recorded for the CAHSEE ELA and mathematics tests. Each table shows the number of 10th, 11th, and 12th grade students receiving each type of accommodation or modification and the percentage of these students who score 350 or better on the corresponding CAHSEE test.
For ELA, the most frequent accommodation was supervised break and the most frequent modification was oral presentation. Very few students received any of the other testing accommodations or modifications. For mathematics, supervised break was also the most frequent accommodation, followed by oral presentation, and use of a calculator the most frequent modification. For both tests, passing rates for students receiving supervised breaks were low. It does not appear that accommodations are being overused or that they provide an unfair advantage from the students who need them.
Page 108 Human Resources Research Organization (HumRRO)
Chapter 3: A Closer Look At Specific Populations
Table 3.19. Frequency of Accommodations and Modifications and Percent Scoring 350 or More – ELA
Test Year 10 11 12 10 11 12
ions
Accommodation or Modification No. of Students* % Scoring > 349
* Note: Students who received more than one accommodation were included in multiple rows.
One point of note is that the number of students who took each of the tests with a modification was much higher for 11th and 12th graders than for 10th graders, both in 2006 and in 2007. This may reflect a desire to try to pass the exam without having to resort to a waiver, but it may also be related to NCLB participation requirements. Students taking a test with modifications are not counted toward the 95 percent participation requirement. It is worth asking whether NCLB requirements lead to students failing to get testing modifications called for in their IEPs. California has
Page 110 Human Resources Research Organization (HumRRO)
Chapter 3: A Closer Look At Specific Populations
proposed to allow modifications with a score adjustment for school accountability. This would reduce any motivation to discourage students from using a required testing modification. So far, however, the US Department of Education has not accepted this proposal.
CST Scores
As described in Chapter 2, we merged 2005 and 2006 results on the California Standards Tests (CSTs) with the 2007 CAHSEE results. Table 3.21 shows the number of 10th grade students in special education programs who took the two most common CSTs for each subject. It also shows the number and percent at each performance level for the CST and the percent of students at each CST performance level who passed both parts of the CAHSEE in the 10th grade.
Table 3.21. Frequency and Percent of SWD Passing the CAHSEE ELA Test in 2007 by 2006 ELA CST Performance Level – 10th Graders in Special Education Programs
Grade 9 CST in 2006 Grade 10 CST in 2006 Percent Percent
Pass Pass ELA Percent CAHSEE Percent CAHSEE
CST Level N at Level in 2007 N at Level in 2007 1. Far Below
Basic 12,170 36.4% 4.7% 745 68.9% 5.0%
2. Below Basic 10,597 31.7% 12.9% 269 24.9% 7.8%
3. Basic 6,814 20.4% 41.6% 55 5.1% 25.5%
4. Proficient 2,426 7.3% 78.4% 12 1.1% 25.0%
5. Advanced 1,394 4.2% 92.3% 1 0.1% N/A
Total 33,401 100.0% 23.9% 1,082 100.0% 6.9%
Most of the 10th graders in special education programs in 2007 had taken the Grade 9 ELA end-of-course test in 2006. Approximately two thirds of these students scored at the bottom two levels on the CST and had little chance of passing the CAHSEE in 2007. Twenty percent of students with disabilities who took the Grade 9 ELA end-of-course test scored at Level 3 and 42 percent of these students passed the CAHSEE ELA test the following year. More than 10 percent scored at levels 4 and 5; CAHSEE ELA passing rates for these students were quite good (78% for Level 4 and 92% for Level 5).
About 1,000 10th grade students in special education programs in 2007 had taken the Grade 10 ELA in 2006. These students were, presumably, repeating the 10th
grade in 2007. Most of these students scored at the bottom two levels of the CST in 2006. At each CST score level, CAHSEE ELA passing rates for these students were
Human Resources Research Organization (HumRRO) Page 111
Independent Evaluation of the CAHSEE: Fourth Biennial Report
lower than rates for students at the corresponding level of the Grade 9 ELA end-of-course test.
Table 3.22. Frequency and Percent of SWD Passing the CAHSEE Mathematics Test in 2007 by 2006 Mathematics CST Performance Level – 10th Graders in Special Education Programs
General Math CST in 2006 Algebra I CST in 2006 Percent Percent
ELA CST Level N
Percent at Level
Passing CAHSEE in 2007 N
Percent at Level
Passing CAHSEE in 2007
1. Far Below Basic 5,227 34.8% 2.9% 5,275 36.5% 9.1%
2. Below Basic 6,598 43.9% 9.4% 6,180 42.8% 24.8%
3. Basic 2,506 16.7% 41.7% 2,075 14.4% 67.5%
4. Proficient 626 4.2% 72.8% 836 5.8% 86.7%
5. Advanced 66 0.4% 81.8% 84 0.6% 91.7%
Total 15,023 100.0% 15.5% 14,450 100.0% 29.1%
A roughly equal number of 10th grade students with disabilities in 2007 (about 15,000) had taken the General mathematics test and the Algebra I end-of-course testing in 2006. Roughly 80 percent of these students scored at Level 1 or Level 2 on the end-of-course test and had relatively low rates of passing the CAHSEE mathematics test in 2007. Students scoring at Levels 1 or 2 of the Algebra I test in 9th grade had passing rates roughly 3 times higher than students at Levels 1 or 2 of the General Mathematics test.
Racial/Ethnic Minorities and Low-Income Students
In addition to English learners and students with disabilities, Hispanic and African American students also have below-average CAHSEE passing rates. The source of the performance gap for these students is confounded by the fact that a significant portion of Hispanic students are also English learners and that both Hispanic and African American students are more likely to come from low-income families.
Table 3.23 shows the number, and CAHSEE passing rates, of Hispanic and African American students who are: (a) students with disabilities, (b) English learners who are not students with disabilities, (c) low-income students who are neither students with disabilities nor English learners and (d) all other students (who are not low-income, English learners, or students with disabilities). The passing rates for Hispanic and African American students are compared to passing rates for all other students (neither Hispanic nor African American) in each category. The gap measures are the differences
Page 112 Human Resources Research Organization (HumRRO)
Chapter 3: A Closer Look At Specific Populations
in passing rates between the comparison group and Hispanic or African American students.
Table 3.23. Passing Rates for Hispanic and African American Students in Different Demographic Categories
Demographic
All Students Neither Hispanic
nor African American Hispanic Students
African American Students
Group Gender Number % Pass Number % Pass Gap Number % Pass Gap English Language Arts
All students with disabilities (SWD)
Female Male Total
5,971 12,086 18,067
55.9%49.0%51.3%
7,190 29.5% 12,865 23.8% 20,059 25.8%
26.5%25.2%25.5%
2,004 3,619 5,624
28.0% 22.3% 24.3%
27.9% 26.8% 27.0%
English learners (EL) without disabilities
Female Male Total
5,110 6,514
11,627
55.2%49.7%52.1%
26,244 40.4% 30,279 35.8% 56,533 38.0%
14.8%13.8%14.1%
158 187 345
45.6% 38.5% 41.7%
9.6% 11.2% 10.4%
Low income students not EL nor SWD
Female Male Total
18,345 17,743 36,094
90.2%83.4%86.8%
45,586 86.5% 40,579 79.6% 86,175 83.3%
3.7%3.8%3.6%
8,282 7,103
15,385
74.1% 61.8% 68.4%
16.1% 21.6% 18.4%
Female 81,749 96.8% 27,858 90.2% 6.6% 8,632 85.1% 11.8% All other students Male 80,738 93.6% 25,957 83.5% 10.1% 8,238 73.7% 19.9%
All students Male 117,035 87.3% 109,477 66.0% 21.3% 19,133 56.8% 30.5% Total 228,269 87.9% 216,270 66.2% 21.7% 38,195 58.6% 29.2%
Note: The gap measures are the differences in passing rates between the comparison group listed on the left and the rate for Hispanic or African American students in that demographic group.
Overall, there is a gap of about 20 percentage points for both groups on the ELA test and for Hispanics on the mathematics test and a gap of about 30 points for African Americans on the mathematics test. For the ELA test, the gaps are noticeably larger for males than for females. The gap for students with disabilities is over 25 percentage
Human Resources Research Organization (HumRRO) Page 113
Independent Evaluation of the CAHSEE: Fourth Biennial Report
points for both males and females in each racial/ethnic group. The gap for Hispanic low-income students is less than 4 percent for ELA and less than 8 percent for mathematics when English learners and students with disability are excluded. Segregation of Students by Race/Ethnicity, Income, and Performance Level
In further investigating CAHSEE outcome differences for low-income and racial/ethnic minority students, we examined trends in the composition of low-performing and high-performing schools. We first looked at CAHSEE results for 10th
graders in 2004, separating out special schools (e.g., Continuation, Alternate, Community Day, and Juvenile Court schools). We then divided the regular public high schools (and K–12 schools) that remained into four roughly equal groups based on CAHSEE performance levels (the average of the ELA and mathematics passing rates for all 10th grade students in the school).
Table 3.24 shows the number of 10th grade students, overall and by income and racial/ethnic category, in the schools at each performance level for 2004 through 2007. Overall, the number of students was relatively constant from 2004 to 2007, but the number of 10th grade low-income and Hispanic students in these schools increased by 8 or 9 percent. The number of 10th grade African American students in these schools decreased by about 3 percent8. One encouraging finding is that the number of students in the lowest performing schools (average pass rate less than 65 percent) decreased by about 5 percent, while the number of 10th graders in each of the higher performance categories increased from 2 to 5 percent.
Figures 3.9 and 3.10 show trends in ELA and mathematics passing rates for schools in each 2004 performance level category. There was a very minor tendency for passing rates in the lowest performance category to increase and for passing rates in the highest category to decrease (about 1%). But for the most part, the poorly performing schools remained in that category and the high-performing schools remained high-performing as well. The differences across school groups remained large, from only about 55 percent passing for the lowest group up to roughly 90 percent passing for the highest group. Performance for students in special schools was even lower, decreasing by about 4 percentage points from 2004 to 2007, perhaps reflecting changes in the number and nature of students sent to such schools.
8 These analyses are limited to schools testing at least twenty 10th graders in 2004. Students attending a very small number of new schools established since 2004 are excluded.
Page 114 Human Resources Research Organization (HumRRO)
Chapter 3: A Closer Look At Specific Populations
Table 3.24. Number of 10th Grade Students in Schools with Different Average 2004 Passing Levels School Category 2004 2005 2006 2007
All Students Not Regular HS 28,656 24,810 25,659 23,012 < 65% Pass 103,923 98,468 102,566 98,744 65–<75% Pass 94,036 95,350 100,629 98,921 75–<85% Pass 107,396 107,736 113,004 110,001 85–100% Pass 118,835 120,199 125,418 122,962 Total 452,846 446,563 467,276 453,640
Low Income Students Not Regular HS 14,500 12,628 12,573 11,368 < 65% Pass 71,603 69,223 73,335 72,577
Figure 3.10. Percent passing mathematics for students in schools sorted by 2004 average passing levels.
Page 116 Human Resources Research Organization (HumRRO)
Chapter 3: A Closer Look At Specific Populations
Figure 3.11 shows trends in the total number of students in schools in each 2004 performance level category graphically. Figures 3.12 through 3.14 show trends in the percentage of students in schools at each performance level who are low-income, Hispanic, and African American respectively. Overall, slightly more students attended the highest performing schools compared to the other categories of schools. However, as shown in these figures, the percentage of low-income and minority students is much smaller in the higher performing schools and much larger in the lower performing schools.
Figures 3.15 and 3.16 display the racial/ethnic distribution across the performance levels in another way. Figure 3.15 shows trends in the percentage of all students in each school performance group compared to the percentage of low-income students who are in each group9. As shown, the percentage of low-income students who are in the poorest performing schools is much larger and the percentage of low-income students in the highest category schools is much smaller than for students in general. Figure 3.16 shows a similar breakout for Hispanic and African American students. Again, these figures show little systematic trend between 2004 and 2007.
Figures 3.17 through 3.22 show trends in the ELA and mathematics passing rates for low-income and racial/ethnic minorities in schools of each performance level category. The trends across years are not remarkable, but, overall, the passing rates for low-income and minority students in each school performance category are systematically lower than the passing rates shown in Figures 3.8 and 3.9 for all students in these categories.
9 Note the base in these figures is the total number of students in each racial/ethnic category. The base for the earlier figures is the total number of students at each performance level.
Human Resources Research Organization (HumRRO) Page 117
Independent Evaluation of the CAHSEE: Fourth Biennial Report
Figure 3.22. Percent of African American students in each 2004 school performance category passing the CAHSEE mathematics Test (2004 –07).
Human Resources Research Organization (HumRRO) Page 123
Independent Evaluation of the CAHSEE: Fourth Biennial Report
Summary of Findings
In our 2007 analyses, we again took a closer look at two populations of students who have had particular difficulty meeting the CAHSEE requirement—English learners and students with disabilities. We examined additional information on the characteristics of students in each of these populations and on the nature of the services they receive. This year, we also conducted further analyses of low-income and racial/ethnic minority students who have had difficulties meeting the CAHSEE requirement.
For English learners, the most striking result continues to be how many had been enrolled in US schools for a long time yet still retained their EL status, essentially since kindergarten. Students in this group appeared to have more severe problems, many participating in special education programs as well as English language development programs. Another important finding was that students who were enrolled within the last few years had lower CAHSEE passing rates compared to students who had been in English language development programs for a longer time. Students who had been English learners but were subsequently reclassified as fluent had relatively little difficulty with the CAHSEE.
In our current analyses, we obtained and merged data from the 2005 and 2006 administrations of the CELDT (2007 results are not yet available). Tenth grade students who scored in the bottom three levels of the CELDT in 2005 or 2006 had little chance of passing the CAHSEE ELA test in 2007 (less than 20 percent). Just over 25,000 of the EL students with matching CELDT data scored at CELDT Level 4 and 46 percent of these students passed the CAHSEE ELA test in 2007. At CELDT Level 5, the CAHSEE ELA passing rate was over 71 percent, but only about 10 percent of EL students reached this level. By contrast, nearly half of the 2007 tenth graders classified as RFEP scored at the top level (Level 5) of the CELDT in 2005 or 2006 and nearly 90 percent of these students passed the CAHSEE ELA test in 2007.
As was the case in 2005 and 2006, our analysis of information on students with disabilities revealed a strong relationship between the degree to which these students participate in regular classroom instruction and their success on the CAHSEE. Both participation in regular instruction and CAHSEE success vary considerably for students in different primary disability categories. Students with mental retardation are unlikely to spend much time in regular classroom instruction. Very few pass the CAHSEE, and relatively few even continue to take the CAHSEE after 10th grade. The types of services students receive also vary by primary disability category, although provision of these services is not closely related to CAHSEE outcomes, independent of time spent in regular instruction. It is likely that the value of these services is balanced out by the greater needs of the students who receive them.
This year, we also examined 2006 CST end-of-course test results for students with disabilities. CST score levels in 2006 were a very good predictor of success on the corresponding CAHSEE test in 2007, as was the end-of-course CST taken.
Page 124 Human Resources Research Organization (HumRRO)
Chapter 3: A Closer Look At Specific Populations
Finally, performance gaps for low-income and racial/ethnic minority students are large and cut across most groups of students defined by type of disadvantage (students with disabilities, English learners, and low-income students). Low-income and racial/ethnic minority students tend to be clustered in low performing schools and their performance in schools at each overall performance level examined here was lower then other students in these schools. While there has been an overall decrease in the total number of students in the lowest-performing schools (about 5 percent), the demographic composition of schools at each level has been relatively unchanged since 2004.
Human Resources Research Organization (HumRRO) Page 125
Chapter 4: Principal and Teacher Survey Responses
Chapter 4: Principal and Teacher Survey Responses
Hilary L. Campbell
Introduction
Beginning in 2000, HumRRO administered longitudinal surveys to a representative sample of California school districts each year except for 2005, when we conducted an Instruction Study instead. In Spring 2007, we administered the California High School Exit Examination (CAHSEE) Evaluation Longitudinal Sample Survey to principals (2007 Principal Longitudinal Survey; see Appendix A) and teachers (2007 Teacher Longitudinal Survey; see Appendix B). Although individual items differ across these surveys, the general purpose of both is to collect information about the impact of the CAHSEE on students, parents, teachers, and schools. Throughout this chapter, references to the principal (PR) and teacher (T) surveys will be denoted with the survey item number (e.g., PR-1, T-1) in the narrative and in tables.
Survey Development
To the extent possible, we retained items intact from previous versions of the survey to facilitate examination of trends over time. Revisions to these surveys have primarily derived from the implementation of the graduation requirement that students must pass the CAHSEE. Thus, new items address the performance data that are available now that the CAHSEE has been in place as a high-stakes exam. In addition, we eliminated previous items that speculated about the impact of the CAHSEE requirement on graduation.
Sampling and Administration
Sampling and administration procedures for the longitudinal surveys were similar to previous years. We sent the initial surveys to the same longitudinal sample compiled for the first survey in 2000 to be as representative of all California schools as possible. Over time, this list has been slightly amended as schools have dropped out and been replaced. We included public, alternative, independent study, and charter high schools in the sample of 100 districts.
As in the past, we contacted districts to obtain contact information for principals by e-mailing district points of contact (POC) in March 2007. This initial communication requested (a) updated principal contact information and (b) permission to contact high schools. Initial e-mails to district POCs included the following attachments:
1. Endorsement letter from Deb Sigman, Director of the Standards and Assessment Division at the California Department of Education
2. HumRRO’s cover letter introducing 2007 CAHSEE Longitudinal Survey 3. FaxBack Form to collect contact information for sampled high school(s) from
that district
Human Resources Research Organization (HumRRO) Page 127
Independent Evaluation of the CAHSEE: Fourth Biennial Report
Once the district granted approval, we e-mailed high school principals in March and April 2007. In these first communications, we asked principals to confirm their schools’ participation in the 2007 Longitudinal Survey and to provide contact information for two English language arts (ELA) and two math teachers within their schools who were involved with the CAHSEE. These initial contacts included HumRRO’s cover letter introducing the 2007 CAHSEE Longitudinal Survey and FaxBack Forms for principals to send teacher names and e-mail addresses. We asked principals to indicate on the FaxBack forms a preference for electronic or print forms of the survey for themselves and their teachers.
Once principals confirmed participation and provided contact information for teachers, HumRRO researchers e-mailed survey instructions, a Web address for accessing the survey, and a unique password to each targeted respondent. To those schools that requested paper versions of the surveys, we shipped packages in May and June 2007, and included the following:
1. Cover letter and instructions to complete and return principal and teacher surveys
2. One principal survey 3. Four teacher surveys (two labeled for ELA, two labeled for math) 4. FaxBack Form for principal’s and teachers’ names
The online survey went live on April 16th, 2007. The initial closing schedule was May 31st, 2007; however, due to low response rate, we extended the closing date to June 13th, 2007. We sent follow-up e-mails and made telephone calls to targeted respondents who had not completed the survey.
Survey Findings
The CAHSEE became high-stakes for students in 2006, when it became a graduation requirement. As a result, the nature of the longitudinal surveys has changed slightly to include items addressing the actual impact of the CAHSEE. In large part because the 2007 response rates for teachers were unusually low, we combined 2007 survey data with the 2006 survey data on items that remained unchanged over this time. Although combining the 2006 and 2007 data does not increase the response rate for 2007, it does broaden the sample of schools for which there will be coverage or representation. In addition, because the CAHSEE was in place as a high-stakes exam for students in both of these years, it is desirable to have the maximum amount of information and school representation possible across this period to effectively examine the impact that the CAHSEE had on students, parents, teachers, and schools. This report will compare principal and teacher responses from the high-stakes era of the CAHSEE in 2006 and 2007 with data from previous years (2000–04) in which the CAHSEE was administered, but did not have implications for student graduation. In cases where substantial change occurred in teacher or principal responses between 2006 and 2007, responses will be reported separately.
Page 128 Human Resources Research Organization (HumRRO)
Chapter 4: Principal and Teacher Survey Responses
Response rates in the 2006 sample based on the identified sample size were 59 percent for principals (52% based on the target sample size) and 60 percent for teachers (51% based on target sample size). Response rates for the 2007 sample are reported in Table 4.1. Teacher response rates based on the target sample, in particular, were low in 2007 (29%). Given the response rate for identified teachers (51%), it appears the problem in response rate might stem from an inability to identify a sufficient number of teachers.
Table 4.1. Longitudinal Survey Response Rates
Respondents Target Sample Size
Identified Sample
Number of Responses
Response Rate (Based on
Target Sample)
Response Rate (Based on
Identified Sample) PrincipalsTeachers
100 398
100 225
47 115
47% 29%
47% 51%
Note: “Identified Sample” represents individuals who were specifically identified during the multi-step recruiting process (e.g., districts identified school principals, who in turn identified teachers).
Organization of Survey Findings
Beyond the Principal and Teacher Longitudinal Surveys, results from two additional data sources are integrated into this chapter to contextualize results. First, student performance data from the 2007 CAHSEE administration are included and matched with relevant survey variables to illustrate connections between principal and teacher responses and actual student performance. Second, results from the 2007 Student Questionnaire are included to provide student perspectives about topics relevant to the CAHSEE. Students complete the Student Questionnaire when they take the CAHSEE; thus, all students who take at least one section of the CAHSEE have an opportunity to respond to the Student Questionnaire items. This report organizes teacher and principal survey response data, in conjunction with information from these two additional sources, into five meaningful areas:
1. Respondent and School Background Information
This area presents basic background and demographic information about the professional experience of the respondents, both principals and teachers, and the schools in which they work. Both the teacher and principal surveys included several items collecting basic information about the schools represented in the survey, including personnel, programs offered, student activities, typical graduation rates, class size, and English fluency.
The survey also presents performance data matched to the participating schools. These data provide information about class size and passing rates on the CAHSEE for first-time 10th-grade test takers, both for the class as a whole and by subgroup. First-time 10th-grade passing rates are also reported for schools with large proportions of at-risk students, or students in subgroups that traditionally struggle to pass the CAHSEE.
Human Resources Research Organization (HumRRO) Page 129
Independent Evaluation of the CAHSEE: Fourth Biennial Report
These performance data are also combined with survey responses to examine how survey responses differ across school context.
2. CAHSEE Knowledge and Preparedness
This section covers knowledge and preparedness for both students and teachers, including general student awareness of and readiness for the CAHSEE as well as what teachers and schools are doing to help students succeed. Teachers reported how well prepared they believe students were, the extent to which the CAHSEE content standards were covered in the curriculum, and the specific activities or strategies they used to prepare their students for the Spring 2007 CAHSEE administration. Principals reported the general amount of content coverage of the CAHSEE standards in their schools’ curriculum, the programs in place to help students succeed, student awareness of the CAHSEE, and activities their schools undertook to help students succeed on the Spring 2007 CAHSEE. This section also covers how well prepared teachers are to help students succeed on the CAHSEE. Teachers report on the usefulness of the CDE website and Teacher Guide as well as on the amount of time they spend on CAHSEE preparation and the quality of relevant state and local professional development activities. Survey results are presented both alone and, where appropriate, in conjunction with actual CAHSEE school performance data or Student Questionnaire results from the 2007 CAHSEE administration.
3. Content Standards Under CAHSEE
The third major area of the longitudinal survey explores awareness, coverage, and alignment of the state content standards under CAHSEE. Items in this section report responses from the principal survey and reflect awareness, use, and alignment of the content standards at the school level. Specific information elicited from principals includes estimated student and parent awareness of the CAHSEE content standards, relationships between the state and district content standards in reading and math, alignment and coverage of the state standards, estimated proportions of teachers who have and who use the state content standards, and evidence available to demonstrate that teachers are using the standards to guide instruction. Based on results from the 2007 Student Questionnaire, students’ impressions of the extent to which CAHSEE content was covered in their classes are also included.
4. Impact of the CAHSEE
The survey items in this section will cover information from principals and teachers about the impact of the CAHSEE on students, parents, and instruction. Specific items for teachers and principals explore the impact of student performance on the CAHSEE on student motivation and parental involvement. Questions explored the impact of the CAHSEE on instructional practices, including the amount of time spent on CAHSEE preparation activities and the usefulness of the CAHSEE score reports. The survey also explored the test’s impact outside the main CAHSEE content areas, asking both principals and teachers how responsible they believe teachers of non-CAHSEE
Page 130 Human Resources Research Organization (HumRRO)
Chapter 4: Principal and Teacher Survey Responses
subjects feel for student success on the CAHSEE. It also queried principals about the extent to which the CAHSEE has drawn resources away from the non-core curriculum such as arts and vocational courses.
5. CAHSEE as a Graduation Requirement
Of optimal importance in any examination of the impact of CAHSEE is the fact that the CAHSEE became high-stakes for students in 2006, when it became a requirement for high school graduation. This section of the survey examines graduation rates, options and supports for special populations and for students who struggle to pass the CAHSEE, and factors that contribute to students’ struggles. Specific items examine numbers of students who were unable to graduate last year or are unlikely to graduate this year because of the CAHSEE requirements as well as the principals’ and teachers’ impressions of the impact of the CAHSEE on student retention and drop-out rates. Other items explore graduation alternatives for students who do not pass the CAHSEE, factors that contribute to difficulty passing the CAHSEE, and methods available to help struggling students pass the CAHSEE. Finally, this section focuses on special considerations for participation and success for students with disabilities and English Learners. Results in this section are closely linked with the actual CAHSEE school performance data and are compared with student perspectives accrued via the Student Questionnaire items.
Respondent and School Background Information
This section provides background information about survey respondents and the schools they represent. We present background information collected about the individual teachers and principals who completed the survey first, followed by background information collected about the schools in which these teachers and principals work. CAHSEE performance data are presented in the school background section. This section provides an indication of the extent to which schools and educators represented in these survey data are representative of the state of California.
Respondent Background Information
These items describe the experience of the educators who responded to this survey. Both principals and teachers reported their educational experience. In the combined 2006/0710 sample, teachers reported (T-4) 1 to 52 years of experience, with a mean of 12.1 years (SD = 9.8) and a median of 9.0 years. Further, they reported from 0 to 39 years experience teaching in their primary subject areas, with a mean of 11.3 years (SD = 9.4) and a median of 8.0 years. Finally, teachers reported teaching in their present schools for 1 to 36 years, with a mean of 7.0 years (SD = 6.7) and a median of 5.0 years.
10 Throughout this chapter, 2006/07 refers to combined sample data collected over both administrations (i.e., 2005-06 and 200607).
Human Resources Research Organization (HumRRO) Page 131
Independent Evaluation of the CAHSEE: Fourth Biennial Report
Principals also provided information about their experience (PR-1). They reported 1 to 35 years experience as principals or school-level administrators, with a mean of 9.3 years (SD = 6.7) and a median of 8.0 years. Principals also reported having 1 to 31 years of teaching experience, with a mean of 13.1 years (SD = 7.2) and a median of 12.0 years. They reported working in their present schools for 1 to 33 years, with a mean of 8.2 years (SD = 8.3) and a median of 5.0 years. Finally, principals reported 4 to 42 years experience working in public schools, with a mean of 23.3 (SD = 9.1) and a median of 23.5 years.
Additional questions on the teacher survey asked for detailed information about teaching experience. Teachers in both 2006 and 2007 were asked to report their highest level of education (T-1). Of the 317 teachers in the combined 2006/07 sample, 15 percent reported a Bachelor’s (4-year) degree, 36 percent reported some graduate school, 45 percent reported obtaining a Master’s degree, and 3 percent reported obtaining a doctorate. Two percent of teachers reported “other” highest levels of education; four teachers from the 2007 sample reported completing various credential programs. Teachers from the 2006 sample and teachers from the 2007 sample reported different levels of educational attainment, with teachers from the 2006 sample reporting a higher rate of study beyond Bachelor’s degrees (see Table 4.2). Because most results are presented for the combined 2006 and 2007 samples, the educational attainment in the combined sample also is presented.
Table 4.2. T-1: Educational Attainment in Teacher Samples (Percentages) Highest Level of Education 2006 2007 Combined Bachelor’s degree 13 18 15 Some graduate school 34 38 36 Master’s degree 50 37 45 Doctoral degree 2 4 3 Other 1 4 2
The longitudinal teacher survey also asked respondents to provide specific information about the content and students they teach. In the combined sample, 49 percent of teachers reported English language arts (ELA) as their primary subject area, and 51 percent of teachers reported math as their primary subject area (T-2). Of all teachers responding to the survey, 82 percent reported being certified in their primary subject area (T-3). Specifically, 85 percent of ELA teachers and 80 percent of math teachers reported being certified in their primary subject area. Of the teachers from the 2007 sample who were not certified in their primary subject area, one teacher indicated certification in multiple subjects and one indicated special education certification. Teachers also reported all grades that they taught (T-5). Of the 317 teachers responding in 2006 and 2007, 79 percent taught 9th grade, 77 percent taught 10th grade, 66 percent taught 11th grade, and 62 percent taught 12th grade.
School Background Information
Page 132 Human Resources Research Organization (HumRRO)
Chapter 4: Principal and Teacher Survey Responses
Items in this section describe the schools that the 2006 and 2007 survey respondents represent. Principals and teachers provided information about staff and classrooms in their schools, as well as information about the educational programs available to students. Teachers reported their mean enrollment per class in the current school year (T-6); class sizes ranged from 1 to 40 students, with a mean class size of 27 students (SD = 6.8) and a median of 28 students. Mean English fluency among students in the classrooms was also examined (T-7). Most teachers (50%) reported that 90–99 percent of students in their average classroom spoke English fluently. Twenty-three percent reported, on average, that 75–89 percent of their students spoke English fluently in their typical classroom. Fifteen percent of respondents reported that 100 percent of their students were fluent in English, 9 percent reported that 50–74 percent of their students were fluent in English, and 3 percent reported that less than 50 percent of their students were fluent in English.
Finally, teachers reported how frequently they planned for students in their classes to participate in certain educational activities (T-8). This item has been on the teacher longitudinal survey since 2004, before the CAHSEE became a graduation requirement for students. Over time, teacher responses to this item have changed, suggesting that classroom activities may have changed in response to the CAHSEE. For this item, 2006 and 2007 teacher responses are reported separately to show the evolution of responses over time. Table 4.3 shows the top six activities in which the greatest percentage of teachers indicated students participate most frequently (weekly or more often). As Table 4.3 indicates, the same top six activities appear each year; however, the order of commonly practiced activities has shifted. In 2007, for instance, teachers placed a greater emphasis on having students apply subject area knowledge to real-world situations and followed the continuing upward trend of emphasizing working in pairs or small groups and in writing a few sentences about a topic or its consequences (or a math problem or its solution). The 2007 teacher responses also indicate a continuing downward trend of doing work from textbooks.
Human Resources Research Organization (HumRRO) Page 133
Independent Evaluation of the CAHSEE: Fourth Biennial Report
Table 4.3. T-8: Percentage of Teachers Indicating Their Students Spend Time Each Week on Selected Classroom Activities Assignment 2004 2006 2007 Do work from supplemental materials 80 86 83 Apply subject area knowledge to real-world situations 73 67 80 Do work from textbooks 87 84 77 Work in pairs or small groups 64 67 70 Write a few sentences 65 66 69 Take quizzes or tests 61 67 66
Other survey responses not included in the top six activities reported in Table 4.3 also reflect a possible emphasis on increasing applied activities and decreasing textbook work. For instance, from 2006 to 2007 the percentage of teachers indicating they plan for their students to work with hands-on materials, physical models, or manipulatives once or twice a week or almost every day increased from 12 percent to 22 percent. Additionally, the percentage of teachers indicating that they plan for their students to do work on the computer increased from 17 percent to 25 percent.
Principals from the combined 2006/07 sample were asked several questions about staff in their schools (PR-2). Principals reported staff sizes ranging from 5 to 250 teachers, with a mean of 95 (SD = 46.5) and a median of 91.5 teachers. Principals reported the percentage of teachers on their staffs that had been teaching in their schools for three or more years: a mean of 74 percent (SD = 14.7) and a median of 75 percent. Asked to report what percentage of their teachers had earned advanced degrees, principals reported a mean of 46 percent (SD = 21.6; median = 46). Finally, principals reported between 60 and 100 percent of teachers are certified in the subject area they teach; the mean percentage was 95 percent (SD = 7.7) and the median percentage was 98 percent.
Principals reported staff changes in their schools during the past three years (PR-3). Responses on this item differed somewhat between 2006 and 2007, indicating a general trend of less staff mobility. Table 4.4 shows changes in staffing for 2006, 2007, and the combined sample. As the table indicates, 34 percent of principals indicated no major staffing changes in 2006, compared with 43 percent of principals indicating no major staffing changes in 2007.
Page 134 Human Resources Research Organization (HumRRO)
Chapter 4: Principal and Teacher Survey Responses
Table 4.4. PR-3: Major Staff Changes Over the Last Three Years as Reported in 2006 and 2007 Principal Samples (Percentages) Staff Changes 2006 2007 Combined Increased number of teachers 46 34 40 Decreased number of teachers 16 19 18 Increased number of principals or other administrators 26 28 27 Decreased number of principals or other administrators 20 6 13 No major faculty or staff changes 34 43 38
The 2006 and 2007 surveys asked principals to report the types of specialty education programs offered at their schools as well as the estimated percentage of students who participate in each (PR-4). As Table 4.5 indicates, a greater percentage of principals in the 2007 sample reported offering most programs. Notable increases included special education programs, Advanced Placement courses, remedial courses, and school/community/business partnerships. Estimated student participation in these courses remained fairly steady from 2006 to 2007, although principals reported a lower percentage of student participation in magnet programs and multicultural/diversity-based programs in 2007. In the combined sample, the most commonly offered program was special education (90%), followed by programs for English Learners (86%), Advanced Placement courses (80%), and remedial courses (79%). Principals in the 2007 sample also provided comments elaborating on the programs offered in their schools. Several principals explained the sources of their data. One respondent noted some students are enrolled in reading and math placement courses. Another principal reported the majority of students in remedial programs are English Learners and special education students. A third commented that not all students are at grade level and that in-school tutorial programs are offered for some low-performing students.
Human Resources Research Organization (HumRRO) Page 135
Independent Evaluation of the CAHSEE: Fourth Biennial Report
Table 4.5. PR-4: Percent of Schools Offering Specialty Education Programs and Estimated Percentage of Students Participating in Each
Percentage of Principals Reporting Program Available
Mean Estimated Percentage of Students Participating in Program
(Median Percentage)
Specialty education program 2006 2007 Combined 2006 2007 Combined
15 (10) Multicultural/Diversity-based 14 11 12 74 (80) 41 (25) 60 (64) International Baccalaureate 12 6 9 16 (13) 13 (8) 15 (10) Explanation of table contents: The first line of the table indicates that, in 2006, 84 percent of principals reported offering special education programs. In 2007 and the combined sample respectively, 96 percent and 90 percent of principals reported offering special education programs. Principals reported an estimated mean of 14 percent of students (median 10%) participated in special education programs in 2006. In 2007, an estimated mean of 12 percent of students (median 10%) and in the combined sample, an estimated mean of 13 percent of students (median 10%) participated.
School principals reported graduation rates for seniors in their schools overall as well as for various racial/ethnic subgroups (PR-5). Table 4.6 shows graduation rates reported by principals in the 2006 sample, the 2007 sample, and the combined sample. Higher graduation rates across subgroups were reported in the 2007 sample. Estimated mean and median graduation rates increased substantially from 2006 to 2007 for American Indian/Alaskan Native and Black or African American students. Reported estimated graduation rates in the combined 2006/07 sample were, on average, 84 percent for seniors overall (median = 91%), 78 percent for Caucasian, not Hispanic origin students (median = 90%), 70 percent for Hispanic/Latino students (median = 79%), 68 percent for Asian or Pacific Islander students (median = 90%), 65 percent for Black or African American, not Hispanic origin students (median = 80%), and 59 percent for American Indian/Alaskan Native students (median = 90%). In the “Other” category, one principal reported an 88 percent graduation rate for Filipino students, and one principal reported a 6 percent graduation rate for Asian students. As mean and median reported pass rates indicate, a small proportion of principals included in the sample anticipated aberrantly low graduation rates; these low rates pulled the mean estimated rates down, creating the disparity between mean and median graduation rates.
Page 136 Human Resources Research Organization (HumRRO)
Chapter 4: Principal and Teacher Survey Responses
Table 4.6. PR-5: Mean (Median) Estimated Graduation Rates as Reported in 2006 and 2007 Principal Samples Group 2006 Seniors overall 83 (92) American Indian/Alaskan Native 50 (60) Asian or Pacific Islander 63 (90) Black or African American, not Hispanic origin 61 (75) Caucasian, not Hispanic origin 77 (90) Hispanic/Latino 67 (71)
Explanation of table contents: The first line of the table indicates that principals reported an estimated mean of 83 percent of seniors overall (median 92%) graduated in 2006. In 2007, an estimated mean of 85 percent of seniors overall (median 90%) and in the combined sample, an estimated mean of 84 percent of students (median 91%) graduated.
Actual CAHSEE performance data from the Spring 2007 administration for the schools with respondents to the longitudinal survey provides important information about the representativeness of the sample. Because some schools had principals but not teachers responding to the survey whereas other schools had teachers but not principals responding to the survey, performance data differ slightly between these samples. It is important to note these data are in effect weighted, because schools that appear in the data multiple times (either for representation across 2006 and 2007 or for inclusion of multiple teachers) are counted multiple times in the frequencies.
A variety of school types is represented in these survey data. Across the two survey years, the combined principal responses represented 84 high schools, four continuation schools, three K–12 schools, three alternative schools, and one county community school; the combined teacher responses represented 284 high schools, 12 K–12 schools, nine alternative schools, eight county community schools, one continuation school and one juvenile hall11. School enrollments ranged from 4 to 1603 students, with principals reporting a mean school size of 556 (SD = 293) and teachers reporting a mean school size of 599 (SD = 291). In both samples, passing rates across all 10th-grade students ranged from 20 to100 percent for the ELA test and from 16 to 99 percent on the math test. A mean of 76 percent (SD = 15) of 10th-grade first-time test takers passed each test as reported by teachers; principals reported a mean of 75 percent (math SD = 16; ELA SD = 15) of students passed each test.
CAHSEE performance data were collected for the ELA test and for the math test. Student pass rates on each test were categorized into High (> 90% to 100%); Moderate (>75 to 90%); Low (>50 to 75%); and Very Low (0% to 50%). Pass rates were assigned based on 10th-grade first-time test taker data, and rates were reported for all 10th-grade students as well as for Hispanic, African American, and Economically Disadvantaged students, as well as English Learners, and students in special education. Passing data were converted to missing for any school with fewer than 10 students in a category. If, for instance, a school reported six English Learners, no pass rate category was
11 These numbers include multiple responses from a single school; the total number of schools is smaller because some are counted multiple times.
Human Resources Research Organization (HumRRO) Page 137
Independent Evaluation of the CAHSEE: Fourth Biennial Report
assigned to CAHSEE data for the English Learners in that school. Pass category data for math and ELA are presented in Tables 4.7a (teacher data) and 4.7b (principal data).
ELA MathStudent Group High Moderate Low Very Low High Moderate Low Very Low
All 10th Graders 18 39 39 4 20 39 36 5 (n = 315) Hispanic (n = 306) African American
6
16
29
23
61
50
5
10
7
12
21
17
67
53
5
18 (n = 231) Economically Disadvantaged (n = 309) English Learner (n = 286) Special Education
3
0
0
19
0
1
71
21
16
7
79
83
3
2
0
22
8
1
70
39
14
5
51
85 (n = 298)
Note: High (> 90% to 100%), Moderate (>75 to 90%), Low (>50 to 75%), Very Low (0% to 50%)
Explanation of table contents: The first line of the table indicates that, on the ELA section of the CAHSEE, 18 percent of all 10th
grade students represented in the teacher sample attended schools in the High pass category. Thirty-nine percent of all 10th
graders attended schools in the Moderate group, 39 percent in the Low group, and 4 percent in the Very Low group. In the math portion, of all 10th-grade students, 20 percent attended schools in the High category, 39 percent in the Moderate category, 36 percent in the Low category, and 5 percent in the Very Low category. “n”s indicate number of teachers’ responses from the 2006/07 survey samples represented.
Page 138 Human Resources Research Organization (HumRRO)
Chapter 4: Principal and Teacher Survey Responses
Table 4.7b. CAHSEE 2007 Student Performance Data - Principal Sample (Percentages)
ELA MathStudent Group High Moderate Low Very Low High Moderate Low Very Low
All 10th Graders 19 31 45 5 19 32 44 5 (n = 95) Hispanic (n = 91) African American
6
13
28
24
62
56
6
7
9
7
19
21
63
50
10
21 (n = 70) Economically Disadvantaged (n = 91) English Learner (n = 81) Special Education
3
0
0
19
3
0
71
20
17
7
78
84
7
3
0
20
10
0
67
37
12
7
51
88 (n = 85)
Note: High (> 90% to 100%), Moderate (>75 to 90%), Low (>50 to 75%), Very Low (0% to 50%)
Pass rates were also computed for students in schools that have large proportions of students in subgroups that tend to be at risk for struggling on the CAHSEE. To identify schools with high proportions of at-risk students, all CAHSEE schools from the entire state were divided into quintiles for each subgroup. Quintiles are created simply by dividing the schools into fifths; the one-fifth of schools with the lowest proportion of subgroup students represents the lower quintile, whereas the one-fifth of schools with the highest proportion of students represents the upper quintile. These quintile cut-off values from all high schools were then applied to the survey data; schools that would appear in the upper quintile of the general population were identified as schools with high proportions of at-risk students for these survey data. Upper quintile schools were identified for five student subgroups: African American, Hispanic, Economically Disadvantaged, English Learner, and Special Education students. Data for subgroups with fewer than 10 students were treated as missing; quintile scores were not reported. Pass rates for 10th-grade first-time test takers in schools falling into the upper quintile for each student subgroup in the teacher and principal samples are reported in Tables 4.8a and 4.8b. These tables demonstrate clear achievement gaps between schools in the upper quintile and schools not in the upper quintile. For instance, none of the schools in the upper quintile for proportion of economically disadvantaged students or English Learners were in the High or Moderate pass categories. Schools that were not in the upper quintile for these student groups performed considerably better in both ELA and math.
Human Resources Research Organization (HumRRO) Page 139
Independent Evaluation of the CAHSEE: Fourth Biennial Report
Table 4.8a. CAHSEE 2007 Pass Rates for First-Time Test Takers in Schools With (and Without) Large Proportions of At-Risk Students - Teacher Sample (Percentages)*
*Numbers outside parentheses are pass rates for first-time test takers in schools in the upper quintile for student group; numbers in parentheses are pass rates for schools NOT in those upper quintiles. High (> 90% to 100%), Moderate (>75 to 90%), Low (>50 to 75%), Very Low (0% to 50%).
Explanation of table contents: The first line of the table indicates that, on the ELA section of the CAHSEE, 6 percent of all 10thgrade students from schools in the upper quintile for proportion of Hispanic students were in the High pass category, and 21 percent of 10th-grade students from schools NOT in the upper quintile were in the High pass category. Eight percent of 10thgraders from schools in the upper quintile and 45 percent of 10th graders from schools not in the upper quintile were in the Moderate group, 77 percent of 10th graders from upper quintile schools and 30 percent of students not from upper quintile schools were in the Low group, and 10 percent of 10th graders from upper quintile schools and 4 percent of students not from upper quintile schools were in the Very Low group. “n”s indicate number of teachers’ responses from the 2006 and 2007 samples representing schools in the upper quintile; and schools not in the upper quintile.
Page 140 Human Resources Research Organization (HumRRO)
Chapter 4: Principal and Teacher Survey Responses
Table 4.8b. CAHSEE 2007 Pass Rates for First-Time Test Takers in Schools With (and Without) Large Proportions of At-Risk Students - Principal Sample (Percentages)*
MathStudent Group in ELA VeryUpper Quintile High Moderate Low Very High Moderate Low Low Low
*Numbers outside parentheses are pass rates for first-time test takers in schools in the upper quintile for student group; numbers in parentheses are pass rates for schools NOT in those upper quintiles. High (> 90% to 100%), Moderate (>75 to 90%), Low (>50 to 75%), Very Low (0% to 50%). “n”s indicate number of teachers’ responses from the 2006 and 2007 samples representing schools in the upper quintile; and schools not in the upper quintile.
Several schools were in the upper quintile for proportion of at-risk students for a number of student groups. Impact on CAHSEE first-time pass rates is even more pronounced for schools that are in the upper quintile for proportions of multiple student groups. Table 4.8c shows the CAHSEE ELA and math pass rates for schools in the upper quintile for more than one student group from both the principal and teacher 2007 survey samples. In the schools that are in the upper quintile for multiple student groups, a vast majority are in the Low or Very Low pass categories.
Table 4.8c. CAHSEE 2007 Pass Rates for First-Time Test Takers in Schools with Large Proportions of At-Risk Students in Multiple Subgroups- Principal and Teacher Samples (Percentages)*
ELA Math High Moderate Low Very Low High Moderate Low Very Low
Principal (n = 23)
0 9 87 4 0 9 87 4
Teacher 0 11 83 6 0 11 83 6 (n = 63)
Note. High (> 90% to 100%), Moderate (>75 to 90%), Low (>50 to 75%), Very Low (0% to 50%) “n”s indicate number of principals’ or teachers’ responses from the 2006 and 2007 samples representing schools in the upper quintile for multiple subgroups.
Human Resources Research Organization (HumRRO) Page 141
Independent Evaluation of the CAHSEE: Fourth Biennial Report
CAHSEE Knowledge and Preparedness
Several survey items sought to determine teachers’ and principals’ perceptions of the level of knowledge and preparedness of both students and teachers regarding the upcoming CAHSEE administration. Teachers and principals provided input about general levels of readiness among students and the type and quality of programs and activities that local and state education agencies provide to students and teachers. Items in this section are separated by student knowledge and preparedness and teacher knowledge and preparedness. Student Questionnaire results from the 2007 CAHSEE administration also are included to provide student perspectives on preparedness.
Student Knowledge and Preparedness
The student knowledge and preparedness items address (a) programs and activities that teachers and schools have undertaken to help ensure student success on the CAHSEE (b) teacher and principal estimates of student preparedness for the CAHSEE and (c) Student Questionnaire items from the 2007 CAHSEE administration that address knowledge and preparation. Both principals and teachers provided information about activities offered to promote student success on the CAHSEE. Principals reported activities their schools offered to help students prepare and which of those activities were most important to CAHSEE preparation (PR-14). Because reported school activities and their level of importance differed somewhat from 2006 to 2007, data for each year are reported separately in addition to data from the combined sample. Table 4.9 provides the percentage of principals who reported conducting each activity as well as the percentage of principals who indicated the activity was most important in the 2006, 2007, and combined samples. As Table 4.9 indicates, most activities were fairly similar from 2006 to 2007. Several substantial changes, however, were reported. The three most common 2006 activities included emphasizing the importance of the CAHSEE, encouraging students to work hard and prepare, and providing individual/group tutoring. For 2007, emphasizing the importance of the CAHSEE, encouraging students to work hard and prepare, and teaching test-taking skills were the three most common activities. The percentage of principals who reported providing individual/group tutoring fell from 95 percent in 2006 to 83 percent in 2007, a substantial reduction. The percentage of principals who reported including teachers other than ELA and math in instructional planning for the CAHSEE also dropped substantially, from 67 percent to 52 percent. In the 2007 sample, principals reported a few “Other” activities to promote student preparation, including CAHSEE support systems and practice tests.
Page 142 Human Resources Research Organization (HumRRO)
Chapter 4: Principal and Teacher Survey Responses
Table 4.9. PR-14: Principals’ Report of Activities Offered and Ranked Most Important for CAHSEE Preparation Percentage of Principals Reporting Activity Offered
Percentage of Principals Ranking Activity Most Important
Activity 2006 2007 Combined 2006 2007 Combined No special preparation - - - - - -Encouraged students to work hard and prepare 95 88 91 27 27 27 Emphasized importance of the CAHSEE 100 98 99 59 59 59 Encouraged students (and through their parents) to take demanding courses
69 74 72 16 22 19
Provided individual/group tutoring 95 83 89 64 51 58 Had students work with computers 64 60 62 7 15 11 Taught test-taking skills 80 88 84 30 34 32 Modified curriculum 41 45 43 16 12 14 Included teachers other than ELA and math in 67 52 59 25 17 21 instructional planning for the CAHSEE Increased summer school offerings 41 38 40 2 5 4 Added homework 18 17 17 0 5 2 Eliminated electives in favor of remedial classes 44 43 43 18 22 20 Used school test results to change instruction 67 67 67 34 39 37 Used school test results to design remedial instruction
69 69 69 27 32 29
Adopted state content standards 67 74 70 30 42 35 Changed graduation requirements to include courses that enhance student success on the CAHSEE
3 10 6 2 5 4
Explanation of table contents: The second line of the table indicates that, in 2006, 95 percent of principals reported encouraging students to work hard and prepare. In the 2007 and combined samples respectively, 88 percent and 91 percent of principals reported encouraging students to work hard and prepare. In 2006, 2007, and the combined sample, 27 percent of principals ranked encouraging students to work hard and prepare as one of the most important activities their schools offered to prepare students for the CAHSEE.
Human Resources Research Organization [HumRRO] Page 143
Independent Evaluation of the CAHSEE: Fourth Biennial Report
Activities rated as most important for student success on the CAHSEE also changed from 2006 to 2007. Both 2006 and 2007 samples rated emphasizing the importance of the CAHSEE and providing individual/group tutoring as two of the three most important activities. In 2006, however, the third most important activity was using test results to change instruction, whereas in 2007 the third most important activity was adopting state content standards. There was a substantial increase in the percentage of principals who ranked adoption of state content standards as one of the most important CAHSEE preparation activities. There also was a substantial decrease in the number of principals who ranked providing individual/group tutoring as important.
On the Student Questionnaire, students reported how they prepared for the 2007 CAHSEE. Students responded to items on the Student Questionnaire separately on the ELA and math sections of the CAHSEE. In most cases, results were similar across subject areas and are reported as a mean across the two areas. Where results differed considerably, they are reported separately for ELA and math.
Averaged across subject area, tenth grade first-time test-takers most frequently reported preparing by practicing on questions similar to those on the test (34%) and having a teacher or counselor inform them about the purpose and importance of the test (33%). Few students reported taking special classes that covered the topics on the CAHSEE during the regular school day (5%) or after school or during the summer (3%). The percentage of students reporting a teacher spent time in class helping them prepare for the test differed considerably for ELA (36%) and math (24%). Finally, 34 percent of first-time test-takers, on average, reported not doing anything in addition to regular coursework to prepare for the test.
Students also reported how important the CAHSEE is to them. Across all first-time test-takers, a mean of 78 percent indicated the CAHSEE is very important to them. Eighteen percent reported the CAHSEE is somewhat important, and four percent reported the CAHSEE is not important to them. These results may not be surprising given the importance that principals and teachers attach to emphasizing the importance of the CAHSEE to their students.
In a separate item, principals reported actions their schools have taken to promote learning for all students (PR-32). Table 4.10 presents the percentage of principals who indicated that their schools have partially or fully implemented each action. Principals reported substantial changes in the implementation of certain measures from 2006 to 2007; as a result, responses are displayed for each sample separately as well as for the combined sample. As Table 4.10 demonstrates, from 2006 to 2007, several programs moved from partial to full implementation. Specifically, full implementation of CAHSEE preparatory courses increased from 52 percent in 2006 to 71 percent in 2007; full implementation of encouraging all students to take Algebra I increased from 80 percent in 2006 to 93 percent in 2007. These changes suggest that administrators are working to bring about full implementation of measures important for student learning. Partial implementation of student and parent support services also increased substantially from 2006 (41%) to 2007 (55%).
Page 144 Human Resources Research Organization (HumRRO)
Chapter 4: Principal and Teacher Survey Responses
Table 4.10. PR-32: Percentage of Principals Reporting Actions Implemented to Promote Learning for All Students
Activity Partially Implemented 2006 2007 Combined
Fully Implemented 2006 2007 Combined
School, teacher, and student access to appropriate instructional materials
21 18 19 77 82 80
Encourage all students to take Algebra I 14 4 9 80 93 87 Individual student assistance 41 46 43 48 50 49 CAHSEE prep classes to prepare students to take
the CAHSEE 41 18 30 52 71 61
Student and parent support services 41 55 48 23 27 25 Explanation of table contents: The percentage of principals who reported school, teacher, and student access to appropriate instructional materials was partially implemented in 2006 was 21 percent; in 2007, 18 percent; and in the combined sample, 19 percent. The percentage of principals who reported school, teacher, and student access to appropriate instructional materials was fully implemented in 2006 was 77 percent; in 2007, 82 percent; and in the combined sample, 80 percent.
Teachers also provided information about the activities they personally offered to help students succeed on the CAHSEE (T-16). As Table 4.11 indicates, the three most commonly endorsed activities were emphasizing the importance of the CAHSEE (90%), encouraging students to work hard and prepare (86%), and talking to their students about the CAHSEE (85%). The three activities that teachers most frequently rated as important were teaching test-taking skills (51%), emphasizing the importance of the CAHSEE (47%), and encouraging students to work hard and prepare (34%). Thus, none of the three activities that teachers rated most important focus on content; rather, they address motivation and test-taking strategies. For the 2007 sample, teachers indicated additional activities that they offered to help students succeed. Several teachers reported they participated in CAHSEE intervention classes, including CAMP CAHSEE, remediation classes, and after-school tutorial sessions. Additional teacher-reported activities to promote student success included collaborating with other teachers to create a curriculum, participating on item review committees, sending letters home to parents, and having students practice on released test items.
Human Resources Research Organization [HumRRO] Page 145
Independent Evaluation of the CAHSEE: Fourth Biennial Report
Table 4.11. T-16: Teachers’ Report of Activities Offered and Ranked Most Important for CAHSEE Preparation
Activity Percentage of
Teachers Reporting Activity
Undertaken
Percentage of Teachers
Ranking Activity Most Important
Emphasized importance of the CAHSEE 90 47 Encouraged students to work hard and prepare 86 34 Talked with my students 85 18 Taught test-taking skills 83 51 Provided individual/group tutoring 64 28 Increased classroom attention to content standards covered by the
CAHSEE in the weeks preceding the CAHSEE administration Modified my instruction
63
55
32
17 Used class test results to change instruction 53 19 Used class test results to design remedial instruction 41 14 Encouraged students (and through their parents) to take demanding 36 8
courses Administered “early warning” tests 30 7 Encouraged other teachers to include instructional activities that
incorporate ELA or math standards Talked or worked with parents
30
28
4
5 Added homework 25 3 Encouraged summer school attendance 22 2 Had students work with computers for remedial instruction 21 5 Suggested remedial classes rather than electives 21 4 Worked with feeder school teachers 7 3 No special preparation 4 -
Both teachers and principals reported the extent to which they believe content from the CAHSEE standards is covered in students’ courses. The majority (71% ELA; 69% math) of teachers in both ELA (T-11) and math (T-12) indicated that almost all content standards in their primary areas were covered in the current curriculum. Tables 4.12a and 4.12b, respectively, display ELA and math teachers’ responses regarding the coverage of the content standards under the current curriculum since 2001. Content coverage has increased substantially since 2004; more ELA and math teachers reported covering almost all of the content standards in their primary subject areas under the current curriculum.
Page 146 Human Resources Research Organization (HumRRO)
Chapter 4: Principal and Teacher Survey Responses
Table 4.12a. T-11: Percentage of Teachers Indicating Coverage of ELA Standards by Curriculum Coverage of Standards 2001 2002 2003 2004 2006/07 Almost all 60 54 57 57 71 About ¾ 20 28 28 22 16 About ¼–½ 11 13 15 6 5 Less than ¼ 6 4 0 3 0 No knowledge of standards 3 1 0 12 8
Table 4.12b. T-12: Percentage of Teachers Indicating Coverage of Mathematics Standards by Curriculum Coverage of Standards 2001 2002 2003 2004 2006/07 Almost all 57 72 64 55 69 About ¾ 14 17 13 13 16 About ¼–½ 16 9 16 11 9 Less than ¼ 5 3 4 0 4 No knowledge of standards 8 0 4 21 2
Principals reported the proportion of 10th-grade students who received instruction covering the ELA (PR-28) and math (PR-29) content standards appears to be increasing steadily over time. In addition to all 10th-grade students, the survey asked principals to indicate the proportion of students from several special populations that received instruction covering the ELA and math content standards. Tables 4.13a and 4.13b, respectively, compare the results from the 2006/07 combined sample with results from the previous longitudinal surveys. Principals reported substantial increases in both ELA and math content coverage from 2004 to 2006/07; in both subject areas, the percentage of principals who indicated that greater than 95 percent of students received instruction covering the content standards in their current curriculum showed marked gains.
Human Resources Research Organization [HumRRO] Page 147
Independent Evaluation of the CAHSEE: Fourth Biennial Report
Table 4.13a. PR-28: Principals’ 2001–06/07 Estimates of the Percentage of Students with Instruction on ELA Content Standards Student Group Percentage 2001 2002 2003 2004 2006/07
All 10th-grade students Greater than 95% 16 43 34 49 72
75–95% 36 23 39 30 24 50–74% 27 25 24 21 1
Fewer than 50% 21 9 3 0 2
10th graders with disabilities in SDC* Greater than 95% 12 26 16 35 43
75–-95% 22 14 23 16 30 50–74% 24 24 10 26 14
Fewer than 50% 42 36 52 23 14
10th graders with disabilities in RSP* Greater than 95% N/A N/A 25 41 62
75–95% N/A N/A 31 19 26 50–74% N/A N/A 22 34 10
Fewer than 50% N/A N/A 22 6 2
10th grade English Learners Greater than 95% 8 28 34 34 54
75–95% 18 15 39 16 26 50–74% 18 30 24 28 13
Fewer than 50% 56 28 3 22 7 *Note: The 2003, 2004, 2006, and 2007 surveys separated students with disabilities into two sub-categories: students with disabilities in Special Day Classes (SDC) and students with disabilities in Resource Specialist Programs (RSP). The 2001 and 2002 surveys had one overall category.
Explanation of table contents: The first line of the table indicates that, for all 10th-grade students, the percentage of principals who indicated that greater than 95 percent of students received instruction on all ELA content standards was 16 percent in 2001, 43 percent in 2002, 34 percent in 2003, 49 percent in 2004, and 72 percent in the combined 2006/07 sample.
Page 148 Human Resources Research Organization (HumRRO)
Chapter 4: Principal and Teacher Survey Responses
Table 4.13b. PR-29: Principals’ 2001–06/07 Estimates of the Percentage of Students with Instruction on Math Content Standards Student Group Percentage 2001 2002 2003 2004 2006/07
All 10th-grade students Greater than 95% 9 22 33 49 66
75–95% 43 30 35 36 27 50–74% 17 26 23 12 6
Fewer than 50% 31 22 10 3 2
10th graders with disabilities in SDC* Greater than 95% 5 14 9 30 40
75–95% 23 19 19 10 29 50–74% 28 21 19 30 14
Fewer than 50% 44 45 53 30 17
10th graders with disabilities in RSP* Greater than 95% N/A N/A 14 34 56
75–95% N/A N/A 30 22 28 50–74% N/A N/A 27 38 13
Fewer than 50% N/A N/A 30 6 3
10th grade English Learners Greater than 95% 6 22 28 34 52
75–95% 29 22 22 19 33 50–74% 15 32 28 38 9
Fewer than 50% 50 24 22 9 6 *Note: The 2003, 2004, 2006, and 2007 surveys separated students with disabilities into two sub-categories: students with disabilities in Special Day Classes (SDC) and students with disabilities in Resource Specialist Programs (RSP). The 2001 and 2002 surveys had one overall category.
On the Student Questionnaire, students also reported the amount of CAHSEE content covered in their coursework. Among first-time test-takers, 51 percent reported all topics on the CAHSEE were covered in their courses. Forty-two percent of students reported most, but not all (two-thirds or more) of topics were covered in courses they had taken. Only seven percent of students indicated many topics on the test were not covered (less than two-thirds) in courses they had taken.
Students also indicated the extent to which items on the CAHSEE matched questions from their classroom tests or homework assignments in terms of type and difficulty. Among all first-time test-takers, 41 percent of students indicated all items on the test were similar to questions on homework assignments or classroom tests. Forty-
Human Resources Research Organization [HumRRO] Page 149
Independent Evaluation of the CAHSEE: Fourth Biennial Report
eight percent of students reported a few CAHSEE items were of different types, and 12 percent indicated many CAHSEE items were different. In terms of difficulty between CAHSEE items and classroom tests or homework, 51 percent of first-time test-takers reported items on the CAHSEE were about equally difficult. Thirty-two percent of students reported CAHSEE items were generally easier, and 18 percent of students indicated CAHSEE items were generally more difficult. Although results were mixed, few students felt most CAHSEE items were unfamiliar or more difficult than their classroom homework or test questions.
Both teachers and principals responded to items about students’ general awareness of and readiness for the CAHSEE. Principals reported the aspects of the CAHSEE with which they believed students were familiar (PR-6). All principals who responded to this item indicated students had at least some knowledge of the CAHSEE. Specifically, 96 percent of principals reported students knew what knowledge and skills were covered on the exam, 92 percent of principals indicated students were aware of the times of the year that the CAHSEE was administered, 88 percent reported students knew which students had the opportunity to take the exam, and 12 percent of principals reported students had only general information about the exam.
Principals estimated the percentage of students (PR-7) and parents (PR-8) in their schools who are aware of the knowledge and skills covered on the CAHSEE. Estimated percentages of student awareness in the combined 2006/07 sample ranged from 10 to 100 percent, with a mean of 83 and a median of 90 percent. This percentage is a substantial gain from 2004, when this item was first administered and principals indicated that, on average, 69 percent of students were aware. Percentages of parent awareness reported by principals demonstrated continual mean increases from 2004 (44%), to 2006 (53%; median 50%), to 2007 (61%; median 60%). On average, principals from the combined 2006/07 samples estimated that 57 percent (median 60%) of parents were aware of the knowledge and skills covered on the CAHSEE.
Finally, teachers rated how well prepared they believed 10th graders were to pass the CAHSEE (T-13). Because responses differed substantially from 2006 to 2007, results are presented separately for 2006 and 2007. As Table 4.14 shows, substantially more teachers rated 10th-grade students in their schools as very well prepared to pass the CAHSEE in 2007 (30%) than in 2006 (14%). In addition, no teachers in 2007 indicated students were not at all prepared, and only 6 percent indicated students were not well prepared. One percent of teachers in 2006 indicated students were not at all prepared and 14 percent of teachers indicated students were not well prepared. Table 4.14 also contains teacher response data for this item dating back to 2000. Teachers reported a consistent upward trend in levels of student preparation since 2000 continuing through 2007. During the first administration of the longitudinal survey in 2000, 55 percent of teachers indicated students were not at all prepared or were not well prepared to pass the CAHSEE; only 12 percent of teachers indicated students were well prepared or were very well prepared to pass. In 2007, however, only 6 percent of teachers reported students were not at all prepared or were not well prepared to pass
Page 150 Human Resources Research Organization (HumRRO)
Chapter 4: Principal and Teacher Survey Responses
the CAHSEE, whereas 59 percent reported students were well prepared or were very well prepared to pass.
Table 4.14. T-13: Teachers’ Ratings of Preparedness of Students in the 10th Grade (Percentages)
Preparedness 2000 2001 2002 2003 2004 2006 2007 Very well prepared Well prepared Prepared Not well prepared Not at all prepared
2 10 33 50 5
3 17 47 28 5
5 15 38 39 3
5 21 44 26 4
8 25 37 28 2
14 34 36 14 1
30 29 35 6 0
Examination of the CAHSEE performance data reveals teachers’ reports of their students’ level of preparedness matches well with test performance. On the ELA portion of the CAHSEE, 86 percent of teachers from schools in the High performance category rated their students as well prepared or very well prepared; the percentage of teachers rating their students as well prepared or very well prepared dropped to 65 percent for the Moderate category, 31 percent for the Low category, and 0 percent for the Very Low category. Results were similar on the math test, where the percentage of teachers who rated their students as well prepared or very well prepared was 83 percent in the High category, 66 percent in the Moderate category, 28 percent in the Low category, and 0 percent in the Very Low category. These data indicate teachers are good judges of their students’ level of preparedness for success on the CAHSEE.
Teacher Knowledge and Preparedness
Through a series of items, the longitudinal surveys also explored teacher knowledge of and preparedness for the CAHSEE. One item for principals and four items for teachers examined the availability and quality of products, programs, and services to help prepare teachers to provide their students with the knowledge and skills necessary to pass the CAHSEE. Principals reported the extent to which their schools had implemented services to help teachers and administrators prepare their students (PR-32). Table 4.15 displays the activities and supports that principals indicated were partially or fully implemented in their schools. Unlike services and supports to help prepare students to pass the CAHSEE, increases in implementation of programs to support teachers were not observed. Rather, one tool for teachers and administrators, access to in-service training for working with diverse student populations and different learning styles, was reported as fully implemented by substantially fewer principals in 2007 (28%) than in 2006 (39%).
Human Resources Research Organization [HumRRO] Page 151
Independent Evaluation of the CAHSEE: Fourth Biennial Report
Table 4.15. PR-32: Percentage of Principals Reporting Actions Implemented to Promote Learning for All Students
Teacher and school support services 41 49 45 43 47 45 Teacher access to in-service training on content
standards 34 39 36 57 52 55
Teacher access to in-service training on instructional techniques
Administrator and teacher access to in-service training for working with diverse student populations and different learning styles
41
46
42
56
41
51
48
39
47
28
47
33
Explanation of table contents: The first line of the table indicates that the percentage of principals who reported that teacher and school support services were partially implemented in 2006 was 41 percent; in 2007, 49 percent; and in the Combined sample, 45 percent. The percentage of principals who reported that teacher and school support services were fully implemented in 2006 was 43 percent; in 2007, 47 percent; and in the Combined sample, 45 percent.
Teachers responded to a series of items gauging their level of knowledge and preparedness for helping students succeed on the CAHSEE. They first indicated how useful they found the CDE website (T-9) and the CAHSEE Teacher Guide (T-10). As Table 4.16 shows, 36 percent of teachers reported being unfamiliar with the CDE website as a resource for the CAHSEE, and 18 percent of teachers reported being unfamiliar with the CAHSEE Teacher Guide. Of the teachers who were familiar with these resources, 49 percent found the CDE website somewhat or very useful and 65 percent found the CAHSEE Teacher Guide somewhat or very useful. Only 3 percent of teachers familiar with the CDE website found it not at all useful, and only 2 percent of teachers found the Teacher Guide not useful. Because teachers who were familiar with these resources usually rated them as somewhat useful or very useful, ensuring that all teachers are familiar with these resources might be a worthwhile endeavor in supporting success on the CAHSEE.
Table 4.16. T-9, T-10: Teacher Ratings of Usefulness of CAHSEE Resources (Percentages) Rating CDE Website CAHSEE Teacher Guide Very useful 19 30 Somewhat useful 30 35 Slightly useful 12 15 Not at all useful 3 2 I am not familiar with this resource 36 18
Teachers also rated the quality of state and local professional development activities related to the CAHSEE they received in the current year (T-15). Table 4.17 presents teacher ratings of state and local CAHSEE-related professional development activities since 2002, the first year this item was administered. Quality ratings for
Page 152 Human Resources Research Organization (HumRRO)
Chapter 4: Principal and Teacher Survey Responses
professional development services have remained fairly consistent over time. Further, local professional development was consistently rated more highly than state professional development, with 48 percent of teachers in the combined 2006/07 sample rating local professional development activities as excellent or good and 31 percent rating state professional development activities as excellent or good. More than one-third of teachers (36%) in the 2006/07 sample indicated they had not received any state-provided professional development activities related to the CAHSEE; 23 percent indicated they had not received any locally provided CAHSEE-related professional development.
Table 4.17. T-15: Teachers’ Quality Ratings of Local and State Professional Development Experiences (Percentages)
Note: 2002 survey did not offer “None” as a response option.
Explanation of table contents: The first line of the table indicates that the percentage of teaches who rated the quality of professional development from local sources as excellent was 6 percent in 2002, 14 percent in 2003, 9 percent in 2004, and 14 percent in the combined 2006/07 sample. The percentage of teachers who rated the quality of professional development from state sources as excellent was 2 percent in 2002, 2 percent in 2003, 4 percent in 2004, and 4 percent in the combined 2006/07 sample.
CAHSEE student performance data from 2007 seem to suggest that state professional development might be tied to student success; 57 percent of ELA teachers and 60 percent of math teachers whose schools were in the Very Low pass category on the tests reported not receiving any state professional development. By contrast, only 40 percent of ELA teachers and 38 percent of math teachers whose schools were in the High pass category reported not receiving any state professional development.
Finally, teachers provided estimates of the amount of time they spent on classroom instruction preparation activities related to the CAHSEE, such as department planning or lesson plan review (T-14a). The amount of time reported varied considerably. Only 5 percent of teachers indicated that they did not spend any time in these preparation activities; 23 percent reported less than 6 hours, 28 percent reported 6–15 hours, 21 percent reported 16–35 hours, and 23 percent reported more than 35 hours. These reported hours are quite similar to the number of hours teachers reported in the 2004 longitudinal survey, the first time this item was administered.
Human Resources Research Organization [HumRRO] Page 153
Independent Evaluation of the CAHSEE: Fourth Biennial Report
CAHSEE and Content Standards
Principals responded to a series of items regarding the content standards covered by the CAHSEE. These items explore such areas as relationships between the state and district standards, alignment of the standards with the curriculum, and teacher use of the content standards in instruction. Items from the Student Questionnaire also explored the extent to which students believed CAHSEE content was covered in their courses and was aligned with the curriculum.
First, principals indicated whether their districts adopted the state content standards for both ELA (PR-9) and math (PR-10), or, if not, whether their district standards were more or less inclusive than the state standards. Table 4.18 presents the results for both ELA and math content standards. A clear majority of principals (80% for ELA and 79% for math) indicated they adopted the state content standards. Of principals who reported their districts had not adopted the state content standards, most indicated their district standards included more than the state standards. Only 3 percent reported that state ELA standards included more than their district standards, and only 4 percent indicated the state math standards included more than their district standards.
Table 4.18. PR-9, PR-10: Principals’ Responses on Relationships between State and District Standards (Percentages) Response ELA Math District has adopted the state standards 80 79 State content standards include more than district standards 3 4 District content standards include more than state standards 17 17 Cannot judge the relationship 0 0
The survey asked principals to consider alignment and implementation of the state content standards in a variety of ways (PR-11). Table 4.19 displays principal responses since 2000, the first year in which this item was administered. Because of substantial changes in responses from 2006 and 2007, data are reported separately for each year. Generally, principal responses from 2007 followed trends of increasing alignment over time. In two areas, principals reported decreased preparations from 2006 to 2007: (a) having plans to ensure that all pre-high school students are prepared to receive instruction in each content standard (51% in 2006 to 32% in 2007) and (b) having a plan to ensure all high school students receive instruction in each content standard (84% in 2006 to 62% in 2007). Decreases in response rates for these items might indicate an actual reduction in the number of schools implementing those programs, or they might represent preparations that have become so routine they are no longer considered distinct preparations. For instance, the likely reason for the slight decreases in the number of principals who indicated that their schools are in the process of aligning their standards is that those schools have completed alignment activities.
Page 154 Human Resources Research Organization (HumRRO)
Chapter 4: Principal and Teacher Survey Responses
Table 4.19. PR-11: Principals’ Reported Percentages of Preparations for District Alignment with California Content Standards Preparation District encourages use of the content standards to
organize instruction Textbooks align well with content standards
Math ELA
Have plan to ensure all high school students receive instruction in each content standard
Hiring only teachers certified in their field Assigning teachers only in their certified field Cover all content standards with a mix of textbooks and
supplemental materials Have plans to ensure that all pre-high school students are
prepared to receive instruction in each of the content standards
In process of aligning curriculum across grade levels In process of aligning curriculum with state content
*2006 responses recomputed with more consistent treatment of omitted responses. Note: N/A indicates a question was not asked in a given survey year.
Principals also responded to a series of items about teachers’ use of the content standards. Principals estimated the percentage of teachers who have copies of the California Standards Tests (CST)/CAHSEE blueprints (PR-16) and the percentage of teachers who use the blueprints for lesson planning (PR-17). Because results differed substantially from 2006 to 2007, results from the two years are reported separately as well as for the combined sample (see Table 4.20). Overall, results indicated that fewer principals in the 2007 sample reported widespread possession and use of the blueprints among their teachers than did principals in the 2006 sample.
Human Resources Research Organization [HumRRO] Page 155
Independent Evaluation of the CAHSEE: Fourth Biennial Report
Table 4.20. PR-16, PR-17: Percentage of Principals Reporting Teachers Have and Use CST/CAHSEE Blueprints
Explanation of table contents: The first line of the table indicates that the percentage of principals who reported that fewer than 50 percent of teachers have copies of the CST/CAHSEE blueprints was 16 percent in 2006, 32 percent in 2007, and 24 percent in the combined sample. The percentage of principals who reported that fewer than 50 percent of teachers use the CST/CAHSEE blueprints for lesson planning was 27 percent in 2006, 43 percent in 2007, and 35 percent in the combined sample.
Finally, the survey asked principals what evidence they collected for ELA and mathematics teachers to show that those teachers are “teaching to the standards” (PR-18). In the combined 2006/07 sample, results are similar for ELA and math teachers. As Table 4.21 demonstrates, the types of evidence that principals gather most frequently to verify that teachers in both subject areas are teaching to the content standards are classroom visits/walk-throughs or other informal interactions (92%, ELA and math); discussions at faculty meetings (89% ELA, 88% math); goal setting and other individual conferences (79%, ELA and math); and teacher-generated instructional and assessment materials (79%, ELA and math). Principals reported collecting evidence that teachers are teaching to the standards at high rates across all responses, suggesting this might be a priority for principals.
Table 4.21. PR-18: Percentage of Principals Who Gather Evidence That ELA and Math Teachers Are Teaching to the Standards Types of Evidence ELA Teachers Math Teachers Classroom visits—walk-through or other informal interactions Discussions at faculty meeting Goal setting and other individual conferences Teacher-generated instructional and assessment materials Reports from department chairs or others responsible for supervising
instruction
92 89 79 79 74
92 88 79 79 75
School or district level in-service 73 74
Impact of the CAHSEE
Items examining the impact of the CAHSEE on students, parents, and instruction were administered to both teachers and principals. Results are presented separately for each of these three major areas.
Impact of the CAHSEE on Students
Page 156 Human Resources Research Organization (HumRRO)
Chapter 4: Principal and Teacher Survey Responses
Overall, both teachers and principals indicated primarily positive impacts of the CAHSEE on student motivation, even for students who do not pass the exam on their first attempt. To examine the impact of the CAHSEE on student motivation, the same set of questions was asked of teachers (T-18a–c) and principals (PR-26a–c). Teachers and principals reported their predicted impact of the CAHSEE on students who took the test for the first time, on students who had passed the CAHSEE on their first attempt, and on students who did not pass the CAHSEE on their first attempt. Tables 4.22a–c show principal and teacher expectations of the impact of the CAHSEE on each student group dating back to 2000, the first year in which the item was administered. Overall, estimated impact of the CAHSEE has varied over time, but both teacher and principal responses have been largely neutral or positive since 2002. Teachers’ positive responses tended to increase more than principals’ over the last year; that is, teachers reported more optimism about the impact of the CAHSEE since 2006.
Human Resources Research Organization [HumRRO] Page 157
Independent Evaluation of the CAHSEE: Fourth Biennial Report
Table 4.22a. PR-26, T-18: Teachers’ and Principals’ Estimated Impact of the CAHSEE on Student Motivation Prior to Taking the Exam for the First Time (Percentages)
No effect 28 35 29 25 31 22 21 19 29 20 13 22 7 11 Decreased 35 16 3 9 5 1 0 17 20 0 8 0 2 2 Strongly decreased 8 4 1 2 1 1 0 17 4 0 0 0 0 2 Explanation of table contents: The first line of the table indicates that, regarding the impact of the CAHSEE on student motivation prior to taking the CAHSEE, the percentage of teachers who rated motivation as strongly increased was 4 percent in 2000, 4 percent in 2001, 6 percent in 2002, 6 percent in 2003, 7 percent in 2004, 10 percent in 2006, and 17 percent in 2007. The percentage of principals who rated motivation as strongly increased was 2 percent in 2000, 4 percent in 2001, 11 percent in 2002, 24 percent in 2003, 25 percent in 2004, 43 percent in 2006, and 33 percent in 2007.
Table 4.22b. PR-26, T-18: Teachers’ and Principals’ Estimated Impact of the CAHSEE on Students Who Pass on Their First Attempt (Percentages)
Page 158 Human Resources Research Organization (HumRRO)
Chapter 4: Principal and Teacher Survey Responses
Impact of the CAHSEE on Parents
Principals (PR-26d–f) and teachers (T-18d–f) answered the same set of questions examining the impact of the CAHSEE on parental involvement and predicting the impact of the CAHSEE on parental involvement for parents of students who (a) took the test for the first time, (b) passed the CAHSEE, and (c) did not pass the CAHSEE. Tables 4.23a–c show principal and teacher expectations of the impact of the CAHSEE on parental involvement for parents of each student group dating back to 2000, the first year in which the item was administered. As with their estimates for the impact on student motivation, teacher and principal estimates of the impact of the CAHSEE on parental involvement for parents of students in all three groups were primarily neutral or positive; few teachers and principals indicated they believed the CAHSEE had a negative impact on parental involvement. Although trends are mixed, the 2007 data do not demonstrate a clear pattern of increased optimism for either principals or teachers. In fact, responses suggest that some principals might be slightly less positive about the impact of the CAHSEE on parental involvement than they were in 2006.
Human Resources Research Organization [HumRRO] Page 159
Independent Evaluation of the CAHSEE: Fourth Biennial Report
Table 4.23a. PR-26, T-18: Teachers’ and Principals’ Estimated Impact of the CAHSEE on Parental Involvement for Parents of Students Who Have Not Yet Taken the CAHSEE (Percentages)
Strongly increased 3 3 N/A N/A N/A 3 2 0 5 7 3 6 7 7 Increased 23 28 N/A N/A N/A 31 36 32 23 39 29 32 43 39 No effect 54 61 N/A N/A N/A 63 58 56 68 52 63 62 50 52 Decreased 14 7 N/A N/A N/A 2 5 7 3 2 3 0 0 2 Strongly decreased 6 1 N/A N/A N/A 2 0 5 3 0 3 0 0 0 Explanation of table contents: The first line of the table indicates that, regarding the impact of the CAHSEE on parental involvement for parents of students who have not yet taken the CAHSEE, the percentage of teachers who rated involvement as strongly increased was 3 percent in 2000, 3 percent in 2001, 3 percent in 2006, and 2 percent in 2007. This item was not administered to teachers in 2002–04. The percentage of principals who rated involvement as strongly increased was 0 in 2000, 5 percent in 2001, 7 percent in 2002, 3 percent in 2003, 6 percent in 2004, 7 percent in 2006, and 7 percent in 2007.
Table 4.23b. PR-26, T-18: Teachers’ and Principals’ Estimated Impact of the CAHSEE on Parental Involvement for Parents of Students Who Pass the CAHSEE (Percentages)
Table 4.23c. PR-26, T-18: Teachers’ and Principals’ Estimated Impact of the CAHSEE on Parental Involvement for Parents of Students Who Do Not Pass the CAHSEE (Percentages)
Page 160 Human Resources Research Organization (HumRRO)
Chapter 4: Principal and Teacher Survey Responses
Impact of the CAHSEE on Instruction
A series of teacher and principal items explored the impact of the CAHSEE on instruction. Teachers indicated the amount of time they spent in classroom instruction and preparing for the CAHSEE. Principals indicated the extent to which the CAHSEE draws resources away from educational arenas outside of the CAHSEE content standards. Principals also indicated which aspects of the CAHSEE score report were most useful. Both principals and teachers reported their perceptions of whether teachers of subjects other than ELA and math viewed themselves as being responsible for student success on the CAHSEE. Finally, both principals and teachers indicated the impact they believe the CAHSEE has had on instructional practices.
Table 4.24 demonstrates teacher ratings of time spent on classroom instruction activities specifically related to the CAHSEE (T-14b) and of total time spent on CAHSEE-related activities in the combined 2006/07 sample (T-14c). Most teachers (86%) reported spending 15 or fewer hours; 24 percent indicated that they did not spend any time in classroom instruction activities that they would not have undertaken if not for the CAHSEE. This result suggests that, for most teachers, the CAHSEE might not have a tremendous impact on the classroom activities they conduct. A majority of teachers (70%) also indicate spending 15 or fewer total hours on CAHSEE-related activities, such as faculty and department meetings or staff development, throughout the course of the year. Further, 5 percent of teachers indicated they did not spend any time on CAHSEE-related activities during the year. The impact of the CAHSEE on total teacher activities throughout the year clearly varies for different teachers.
Table 4.24. T-14: Teacher Time Spent in CAHSEE-Related Classroom Instruction and Total CAHSEE-Related Activities (Percentages)
Amount of time Spent CAHSEE-Related Classroom Instruction
Total Time in CAHSEE-Related Activities
More than 35 hours 7 11 16–35 hours 7 19 6–15 hours 27 29 Less than 6 hours 35 36 None 24 5
Principals also indicated the total amount of time they spent in CAHSEE-related activities such as meetings, curriculum review, and professional development throughout the year (PR-15). Principals in the 2007 sample indicated they spent considerably less time on CAHSEE-related activities than did principals in the 2006 sample. For instance, in 2006, 59 percent of principals indicated that they spent more than 35 hours in CAHSEE-related activities, whereas in 2007 only 36 percent of principals indicated spending more than 35 hours. Likewise, in 2007, 38 percent of principals reported spending 15 or fewer hours on CAHSEE-related activities, whereas in 2006 only 11 percent of principals reported spending 15 or fewer hours. Given the drop in time spent from 2006 to 2007, principals may have conducted additional
Human Resources Research Organization [HumRRO] Page 161
Independent Evaluation of the CAHSEE: Fourth Biennial Report
activities in 2006 because this was the first year the CAHSEE was a graduation requirement.
To determine the impact of the CAHSEE on instruction in areas outside the core CAHSEE content, principals were asked to indicate the extent to which the CAHSEE draws resources away from other educational arenas (PR-25). According to principals from the combined 2006/07 sample, the CAHSEE most frequently draws resources away from arts courses and least frequently draws resources away from advanced courses (see Table 4.25). For all course categories except advanced courses, more than half the principals reported the CAHSEE draws resources away to at least some extent. Three principals also reported in the “Other” category that the CAHSEE draws resources away from elective courses.
Table 4.25. PR-25: Principals’ Reports of the Extent to Which the CAHSEE Draws Resources Away From Various Categories of Courses (Percentages)
Course Type Not At All To a Slight Extent
To a Moderate Extent
To a Great Extent
Courses in the arts 37 29 24 10 Vocational courses 42 26 19 13 Courses in other academic subject areas Advanced courses
44 64
25 19
25 9
6 8
Principals were asked to indicate which aspects of the individual and group CAHSEE score reports were most useful (PR-12). Of the principals in the combined sample, the greatest percentage (32%) indicated that usefulness for instruction was the most helpful, followed by ease of understanding (29%), timeliness (16%), and comprehensiveness (14%). Nine percent of principals responded they had not seen a CAHSEE score report. These results suggest that many principals are attempting to use CAHSEE results to impact instruction in their schools.
Two common items were administered to both principals and teachers to gauge the impact of the CAHSEE on instruction. First, teachers (T-17) and principals (PR-19) were asked to indicate the extent to which they believed teachers other than ELA and math teachers viewed themselves to be responsible for student success on the CAHSEE. Table 4.26 presents principal and teacher responses to this item since 2002, the first year in which the item was administered. Interestingly, from 2006 to 2007, principals responded at a much higher rate that teachers other than ELA and math view themselves as very responsible for student success (23% in 2006 to 41% in 2007). Over the same timeframe, however, teacher respondents indicated they believed other teachers viewed themselves as very responsible for student success at a much lower rate (46% in 2006 to 20% in 2007). Similarly, substantially more teachers in 2007 (48%) indicated they believed other teachers viewed themselves as not responsible or slightly responsible for student success than in 2006 (19%). Over the same period, principal ratings of other teachers viewing themselves as not responsible or slightly responsible dropped from 19 percent in 2006 to 15 percent in 2007. There appears to be some disconnect in 2007 between teachers and principals regarding the extent to which
Page 162 Human Resources Research Organization (HumRRO)
Chapter 4: Principal and Teacher Survey Responses
teachers of subjects other than ELA and math view themselves as responsible for student success on the CAHSEE. Interestingly, the 2007 results more closely resemble 2004 responses. The 2006 responses emerge as aberrant, perhaps because it was the first year in which the CAHSEE became a student graduation requirement.
Table 4.26. PR-19, T-17: Respondent Ratings of How Teachers Other than ELA and Math View Themselves as Responsible for Student Success
Explanation of table contents: The first line of this table indicates that the percentage of principals indicating other [non-math or ELA] teachers view themselves as very responsible for student performance on the CAHSEE was 11 percent in 2002, 22 percent in 2003, 41 percent in 2004, 23 percent in 2006, and 41 percent in 2007. The percentage of teachers who responded very responsible was 10 percent in 2002, 16 percent in 2003, 10 percent in 2004, 46 percent in 2006, and 20 percent in 2007.
The survey asked both principals (PR-27) and teachers (T-20) to rate the influence of the CAHSEE on instructional practices (Table 4.27). Both respondent groups reported more beneficial impact on instruction in 2007 than in 2006; the percentage of principals who rated the impact on instructional practices as considerably improved or improved was 75 percent in 2006 and 83 percent in 2007. The percentage of teachers who rated instruction as considerably improved or improved increased from 66 percent in 2006 to 75 percent in 2007. Although ratings of effect on instructional practices generally improved from 2006 to 2007, there was also a small increase in the number of respondents who indicated the CAHSEE weakened or considerably weakened instructional practices. Overall, however, ratings of the impact of the CAHSEE appear to be trending positive.
Human Resources Research Organization [HumRRO] Page 163
Independent Evaluation of the CAHSEE: Fourth Biennial Report
Table 4.27. PR-27, T-20: Principal and Teacher Ratings of CAHSEE Influence on Instructional Practices (Percentages)
Teacher Effect on Instructional Practices Principal 2006 2007 Combined 2006 2007 Combined
Principal ratings of the influence of the CAHSEE on instructional practices were compared with the Spring 2007 CAHSEE performance data. Interestingly, results indicated that principals in the schools with lower-performing students on the ELA test reported the CAHSEE considerably improved their instructional practices (High: 0%; Moderate: 19%; Low: 25%; Very Low: 25%). Results in this area must be interpreted with caution, however, because only four principals had schools that were in the Very Low performance category. Teachers’ ratings followed a similar trend. Of the teachers whose schools were in the High category on the ELA test, 58 percent indicated the CAHSEE improved or considerably improved instructional practices; this percentage increases to 68 percent for the Moderate category, 74 percent for the Low category, and 79 percent for the Very Low category. Teacher ratings based on performance on the math test were quite similar. Overall, these results suggest teachers and schools with lower-performing students might experience improvement to their instructional methods based on CAHSEE results.
CAHSEE as a Graduation Requirement
In light of the CAHSEE being implemented as a high-stakes student graduation requirement, the largest block of items on the teacher and principal longitudinal surveys pertains to the CAHSEE as a graduation requirement. Items in this section address a variety of aspects, from identifying students at risk of not passing the CAHSEE to providing programs and supports for students who fail. These items also address supports in place to help special populations participate in and succeed on the CAHSEE. Alternatives to graduation are examined for struggling students, as are participation rates in those graduation alternatives. Additionally, because the first round of CAHSEE graduation data was available when the 2007 longitudinal surveys were administered, a few items address actual student pass rates based on the CAHSEE requirement. Finally, both principals and teachers rated the impact they believe the CAHSEE has on student retention and dropout rates. For ease of interpretation, items in this section are presented in three subsections: factors impacting CAHSEE performance, options and supports for struggling students and special populations, and graduation rates under the high-stakes CAHSEE. Student Questionnaire results from the 2007 CAHSEE administration are included to provide student perspectives on the CAHSEE as a graduation requirement. An additional section presents the Spring 2007 CAHSEE performance data, which examine the impact of various factors on student success.
Page 164 Human Resources Research Organization (HumRRO)
Chapter 4: Principal and Teacher Survey Responses
Factors Impacting CAHSEE Performance
A common item on the principal (PR-30) and teacher surveys (T-19) addresses the extent to which various factors impacted success on the CAHSEE. Although this item has been administered to principals since 2001, it was administered to teachers for the first time in 2007. Table 4.28 shows teachers and principals endorsed different factors as having a definite impact on student success. In 2007, principals most frequently indicated language barriers (70%), followed by poor attendance (52%), lack of preparation needed to pass (30%), and lack of motivation (28%). Among principals, rates regarding both lack of preparation needed to pass and motivation changed substantially from 2006 to 2007; more principals indicated lack of preparation is definitely a factor and fewer principals indicated that motivation is a factor.
Table 4.28. PR-30, T-19: Percentage of Principals and Teachers Indicating Factors Definitely Affecting Student Success on the CAHSEE
Principals Teachers Factor 2001 2002 2003 2004 2006 2007 2007 Language barriers 39 50 62 58 61 70 54 Poor attendance 67 61 68 62 55 52 64 Lack of preparation needed to pass 48 42 54 41 18 30 47 Lack of motivation 47 43 57 59 43 28 60 Too many tests to prepare for 53 48 47 23 16 15 22 Lack of credentialed math teachers N/A N/A 5 6 2 4 12 Lack of credentialed ELA teachers N/A N/A 0 0 0 0 10
Explanation of table contents: The first line of the table indicates that the percentage of principals who indicated language barriers are definitely a factor affecting student success was 39 percent in 2001, 50 percent in 2002, 62 percent in 2003, 58 percent in 2004, 61 percent in 2006, and 70 percent in 2007. The percentage of teachers who indicated language barriers are definitely a factor was 54 percent in 2007, the first year in which the item was administered.
Teachers most frequently rated poor attendance as a factor definitely impacting student success (64%), followed by lack of motivation (60%), language barriers (54%), and lack of preparation needed to pass (47%). Neither teachers nor principals consistently indicated a lack of credentialed teachers was a factor with a definite impact on student success, although teachers endorsed these responses at higher rates than principals. Principals and teachers could indicate in an open-ended option other factors that had an impact on students meeting the CAHSEE requirements. Teachers noted additional factors might include poor testing environments, lack of school support or preparatory materials, weak educational history, time constraints, and insufficient services for special education students and English Learners. Principals noted language barriers of math teachers, special education needs, Saturday courses, CAHSEE preparation courses, and parent and student counseling as additional factors in whether students passed.
Human Resources Research Organization [HumRRO] Page 165
Independent Evaluation of the CAHSEE: Fourth Biennial Report
For the same item, principals (PR-30) and teachers (T-19) in the 2007 samples were asked to rank the factors they believed to have the greatest impact on student success. Although principals and teachers selected the same three factors as having the greatest impact on student success, these items were ranked in opposite order. Principals rated the top three factors with the greatest impact as language barriers (49%), poor attendance (22%), and lack of motivation (12%). Teachers rated the top three factors as lack of motivation (26%), poor attendance (23%), and language barriers (21%).
The Student Questionnaire collected students’ input regarding their performance on the CAHSEE. Among first-time test-takers, 87 percent of students reported they did as well as they could on the CAHSEE; the remaining thirteen percent of students indicated they did not do as well as they could have. These students indicated reasons they did not do as well as they could have on the CAHSEE. Across subject areas, the most common reason students reported was they were too nervous (30%), they were not motivated to do well (17%), conditions in the testing room made it difficult to concentrate (11%), and they did not have enough time (6%). Twenty-eight percent of students reported some additional factor interfered with their performance. One response differed across subject areas—39 percent of students who took the math test and 23 percent of students who took the ELA test reported they did not do as well as they could have because, although they had covered the material in classes, they could not remember how to answer related questions on the CAHSEE.
Teachers (T-21) and principals (PR-35) responded to an open-ended item about specific benefits and challenges for their schools and students regarding success on the CAHSEE. Table 4.29 summarizes teacher responses of challenges and benefits, as well as recommendations to improve schools and student performance. Teachers indicated the most critical challenge is instructing students who are not proficient in English or who have low-level reading and math skills. Teachers rated CAHSEE support classes as most beneficial. To improve student success, teachers recommended providing students with a thorough review of foundational math concepts and requiring teachers to prepare curricula aligned with content standards. Principals also listed benefits, challenges, and recommendations. Regarding benefits in their schools, principals noted CAHSEE preparatory courses were effective tools and indicated the CAHSEE results provide them with information to identify student groups in need of additional academic support. Principals noted that the logistics of administering the assessment is a major challenge. They reported schools are experiencing high turnover, especially among migrant populations. In addition, schools are struggling to staff classes with qualified and credentialed ELA and math teachers; credentialed teachers are essential for CAHSEE preparation course instruction. Finally, principals offered a few recommendations to improve student success, including decreased class size, increased instructional time, and use of CAHSEE preparatory programs.
Page 166 Human Resources Research Organization (HumRRO)
Chapter 4: Principal and Teacher Survey Responses
Table 4.29. T-21: 2007 Teacher-Reported Specific Benefits, Challenges, and Recommendations to Help Schools and Students Succeed on the CAHSEE Teacher Response Freq. (n) %
Challenges Students with lower level reading & math skills 11 15.7% Language barrier (ELD, ESL) 10 14.3% Students in Special Education, Resource, & Disability Courses 6 8.6% Attendance & truancy rates 6 8.6% Lacking motivation 6 8.6% Lack of or limited resources (remedial classes, study materials, & workbooks) 5 7.1% Lack of quality students (behavior problems, not prepared for high school or college) 5 7.1% Testing phobias & anxieties (cannot concentrate for long periods of time) 4 5.7% Classroom time constraints 4 5.7% Lack of parental support 3 4.3% Too much standardized testing 3 4.3% School facilities & testing environment 2 2.9% Test is not useful or indicator of success in learning 2 2.9% Test makes school job harder 1 1.4% Spending too much time teaching to the test & watered-down curriculum 1 1.4% Student retention of conceptual knowledge (from the 7th & 8th grade level) 1 1.4% Large class size (student to teacher ratio) 1 1.4% Teacher turnover rates 1 1.4%
Benefits CAHSEE support classes (CAHSEE Prep, CAMP CAHSEE, Counseling, &
Tutoring) 23 32.9% Department meeting & staff development (strategy, tactics, & curriculum
development 13 18.6% Motivating students to work harder (learn basic skills & accountability) 11 15.7% Instructional modification (student intervention strategies) 7 10.0% The assessment is not a challenge (high-achieving student body) 5 7.1% Improved the quality of teachers (accountability) 4 5.7% Understanding state & testing standards 3 4.3% Improved course work (test assignments with the weight & rigor of CAHSEE) 3 4.3% Study materials (PLATO, CAHSEEcast, & workbooks) 3 4.3% Quality students (involved in clubs, extra-curricular activities, community programs) 2 2.9% Raises academic expectations & student performance 2 2.9% Students understanding importance of test 2 2.9% Added remedial courses 2 2.9% Parental support 2 2.9% Excellent testing experience & facilities (posters & announcements of
encouragement) 2 2.9% Test captures student performance data 2 2.9% Test motivates school administration 2 2.9% Improved student retention 1 1.4%
Human Resources Research Organization [HumRRO] Page 167
Independent Evaluation of the CAHSEE: Fourth Biennial Report
Table 4.29. T-21: Teacher-Reported Specific Benefits, Challenges, and Recommendations to Help Schools and Students Succeed on the CAHSEE (continued) Teacher Response Freq. %
Recommendations Improve teacher quality Provide students with a thorough review of foundational math concepts (create more remedial
math courses) Teachers must adequately prepare curricula that addresses CAHSEE and are aligned to standards Administer CAHSEE over the course of a few days, this will help ELL [English Learners] & non-
motivated students
2
2 2
2
2.9%
2.9% 2.9%
2.9% Improve parental involvement & expectations ELA and math departments should develop a set curriculum for 10th graders Students should also be tested in grades 1through 8 School administrators & teachers must work together more as a staff. Teachers must stop teaching to the assessment CAHSEE math test should be based on Algebra I, Algebra II, and Geometry—higher level math
and not 7th grade standards Implement more CAHSEE support classes Improve student motivation & accountability.
1 1 1 1 1
1 1 1
1.4% 1.4% 1.4% 1.4% 1.4%
1.4% 1.4% 1.4%
Options and Supports for Students who Struggle and Students in Special Populations
Principals responded to a variety of items regarding at-risk students: (a) methods for early identification of students at risk of failing the CAHSEE, (b) current programs that help special populations maximally participate in and succeed on the CAHSEE and that help students who have difficulty passing the CAHSEE, (c) alternatives to graduation for students who cannot pass the CAHSEE, and (d) the extent to which financial constraints prevent principals from providing needed services. First, principals indicated information they use to identify at-risk students (PR-13). Because responses differed substantially from 2006 to 2007, data are reported separately in Table 4.30. The most commonly used method in both years was CST results (89% in 2006, 96% in 2007). The percentage of principals who indicated using end-of-course (EOC) results dropped substantially from 2006 (43%) to 2007 (33%), whereas the percentage of principals who indicated using teacher judgment increased from 57 percent in 2006 to 74 percent in 2007. Two principals reported additional methods to identify at-risk students, Exit Exam Mathematics Assessment Preparation (EEMAP) and school assessments.
Page 168 Human Resources Research Organization (HumRRO)
Chapter 4: Principal and Teacher Survey Responses
Table 4.30. PR-13: Principals’ Reports of Various Information Sources to Identify At-Risk Students (Percentages) Information Source 2006 2007 Norm-referenced test (NRT) results CST results
7 89
4 96
District End-of-Course (EOC) results District assessments (benchmarks, math facts, etc.) Teacher judgment
43 68 57
33 65 74
On the Student Questionnaire, students reported why they had difficulty with topics on the CAHSEE. Across all first-time tenth-grade test-takers, on average, the greatest percentage of students reported they had difficulty because they forgot things they were taught about the CAHSEE topics (44%). Students also cited difficulty due to trouble with those topics when they were taught (20%) and because they did not take courses that covered those topics (9%). A considerably different percentage of first-time test-takers reported none of the topics was difficult for them for ELA (34%) and math (21%).
Students also reported whether they will take steps to work harder or have already worked harder to learn the skills tested by the CAHSEE. Among all first-time tenth-grade test-takers, the greatest percentage of students reported working harder in the courses they were taking (47%). Students also reported getting help outside the classroom (9%), taking additional courses (6%), and repeating a course to learn the material better (6%). Forty percent of students indicated they did not need to work harder to meet the CAHSEE requirements. Eleventh and twelfth grade test-takers endorsed working harder to pass the CAHSEE at higher rates. Forty-nine percent of these students reported working harder in the courses they were taking. Eleventh- and twelfth-graders also endorsed taking additional courses (17%), getting help outside the classroom (14%), and repeating a course (13%). Among these students, 18 percent indicated they did not need to work harder to meet the CAHSEE requirements.
Principals indicated the plans and strategies they and their faculty/staff implemented to address participation in the CAHSEE for students with disabilities (PR-33). All principals reported having some plans in place, and 1 percent of principals reported not having any students with disabilities in their school. Principals in the combined sample most frequently endorsed the strategy of following the IEP or 504 plan (97%), followed by providing accommodations and/or additional assistance (90%), providing modifications (84%), mainstreaming students with disabilities (84%), modifying the IEP or 504 plan (74%), encouraging staff development in special education (69%), and offering special academic work programs (47%). One principal commented that another strategy was to enroll students in CAHSEE preparatory courses. These results indicate most principals endorsed multiple plans and strategies to help students with disabilities participate in the CAHSEE.
A similar item addressed the plans and strategies principals and their faculty/staff have in place to help English Learners overcome language barriers to succeed on the
Human Resources Research Organization [HumRRO] Page 169
Independent Evaluation of the CAHSEE: Fourth Biennial Report
CAHSEE (PR-34). Five percent of principals indicated they did not have any English Learners, and one percent of principals reported they did not have any plans or strategies in place to help English Learners succeed. Principals in the combined sample most frequently endorsed the strategy of providing accommodations and/or additional assistance (82%), followed by mainstreaming English Learners (81%), encouraging staff development in English Learner education (80%), providing modifications (54%), and offering special academic work programs (53%). An open-ended “Other” response yielded two additional strategies: after-school clinics and CAHSEE preparatory courses. Almost all principals surveyed had plans in place to help English Learners succeed, providing multiple strategies.
Principals were asked to report the extent to which they have implemented various plans to help students who have not passed or who are unprepared to take the CAHSEE (PR-20). Table 4.31 displays principal responses to these items since 2002. From 2006 to 2007, principals indicated substantially higher rates of full implementation for three strategies: (a) adopting the state content standards (from 85% in 2006 to 98% in 2007), (b) evaluating high school students’ abilities and placing them in courses/programs accordingly (from 47% in 2006 to 69% in 2007), and (c) increasing high school summer school offerings (from 44% in 2006 to 55% in 2007). Considering principal responses from 2002, clear trends in program implementation are observed over time. Substantially higher percentages of principals in 2007 reported fully implemented programs than did principals in 2002; fewer principals in 2007 reported having no plans to implement programs. An additional item asked principals about their plans to implement remediation courses for students who do not initially pass the CAHSEE (PR-32e). Substantially more principals in 2007 (73%) indicated full implementation of remediation courses than did principals in 2006 (55%). Increased implementation status of these programs is encouraging and expected; school districts received $70 million to assist with implementation of such programs in 2007.
Page 170 Human Resources Research Organization (HumRRO)
Chapter 4: Principal and Teacher Survey Responses
Table 4.31. PR-20: Percentage of Principals Indicating Implementation Status of Plans to Assist High School Students Who Do Not Pass or Do Not Seem Prepared to Take the CAHSEE Activity Implementation
Status 2002 2003 2004 2006 2007
Increased high school remedial courses Fully 10 33 17 46 54 Partially 33 37 41 37 30 Plan 24 10 24 2 7 No Plans 33 20 17 15 9
Reduced high school electives in favor of remedial classes
Fully Partially
5 5
13 33
14 36
37 29
33 30
Plan 16 27 11 0 3 No Plans 74 27 39 34 35
Increased high school summer offerings Fully 45 43 31 44 55 Partially 15 0 0 23 33 Plan 10 32 52 18 5 No Plans 30 25 17 15 8
Adopted California Content Standards Fully 45 82 88 85 98 Partially 55 18 13 12 2 Plan 0 0 0 2 0 No Plans 0 0 0 0 0
Altered high school curriculum Fully 5 34 39 36 38 Partially 62 38 45 25 43 Plan 29 14 6 6 3 No Plans 5 14 10 33 16
Included teachers other than ELA and math in instructional planning for the CAHSEE
Fully Partially
16 42
26 32
31 31
39 44
40 45
Plan 42 29 22 10 10 No Plans 0 13 16 8 5
Human Resources Research Organization [HumRRO] Page 171
Independent Evaluation of the CAHSEE: Fourth Biennial Report
Table 4.31. PR-20: Percentage of Principals Indicating Implementation Status of Plans to Assist High School Students Who Do Not Pass or Do Not Seem Prepared to Take the CAHSEE (continued) Activity Implementation
Status 2002 2003 2004 2006 2007
Worked with feeder middle schools Fully 5 18 28 15 22 Partially 55 29 38 46 32 Plan to 10 21 22 18 30 No Plans 30 32 12 21 16
Developed parent support program Fully 0 0 11 14 11 Partially 25 25 25 39 41 Plan to 50 25 25 22 32 No Plans 25 50 39 25 16
Used school test results to change high school instruction
Fully Partially
5 65
25 50
23 61
39 46
33 60
Plan to 30 19 10 10 2 No Plans 0 6 6 5 5
Evaluated high school students’ abilities and placed them in courses/programs accordingly
Fully Partially
23 43
57 27
55 36
47 49
69 29
Plan to 19 13 6 5 2 No Plans 14 3 3 0 0
Ensured that students are taking demanding courses from the beginning
Fully Partially
20 50
53 27
64 26
57 38
52 43
Plan to 20 13 10 5 5 No Plans 10 7 0 0 0
Ensured we are offering demanding courses from the beginning
Fully Partially
25 55
43 40
64 26
65 32
57 38
Plan to 20 10 10 3 5 No Plans 0 7 0 0 0
Explanation of table contents: The first line of the table indicates that the percentage of principals who indicated increasing high school remedial courses was fully implemented was 10 percent in 2002, 33 percent in 2003, 17 percent in 2004, 46 percent in 2006, and 54 percent in 2007.
In addition to noting plans and strategies available for students who struggle to pass the CAHSEE, principals reported options available for seniors who do not pass both parts of the CAHSEE (PR-23). Principal responses demonstrated volatility between 2006 and 2007, perhaps because of the recent implementation of the CAHSEE as a graduation requirement. Table 4.32 presents the percentage of principals who reported each option is available for seniors who do not pass the CAHSEE. Substantial increases were reported for availability of summer programs with retesting (from 75% in 2006 to 85% in 2007) and certificates of completion (68% in 2006 to 80% in 2007). Conversely, they reported substantial decreases in availability for receiving a GED (77% in 2006 to 57% in 2007) and high school diplomas through community college (64% in 2006 to 54% in 2007). The options that remained fairly consistent from 2006 to 2007 were retention in 12th grade and other certificates. Principals reported two additional options, Adult Education programs and independent study.
Page 172 Human Resources Research Organization (HumRRO)
Chapter 4: Principal and Teacher Survey Responses
Table 4.32. PR-23: Principals Reporting Availability of Options for Seniors Who Do Not Pass the CAHSEE (Percentages) Option 2006 2007 Summer program with retesting Retention in 12th grade GED
75 46 77
85 48 57
High school diploma through community college Certificate of completion Other certificate
64 68 11
54 80 7
In 2007, principals were asked for the first time to report the proportion of the previous year’s seniors who took advantage of each option available to 12th grade students who did not pass both parts of the CAHSEE (PR-24). Principals reported the highest mean (M=mean) percentage for students participating in the summer program with retesting (M = 32%, SD = 38, median = 13%), followed by certificate of completion (M = 20%, SD = 29, median = 8%), retention in 12th grade (M = 9%, SD = 18, median = .25%), other certificate (M = 7%, SD = 18, median = 0%), high school diploma through community college (M = 5%, SD = 18, median = 8%), and GED (M = 5%, SD = 9, median = 0%). In open-ended comments, two principals indicated students who do not pass the CAHSEE take part in an independent study program (approximately one third of students failing to meet requirements) or participate in adult education programs.
Finally, principals indicated the extent to which financial constraints over the past 4 years limited their ability to provide services that students needed to pass the CAHSEE (PR-31). Responses from 2006 and 2007 are presented in Table 4.33. Substantial increases in the percentage of principals who reported that financial constraints did “Not at All” limit their ability to provide services over the last four years were observed for four services: school, teacher, and student access to appropriate instructional materials (from 57% in 2006 to 70% in 2007); remediation (from 36% in 2006 to 48% in 2007); teacher and school support services (from 36% in 2006 to 52% in 2007); and student and parent support services (from 32% in 2006 to 44% in 2007). Substantial decreases in the percentage of principals who responded “Not at All” were reported for two services: teacher access to in-service training on content standards (from 66% in 2006 to 54% in 2007) and administrator and teacher access to in-service training for working with diverse student populations and different learning styles (from 59% in 2006 to 48% in 2007). Whereas the impact of financial constraints has been volatile over the last two years, there is a trend for fewer programs to be limited by financial constraints. Principals of schools in the upper quintile for proportion of at-risk subgroups endorsed these items at rates similar to the principals for schools not falling in the upper quintile. These results suggest that financial constraints are no more an issue at responding schools with higher proportions of at-risk students.
Human Resources Research Organization [HumRRO] Page 173
Independent Evaluation of the CAHSEE: Fourth Biennial Report
Table 4.33. PR-31: Extent to Which Principals Indicate Financial Constraints Limited Providing Services in the Past Four Years (Percentages)
2006 2007
Services Not Slight Moderate Great Not Slight Moderate Great at All Extent Extent Extent at All Extent Extent Extent
School, teacher, and student access 57 25 14 5 70 22 4 4 to appropriate instructional materials
Teacher and school support services 36 39 21 5 52 15 26 7
Student and parent support services 32 48 14 7 44 30 20 7
Teacher access to in-service training on content standards
66 21 9 5 54 30 9 7
Teacher access to in-service training on instructional techniques
61 23 9 7 57 28 7 9
Administrator and teacher access to 59 23 11 7 48 33 15 4 in-service training for working with diverse student populations and different learning styles
Explanation of table contents: The first line of the table indicates that, in 2006, the percentage of principals who indicated financial constraints limited their ability to implement school, teacher, and student access to appropriate instructional materials not at all was 57 percent; to a slight extent, 25 percent; to a moderate extent, 14 percent; and to a great extent, 5 percent. In 2007, the percentage of principals who indicated financial constraints limited their ability to implement school, teacher, and student access to appropriate instructional materials not at all was 70 percent; to a slight extent, 22 percent; to a moderate extent, 4 percent; and to a great extent, 4 percent.
Graduation Rates Under the High-Stakes CAHSEE
Principals and teachers responded to a variety of items predicting and examining the impact of the CAHSEE on student dropout, retention, and graduation rates. These items measure the actual influence of the CAHSEE on graduation, which can be better studied since 2006 when the CAHSEE became a graduation requirement. Because 2007 was the only year for which complete data from a previous high-stakes CAHSEE administration were available, responses in this section are provided separately for 2006 and 2007. Differences in responses across these years support the need to report these data separately. In addition, results for items from the Student Questionnaire that address graduation rates are included to provide the student perspective.
On the Student Questionnaire, students reported whether they believed they would graduate from high school. Among all first-time tenth grade test-takers, a mean of 88 percent of students indicated they thought they would graduate from high school. Ten percent reported they were unsure whether they would graduate, and two percent reported they did not think they would graduate. Eleventh- and twelfth-graders, who are more likely to be repeat test-takers, were less optimistic about their likelihood of
Page 174 Human Resources Research Organization (HumRRO)
Chapter 4: Principal and Teacher Survey Responses
graduating. Among 11th- and 12th- graders, a mean of 75 percent of students reported they believed they would graduate from high school. Twenty-one percent were unsure whether they would graduate, and five percent reported they did not think they would graduate. Based on Student Questionnaire results, students taking the CAHSEE in eleventh or twelfth grade, on average, were less optimistic about their chances of graduating high school.
In addition, the Student Questionnaire asked students to report factors that might prevent them from graduating. Across all first-time tenth-grade test-takers, 62 percent of students reported they were confident they will graduate on time. Students reported that they may not graduate because they will not pass the CAHSEE exam (22%) or they will not pass all required courses (21%). An additional 13 percent reported that not meeting some other graduation requirement might prevent them from graduating; three percent indicated they may drop out. Nearly half of eleventh and twelfth grade test-takers indicated not passing the CAHSEE exam might prevent them from graduating (49%). Additional factors that eleventh- and twelfth-graders reported might prevent them from graduating included not passing all required courses (20%) or not meeting some other graduation requirement (13%). Thirty-one percent of eleventh- and twelfth-grade test-takers indicated they were confident they would graduate on time, and five percent reported they may drop out. Student Questionnaire results indicated eleventh and twelfth grade students were considerably more concerned about not passing the CAHSEE and were less confident they would graduate on time.
Principals were asked to report the percentage of their schools’ seniors who were unlikely to graduate for a variety of reasons (PR-21). As Table 4.34 demonstrates, the estimated percentage of students who were unlikely to graduate decreased regardless of reason from 2006 to 2007. In addition, principals rated other requirements as a more likely reason for students failing to graduate than the CAHSEE requirement. The largest percentage of students reported who were unlikely to graduate, however, was due to a combination of the CAHSEE requirement and other requirements.
Human Resources Research Organization [HumRRO] Page 175
Independent Evaluation of the CAHSEE: Fourth Biennial Report
Table 4.34. PR-21: Principals Reporting Percentages of Seniors Unlikely to Graduate Due to Various Requirements
2006 2007 Reason Not Graduating Mean SD Median Mean SD Median CAHSEE requirement only CAHSEE requirement AND other requiOther requirements only Total [of all seniors]
4.5 rements 9.3
7.3 15.7
6.8 15.1 14.9 26.2
2.0 3.0 2.0 5.0
3.5 6.3 6.6 9.4
9.2 12.0 10.1 14.1
1.0 2.0 2.0 5.0
Explanation of table contents: The first line of the table indicates that, in 2006, principals reported the percentage of seniors unlikely to graduate due to the CAHSEE requirement only was, on average, 4.5 percent, with a standard deviation of 6.8 and a median of 2.0. In 2007, principals reported the percentage of seniors unlikely to graduate due to the CAHSEE requirement only was, on average, 3.5 percent, with a standard deviation of 9.2 and a median of 1.0.
In 2007, principals were able to indicate for the first time the actual number of seniors from the previous year who did not graduate for various reasons (PR-22). In contrast with the predicted reasons that students would be unlikely to graduate, the largest number of seniors actually did not graduate because of requirements other than the CAHSEE only (M = 12.7, SD = 16.6, median = 5.0). Although the most commonly predicted reason for seniors not graduating was because of the CAHSEE requirement and other requirements, this was the second largest reason why students actually did not pass (M = 10.6, SD = 13.5, median = 4.0). Principals reported a considerably smaller number of students not graduating due to the CAHSEE alone (M = 6.3, SD = 9.4, median = 2.0). The mean reported number of all seniors failing to graduate was 21.8 (SD = 27.2, median = 9.5). Results from this item may indicate the CAHSEE requirement is not as big a concern associated with student graduation as some principals predicted. Further, actual graduation results indicate that students’ concerns about not graduating as a result of not passing the CAHSEE (as reported on the Student Questionnaire) may be exaggerated.
Finally, both teachers (T-18g-h) and principals (PR-26g-h) predicted CAHSEE influence on student retention rates and student dropout rates. Tables 4.35a and 4.35b present results for retention and dropout, respectively. Although teacher ratings remained fairly consistent from 2006 to 2007, principals in the 2007 sample appeared to trend toward indicating the CAHSEE had no impact on either the student retention rate (43% in 2006; 64% in 2007) or the dropout rate (43% in 2006; 52% in 2007). As a result, considerably fewer principals indicated that the CAHSEE increases or strongly increases student retention rates (48% in 2006 to 29% in 2007) or that it increases or strongly increases dropout rates (50% in 2006 to 41% in 2007). These results suggest the availability of actual student graduation data after implementation of the CAHSEE as a graduation requirement has persuaded some principals, although not teachers, that the CAHSEE does not directly impact student retention or dropout rates.
Page 176 Human Resources Research Organization (HumRRO)
Chapter 4: Principal and Teacher Survey Responses
Table 4.35a. PR-26, T-18: Teachers’ and Principals’ Estimated Impact of the CAHSEE on Student Retention Rates (Percentages)
Explanation of table contents: The first line of the table indicates that the percentage of teachers who indicated the impact of the CAHSEE on student retention was strongly decreased was 0 percent in 2000, 1 percent in 2001, 1 percent in 2002, 0 percent in 2003, 2 percent in 2004, 1 percent in 2006, and 1 percent in 2007. The percentage of principals who rated retention rates as strongly decreased was 2 percent in 2000, 2 percent in 2001, 0 percent in 2002, 0 percent in 2003, 0 percent in 2004, 2 percent in 2006, and 2 percent in 2007.
Table 4.35b. PR-26, T-18: Teachers’ and Principals’ Estimated Impact of the CAHSEE on Student Dropout Rates (Percentages)
Results from the Spring 2007 CAHSEE Performance Data
Spring 2007 CAHSEE performance data were analyzed to examine factors that influence success on the CAHSEE. Several factors emerged as consistently important in ensuring student success. First, having teachers credentialed in their primary subject area was crucial; schools that reported assigning teachers only in their certified fields (PR-11j) tended to perform better than did schools that did not assign teachers only in their certified fields. In fact, of the four principals whose schools were in the Very Low category for both ELA and math passing rates, none indicated they assigned teachers only in their certified field. Performance data were matched with teacher reports of their certification (T-3); for schools in the High category, 86 percent of teachers reported being certified in their primary subject area. The percentage of teachers who reported being certified in their primary subject area dropped to 84 percent for schools in the Moderate category, 80 percent for schools in the Low category, and 71 percent for schools in the Very Low category. The percentage of teachers certified to teach in their primary subject area was similar for schools that were in the upper quintile for proportion of at-risk students, with one exception. For schools that fell in the upper
Human Resources Research Organization [HumRRO] Page 177
Independent Evaluation of the CAHSEE: Fourth Biennial Report
quintile for proportion of African American students, 75 percent of teachers reported being certified in their primary subject area; for schools not in the upper quintile, 84 percent reported being certified in their primary subject area.
Principals indicated factors they believed impacted student success on the CAHSEE (PR-30). Comparing these data with Spring 2007 CAHSEE performance data revealed the factors that most likely impacted success on the ELA and math tests. Tables 4.36 (ELA) and 4.37 (math) present the percentage of principals rating items as Not a Factor and Definitely a Factor for issues related to the CAHSEE performance data. Clearly, some factors are of more concern in high-performing schools, whereas other factors have a greater impact in lower-performing schools. Most factors (lack of preparation, lack of motivation, poor attendance) were rated as Definitely a Factor more frequently in the low-performing schools; language barriers were rated more frequently as Definitely a Factor in the high-performing schools. A further examination of the link between language barriers and performance data was examined in relation to teacher ratings of English fluency in their classrooms (T-7). None of the schools with ELA or math performance data in the High or Moderate categories were rated as having less than 50 percent English fluency in their mean classes. Taken together, these results suggest that, in schools where students are typically high performing, language barriers are uncommon—when they do exist, they are reported to be a factor in student success more than they might in lower-performing schools. The other factors rated as definite factors in student success in the lower-performing schools (e.g., poor attendance, lack of preparation, lack of motivation) may be more pressing than language barriers. Performance data also suggested the lack of preparation needed to pass the CAHSEE was an important factor in determining student success in low-performing schools, but not in high-performing schools. On the ELA test, for example, 50 percent of principals with schools in the High category reported lack of preparation was not a factor and 13 percent reported it was definitely a factor. In contrast, 0 percent of principals in the schools in the Very Low category reported lack of preparation was not a factor, while 50 percent reported it was definitely a factor.
Page 178 Human Resources Research Organization (HumRRO)
Chapter 4: Principal and Teacher Survey Responses
Table 4.36. Percentage of Principals with Schools in Each Pass Category on the ELA Test Rating Various Factors Impacting Success on the CAHSEE as Not a Factor or Definitely a Factor
High Moderate Low Very Low* Not
a Factor Definitely a Factor
Not a Factor
Definitely a Factor
Not a Factor
Definitely a factor
Not a Factor
Definitely a Factor
Lack of preparation Lack of motivation
50 25
13 19
26 26
11 30
18 13
33 45
0 0
50 50
Poor attendance 44 19 37 48 10 68 0 100 Language barriers Lack of credentialed ELA Teachers
6 94
75 0
11 93
67 0
10 90
65 0
0 75
50 0
*Note: Because only 4 schools were in the Very Low category, results should be interpreted with caution.
Explanation of table contents: The first line of the table indicates principal responses divided into four ELA performance groups: High, Moderate, Low, and Very Low. Among principals whose students were in the High category on the ELA portion of the CAHSEE, 50 percent indicated lack of preparation was not a factor in student success and 13 percent reported lack of preparation was definitely a factor. Of principals whose students were in the Moderate category, 26 percent reported lack of preparation was not a factor and 11 percent reported it was definitely a factor. Of principals whose students were in the Low category, 18 percent indicated lack of preparation was not a factor and 33 percent indicated it was definitely a factor. Of principals whose students were in the Very Low category, 0 percent indicated lack of preparation was not a factor and 50 percent indicated it was definitely a factor.
Table 4.37. Percentage of Principals with Schools in Each Pass Category on the Math Test Rating Various Factors Impacting Success on the CAHSEE as Not a Factor or Definitely a Factor
High Moderate Low Very Low* Not
a Factor Definitely a Factor
Not a Factor
Definitely a Factor
Not a Factor
Definitely a factor
Not a Factor
Definitely a Factor
Lack of preparation Lack of motivation
56 13
13 25
21 32
11 25
18 13
33 46
0 0
50 50
Poor attendance 44 19 36 46 10 69 0 100 Language barriers Lack of credentialed math teachers
6 94
81 0
11 93
64 4
10 80
64 5
0 75
50 0
*Note: Because only 4 schools were in the Very Low category, results should be interpreted with caution.
Human Resources Research Organization [HumRRO] Page 179
Independent Evaluation of the CAHSEE: Fourth Biennial Report
Summary
Although this administration of the longitudinal survey was in many ways consistent with administrations from previous years, it had several unique features. First, 2007 was the first year in which results from a high-stakes administration from the previous year were available. For the first time, teachers and principals had actual data about student pass rates under the CAHSEE graduation requirement. Second, this implementation of the CAHSEE as a graduation requirement subsequently enabled the examination of school performance data in conjunction with survey data to compare teacher and principal responses with actual outcomes. Finally, 2007 recorded aberrantly low response rates, especially for teachers. Although the response rates for the longitudinal survey were not ideal in 2006, they were considerably higher for teachers than in 2007. As a result, when possible, data from the 2006 and 2007 administrations of the CAHSEE were combined to obtain greater representation and coverage across the total target sample of schools, which remained the same across years. When responses differed between 2006 and 2007, however, data were reported separately.
Several longitudinal survey items examined the levels of student and teacher knowledge of and preparedness for the CAHSEE. Since 2006, several types of programs intended to foster student success moved from partial implementation to full implementation across numerous schools. Specifically, a substantially greater number of principals indicated full implementation of (a) encouraging all students to take Algebra I and (b) offering CAHSEE preparatory classes. Teachers and principals alike indicated increased coverage of the content standards in the curriculum. Whereas teachers indicated a broad increase in the amount of content coverage, principals specifically reported increased content coverage overall for 10th-grade students and for special education students and English Learners. Students also reported good coverage of CAHSEE content on the 2007 Student Questionnaire, with 93 percent of first-time tenth-grade test takers indicating most or all of the CAHSEE topics were covered in courses they had taken.
Teachers directly estimated student preparedness for the CAHSEE. Reported readiness in 2007 followed the continuous upward trend in readiness observed over time. Specifically, considerably more teachers in 2007 rated students as very well prepared to take the CAHSEE. Because performance data were available from the Spring 2007 CAHSEE administration, the extent to which teachers’ estimates of readiness matched actual CAHSEE scores could be ascertained. Results suggest teachers are quite proficient in estimating student readiness for the CAHSEE: teachers in low-performing schools tended to rate students as not at all or not well prepared, and teachers in high-performing schools tended to rate their students as well or very well prepared.
Implementation of activities to support teacher knowledge and readiness did not increase commensurate with the increases observed for students. In fact, results suggest adequate preparatory activities for teachers might be lacking. Many teachers continue to be unaware of the CAHSEE resources of the CDE website (36%) and the
Page 180 Human Resources Research Organization (HumRRO)
Chapter 4: Principal and Teacher Survey Responses
Teacher Guide (18%). Those teachers who reported familiarity with these sources tended to find them useful, suggesting benefits to ensuring that all teachers gain familiarity with these resources. In addition, a fairly substantial number of teachers (about one quarter to one third) reported not receiving any state or local CAHSEE-related professional development over the past year. Teachers continue to rate the quality of local professional development as superior to state professional development; however, overall satisfaction tended to be low.
A second subset of items on the longitudinal surveys addressed implementation and alignment of the content standards under the CAHSEE. Principals reported continued growth to the already high rates of alignment for curriculum and organizing instruction. A lower number of principals said they had plans in place to ensure access to all content standards for high school students and pre-high-school students. In addition, principals reported a decreased proportion of teachers who have copies of the CAHSEE blueprints and use them for planning instruction. Principals did, however, indicate a high rate of monitoring the extent to which classroom instruction is aligned with the standards.
The impact of the CAHSEE on students, parents, and instruction was examined with a series of principal and teacher survey items. As in the past, principals and teachers predicted a largely positive impact of the CAHSEE on both student motivation and parental involvement, even for students who fail the CAHSEE on their first attempt. The impact of the CAHSEE on instruction may be relatively minor; most teachers reported spending 15 or fewer hours on specifically CAHSEE-related tasks. Likewise, principals in 2007 indicated spending fewer hours on CAHSEE-related activities than did principals in 2006. Thus, although the CAHSEE might have a major impact on instruction in certain ways, results suggest it does not dramatically take away from time that educators previously spent on other activities. One way that the CAHSEE has been reported to detract from the previous curriculum is by taking time away from non-CAHSEE courses, such as arts courses, vocational courses, courses from other subject areas, and electives.
Principals and teachers rated the impact of the CAHSEE on instructional activities. Overall, the trend in responses regarding the CAHSEE’s impact on instruction has been positive. A cross-analysis of the impact on instruction with actual performance data suggests teachers and principals from lower-performing schools perceive an increased positive impact of the CAHSEE on instruction. Finally, surveyed ELA and math teachers and principals rated how responsible they believed non-CAHSEE teachers considered themselves to be for student performance. Trends for principals increased substantially, while the trend for teachers decreased substantially. These results suggest a disconnect in the amount of responsibility teachers and principals believe is felt by non-CAHSEE teachers.
Finally, numerous items examined the CAHSEE as a graduation requirement. Principals reported poor attendance, lack of preparation, and lack of motivation were definite factors in student success (or lack thereof) on the CAHSEE. Spring 2007
Human Resources Research Organization [HumRRO] Page 181
Independent Evaluation of the CAHSEE: Fourth Biennial Report
CAHSEE performance data seemed to substantiate principals’ concerns; greater percentages of principals indicated that these factors were definitely a factor in the lower-performing schools than in the higher-performing schools. Although these data do not provide a causal link between principals’ concerns and actual performance, they do suggest that principals who report these concerns tend to have lower-performing students. Further, factors of poor attendance and lack of preparation were more important in low-performing schools, whereas language barriers tend to be more important in high-performing schools. Performance data suggest that different factors are important for student success in different schools. Teachers predicted poor attendance, language barriers, and lack of motivation to be definite factors in student success. Although neither principals nor teachers indicated the importance of teacher certification in their main field as a top factor influencing student success, data suggested there is a relationship between the percentage of teachers who reported being certified in their main content area and student performance on the CAHSEE; higher percentages of teachers indicated certification in their primary subject areas in higher-performing schools.
To assist struggling students, principals reported substantial increases in full implementation for four activities: adopting state standards, ability-grouping students, increasing summer school course offerings, and providing remediation courses. Almost all principals reported having plans in place to assist special education students and English Learners to participate in and succeed on the CAHSEE. Moreover, principals generally reported financial constraints over the past four years were less limiting in 2007 than they had been in 2006.
Regarding graduation rates, principals predicted the largest proportion of students who failed to graduate would do so because of a combination of not passing the CAHSEE and failing to meet other requirements. Likewise, on the Student Questionnaire, students were most concerned about the CAHSEE preventing them from graduating. When principals submitted actual numbers of students in their schools who failed to graduate for various reasons, these data indicated the largest number of students who do not graduate actually fail because of requirements other than the CAHSEE. The number of principals indicating they believed the CAHSEE had no impact on student retention or dropout also increased. These results suggest the CAHSEE might not impact graduation rates for the general student body at the rate that some have previously expected.
Overall, the 2007 data continue the generally optimistic pattern of responses observed over the last several years. Fears of the CAHSEE and its impact on student motivation and graduation appear to have dissipated, and data suggest it is appropriate for educators to let go of those fears. There remain, however, areas of concern. Achievement gaps still appear to exist for some student groups. Teachers reported they are not receiving quality CAHSEE-related professional development, and many teachers are still unaware of existing useful resources. Principals acknowledged the CAHSEE may detract from non-CAHSEE areas of education such as vocational or arts classes. Teachers’ and principals’ reports, however, seem to reflect increased
Page 182 Human Resources Research Organization (HumRRO)
Chapter 4: Principal and Teacher Survey Responses
preparedness to help students succeed. Ultimately, principals and teachers appear to be well equipped to continue making progress in providing programs, services, strategies, and supports to help students succeed on the CAHSEE.
Human Resources Research Organization [HumRRO] Page 183
Chapter 5: Trends in Educational Achievement and Persistence During the CAHSEE Era
Chapter 5: Trends in Educational Achievement and Persistence During the CAHSEE Era
D. E. (Sunny) Becker
Introduction
A high-stakes test such as the CAHSEE can have profound effects on the education system as a whole. Among the goals of a standardized graduation examination is to raise the bar for what young adults who hold a high school diploma know and can do; one of the dangers is that it may discourage struggling students. Since its inception, the CAHSEE has provoked predictions ranging from a surge in dropout rates to improved preparation for college.
Other chapters in this report address actual CAHSEE results as well as the impressions of principals, teachers, and students over time with respect to the CAHSEE. This chapter investigates other data sources to determine trends that may be related to the CAHSEE. Specifically, we look at students who leave high school prematurely from a number of perspectives, including official CDE dropout rates and enrollment trends. We also explore officially reported graduation rates, evidence of shifts in college preparation, and evidence of shifts in participation—and success—in Advanced Placement (AP) courses.
One limitation to these analyses results from the largely decentralized data management system in California schools. California is currently implementing a unique statewide student identifier that will, over time, support merging of data across various sources and support sophisticated analyses. At this time some limitations remain, however. For example, we can report the number and rates of students passing the CAHSEE at each test administration and we can estimate the cumulative pass rates. At the same time we can estimate the number of students who have not yet passed the CAHSEE. From separate data sources, we can report high school graduation rates. However, we cannot match individual students’ CAHSEE results with their graduation status; thus we cannot report the extent to which non-graduates failed to graduate solely because of the CAHSEE requirement versus other graduation requirements.
Students Who Leave High School Prematurely
An early and persistent concern regarding the implementation of the CASHEE requirement was the fear that struggling students would become frustrated and dropout rates would increase. This phenomenon is difficult to measure, however, because the definition of what a “dropout” is and the requisite data underpinnings to clearly identify dropouts are controversial and in flux. This problem is not at all unique to California; it has been the subject of debates among researchers both in academia and in the public throughout the nation. The National Center for Education Statistics published new
Human Resources Research Organization [HumRRO] Page 185
Independent Evaluation of the CAHSEE: Fourth Biennial Report
guidelines in 2003 to encourage a standard dropout calculation method, but this definition is itself controversial and the debate continues.
Because the definition of dropouts is so controversial, we provide multiple views here of trends in student persistence through Grade 12. We first present the State of California’s definitions of dropouts and associated official dropout statistics. We then look at enrollment trends for grades 8 through 12 for various student cohorts.
Dropout Rates
The California Department of Education (CDE) reports dropout rates publicly on its Web site. California revised its dropout calculation in 2003 to better align with rates reported by the National Center for Education Statistics (NCES). We will look first at CDE-reported single-year dropout rates and then at cumulative 4-year dropout rates as reported by CDE.
What is a Dropout?
The CDE definition of a dropout was modified in October 2003 to conform to guidelines issued by NCES. The original definition is provided in Figure 5.1 and the revised definition is provided in Figure 5.2 (Retrieved on 07/21/05 from http://data1.cde.ca.gov/dataquest/gls_drpcriteria.asp).
Dropout Criteria
For years prior to 2002-03 the California Department of Education defined a high school dropout as a person who met the following criteria:
was formerly enrolled in grades 7, 8, 9, 10, 11, or 12 has left school for 45 consecutive school days and has not enrolled in another public or
private educational institution or school program has not re-enrolled in the school has not received a high school diploma or its equivalent was under twenty-one years of age was formerly enrolled in a school or program leading to a high school diploma or its
equivalent This includes students who have moved out of the district, out of state, or out of the United States and are not known to be in an educational program leading toward a high school diploma or its equivalent.
Districts are also responsible for determining the status of their "no-show" students. "No-shows" are students who completed a grade, but did not begin attending the next grade the following year.
Source: California DataQuest System (http://data1.cde.ca.gov/dataquest)
Page 186 Human Resources Research Organization (HumRRO)
Chapter 5: Trends in Educational Achievement and Persistence During the CAHSEE Era
Figure 5.1. CDE explanation of dropout definition prior to October 2003. What criteria are used to define a dropout? In October, 2003, the California Department of Education (CDE) adopted the National Center for Educational Statistics (NCES) Dropout definition. Following the new guidelines, the CDE now defines a dropout as a person who:
1. Was enrolled in grades 7, 8, 9, 10, 11 or 12 at some time during the previous school yearAND left school prior to completing the school year AND has not returned to school as of Information Day.
OR 2. Did not begin attending the next grade (7, 8, 9, 10, 11 or 12) in the school to which they
were assigned or in which they had pre-registered or were expected to attend by Information Day.
Exclusionary Conditions
For each student identified in the criteria above, the student is not a dropout if: The student has re-enrolled and is attending school.
The student has graduated from high school, received a General Education Development (GED) or California High School Proficiency Examination (CHSPE) certificate.
The student has transferred to and is attending another public or private educational institution leading toward a high school diploma or its equivalent. (Does not include adult education programs unless the district can verify that these students are still enrolled in a GED or high school completion program on Information Day.)
The student has transferred to and is attending a college offering a baccalaureate or associate's program.
The student has moved out of the United States.
The student has a temporary school recognized absence due to suspension or illness.
The school has verified that the student is planning to enroll late (e.g., extended family vacation, seasonal work.)
The student has died.
Source: California DataQuest System (http://data1.cde.ca.gov/dataquest)
Figure 5.2. CDE explanation of dropout definition as of October 2003.
The revised definition provides more specific guidance regarding students who are not considered dropouts. For example, students who have received a GED or CHSPE certificate in lieu of a diploma are explicitly excluded from the dropout calculation.
Human Resources Research Organization [HumRRO] Page 187
Independent Evaluation of the CAHSEE: Fourth Biennial Report
CDE Single-Year Dropout Rate
CDE routinely publishes results of two dropout rate calculations. The single-year dropout rate measures the percentage of students enrolled in grades 9–12 who are identified as dropouts in a single school year. The official CDE dropout counts for single-year dropouts are displayed in Figure 5.3. The figure is reproduced here intact from the CDE Web site. The single-year dropout calculation derives the total number of students who drop out from grades 9–12 as a percentage of the total grade 9–12 enrollment in a single school year. The bars in Figure 5.3 indicate the number of students who dropped out while the line graph in the figure indicates the dropout rate as a percentage of enrollment. According to the state’s public Web site information, dropout rates have increased each school year from a low in 2001–02.
California Department of Education Educational Demographics Unit Prepared: 7/16/2007 12:50:08 PM
Notes: • Data from direct funded charter school(s) are included with data from the district that chartered the school.• In 2002–03 the California Department of Education started using dropout criteria formulated by the National Center for EducationStatistics.
Dropout Formulae: • 1-Year Rate Formula: (Gr. 9-12 Dropouts/Gr. 9-12 Enrollment)*100• 4-Year Derived Rate Formula: (1-((1-(drop gr 9/enroll gr 9))*(1-(drop gr 10/enroll gr 10))*(1-(drop gr 11/enroll gr 11))*(1-(drop gr12/enroll gr 12))))*100 • ** Asterisks in the 4-year derived rate column indicate that one or more grade levels have zero enrollment. If a grade level haszero enrollment, the formula cannot be calculated.
Source: http://data1.cde.ca.gov/dataquest/DropStateGraph.asp?Level=State on 7/16/07.
Page 188 Human Resources Research Organization (HumRRO)
Chapter 5: Trends in Educational Achievement and Persistence During the CAHSEE Era
Figure 5.3. Single-year dropout rates according to CDE.
The reader is reminded that the definition of dropouts changed in October 2003 (i.e., the 2003-04 school year), so direct comparison across that time boundary is tenuous. However, the last three school years depicted in the chart used the new metric, reflecting an increase of 0.4 percentage points in the single-year dropout rate, from 3.2 percent to 3.6 percent. In particular, the dropouts increased substantially in the 2005-06 school year, both in terms of the raw number of students leaving school prematurely as well as in the dropout rate. Because this school year was the first year that failure to pass the CAHSEE resulted in withholding of diplomas, the increase is of special concern. As of the writing of this report, statistics for school year 2006–07 were not yet available.
The single-year dropout rate depicted in Figure 5.3 does not distinguish the point within the high school years at which dropouts were increasing. Figure 5.4 shows single-year dropout counts by grade level, over time. Rather than reporting dropouts in each school year as in Figure 5.3, Figure 5.4 associates students with graduating classes. This figure clearly indicates that the number of students dropping out in each class in grades 9, 10, and 11 has remained relatively stable for the past several years. However, the number of dropouts in Grade 12 has increased steadily since the Class of 2002. In the Class of 2006, 34,097 Grade 12 students dropped out; this was a substantial increase over the 25,133 Grade 12 dropouts in the Class of 2005.
Figure 5.4. Single-year dropout counts by grade level according to CDE.
Human Resources Research Organization [HumRRO] Page 189
Independent Evaluation of the CAHSEE: Fourth Biennial Report
CDE Cumulative 4-Year Dropout Rate and Graduation Rate
CDE also routinely produces a cumulative 4-year dropout rate, which is another common dropout metric. This calculation accounts for students within a class cohort who drop out, over time, at the 9th, 10th, 11th, or 12th grade level. This rate more closely reflects what the public perceives as the meaning of dropping out of high school. Due to their cumulative effect, 4-year dropout rates are generally markedly higher than single-year dropout rates.
Table 5.1 contains CDE’s published 4-year dropout rates, disaggregated by race/ethnicity. The dropout rate is calculated as the number of students in a cohort class who dropped out in grade 9, 10, 11, or 12, as a percentage of the 9th grade entering school population. The same information is presented graphically in Figure 5.4. To clearly distinguish patterns, the scale on this graph has been trimmed to a range of 0– 30 percent. The years on the abscissa represent the cohort’s graduation year, and the dropout rate is a 4-year rate for that cohort.
Table 5.1. CDE 4-Year Dropout Rates by Race/Ethnicity (Percentages) Graduation Cohort Race/Ethnicity 2000 American Indian 14.1 Asian American 5.8 Pacific Islander 13.3 Hispanic 15.3 African American 18.1 White 6.9
In Figure 5.4, the “State Totals” line (indicated by “+”) represents the 4-year dropout rates for the student population as a whole. This rate was relatively stable from 2000 through 2002 at about 11 percent, then rose in 2003 to a level that plateaued for three years between 12.6 and 13 percent. In 2006, however, the rate increased markedly to 14.8 percent. As noted in the earlier discussion of the 1-year dropout rates, this increase was concurrent with the impact of the CAHSEE on graduation rates.
Figure 5.5 reveals that dropout rates increased for all racial/ethnic groups in 2006, with the exception of American Indian students. The reader is cautioned, however, that the number of students in the American Indian group is comparatively small so this difference may be a statistical aberration.
Consistent with earlier years, dropout rates among African American, Hispanic, American Indian, and Pacific Islander students consistently outpaced the dropout rates among White and Asian students. The groups having the highest dropout rates already—African American, Hispanic, and Pacific Islander students—also registered the largest increases in 2006. In other words, the gaps in 4-year dropout rates between racial/ethnic groups increased in 2006.
Page 190 Human Resources Research Organization (HumRRO)
Chapter 5: Trends in Educational Achievement and Persistence During the CAHSEE Era
Official CDE Four-Year Dropout Rates by Race/Ethnicity
30 D
ropo
ut P
erce
ntag
e
25
20
15
10
5
0 2000 2001 2002 2003 2004 2005 2006
AM IND ASIAN PAC ISLD HISPANIC AFR AM WHITE State Totals
Graduation Cohort
Source: California DataQuest System (http://data1.cde.ca.gov/dataquest) Figure 5.5. 4-year dropout rates by race/ethnicity.
Enrollment Trends
The current definition of a dropout relies upon the accuracy of each school or district in determining the status of absent students. When a student who is enrolled in school stops attending, there can be any of several causes: temporary absence due to illness, moving out of the school boundary, district, or state; transferring to a private or charter school; taking a General Education Development (GED) or California High School Proficiency (CHSPE) exam in lieu of completing high school; or dropping out. There are inherent difficulties in identifying some of these causes; while student transfers may produce a request for transcripts, other motivations may not result in explicit notification to the school. The appropriate classification of these reasons for discontinuing attendance at a given school is crucial to accurately determining dropout rates. For example, students who move out of the country or earn a GED certificate are not considered dropouts while students enrolled in non-GED adult education schools are considered dropouts. Given the inherent difficulties in schools or districts determining the accurate status of students who are expected, but neglect to appear in a given school year, as well as the ongoing debate regarding the appropriate calculation of dropouts, we offer another look at the dropout phenomenon: enrollment trends.
Human Resources Research Organization [HumRRO] Page 191
Independent Evaluation of the CAHSEE: Fourth Biennial Report
Enrollment counts are documented at the schoolhouse level in the fall of each school year. CDE maintains statewide aggregations of these figures. Since the beginning of this evaluation process, we have tracked enrollment figures by graduation class cohort. Comparing enrollment trend patterns over time serves here as an independent indicator of trends in retention or dropout rates. Until California has fully populated its data files with unique student identification codes and this database matures we cannot track the comings and goings of individual students. However ,overall enrollment figures provide an indication of the extent to which students in each grade do not proceed to the next grade with the rest of their classmates.
Before investigating the California enrollment trends, we offer a description of the following two typical enrollment patterns that are commonly seen both within and outside California. One persistent enrollment pattern is a 9th grade “bubble.” That is, in any given year more students are enrolled in the 9th grade than in either the 8th or 10th
grades. One oft-theorized explanation is that some first-time 9th graders fail to earn sufficient credits to achieve 10th grade status on time. Therefore in the fall of each year the 9th grade population comprises the prior year’s 8th grade graduates, and is inflated by the inclusion of some number of students who would have been 10th graders, if they were on pace with their classmates. [These students may earn extra credits in the coming year and “catch up” with their classmates, or may drop back to a later graduating class.] At the same time, the 10th grade enrollment would be suppressed by exclusion of those same students. A second persistent enrollment pattern is a decrease in enrollment (drop-off) each year after the 9th grade. This decrease is generally considered to include high school dropouts.
The CDE website provides enrollment counts. To present enrollment trends in a manner that is comparable across years despite population growth or declines, we have converted these enrollment counts to percentage decreases. Table 5.2 and Figure 5.6 show the decrease in enrollment from the 9th to the 10th grade for several recent years, going back far enough to precede the introduction of the CAHSEE. The most recent classes are listed first. As noted in the 2004 evaluation report (Wise, et al., 2004), the 10th grade drop-off rate increased for the Class of 2006. It was hypothesized that the increased drop-off rate was primarily due to a larger than usual increase in the number of students being retained in 9th grade. In the 2004–05 school year, the drop-off rate declined somewhat to 5.6 percent. This was followed by a substantial increase to 6.1 percent in 2005–06 and an even more substantial decrease to 5.3 percent in 2006–07.
Page 192 Human Resources Research Organization (HumRRO)
Chapter 5: Trends in Educational Achievement and Persistence During the CAHSEE Era
Table 5.2. Enrollment Declines From 9th to 10th Grade by High School Class School Year High School 10th Grade Prior Year’s 9th Decrease
Class Enrollment Grade Enrollment Number Percent 2006–072005–062004–052003–042002–032001–022000–011999–001998–991997–98
Source: California DataQuest System (http://data1.cde.ca.gov/dataquest). July 16, 2007. The “*” before a number represents a change in data from the 2006 evaluation report.
Source: California DataQuest System (http://data1.cde.ca.gov/dataquest). July 16, 2007. The “*” before a number represents a change in data from those available for the 2006 evaluation report.
12%
10%
8%
6%
4%
2%
0% 2000 2001 2002 2003 2004 2005 2006 2007 2008
7.8% 7.4%
7.9% 7.7%
6.7% 6.4% 6.4% 6.0%
5.5%
High School Class
Figure 5.7. Enrollment declines from 10th to 11th grade by high school class.
Table 5.4 and Figure 5.8 show similar information for the drop-off between 11th
and 12th grade enrollments. This rate decreased substantially (2.5 percentage points) with the Class of 2003. The reduced drop-off rate continued for subsequent cohorts, with the exception of the Class of 2006. The drop-off rate from 11th to 12th grade for the Class of 2007 is markedly lower than for any previous cohort analyzed here.
Page 194 Human Resources Research Organization (HumRRO)
Chapter 5: Trends in Educational Achievement and Persistence During the CAHSEE Era
Table 5.4. Enrollment Declines From 11th Grade to 12th Grade School Year High School 12 th Grade Prior Year’s 11th Decrease
Class Enrollment Grade Enrollment Number Percent 2006–072005–062004–052003–042002–032001–022000–011999–00
Source: California DataQuest System (http://data1.cde.ca.gov/dataquest). July 16, 2007. The “*” before a number represents a change in data from those available for the 2006 evaluation report.
12%
10%
8%
6%
4%
2%
0% 2000 2001 2002 2003 2004 2005 2006 2007
11.0% 10.8% 10.6%
8.1% 7.6%
7.2% 7.8%
5.2%
High School Class
Figure 5.8. Enrollment declines from 11th to 12th grade by high school class.
Enrollment Trends: Summary
We analyzed enrollment trends by graduation class cohort from the Class of 2000 through the fall 2007 enrollment counts. The fall enrollment numbers for the 2006– 07 school year reflect less grade-by-grade reduction than any previous year within this analysis. In other words, persistence to the next grade level, on time, appears to have increased across the high school grades.
Human Resources Research Organization [HumRRO] Page 195
Independent Evaluation of the CAHSEE: Fourth Biennial Report
GED Examinees
The new definition of dropouts, adopted in October 2003, does not classify students who received a General Education Development (GED) or California High School Proficiency Examination (CHSPE) certificate as dropouts (see Figure 5.2 for definition). To determine whether the post-2002 dropout rate trends were suppressed by an exodus of students seeking alternate credentials (perhaps in reaction to the CAHSEE requirement), we investigated patterns of GED examinations.
The GED test is a nationally recognized test offered by the American Council on Education (ACE), intended to assess examinees on high school-level knowledge. The examination sections are Language Arts, Writing (Parts I and II); Social Studies; Science; Language Arts, Reading; and Mathematics, comprising approximately seven hours of testing. The ACE Web site reports that “In order to pass the GED Tests, the GED candidate must currently demonstrate a level of skill that meets or surpasses that of the top 60 percent of graduating high school seniors.”12 ACE also indicates that “About one in seven high school diplomas issued in the United States each year is based on passing the GED Tests.”13
In California, individuals who pass the GED do not receive a high school diploma. Students must be at least 18 years old and can earn a California High School Equivalency Certificate via the GED.
Data for these analyses were provided by ETS, the contractor responsible for scoring the GED. Because the GED can be taken by adults long after high school, the request was restricted to individuals under 21 years of age who were potentially influenced by the CAHSEE requirement. Table 5.5 shows the number of individuals under the age of 21 taking the GED in California for the first time each year. Inspection of the table reveals no consistent trend.
Table 5.5. Number of First-time GED Examinees Under the Age of 21, by Year Year Number of Examinees
In California 2003 34,7152004 34,3272005 33,3792006 34,398
Source: ETS, via personal correspondence on October 12, 2007.
Table 5.6 depicts the number of examinees each year from 2003 through 2006, by race/ethnicity. Four demographic categories were not included here due to small
12 Information fromhttp://www.acenet.edu/AM/Template.cfm?Section=Professionals&TEMPLATE=/CM/ContentDisplay.cfm&CONTENTID=7857, retrieved 08/31/06. 13 According to http://www.acenet.edu/AM/Template.cfm?Section=Professionals&Template=/TaggedPage/TaggedPageDisplay.cfm&TPLID=58& ContentID=7788, retrieved 08/31/06.
Page 196 Human Resources Research Organization (HumRRO)
Chapter 5: Trends in Educational Achievement and Persistence During the CAHSEE Era
sample sizes (i.e., fewer than 1,000 individuals over the time period reported here). In addition, Mexican students were reported as a separate category from Hispanic starting in 2004. One important fact to note is that many examinees declined to identify their race/ethnicity, making analyses of trends by race/ethnicity imprecise.
Table 5.6. Number of GED Examinees Under the Age of 21, by Year, Sex, and Race/Ethnicity Year Race/Ethnicity Total
Total 70,498 24,863 25,160 7,988 3,788 1,783 1,153 1,333 136,819 Source: ETS, via personal correspondence on October 12, 2007. *: Mexican was reported as a separate category beginning in 2004.
Figure 5.9 depicts the same information for the four most populous demographic groups. Two trends are apparent in Figure 5.8. First, a larger number of White and Hispanic students take the GED than other racial/ethnic candidates. Third, the number of GED examinees declined in 2004 through 2006—relative to 2003—among White and Asian students, while the number of Hispanic students increased in 2006.
Overall, we find no evidence to date that the CAHSEE requirement has resulted in an exodus of high school students to the GED alternative.
7,000
6,000
5,000
Num
ber o
f Pas
sing
Sco
res
4,000
3,000
2,000
1,000
0 White Hispanic Origin or Descent Black, African American, Asian
African Descent
Race/Ethnicity
2003 2005 20062004
Figure 5.9. Number of first-time GED examinees under age 21, by year and race/ethnicity.
Human Resources Research Organization [HumRRO] Page 197
Independent Evaluation of the CAHSEE: Fourth Biennial Report
Figure 5.10 indicates the number of students passing the GED during this same period. Table 5.7 depicts the passing rates based on number of first-time examinees and number of passing students; please note that this does not directly indicate individuals who tested multiple times.
0
2,000
4,000
6,000
8,000
10,000
12,000
14,000
Num
ber o
f Pas
sing
Exa
min
ees
No response White Hispanic Origin or Black, African Asian Descent American, African
Descent
Race/Ethnicity
2003 2005 20062004
Figure 5.10. Number of passing GED examinees under age 21, by year and race/ethnicity.
Table 5.7. Passing Rates of GED Examinees Under the Age of 21, by Year and Race/Ethnicity Year Race/Ethnicity Total
Black, African Native American
No response White
Hispanic Origin or Descent
American, African Descent Asian
Hawaiian or Pacific Islander
Indian or Alaska Native Mexican
2003 67% 79% 61% 55% 70% 65% 63% --* 68% 2004 68% 80% 64% 57% 70% 65% 71% 51% 69% 2005 70% 80% 64% 60% 76% 69% 71% 62% 70% 2006 68% 80% 63% 60% 73% 69% 68% 47% 68% Source: ETS, via personal correspondence on October 12, 2007. *: Mexican was reported as a separate category beginning in 2004.
CHSPE Examinees
Another alternative to a traditional high school diploma is the California High School Proficiency Examination (CHSPE). The CHSPE consists of a mathematics section and an English-language arts section, both of which must be passed to obtain a Certificate of Proficiency awarded by the California State Board of Education. California law treats the Certificate of Proficiency as equivalent to a high school diploma. Students
Page 198 Human Resources Research Organization (HumRRO)
Chapter 5: Trends in Educational Achievement and Persistence During the CAHSEE Era
who earn the Certificate of Proficiency and have parental approval may leave high school early. At the time of testing, eligible candidates must be at least 16 years old, or have completed at least one academic year of the tenth grade, or be enrolled in the second semester of tenth grade. The CHSPE is administered three times annually (once in the spring, once in the summer, and once in the fall) and is offered in English only. The number of participants in the CHSPE program is considerably smaller than in the GED program.
Our 2006 evaluation report (Wise, et al., 2006) analyzed CHSPE results through the summer of 2006. This report concluded that these data did not seem to suggest an increase in CHSPE participation occurred for any demographic group in the year that passing the CAHSEE became required for graduation, but these data should be reexamined after more results are available. The tentative conclusion for the CHSPE mirrored that for the GED: there does not appear to be a noticeable increase in seeking the CHSPE Certificate of Proficiency as an alternative to the traditional high school diploma. We were unable to secure more recent CHSPE data in time for inclusion in this report.
Human Resources Research Organization [HumRRO] Page 199
Independent Evaluation of the CAHSEE: Fourth Biennial Report
Student Predictions if They Do Not Pass CAHSEE
Students respond to several survey questions at the end of each CAHSEE ELA and Math test. In the 2006–07 administrations, students were asked what they will do if they do not pass the CAHSEE. Table 5.5 depicts responses from 10th, 11th, and 12th
graders. The reader is reminded that the 10th grade administration is a census administration so responses reflect the entire class, while the 11th and 12th grade administrations are mostly restricted to students who have not previously passed the CAHSEE. While some of these students may be new enrollees in California, the majority are students who have struggled to pass the CAHSEE already.
Responses are presented in Table 5.8 in order of descending frequency for 10th
graders, rather than in order presented in the survey. Three-quarters of 10th graders plan to stay in school and try again; this option is less popular with upperclassmen. Another 15 percent of 10th graders plan to participate in either another program or community college courses, then try the CAHSEE again—options endorsed by 27–31 percent of upperclassmen. Intentions to pursue a GED range from two percent of 10th
graders to 8 percent of 12th graders. Only one percent of 10th graders and three percent of 12th graders indicate they would give up trying to get a diploma altogether.
Table 5.8. Expectations of High School Graduation Indicated by 10th Grade Students in 2004, 2005, and 2006 Question 14: If you do not pass the 10th graders 11th graders 12th graders CAHSEE, what will you do? (Class of 2009) (Class of 2008) (Class of 2007) Stay in school and try again ELA 75.1% 56.0% 46.8%
Math 76.3% 56.4% 46.2%
Participate in some other type of ELA 10.3% 15.6% 14.8% program that will help me pass the CAHSEE
Math 8.8% 14.8% 14.3%
Do not know ELA 6.0% 9.2% 11.0% Math 6.3% 9.7% 12.1%
Take courses at community ELA 5.5% 11.4% 16.9% college and try again
Math 5.3% 11.6% 16.7%
Try to get a GED certificate ELA 2.0% 5.3% 7.5% Math 1.9% 5.2% 7.8%
Give up trying to get a diploma ELA 1.2% 2.5% 3.0% altogether
Math 1.4% 2.3% 2.9%
Page 200 Human Resources Research Organization (HumRRO)
Chapter 5: Trends in Educational Achievement and Persistence During the CAHSEE Era
Graduation Rates
Another indicator that could conceivably be affected by the CAHSEE requirement is the high school graduation rate. CDE publicly reports the graduation rate in two ways:
Perc
enta
ge
(a) graduation rate as a percentage of Grade 12 enrollment and (b) graduation rate as a percentage of Grade 9 enrollment of this graduating class. The latter calculation is based upon the NCES definition: the numerator is the number of graduates in Year 4 and the denominator is the sum of the number of graduates in Year 4, plus the dropouts in grades 9–12.
Inspection of Figure 5.11 reveals that both graduation rates dropped in 2006, relative to previous years. The graduation rate as a percentage of Grade 12 fall enrollment had declined somewhat in previous years and declined by 4.2 percentage points in 2006. The percentage of graduates based on Grade 9 fall enrollment had increased slightly in previous years but dropped by 4.0 percentage points in 2006.
100
90
80
70
60
50
40
30
20
10
0 2002 2003 2004 2005 2006
89.1 88.3 86.7 86.7 82.5
69.6 70.8 70.7 71.1 67.1
Graduation Year llGraduation Rate (as % of Grade 12 Enro ment) Graduation Rate (% of grade 9 to graduate)
Source: California DataQuest System (http://data1.cde.ca.gov/dataquest). More recent data were unavailable as of September 21, 2007.
Figure 5.11. Graduation rates based on grade 9 and 12 fall enrollments.
At the conclusion of each CAHSEE administration, students were asked to indicate whether they expected to graduate from high school. Responses from 10th
grade students are provided in Table 5.9 from test administrations in 2005, 2006, and 2007, representing students in the classes of 2007, 2008, and 2009, respectively. While
Human Resources Research Organization [HumRRO] Page 201
Independent Evaluation of the CAHSEE: Fourth Biennial Report
this is a subjective personal prediction rather than the objective actual graduation rates in Figure 5.9, nonetheless this provides one view of trends over time.
Because students respond to these survey questions after each CAHSEE test (i.e., ELA and math), this table reflects two responses per student. Throughout the table percentages selecting each option after the ELA test closely mirror those after the math test; this is to be expected and serves to indicate that the responses are stable regardless of difficulty students may have just experienced with one or the other subject-area tests. Across time, expectations of graduation dipped somewhat for the Class of 2008 sophomores, but rose back to just above previous levels for the Class of 2009.
Table 5.9. Expectations of High School Graduation Indicated by 10th Grade Students in 2004, 2005, and 2006 Question 3: Do you think you will graduate from high school?
Yes
No
Unsure
ELA Math
ELA Math
ELA Math
Survey Year 2005 (Class of
2007) 88.7% 87.9%
1.4% 1.8%
9.9% 10.2%
Survey Year 2006 (Class of
2008) 86.0% 84.9%
Survey Year 2007 (Class of
2009) 88.8% 88.0%
1.4% 1.3% 1.8% 1.7%
12.6% 9.9% 13.3% 10.3%
Student Plans After High School
The student survey administered after each CAHSEE administration also includes a question about post-high school plans. Responses from 10th grade students are provided in Table 5.10 from test administrations in 2005, 2006, and 2007, representing students in the classes of 2007, 2008, and 2009, respectively. Response options are presented here in descending order of selection to facilitate interpretation rather than in the order they were presented in the survey.
Because students respond to these survey questions after each CAHSEE test (i.e., ELA and math), this table reflects two responses per student. Throughout the table percentages selecting each option after the ELA test closely mirror those after the math test; this is to be expected and serves to indicate that the responses are stable regardless of difficulty students may have just experienced with one or the other subject-area tests.
Responses across time are quite stable. Approximately 55 percent of high school sophomores expect to proceed to a 4-year college or university and another 18–19 percent plan to attend community college. An additional 4 percent plan to continue their formal education in a vocational, technical or trade school.
Page 202 Human Resources Research Organization (HumRRO)
Chapter 5: Trends in Educational Achievement and Persistence During the CAHSEE Era
Table 5.10. Post-High School Plans Indicated by 10th Grade Students in 2004, 2005, and 2006 Question 5: What do you think you will do after high school?
4-year college or university
Community college
Don’t know
Join the military
Work full time
Vocational, technical, or trade school
Survey Year Survey Year Survey Year 2005 (Class of 2006 (Class of 2007 (Class of
2007) 2008) 2009) ELA 55.9% 54.8% 55.4% Math 55.0% 54.1% 54.8%
ELA 18.4% 18.5% 19.0% Math 18.3% 18.6% 18.7%
ELA 13.2% 14.2% 14.1% Math 13.6% 14.1% 14.6%
ELA 5.0% 4.9% 4.2% Math 5.4% 5.5% 4.5%
ELA 3.5% 3.9% 3.7% Math 3.7% 4.0% 3.9%
ELA 4.0% 3.7% 3.6% Math 4.0% 3.6% 3.5%
College Preparation (SAT/ACT/UC & CSU courses)
Indicators of educational quality include the rigor of coursework undertaken in high school as well as the proportion of students intending and prepared to engage in postsecondary education. We turn now to two sets of indicators (other than the CAHSEE) of student preparedness for college.
College Entrance Examination Participation and Performance
The level of student aspirations for education beyond high school is reflected in the proportion of students who sit for college entrance examinations. College readiness can also be examined by looking at the performance of students who take such tests. These two factors are confounded, in that higher participation may be related to lower scores overall. For example, if only a small, high performing proportion of a class takes an exam, scores will be high but participation will be low. If a larger proportion of students, who may be lower performing, are encouraged to test, the average scores will drop but participation rates will increase. Interpretation of patterns requires care because of this confounding effect.
Two college-entrance examination programs are prevalent in the United States: the SAT and the ACT. Figure 5.12 indicates the percentage of California students participating in these two examination programs. The lines with diamond-shaped markers represent the proportion of each Grade 12 class who took either the SAT or ACT. Approximately 36 percent of the Class of 2005 took the SAT and almost 10 percent took the ACT. The percentage of seniors taking the SAT increased substantially
Human Resources Research Organization [HumRRO] Page 203
Independent Evaluation of the CAHSEE: Fourth Biennial Report
in the 2005–06 school year, rising to 40.5 percent—the highest percentage in the 7-year period analyzed here. ACT participation rates were not yet available on the CDE Web site at the time this report was produced. Neither SAT nor ACT participation rates for 2006-07 were available.
Figure 5.12 also shows the percentage of students who achieved a particular score on these two exams, over time. The graph uses the same cut points used for reporting on the CDE Web site. The lines with upward-arrow pointers reflect the percentage of students achieving a minimum combined score of 1000 on the SAT or 21 on the ACT, respectively.14 The percentage of students attaining a score of 1000 or better on the SAT has remained fairly stable at slightly over 19 percent each year, although the rate dipped in 2003–04 to 18.6 percent, then recovered to previous levels. The rate in 2005–06 was 19.2, .1 percentage points lower than the previous year. ACT results for the 2005–06 school year were not available in time for this report. The percentage of California students reaching an ACT score of at least 21 has increased over time, reaching its highest level within this timeframe (school years 1999–00 through 2004–05) of 5.4 percent in the 2004–05 school year.
SAT Percent Test Takers SAT Percent >= 1000 ACT Percent Test-Takers ACT Percent >=21
Source: California DataQuest System (http://data1.cde.ca.gov/dataquest) NOTE. 2005–06 ACT data were not available in time for this report.
Figure 5.12. SAT and ACT participation rates and success rates over time.
14 The national rank for a combined SAT score of 1000 is the 45th percentile. The national rank for an ACT Composite score of 21 is the 57th percentile.
Page 204 Human Resources Research Organization (HumRRO)
Chapter 5: Trends in Educational Achievement and Persistence During the CAHSEE Era
The 2006 CAHSEE independent evaluation report provided SAT participation rates disaggregated by gender and race/ethnicity. This analysis is not included here because 2005–06 data were not available on the CDE website in time for this report.
Another metric to assess success on tests such as the SAT and ACT is to look at mean scores. SAT exams are scored on a range of 200–800. Figure 5.13 indicates that mean SAT math and verbal scores generally increased each year between 2001 and 2005, but both verbal and mathematics mean scores dropped in the 2005-06 school year. Figure 5.14 shows mean scores on the ACT exam over the same period, although scores for the 2005–06 school year were not available in time for this report. ACT exams are scored on a range of 1–36.
Source: California DataQuest System (http://data1.cde.ca.gov/dataquest) Figure 5.14. ACT mean scores over time.
College Preparatory Coursework
Another indicator of educational quality is the caliber of coursework completed. Two of California’s statewide university systems, the University of California and the California State University, have developed a list of courses known as “A–G courses” that are required for incoming freshmen. This list includes 16 units of high school courses, of which at least 7 must be taken in the last two years of high school. In this system, a unit represents a full year (two semesters) of study.
Figure 5.15 indicates the percentage of public high school graduates who completed A–G courses over several years. The rate has held fairly steady at about a third of the graduating class each year. The most recent data available on the California Postsecondary Education Commission (CPEC) Web site references the Class of 2006; 36 percent of the graduates of this class completed the A–G courses. This was an increase over previous years, although the reader is cautioned that in 2006 CPEC began rounding the percentage to the nearest whole number so precise differences cannot be calculated.
Page 206 Human Resources Research Organization (HumRRO)
Chapter 5: Trends in Educational Achievement and Persistence During the CAHSEE Era
50%
40%
30%
20%
10%
0% 2000 2001 2002 2003 2004 2005 2006
Year
Source: California Postsecondary Education Commission Web site (www.cpec.ca.gov). More recent data were unavailable as of September 21, 2007. Figure 5.15. A–G course completion over time.
Table 5.11. A–G Course Completions as a Percentage of Freshmen 4 Years Earlier, by Race/Ethnicity and Gender
Perc
enta
ge o
f Pub
lic H
S G
radu
ates
34.8% 35.6% 34.7% 33.5% 33.7% 35.2% 36%
Ethnicity Gender Graduation Year (Class)
2000 2001 2002 2003 2004 2005 2006
Black
Native American
Asian
Pacific Islanders
Latino
White
Filipino
Male Female
Male Female
Male Female
Male Female
Male Female
Male Female
Male Female
12% 18%
13% 18%
45% 56%
15%20%
10% 15%
27% 35%
33% 47%
11% 18%
12% 19%
45% 57%
17% 21%
10% 16%
27% 36%
33% 48%
11% 19%
14% 19%
45% 57%
17% 23%
10% 16%
26% 36%
32% 46%
11% 19%
15% 20%
45% 57%
17% 24%
10% 16%
26% 36%
35% 48%
11% 19%
16% 20%
45% 59%
19% 23%
10% 17%
26% 37%
35% 49%
11% 21%
13% 20%
47% 61%
18% 28%
11% 19%
27% 38%
36% 52%
10% 18%
12% 20%
48% 60%
16% 26%
11% 18%
26% 36%
32% 48%
Overall 24% 24% 24% 24% 24% 25% 24%
Note. Data retrieved from http://www.cpec.ca.gov/Accountability/AtoGReport.ASP September 21, 2007. Race/ethnicity designations differ from the rest of this report but mirror those on the CPEC Web site.
The CPEC Web site provides a variety of breakdowns of the A–G course completion information. While Figure 5.13 depicts rates of course completion as a
Human Resources Research Organization [HumRRO] Page 207
Independent Evaluation of the CAHSEE: Fourth Biennial Report
percentage of high school graduates, Table 5.11 reports these rates as a percentage of freshman enrollment 4 years earlier, resulting in overall lower rates. This table also provides a breakdown by race/ethnicity and gender. For example, the number of African American males completing A–G courses in the Class of 2006 was 10 percent of the number of African American male freshmen in 2002–03.
AP Test Achievement
The College Board’s Advanced Placement (AP) program comprises a set of college-level courses offered in high school. Students have the option of taking a standardized AP examination after completing the course to earn college credit and/or gain placement in advanced college courses. AP exam participation rates and scores are indicators of the rigor of high school courses as well as of the intentions of students to attend college The College Board currently offers 37 AP courses and exams over 22 subject areas, but not all courses are offered at all high schools.
Figure 5.16 displays AP examination participation rates among California students over time. Each bar represents the percentage of juniors and seniors taking at least one AP exam in a given school year. The rates increased every year between 1999–2000 and 2005–06, the most recent year available on the CDE Web site.
Source: California DataQuest System (http://data1.cde.ca.gov/dataquest) Figure 5.16. AP participation rates over time.
The CDE Web site also reports AP pass rates over time. These data are summarized in Figure 5.17 but require some explanation. The numerator in each
Exam
Page 208 Human Resources Research Organization (HumRRO)
Chapter 5: Trends in Educational Achievement and Persistence During the CAHSEE Era
calculation is the number of AP tests on which a score of 3 or greater15 was earned. The denominator for one line is Grade 12 enrollments; the denominator on the other line is total Grade 11 and Grade 12 enrollment. Note that students who earned a score of 3 or better on multiple AP exams were counted multiple times in the numerator, but only once in the denominator. Therefore, the rate of 26.3 percent pass rate among 12th
graders in 2005–06 does not indicate that 26.3 percent of high school seniors earned AP credit; in fact, Figure 5.16 indicates that only 25.5 percent of seniors and juniors took one or more AP exams. However, these rates are useful to assess overall AP impact over time. Inspection of Figure 5.17 reveals that AP pass rates have increased over time, with a marked increase in the 2005–06 school year. This is an indirect indicator of more students taking a higher number of more rigorous high school courses.
Number of AP Scores >=3 / Grade 12 Enrollment Number of AP Scores >=3 / Grades 11 + 12 Enrollment
Source: California DataQuest System (http://data1.cde.ca.gov/dataquest) Figure 5.17. AP pass rates over time (i.e., number of AP exam scores >=3 as a percentage of student enrollment).
College Preparation: Summary
The percentage of high schools seniors taking the SAT exam increased substantially in the 2005–06 school year, from 35.9 percent to 40.5 percent. At the same time the mean score on the SAT dropped (from 521 to 516 on the verbal portion of the exam and from 499 to 495 on the math portion). This relationship of increased
15 AP exam scores are on a scale of 1–5. Typically postsecondary institutions grant credit or advanced placement for minimum scores of 3 or 4. A score of 3 is a commonly accepted indicator of success on an AP exam.
Human Resources Research Organization [HumRRO] Page 209
Independent Evaluation of the CAHSEE: Fourth Biennial Report
participation associated with reduced mean score is consistent with research on other testing programs and likely reflects inclusion of a wider range of students in this important step toward college participation. We note that the percentage of students earning a combined score of 1000 or better declined very slightly, from 19.3 to 19.2 percent. Historically, approximately ten percent of each graduating class takes the ACT exam; ACT results for the 2005–06 and 2006–07 school years were not available in time for this report.
During the high school years, students are required to take specific courses in order to graduate. Students who aspire to enter the University of California or California State University systems are required to meet a higher standard to be accepted as an incoming freshman: A–G courses. A higher percentage of the graduating class in 2004– 05 completed this coursework than in the previous two years. (Data are not yet available for the Classes of 2006 or 2007.)
Another indicator of the rigor of high school coursework is participation in, and success on, Advanced Placement examinations. The 2005–06 school year brought increased participation and higher performance on these exams.
College/University Enrollment
We turn toward college and university enrollment as an indicator of the extent to which high schools are preparing—and perhaps encouraging—students to continue their education beyond high school. Information presented here was gathered from the California Postsecondary Education Commission (CPEC) Web site. CPEC reports information about enrollments in various strata of California colleges and universities (i.e., University of California (UC), California State Universities (CSU) and California Community Colleges (CCC)) over time. Enrollment data are provided for all college-level students, as well as first time freshmen (FTF) from public and private California high schools. Data regarding California high school graduate enrollment as FTF are provided here with a caveat; these data do not indicate the number or percentage of California high school graduates who enroll in out-of-state schools. Therefore these data are not presented as a complete and direct measure of college attendance after high school, but only as a partial picture.
Table 5.12 lists counts of public and private high school graduates and FTF enrollments by California system and overall, for 7 years.
Page 210 Human Resources Research Organization (HumRRO)
Chapter 5: Trends in Educational Achievement and Persistence During the CAHSEE Era
Table 5.12. California Postsecondary Education Commission (CPEC) Counts of High School Graduates and FTF Enrollments Year High School Graduates First-Time Freshmen
Public Total University of California State California Total California (UC) University (CSU) Community
Source: California Postsecondary Education Commission Web site (http://www.cpec.ca.gov/). In 2006 counts and rates were calculated by combining public and private high school values.
Summary Findings
Data sources outside the CAHSEE program provide indications of the state of education in California, and can be used to draw out possible effects of the CAHSEE program on education as a whole. The Class of 2006 was the first required to pass both parts of the CAHSEE in order to receive a high school diploma, so trends from 2006 forward are of particular import.
One important indicator of the impact of the CAHSEE requirement is whether the proportion of students who leave high school without a diploma changes in some way. This straightforward question demands a multifaceted answer. First, we note that official dropout rate calculations indicate that both single-year and 4-year dropout rates increased in 200616. We note that the number of dropout students was relatively stable in grades 9, 10, and 11 over this period, but the number of dropouts in Grade 12 increased from 14,202 in 2002 to 24,097 in 2006. Figures from 2007 are not yet available. Among the years analyzed, this increase was most marked in the 2005–06 school year.
As a second look at students leaving high school prematurely we investigated enrollment trends by grade and over time. While this measure does not directly address mobility in and out of the state, substantial changes in enrollment declines can be used as an indirect indicator of dropout rates. We were particularly interested in changes in enrollment declines in fall 2007, as it became clear that failure to pass the CAHSEE examination would stand as a firm impediment to graduation. Enrollment patterns indicate that the drop-off rate for the most recent classes (i.e., Class of 2007’s 12th
grade, Class of 2008’s 11th grade, and Class of 2009’s 10th grade) declined in fall 2007. In other words, a larger percentage of students stayed in school and proceeded to the next class, from grades 9 through 12.
16 Long-term trend results should be interpreted with caution because CDE amended its definition of dropouts in 2003 to conform to federal NCES guidelines.
Human Resources Research Organization [HumRRO] Page 211
Independent Evaluation of the CAHSEE: Fourth Biennial Report
High school graduation rates can also be measured in multiple ways. CDE makes two metrics publicly available: the graduation rate as a percentage of Grade 12 enrollment (i.e., the rate at which the incoming senior class successfully completes high school) and the graduation rate from Grade 9 to graduation. Both of these rates declined in 2006 by approximately 4 percentage points. Rates for the Class of 2007 were not available in time for this report.
Participation in the SAT college entrance examination increased notably in the 2005–06 school year, at 40.5 percent compared to 35.9 percent in the previous year. Over the same period the mean score among SAT examinees dropped by 4–5 points on both the verbal and math scales, and the percentage of students earning a combined score of 1000 or better declined from 19.3 to 19.2 percent. This combination of factors may indicate that a broader pool of students is considering continuing its formal education beyond high school.
Rates of completion of A–G courses increased in 2005 over previous years; 2006 and 2007 data are not yet available. Meanwhile, participation in AP exams, and scores of 3 or greater on those exams, have steadily increased since 2000. The increases in AP exam participation and pass rates increased markedly in 2006.
In short, we found that graduation rates declined and dropout rates increased for the Class of 2006, the first students to be denied a diploma if they did not pass the CAHSEE ELA and mathematics exams. Rates for the Class of 2007 are not yet available. We could not directly determine whether students who did not graduate failed to do so solely because of the CAHSEE requirement. We found that enrollment trends indicate that more students seem to be persisting in their education from year to year, up through fall of their senior year, but dropouts during the senior year spiked. On a positive note, participation in (and success on) Advanced Placement exams increased in 2006, indicating that performance among high performing students is on the rise. Participation in college entrance exams increased while mean scores dropped, seemingly reflecting an interest in college by a broader swath of the graduating class.
Page 212 Human Resources Research Organization (HumRRO)
Chapter 6: Summary and Recommendations
Chapter 6: Summary and Recommendations
Lauress L. Wise and D. E. (Sunny) Becker
Introduction
HumRRO gathered, analyzed, and reported a wide range of information during our CAHSEE evaluation of the 2006–07 school year. This information has implications for most aspects of the CAHSEE, from the development of the test itself to how it is used and its impact on specific groups of students. In this final chapter, we provide a discussion of key findings from the various evaluation activities. As in prior reports, we offer a number of recommendations for further improving the CAHSEE and its use.
Key Findings
Evaluation activities in 2007 included analysis of test results, the survey of a longitudinal sample of schools, and identification and analysis of potential indicators of CAHSEE impact.
CAHSEE Test Score Quality
Finding 1: HumRRO verified the accuracy of the scoring and equating of the CAHSEE test forms. Scoring consistency for the essay improved this year.
HumRRO performed independent psychometric analyses of the March 2007 CAHSEE test form. Using nonproprietary software, we replicated the estimation of item difficulty parameters, the equating of total scores to the constant reporting scale, and the raw-to-scale score conversion tables. Replication of ETS results demonstrates that their psychometric processes are working properly.
Scorer agreement on the essays increased. In 70 percent of the cases, the two independent scorers agreed exactly on the score to be assigned. In fewer than 0.5 percent of the cases did the two scorers disagree by more than one score-point. This is an increase in scoring consistency from last year.
CAHSEE Test Results
Finding 2: Last year’s seniors continued to test after their original target graduation date.
Roughly 40 percent of students in the Class of 2006 who had not passed the CAHSEE by June of their senior year continued to take the CAHSEE. More than a quarter of those still testing completed the CAHSEE requirement this year.
Human Resources Research Organization [HumRRO] Page 213
Independent Evaluation of the CAHSEE: Fourth Biennial Report
Finding 3: Passing rates through 12th grade for the Class of 2007, the 11th grade for the Class of 2008, and the 10th grade for the Class of 2009 were similar to the corresponding rates for previous classes.
Cumulative passing rates for seniors in the Class of 2007 were the same as for the Class of 2006 (91.2 percent passing both parts) when all current seniors were counted. The rates were about 2 percentage points higher when this year’s repeat 12th
graders were excluded. Passing rates for 12th graders continuing to test were closely related to their level of performance on the end-of-course test that they took in 11th
grade. More students reported taking Algebra I. More of those who did not pass were older, English learners, African American or Hispanic, and low-SES compared to all 10th
graders in 2005.
Cumulative passing rates for 11th graders in the Class of 2008 decreased slightly compared to 11th grade passing rates for the classes of 2006 and 2007 for all groups except Hispanic students and students with disabilities, which showed slight increases in CAHSEE passing rates.
Just over 65 percent of 10th graders completed the CAHSEE requirement, the same as in the past 2 years. This year, we were able to identify about 2 percent of the current 10th graders that were repeating the 10th grade. Of these repeaters, only 21 percent met the CAHSEE requirement by the end of this year compared to 66 percent of the first-time 10th graders.
Finding 4: More students are taking Algebra I by 10th grade.
As shown in Figure 6.1, the proportion of 10th graders who had not yet had Algebra I declined sharply for all demographic groups.
Perc
ent N
ot Y
et T
akin
g A
lgeb
ra I
40%
30%
20%
10%
0%
4% 5% 5% 6% 8% 16
%
15%
13% 15%
20%
19%
16% 18%
18%
17%
15% 18
%
20%
19%
16% 18%
22%
20%
17% 20
%
37%
35%
30%
27%
16%
2003 2004 2005 2006 2007
All ic i ii
Students Hispan Afr can-Amer can Low-Income Engl sh Learner Special Educ.
Figure 6.1. Percent of 10th graders who have not yet taken Algebra 1 by assessment year.
Page 214 Human Resources Research Organization (HumRRO)
Chapter 6: Summary and Recommendations
Finding 5: Students in demographic groups with low pass rates (minorities, economically disadvantaged students, and students with disabilities) in schools with a high proportion of similar students continue to have lower passing rates than students in these groups in schools with fewer similar students.
Average CAHSEE scores for 10th grade African American students in schools where they were less than 2.1 percent of the total10th grade enrollment were 10 points higher than average scores for African American students in schools where they constituted more than 13 percent of the 10th grade enrollment. Similarly, scores for Hispanic students in schools where they were 14 percent or less of the 10th grade enrollment were nearly 20 points higher than scores for Hispanic students in schools where they were more than two-thirds of the 10th grade enrollment. Similar mean score differences were found for low-income students, for English learners, and, to a somewhat lesser extent, for students with disabilities. (See Table 2.43.).
Results for Specific Populations
In our 2007 analyses, we again took a closer look at two populations of students who have had particular difficulty meeting the CAHSEE requirement—English learners and students with disabilities. We examined additional information on the characteristics of students in each of these populations and on the nature of the services they receive. This year, we also conducted further analyses of low-income and racial/ethnic minority students who have had difficulties meeting the CAHSEE requirement.
Finding 6: As noted previously, many students are still classified as English learners after as many as 10 years of education in this country. Students in this group appeared to have more severe problems, many participating in special education programs as well as English language development programs.
For English learners, the most striking result continues to be how many had been enrolled in US schools for a long time, essentially since kindergarten. Students in this group appeared to have more severe problems, many participating in special education programs as well as English language development programs. Another important finding was that students who were enrolled within the last few years had lower CAHSEE passing rates compared to students who had been in English language development programs for a longer time. Students who had been English learners but were subsequently reclassified as fluent had relatively little difficulty with the CAHSEE.
In our current analyses, we obtained and merged data from the 2005 and 2006 administrations of the California English Language Development Test (CELDT) (2007 results are not yet available). Tenth grade students who scored in the bottom three levels of the CELDT in 2005 or 2006 had little chance of passing the CAHSEE ELA test in 2007 (less than 20 percent). Just over 25,000 of the EL students with matching CELDT data scored at CELDT Level 4, and 46 percent of these students passed the
Human Resources Research Organization [HumRRO] Page 215
Independent Evaluation of the CAHSEE: Fourth Biennial Report
CAHSEE ELA test in 2007. At CELDT Level 5, the CAHSEE ELA passing rate was over 71 percent, but only about 10 percent of EL students reached this level. By contrast, nearly half of the 2007 10th graders reclassified to fluent English proficient (RFEP) had scored at the top level (Level 5) of the CELDT in 2005 or 2006 and nearly 90 percent of these students passed the CAHSEE ELA test in 2007.
Finding 7: For students with disabilities, participation in regular classroom instruction is closely related to meeting the CAHSEE requirement. Participation in regular instruction and also the specific services students receive vary by type of disability.
As was the case in 2005 and 2006, our analysis of information on students with disabilities revealed a strong relationship between the degree to which these students participate in regular classroom instruction and their success on the CAHSEE. Both participation in regular instruction and CAHSEE success vary considerably for students in different primary disability categories. Students with mental retardation are unlikely to spend much time in regular classroom instruction. Very few pass the CAHSEE, and relatively few even continue to take the CAHSEE after 10th grade. The types of services students receive also vary by primary disability category, although provision of these services is not closely related to CAHSEE outcomes, independent of time spent in regular instruction. It is likely that the value of these services is balanced by the greater needs of the students who receive them.
Finding 8: California Standards Test (CST) end-of-course test results and CAHSEE results provide consistent conclusions about students with disabilities.
This year, we also examined 2006 CST end-of-course test results for students with disabilities. CST score levels in 2006 were a very good predictor of success on the corresponding CAHSEE test in 2007. CAHSEE success also varied considerably as a function of which end-of-course test the student took. For ELA, students who took the 10th grade ELA test in 2006 and were still 10th graders in 2007 passed the CAHSEE at much lower rates compared to students who took the 9th grade end-of-course ELA test in 2006. Similarly, students who took the General Mathematics end-of-course test in 2006 passed the CAHSEE mathematics test at much lower rates than students who took the Algebra I end-of-course test in 2006. (See tables 3.21 and 3.22.)
Finding 9: Performance gaps for low-income and racial/ethnic minority students persist and these groups tend to be clustered in low-performing schools.
Finally, performance gaps for low-income and racial/ethnic minority students are large and cut across most groups of students defined by type of disadvantage (students with disabilities, English learners, and low-income students). Low-income and racial/ethnic minority students tend to be clustered in low performing schools and their performance in schools at each overall performance level examined here was lower
Page 216 Human Resources Research Organization (HumRRO)
Chapter 6: Summary and Recommendations
than other students in these schools. While there has been an overall decrease in the total number of students in the lowest-performing schools (about 5 percent), the demographic composition of schools at each level has been relatively unchanged since 2004.
Curriculum and Instruction
Finding 10: Many teachers continue to be unaware of state-provided CAHSEE resources such as the CDE Web site and Teacher Guide, while teachers who reported familiarity with these sources indicated they were useful.
Implementation of activities to support teacher knowledge and readiness did not increase commensurate with the increases observed for students. In fact, results suggest adequate preparatory activities for teachers might be lacking. Many teachers continue to be unaware of the CAHSEE resources of the CDE Web site (36%) and the Teacher Guide (18%). Those teachers who reported familiarity with these sources tended to find them useful, suggesting benefits to ensuring that all teachers gain familiarity with these resources. In addition, a fairly substantial number of teachers (about one quarter to one third) reported not receiving any state or local CAHSEE-related professional development over the past year. Teachers continue to rate the quality of local professional development as superior to state professional development; however, overall satisfaction tended to be low.
Finding 11: Survey results suggest that the CAHSEE is reported to be useful for guiding instruction in schools where performance is lowest.
Principals and teachers rated the impact of the CAHSEE on instructional activities. Overall, the trend in responses regarding the CAHSEE’s impact on instruction has been positive. A cross-analysis of the impact on instruction with actual performance data suggests teachers and principals from lower-performing schools perceive an increased positive impact of the CAHSEE on instruction. These results suggest the CAHSEE is considered most useful for guiding instruction for students and schools that need the most assistance.
Finding 12: Principals and ELA and math teachers did not agree on whether teachers in other subjects perceive that they share in responsibility for students’ success on the CAHSEE.
Surveyed principals and ELA and math teachers rated how responsible they believed non-CAHSEE teachers considered themselves to be for student performance. Trends for principals increased substantially, while the trend for teachers decreased substantially. These results suggest a disconnect in the amount of responsibility teachers and principals believe is felt by non-CAHSEE teachers.
Human Resources Research Organization [HumRRO] Page 217
Independent Evaluation of the CAHSEE: Fourth Biennial Report
Other Outcome Indicators
Finding 13: Graduation rates declined by about 4 percentage points for the Class of 2006 (the most recent data available), the first year students were required to pass the CAHSEE to obtain a diploma. Similarly, dropout rates increased, most markedly in Grade 12.
One important indicator of the impact of the CAHSEE requirement is whether the proportion of students who leave high school without a diploma changes in some way. This straightforward question demands a multifaceted answer. Official dropout rate calculations indicate that both single-year and 4-year dropout rates increased in 200617. While the number of dropout students was relatively stable in grades 9, 10, and 11 over this period, the number of dropouts in Grade 12 increased from 14,202 in 2002 to 24,097 in 2006. Figures from 2007 are not yet available. Among the years analyzed, this increase was most marked in the 2005–06 school year.
As an alternative look at students leaving high school prematurely, we investigated enrollment trends by grade and over time. While this measure does not directly address mobility in and out of the state, substantial changes in enrollment declines can be used as an indirect indicator of dropout rates. We were particularly interested in changes in enrollment declines in fall 2007, as it became clear that failure to pass the CAHSEE examination would stand as a firm impediment to graduation. Enrollment patterns indicate that the drop-off rate for the most recent classes (i.e., Class of 2007’s 12th grade, Class of 2008’s 11th grade, and Class of 2009’s 10th grade) declined in fall 2007. In other words, a larger percentage of students stayed in school and proceeded to the next class in the following fall, from grades 9 through 12.
High school graduation rates can also be measured in multiple ways. CDE makes two metrics publicly available: the graduation rate as a percentage of Grade 12 enrollment (i.e., the rate at which the incoming senior class successfully completes high school) and the graduation rate from Grade 9 to graduation. Both of these rates declined in 2006 by approximately 4 percentage points. Rates for the Class of 2007 were not available in time for this report.
Finding 14: College preparation activities hint at a broader interest among high school students in going to college.
Participation in the SAT college entrance examination increased notably in the 2005–06 school year, at 40.5 percent, compared to 35.9 percent in the previous year. Over the same period the mean score among SAT examinees dropped by 4–5 points on both the verbal and math scales, and the percentage of students earning a combined score of 1000 or better declined from 19.3 to 19.2 percent. This combination of factors
17 Long-term trend results should be interpreted with caution because CDE amended its definition of dropouts in 2003 to conform to federal NCES guidelines.
Page 218 Human Resources Research Organization (HumRRO)
Chapter 6: Summary and Recommendations
may indicate that a broader pool of students is considering continuing its formal education beyond high school.
Rates of completion of A–G courses (which are identified as preparatory to California colleges) increased in 2005 over previous years; 2006 and 2007 data are not yet available. Meanwhile, participation in Advanced Placement (AP) exams, and scores of 3 or greater on those exams, have steadily increased since 2000. AP exam participation and pass rates increased markedly in 2006.
Recommendations
As in past years, we offer several general recommendations based on observations and findings from our evaluation activities. These recommendations are targeted to the Board and the legislature as they consider additions or modifications to policies concerning the CAHSEE and its use. At this time, we are not recommending overall changes to the CAHSEE requirement. Our first two recommendations concern the need for more information to identify programs that might mitigate negative consequences for students who are not able to pass the CAHSEE by the end of their senior year and to support further consideration of whether the CAHSEE passing score levels are set appropriately.
Recommendation 1: CDE should work with districts to track students who do not graduate on time.
A key question concerning the impact of the CAHSEE requirement is what happens to students who do not graduate on time. This year, we found that roughly 40 percent of students in the Class of 2006 who had not met the CAHSEE requirement continued to take the test. Most were shown as repeat 10th graders; some were in adult education programs. Little else is know specifically about Class of 2006 members who did not graduate in June 2006. It would be important to know which of them also failed to meet other graduation requirements. Also, what are the other 60 percent who are not taking the CAHSEE doing? Have some gone on to community college anyway? How many are pursuing a General Education Diploma (GED)? How many are employed? Key policy questions include whether the programs these nongraduates are pursuing are effective and whether more students should be aware of some of these programs. One or more special studies would be needed to address these questions.
Recommendation 2: For students who do graduate, it would be useful to link their high school test scores to information on community college, state college, and university experiences.
More information is needed on the subsequent success of students who pass the CAHSEE and graduate with their class. For students who attend California’s community colleges and state colleges and universities, it should be possible to link first year college records to CAHSEE test scores using the new statewide student identifier. How closely are CAHSEE scores linked to whether students required remedial work in
Human Resources Research Organization [HumRRO] Page 219
Independent Evaluation of the CAHSEE: Fourth Biennial Report
reading or mathematics before being able to take credit-bearing courses? To what extent would raising (or lowering) the CAHSEE passing score reduce (or increase) the proportion of students who have to take remedial courses? What would be the likely effect of changes in the CAHSEE passing score on first-year grades, particularly in the community college system?
Our next two recommendations call for further investigation of factors that make CAHSEE a more difficult requirement for some groups of disadvantaged students.
Recommendation 3: Reasons for low performance in schools with higher densities of minorities and low-income students should be studied to identify possible remedies.
A persistent and perplexing problem is the finding of a strong relationship between the density of minority and low-income students in a school and low performance on the CAHSEE. More detailed studies are needed to identify causal factors and plausible remedies. New school finance data may make it possible to identify differences in the level and allocation of funding for facilities, books, teacher salaries, libraries, and other factors that differentiate higher and lower performing schools among those serving high densities of disadvantaged students. Better measures of teacher quality, school management, and parent and peer support for academic achievement might further indicate differences between high and low performing schools. Most importantly, programs and systems used in higher performing schools might be identified and tested for applicability in a wider range of schools.
Recommendation 4: Now that statewide student identifiers are generally in use, CDE should analyze student progress at earlier grades as measured by CSTs and, for English Learners, the CELDT to see where and when students begin to get off track.
While many students who are not initially fluent in English benefit from current English language development programs, many do not. More detailed studies of the large number of students who persist as English learners from early grades into high school are needed. Similarly, many students, particularly students with disabilities, come to high school unprepared to take Algebra I. When and how do these students begin to get off track in developing the skills necessary to be successful in high school mathematics?
The availability of statewide student identifiers make it possible to track student scores on the California Standards Tests and, for English learners, the California English Language Development Test from one grade to the next and identify points at which students fail to make expected progress. CDE might work with school districts to collect targeted additional information about students and their programs at these key points when needed in order to suggest remedies.
Page 220 Human Resources Research Organization (HumRRO)
Chapter 6: Summary and Recommendations
While our most urgent recommendations above concern the need for more information, we conclude with three recommendations for ways to student success with the CAHSEE.
Recommendation 5: California should explore options for supporting and improving professional development programs for high school teachers.
A persistent finding from our teacher and principal surveys is the suggestion of the questionable quality of professional development programs for teachers. Continued efforts to improve effectiveness in standards-based instruction for teachers at all levels are needed. Teachers in lower-performing schools should be particularly helped and encouraged to participate in such programs. Professional development programs to help teachers of English learners and students with disabilities improve instructional methods would be particularly useful.
Recommendation 6: Districts, schools, and IEP teams should make all possible efforts to provide access to the general curriculum to students with disabilities so that these students can obtain the skills needed to pass the CAHSEE.
For the past 3 years, our findings have demonstrated a clear link between participation in regular classroom instruction for students with disabilities and their success on the CAHSEE. Increased participation in regular instruction would very likely lead to increases in CAHSEE passing rates for students with disabilities. For students who truly cannot participate in regular instruction, providing alternative instruction that is still standards-based is key to success on the CAHSEE. For a very small number of students with more profound disabilities, such as severe mental retardation, alternative goals and ways of recognizing them are still needed.
Recommendation 7: California should continue to explore alternate routes to demonstrating proficiency. Programs that consider grades and other factors besides test scores, introduced in Massachusetts and Washington, provide examples for consideration.
Several states have recognized alternative ways that students may demonstrate the proficiency needed for high school graduation. Such programs consider coursework and grades as well as test scores. While evidence to date suggests that such programs lead to only a small number of additional students demonstrating proficiency, California might nonetheless consider whether to adopt similar policies for allowing students to meet the CAHSEE requirement.
Human Resources Research Organization [HumRRO] Page 221
References
References
Rabinowitz, S. N., Crane, E.W., Ananda, S., Vasudeva, A., Youtsey, D.K., Shimozato, C., and Schwager, M. (April 2005). High school exit examination for pupils with disabilities (Senate Bill 964), Final Report. San Francisco, CA: WestEd.
Randenbush, S. W., & Bryk, A. S. (2002). Hierarchical linear models: applications and data analysis methods. Thousand Oaks, CA: Sage Publications.
Raudenbush, S., & Willms, D. (1995). The estimation of school effects. Journal of Educational and Behavioral Statistics, 20(4), 307-335.
Sacramento County Office of Education: Center for Student assessment and Program Accountability and Educational Data Systems. (2005). California high school proficiency examination (CHSPE): Final administration report for the summer 2005 Administration. Sacramento, CA: Sacramento County Office of Education.
Sacramento County Office of Education: Center for Student assessment and Program Accountability and Educational Data Systems. (2006). California high school proficiency examination (CHSPE): Final administration report for the summer 2006 Administration. Sacramento, CA: Sacramento County Office of Education.
Sipes, D.E., Harris, C.D., Wise, L.L., & Gribben, M.A. (2001). High school exit examination (HSEE): Fall 2000 district baseline survey report (IR-01-01). Alexandria, VA: Human Resources Research Organization.
Wise, L.L., Becker, D.E., Butler, F. L., Schantz, L. B., Bao, H., Sun, S., Campbell, H. L. (2006, October 31). Independent evaluation of the California high school exit examination (CAHSEE): 2006 evaluation report. (HumRRO Final Report FR–06–91). Alexandria, VA: Human Resources Research Organization. [Online]. Available: http://www.cde.ca.gov/ta/tg/hs/year7.asp
Wise, L.L., Becker, D.E., Harris, C.D., Sun, S., Wang, X., & Brown, D.G. (2004b, September 30). Independent evaluation of the California high school exit examination (CAHSEE): Year 5 evaluation report. (HumRRO Final Report FR–04– 53). Alexandria, VA: Human Resources Research Organization. [Online]. Available: http://www.cde.ca.gov/ta/tg/hs/year5.asp
Wise, L.L., Becker, D.E., Harris, C.D., Taylor, L.R., Johnstone, C.J., Miller, N.A., Thompson, S.A., Sun, S., Shen, X., Butler, F.L., Wang, X., Koger, L.E., Moody, R., Deatz, R.C., Koger, M.E., Dickinson, E.R., Gensberg, S., Hilton, R.A., Kelley, N.L., & Stevens. C. (2005). Independent evaluation of the California high school exit examination (CAHSEE): 2005 evaluation report – Volumes 1-3. (HumRRO Final Report FR–05–43). Alexandria, VA: Human Resources Research Organization. [Online]. Available: http://www.cde.ca.gov/ta/tg/hs/year6indepeval.asp
Wise, L. L., Hoffman, R. G., & Harris, C. D. (2000). The California high school exit examination (HSEE): Evaluation plan. Alexandria, VA: Human Resources Research Organization.
Human Resources Research Organization [HumRRO] Page 223
Independent Evaluation of the CAHSEE: Fourth Biennial Report
Wise, L.L., Harris, C.D., Sipes, D.E., Hoffman, R.G., & Ford, J.P. (2000a, June 30). High school exit examination (HSEE): Year 1 evaluation report (HumRRO Preliminary Report IR–00–27r). Alexandria, VA: Human Resources Research Organization. [Online]. Available: http://www.cde.ca.gov/ta/tg/hs/year1.asp
Wise, L.L., Harris, C.D., Brown, D.G., Becker, D.E., Sun, S., & Coumbe, K.L. (2003b, September 30). California high school exit examination (CAHSEE): Year 4 evaluation report (FR-03-64r). Alexandria, VA: Human Resources Research Organization. [Online]. Available: http://www.cde.ca.gov/ta/tg/hs/year4.asp
Wise, L.L., Harris, C.D., Koger, L.E., Bacci, E.D., Ford, J.P., Sipes, D.E., Sun, S., Koger, M.E., & Deatz, R.C. (2003a, May 1). Independent evaluation of the California high school exit examination (CAHSEE): AB 1609 study report—Volumes 1 & 2. (HumRRO Final Report FR–03–21). Alexandria, VA: Human Resources Research Organization. [Online]. Available: http://www.cde.ca.gov/ta/tg/hs/ab1609sr.asp
Wise, L.L., Harris, C.D., Koger, L.E., Bacci, E.D., Ford, J.P., Brown, D.G., Becker, D.E., Sun, S., Koger, M.E., Deatz, R.C., & Coumbe, K.L. (2004a, February 1). Independent evaluation of the California high school exit examination (CAHSEE): Second biennial report (FR-04-01). Alexandria, VA: Human Resources Research Organization. [Online]. Available: http://www.cde.ca.gov/ta/tg/hs/biennial04.asp
Wise, L.L., Sipes, D.E., George, C. E., Ford, J.P., & Harris, C.D. (2001, June 29). California high school exit examination (CAHSEE): Year 2 evaluation report (HumRRO Interim Evaluation Report IR–01–29r). Alexandria, VA: Human Resources Research Organization. [Online]. Available: http://www.cde.ca.gov/ta/tg/hs/year2.asp
Wise, L.L., Sipes, D.E., Harris, C.D., Collins, M.M., Hoffman, R.G., & Ford, J.P. (2000b, August 25). High school exit examination (HSEE): Supplemental year 1 evaluation report (HumRRO Supplemental Report IR–00–37). Alexandria, VA: Human Resources Research Organization. [Online]. Available: http://www.cde.ca.gov/ta/tg/hs/year1sup.asp
Wise, L.L., Sipes, D.E., Harris, C.D., Ford, J.P., Sun, S., Dunn, J., & Goldberg, G. L. (2002b, June 28). California high school exit examination (CAHSEE): Year 3 evaluation report. (HumRRO Interim Report IR–02–28). Alexandria, VA: Human Resources Research Organization. [Online]. Available: http://www.cde.ca.gov/ta/tg/hs/year3.asp
Wise, L.L., Sipes, D.E., Harris, C.D., George, C. E., Ford, J.P., & Sun, S. (2002a, January 29). Independent evaluation of the California high school exit examination (CAHSEE): Analysis of the 2001 administration. (HumRRO Evaluation Report FR– 02–02). Alexandria, VA: Human Resources Research Organization. [Online]. Available: http://www.cde.ca.gov/ta/tg/hs/biennial02.asp
Page 224 Human Resources Research Organization (HumRRO)
Appendix A: 2007 Principal Longitudinal Survey
Appendix A: 2007 Principal Longitudinal Survey
Human Resources Research Organization [HumRRO] Page A-1
California High School Exit Examination (CAHSEE) Evaluation Principal Longitudinal Sample Survey Spring 2007
pal NamePrinci :
School Name:
DIRECTIONS: Please provide the following information by filling in the circle of the appropriate response or by writing an appropriate response.
MARKING INSTRUCTIONS
• Use a No. 2 pencil only. • Do not use ink, ballpoint, or felt tip pens. • Make solid marks that fill the response completely. • Erase cleanly any marks you wish to change. • Make no stray marks on this form.
CORRECT: INCORRECT:
... were you a
teacher?
...have you worked in public
schools?
...have you been a principal
(or school-level administrator)?
...have you worked in your
present school?
1. Including the 2006-2007 school year, how many years...
2. For the 2006-2007 school year:
How many teachers are on
your staff?
What percentage of your teachers
have earned advanced degrees
(i.e., beyond BA/BS)?
%
3. Indicate any major faculty or stahad over the past three years. (Mark all that app
What percentage of your teachers have taught at
this school for 3 years or more?
%
What percentage of your teachers
are certified in the subject they are
teaching?
% 0
1
2
3
4
5
6
7
8
9
0
1
2
3
4
5
6
7
8
9
0
1
0
1
2
3
4
5
6
7
8
9
0
1
2
3
4
5
6
7
8
9
0
1
2
3
4
5
6
7
8
9
0
1
2
3
4
5
6
7
8
9
0
1
2
3
4
5
6
7
8
9
0
1
2
3
4
5
6
7
8
9
0
1
2
3
4
5
6
7
8
9
0
1
2
3
4
5
6
7
8
9
0
1
2
3
4
5
6
7
8
9
0
1
2
3
4
5
6
7
8
9
0
1
0
1
2
3
4
5
6
7
8
9
0
1
2
3
4
5
6
7
8
9
0
1
0
1
2
3
4
5
6
7
8
9
0
1
2
3
4
5
6
7
8
9
0
1
0
1
2
3
4
5
6
7
8
9
0
1
2
3
4
5
6
7
8
9
0
1
ff changes your school has ly.)
Increased number of teachers Decreased number of teachers Increased number of principals or other administrators Decreased number of principals or other administrators No major faculty or staff changes
HumRRO Princ
1 ipal long spring 2007.dew
Prinicpal Longitudinal Sample Survey Spring 2007
4. Indicate the various specialty education programs offered by your school. (Mark all that apply; estimate percentage (%) of students who participate in each; and comment.)
Comments: Program for Multicultural/ English Diversity-Remedial Special
Education Learners Based Magnet
Courses
% 0
1
2
3
4
5
6
7
8
9
0
1
2
3
4
5
6
7
8
9
0
1
% 0
1
2
3
4
5
6
7
8
9
0
1
2
3
4
5
6
7
8
9
0
1
% 0
1
2
3
4
5
6
7
8
9
0
1
2
3
4
5
6
7
8
9
0
1
% 0
1
2
3
4
5
6
7
8
9
0
1
2
3
4
5
6
7
8
9
0
1
% 0
1
2
3
4
5
6
7
8
9
0
1
2
3
4
5
6
7
8
9
0
1
Program
School/ Community/ Other (specify) Comments:
International Business Advanced Targeted Baccalaureate Partnerships Placement Tutoring
% 0
1
2
3
4
5
6
7
8
9
0
1
2
3
4
5
6
7
8
9
0
1
% 0
1
2
3
4
5
6
7
8
9
0
1
2
3
4
5
6
7
8
9
0
1
% 0
1
2
3
4
5
6
7
8
9
0
1
2
3
4
5
6
7
8
9
0
1
% 0
1
2
3
4
5
6
7
8
9
0
1
2
3
4
5
6
7
8
9
0
1
% 0
1
2
3
4
5
6
7
8
9
0
1
2
3
4
5
6
7
8
9
0
1
HumRRO Princ
2 ipal long spring 2007.dew
Prinicpal Longitudinal Sample Survey Spring 2007
5. For each of the categories of students below, estimate your current graduation rate.
OtherSeniors American Indian/ Asian or Black or African Caucasian Hispanic/ (specify)Overall Alaskan Native Pacific American, not not Hispanic Latino
Islander Hispanic origin origin
Current graduation rate (% of entering 9th graders who graduate within 4-5 years)
% 0
1
2
3
4
5
6
7
8
9
0
1
2
3
4
5
6
7
8
9
0
1
% 0
1
2
3
4
5
6
7
8
9
0
1
2
3
4
5
6
7
8
9
0
1
% 0
1
2
3
4
5
6
7
8
9
0
1
2
3
4
5
6
7
8
9
0
1
% 0
1
2
3
4
5
6
7
8
9
0
1
2
3
4
5
6
7
8
9
0
1
% 0
1
2
3
4
5
6
7
8
9
0
1
2
3
4
5
6
7
8
9
0
1
% 0
1
2
3
4
5
6
7
8
9
0
1
2
3
4
5
6
7
8
9
0
1
% 0
1
2
3
4
5
6
7
8
9
0
1
2
3
4
5
6
7
8
9
0
1
6. How aware do you think students in your school are of the CAHSEE? (Mark all that apply.)
They know nothing about the exam.They have only general information about the exam.They know what knowledge and skills are covered by the
exam.They know the times of year when the exam is given. They know which students have the opportunity to take the exam.
7. What is your estimate of the percentage of students in
0
1
2
3
4
5
6
7
8
9
0
1
2
3
4
5
6
7
8
9
0
1
% your school who are aware ofwhat knowledge and skillsare covered by the exam?
8. What is your estimate of the percentage of parents of students in your school who are aware of what knowledge and skills are covered by the exam?
% 0
1
2
3
4
5
6
7
8
9
0
1
2
3
4
5
6
7
8
9
0
1
PrincHumRRO 3
ipal long spring 2007.dew
Prinicpal Longitudinal Sample Survey Spring 2007
9. The relationship between your district's standards for English-language arts and those described by the English-Language Arts Content Standards and the Reading/Language Arts Framework can best be described by which of the following statements? (Mark only one.)
Our district has adopted the state content standards. The state content standards include more than our district
content standards. Our district content standards include more than the state
content standards. I cannot judge the relationship between our district
standards and the state standards.
10. The relationship between your district's standards for mathematics and those described by the Mathematics Content Standards and the Mathematics Framework can best be described by which of the following statements? (Mark only one.)
Our district has adopted the state content standards. The state content standards include more than our
district content standards. Our district content standards include more than the
state content standards. I cannot judge the relationship between our district
standards and the state standards.
11. Consider the full set of state content standards andmark ALL that apply.
Our district encourages use of the content standards to organize instruction.
Our current ELA textbooks align well with the content standards. Our current math textbooks align well with the content
standards. We can cover all of the content standards with a mix of
textbooks and supplemental material. Our district is in the process of aligning its curriculum to the
state content standards. Our district is in the process of aligning its curriculum across
grade levels to the content standards. Our district has a plan, which ensures that all high school
students receive instruction in each of the content standards. Our district has a plan that ensures that all pre-high school
students are prepared to receive instruction in each of the content standards.
Our district (or school) is hiring only teachers certified in their field.
Our district (or school) is assigning teachers only in their certified fields.
12. What do you think is most helpful about the CAHSEE individual and group score reports? (Mark only one.)
Timeliness
Comprehensiveness
Ease of understanding
Usefulness for instruction
Other (please specify)Have not seen a score report.
13. What information do you use to identify students who are at risk of not passing the CASHEE or scoring Below Basic or Far Below Basic on the CST in a particular subject? (Mark all that apply.)
NRT results CST results District end-of-course (EOC) results District assessments (benchmarks, math facts, etc.) Teacher judgment Other (please specify)
PrincHumRRO 4
ipal long spring 2007.dew
Prinicpal Longitudinal Sample Survey Spring 2007 For those activities
14. What activiti you marked in the 1st
ial tion t t
i tt t t ir
) to t i i l/ t i
t itf t t t-t i
ifi i ll t t
t t l i fi f ings j
imi t i in f f
l t t t i
t t lts t it t
t tat tti i t
t
t ify)
i i ( l )
lthree (3) that you
No spec preparaa. Encouraged s udents o work hard and
prepare b. Emphas zed the impor ance of the CAHSEE c. Encouraged s udents (and hrough he
parents ake demand ng courses d. Provided ndividua group tu or ng e. Had s udents work w h computers . Taugh es ak ng skills
g. Mod ed curr cu um h. Inc uded eachers other han ELA and math
in ins ruc ional p ann ng or the CAHSEE . Increased summer school of er. Added homework k. El na ed elect ves avor o remedial
classes . Used school es resul s to change
nstruction m. Used school es resu o des gn remedial
ins ruc ion n. Adop ed s e conten standards o. Changed gradua on requ remen s to include
courses tha enhance student success on the CAHSEE
p. O her (spec
es did your school undertake to prepare students for the spring 2007 adm nistrat on of the CAHSEE? Mark all that app y.
co umn, mark the
consider most important in your
CAHSEE preparation.
15. During this school year (2006–2007), how much time, in total, do you estimate you have spent in activities specifically related to the CAHSEE (e.g., meetings, discussions, curriculum review, your professional development, your staff’s development, etc.)?
None Less than 6 hours 6–15 hours 16–35 hours More than 35 hours
16. Based on your knowledge of your faculty, what percentage of your teachers HAVE copies of the CST/CAHSEE blueprints?
Fewer than 50% 50-74% 75-95% Greater than 95% Unsure
17. Based on your knowledge of your faculty, what percentage of your teachers USE the blueprints for lesson planning?
Fewer than 50% 50-74% 75-95% Greater than 95% Unsure
18. What evidence do you collect that teachers are "teaching to the standards" (i.e. using standards documents, frameworks and/or blueprints)? (Mark all that apply.)
ttiidual
ft
ELA i
t
ft
ft
i fisi t i
ions at lty
idi l l i
i tional and
ls
Goal se ng and other indiv
con erences Subjec
Mathemat cs
Classroom visi s— Walk throughs or
other in ormal interac ions
Reports rom departmen chairs or others respons ble or superv ng ins ruct on
Discuss facu
meet ng
School or strict even-service
Other Teacher-generated nstruc
assessment materia
19. How responsible do you think teachers other than those in ELA and math view themselves for student success on the CAHSEE?
Very responsible Somewhat responsible Slightly responsible Not at all responsible
HumRRO Princ
5ipal long spring 2007.dew
Prinicpal Longitudinal Sample Survey Spring 2007
20. What plans has your school made for assisting high school students who do not pass the exit exam or who do not seem
lly l
ially l
Pl
l
i ( f ) l
l
ial plI i l ial
i l el ti in f f ial clI i l l off i
i i ivi l/ tut it t it t f ial i t ti
ft tat t t st
lt i l i li. I l t t t th in i t ti l
pl i f tj ith f i l ls
l t t l l t t lts t i l i t ti
l t i l st t iliti l t in / i ly
ff i i ft i i
t t st t t i i f ti i
t ( ify)
FuImp emented
PartImp emented
an to
Imp ement
prepared to take t? Mark one response or each.No P an
to Imp ement
No spec ans a. ncreased h gh schoo remed courses b. Reduced h gh schoo ec ves avor o remed asses c. ncreased h gh schoo summer schoo er ngs d. Prov ded nd dua group or ng e. Had s uden s work w h compu ers or remed ns ruc on . Added homework
g. Adop ed s e con en andards h. A ered h gh schoo curr cu um
nc uded eachers o her han ELA and ma ns ruc onaann ng or he CAHSEE
. Worked w eeder m dd e schook. Deve oped paren suppor program . Used schoo es resu o change h gh schoo ns ruc on m. Eva ua ed h gh schoo uden s' ab es and p aced hem
courses programs accord ngn. Ensured we are o er ng demand ng courses rom
he beg nn ng o. Ensured ha uden s are ak ng demand ng courses rom he
beg nn ng p. O her spec
21. What percentage of your seniors is unlikely to graduate for the following reasons? (Enter estimated percentage for all that apply.)
_____ % Because of the CAHSEE requirement only _____ % Because of the CAHSEE requirement AND failure to
meet other requirements _____ % Because of failure to meet other requirements only _____ % Total [of all seniors]
22. How many of last year’s seniors failed to graduate for the follow reasons ?
_____ Because of the CAHSEE requirement only _____ Because of the CAHSEE requirement AND failure to meet
other requirements _____ Because of failure to meet other requirements only _____ Total [of all seniors]
23. What options are available for seniors who do not pass both parts of the CAHSEE? (Mark all that apply.)
Summer program with retesting Retention in 12th grade GED High school diploma through community college Certificate of completion Other certificate (specify _________________________)
24. What proportion of last year’s seniors who did not pass the CAHSEE took advantage of each of these options? _____ % Summer program with retesting _____ % Retention in 12th grade _____ % GED _____ % High school diploma through community college _____ % Certificate of completion _____ % Other certificate (specify ______________________)
iHumRRO Pr nc
6 ipal long spring 2007.dew
Prinicpal Longitudinal Sample Survey Spring 2007
from the fliNot To a
t
a. Vocati
i i in t ts
t ify)
25. To what extent does the CAHSEE draw resources away ollowing? To a S ght
Extent At All Great Exten
To a Moderate
Extent
onal courses b. Advanced courses c. Courses n other academ c subject areas d. Courses he are. O her (spec
26. Based on what you know about your school, what do you predict the eff f i
f t Increased
i fti tti i f t the fi t ti
i i i ini f i
f l i l t t t t
ect o the CAHSEE s on... No E fec
Strongly Decreased Decreased
Strongly Increased
a....student motivation pr or to taking the exam or the first time? b....mo vation to excel for s udents who pass the first time? c.... mo vat on to excel or s udents who do not pass rs me? d....parental nvolvement pr or to the first requ red adm stration o the exam? e....parental nvolvement for students who pass the exam? ....parenta nvo vement for s uden s who do no pass he exam?
27. Based on what you know about your school, its teachers, and its students, what do you think has been the influence of the CAHSEE on instructional practices?
Considerably Improved Improved No Effect Weakened Considerably Weakened
28. What percentage of your school's current 10th grade students in each of the following
a....all ti
t t itli l
Greater 50%
groups would you say have had instruction that covers the English-language arts content standards for the CAHSEE?
your school's 10th grade s udents b....10th grade students with d sabilities in SDC c....10 h grade s udents w h disabilities in RSP d....10th grade Eng sh earners
Than 95% 50-74% 75-95% Fewer Than
29. What percentage of your school's current 10th grade students in each of the f
a....all l tt it t it
li l
i i Greater 50%
your schoo 's 10th grade s udents b....10 h grade students with d sabilities in SDC c....10 h grade s udents w h disabilities in RSP d....10th grade Eng sh earners
ollowing groups would you say have had nstruction that covers the mathemat cs
content standards for the CAHSEE? Than 95% 50-74% 75-95% Fewer Than
HumRRO Princ
7ipal long spring 2007.dew
Prinicpal Longitudinal Sample Survey Spring 2007
30. Which of the following do you think had an impact on
fi il f
liNot To a
t t t i i t ti l t ials
I l st il t i
t t if to i t i tent st
to i i i t ti ih. Admi t t to i i i f i it
ti t l tyl
iFact
i i f ( f ible
) great i
1 2 3
1 2 3
1 2 3
1 2 3
1 2 3
1 2 3
1 2 3
1 2 3iti tion
t t t f
if ial
ial th tt ify)
follf l ( ) t
I Ilan to Plan to
a. t t i i t ti l t ials b. l st ts to t
I ividual st t td. l t ts to t te. ti f t t t initiall tf. t ig. t t ih. to i i t t sti. to i t i i t ti l t ij. Administ to i i t ing f g i
st t ti t l tyl
31. To what extent have nancial constra nts limited your ability to provide the following services to he p students pass the CAHSEE during the past our years?
To a S ght Extent At All Great
Exten
To a Moderate
Extent
a. School, eacher, and s udents access to appropr ate ns ruc ona ma erb. Remediation c. ndividua udent ass stance d. Teacher and schoo suppor serv ces e. Studen and parent suppor serv ces . Teacher access n-service ra ning on con andards
g. Teacher access n-serv ce training on ns ruc onal techn ques nis ra or and teacher access n-serv ce tra ning or work ng w h diverse student
popula ons and differen earning s es
Defin tely a Factor
Not a or
Possibly a Factor
your students’ success in meet ng the requ rements othe CAHSEE? Mark one response or each possfactor.
Indicate the three areas you feel have the est mpact (1 = greatest)
a. Lack of preparat on needed to pass b. Lack of mo vac. Poor at endance d. Too many ests o prepare or e. Language barr ers . Lack of credent ed ELA teachers
g. Lack of credent ed ma eachers h. O her (spec
32. Which of the owing has your school implemented to promote learning or al students? Mark one response for each. Par ially
mplemented Fully
mplemented No PImplement Implement
School, teacher, and s uden access to appropr ate ns ruc ona ma erEncourage al uden ake Algebra 1
c. nd uden assis ance CAHSEE prep c asses to prepare s uden ake he CAHSEE Remedia on courses or s uden s who do no y pass he CAHSEE
Teacher and school suppor serv ces Studen and paren support serv ces Teacher access n-serv ce raining on conten andards
Teacher access n-service ra ning on ns ruc ona echn ques rator and teacher access n-serv ce rain or workin with d verse
uden popula ons and differen earning s es
HumRRO Princ
8ipal long spring 2007.dew
Prinicpal Longitudinal Sample Survey Spring 2007
33. Which of the following plans or strategies have you and your faculty/staff implemented to address participation in the CAHSEE by students with disabilities? (Mark all that apply.)
Follow IEP or 504 Plan
Modify IEP or 504 Plan
Provide accommodations and/or additional assistance
Provide modifications
Offer special academic work programs
Encourage staff development in special education
Mainstream students with disabilities
Other (please specify)No plans or strategies implemented
We have no students with disabilities
34. Which of the following plans or strategies have you and your faculty/staff implemented to help English learners (EL) overcome barriers so they can succeed in meeting the requirements of the CAHSEE? (Mark all that apply.)
Provide accommodations and/or additional assistance
Provide modifications
Offer special academic work programs
Encourage staff development in EL education
Mainstream EL students
Other (please specify)No plans or strategies implemented
We have no EL students
35. Please describe any specific benefits and challenges for your school and students that you feel are associated with successfully meeting the requirements of the CAHSEE.
Thank you for your cooperation.
9 ipal long spring 2007.dew Princ
HumRRO
Appendix B: 2007 Teacher Longitudinal Survey
Appendix B: 2007 Teacher Longitudinal Survey
Human Resources Research Organization [HumRRO] Page B-1
California High School Exit Examination (CAHSEE) Evaluation Teacher Name:
Teacher Longitudinal Sample Survey Spring 2007 School Name:
MARKING INSTRUCTIONS DIRECTIONS: Please provide the following information by
filling in the circle of the appropriate responseor by writing an appropriate response.
• Use a No. 2 pencil only. • Do not use ink, ballpoint, or felt tip pens. • Make solid marks that fill the response completely. • Erase cleanly any marks you wish to change. • Make no stray marks on this form.
CORRECT: INCORRECT:
1. What is your highest level of education? Bachelor's (4-year) degree
Some graduate school Master's Degree Doctorate Degree
Other (specify)
2. What is the primary subject area you teach? English-Language Arts (ELA) Mathematics (Math)
3. Are you certified in your primary subject area? Yes No (specify other area)
About You and Your Classes
4. Including the 2006-2007 school year, how many years...
... were you ...been a teacher in ...taught in a your primary your present
teacher? subject area? school?
0
1
2
3
4
5
6
7
8
9
0
1
2
3
4
5
6
7
8
9
0
1
2
3
4
5
6
7
8
9
0
1
2
3
4
5
6
7
8
9
0
1
2
3
4
5
6
7
8
9
0
1
2
3
4
5
6
7
8
9
ons with an emphasis on For the purposes of thyour 9th and 10th grade students.
5. What grade level do you teach? (Mark all that apply.) 9th 10th 11th 12th
6. What is your average enrollment per class period this year?
0
1
2
3
4
5
6
7
8
9
0
1
2
3
4
5
6
7
8
9
is survey, please think of your typical classes and answer the following set of questi
7. What is the average percentage of the students in your classes who speak English fluently?
100% 90% - 99% 75% - 89% 50% - 74% Less than 50%
teacher long sprHumRRO
ing 2007.dew 1
Teacher Longitudinal Sample Survey Spring 2007
8. (
t
f tf l t ials
ter it teri i l i ti
i llf. i t
t l t ld sit iit topi it (
it tion) i. it t let ts j. t i i
t thei t
f li f foll
Twi TwiMonth i
AlmosEvery Day
a. Do work rom their tex books b. Do work rom supp emen al materc. Do work on the compud. Work w h hands-on ma als, phys cal mode s, or man pula ves e. Work n pairs or sma groups
Take qu zzes or ests g. Be asked to apply subjec area know edge o real-wor uat ons h. Wr e a few sentences about a c or s consequences or a math
problem or s soluWr e repor s or comp e projecConduc research on ssues or deas
k. Presen r work o the class
In general, how often do you plan or students in your c asses to: ...? Please mark the appropriate c rcle for each o the owing.)
Once or ce a
Week
Once or ce a
Once a Grading Per od
Never or Hardly Ever
About the California High School Exit Examination
9. How useful do you find the CDE website as a source of information about the CAHSEE?
Not At All UsefulSlightly UsefulSomewhat Useful Very Useful I am not familiar with the CDE website.
10. How useful do you find the CAHSEE Teacher Guide as a source of information to help prepare your students for the CAHSEE?
Not At All Useful Slightly Useful Somewhat Useful Very Useful I am not familiar with the CAHSEE Teacher Guide.
11. To be answered ONLY by English-language arts teacher. Based on your knowledge of the ELA content standards tested by the CAHSEE, what proportion of these standards are covered by your school’s current curriculum?
Less than ¼ ¼–½ About ¾ Almost all No knowledge of the CAHSEE English-Language Arts standards
12. To be answered ONLY by mathematics teacher. Based on your knowledge of the mathematics content standards tested by the CAHSEE, what proportion of these standards are covered by your school’s current curriculum?
Less than ¼ ¼–½ About ¾ Almost all No knowledge of the CAHSEE mathematics standards
HumRRO 2
i i l ( il iti l
( f li ff )?
Did notGood t
l lt
i i lf l l
i l Exi i in ( )?
llll
t ll t l
l i iiviti f ( i )?
i i l ( ii l
i i i i i l( l i )?
l f l l i it
i i
t
t
t
t
t
t
14c. Dur ng th s schoo year 2006-2007), how much t me, in tota , do you estimate you have spent in activ es re ated to the CAHSEE e.g., acu ty and department meetings, discuss ons, sta development, etc.
have any Poor Fair Excellen
From oca sources From s ate sources
13. Based on nstruction n your schoo and what you know about your eeder schoo s, how wel prepared to pass the H gh Schoo t Examinat on were 10th gradersthis school year 2006-2007
Very we prepared We prepared
Prepared No we prepared No at al prepared
14b. How much c assroom instruction t me do you est mate you spent on act es that you would not have if it weren’t or the CAHSEE e.g., unit or course rev ew, etc.
14a. Dur ng th s schoo year 2006-2007), how much t me, in total, do you est mate you have spent on c assroom nstruct on preparat on act vit es re ated to the CAHSEE e.g., department p anning, lesson plan rev ew, etc
15. How wou d you rate the quality of the pro essionadeve opment related to the California H gh School ExExaminat on you have rece ved this year?
None Less han 6 hours 6-15 hours 16-35 hours More han 35 hours
None Less han 6 hours 6–15 hours 16–35 hours More han 35 hours
None Less han 6 hours 6-15 hours 16-35 hours More han 35 hours
Teacher Longitudinal Sample Survey Spring 2007
16. What activities did you personally For those activities you marked in the 1stundertake to prepare your students for column, mark the three
the spring 2007 administration of the (3) that you consider CAHSEE? (Mark all that apply.) most important in
CAHSEE preparation for your students.
ial tion t ts t
i t i t
t ts () to t i
i i ivi / tut ing t
ial t tt t t
I tt tion t t st t in t i
i t tion it t
if t
i ti tivi t it t
l it t ts
i l i ts l
t tlt ial
t tl
t lti
l it ts Other ( ify)
No spec preparaEncouraged s uden o work hard and
prepare Emphas zed he mpor ance of the
CAHSEE Encouraged s uden and through their
parents ake demand ng courses Prov ded nd dual group orHad students work with compu ers for
remed ins ruc ion Taugh es -taking skills ncreased classroom a en o conten
andards covered by he CAHSEEhe weeks preced ng the CAHSEE
adm nis raWorked w h feeder school eachers Mod ed my instruc ion Encouraged other teachers to include
nstruc onal ac ties hat ncorporate ELA or ma h s andards
Ta ked w h my s udenAdded homework Adm nistered ”ear y warn ng“ tesUsed class test resu ts to change
ins ruc ion Used class test resu s to design remed
ins ruc ion Encouraged summer schoo attendance Sugges ed remedial c asses rather than
elec ves Ta ked or worked w h paren
spec
17. How responsible do you think teachers other than ELA and math view themselves for student success on the CAHSEE?
Very responsible Somewhat responsible Slightly responsible Not at all responsible
HumRRO 3
Teacher Longitudinal Sample Survey Spring 2007
f teff f i Increased
t ib. i tion t f the fi t ti
i tion t f the fi t tid. i t pri to the fi t i i te. i t f t tf i t f t t
t tih. t
Strongly Increased Decreased No E fec
18. Based on what you know about your school, what do you believe the ect o the CAHSEE s on... Strongly
Decreased
a. ...studen motivation pr or to taking the exam for the first time? ...mot va o excel or students who pass rs me?
c. ...mot va o excel or students who do not pass rs me? ...parental nvolvemen or rs required adm nistrat on of he exam? ...parental nvolvemen or s udents who pass he exam?
. ...parental nvolvemen or s udents who do not pass he exam? g. ...s udent reten on rates?
...s udent dropout rates?
19. Which of the following do you think had an impact on
Fact Fact
i i f ( f ible
) greatest i
1 2 3
1 2 3
1 2 3
1 2 3
1 2 3
1 2 3
1 2 3
1 2 3ii tion
t t t for
if i
ial tt ify)
Definitely a Factor
Not a or
Possibly a or
your students’ success in meet ng the requ rements othe CAHSEE? Mark one response or each possfactor.
Indicate the three areas you feel have the mpact (1 = greatest)
a. Lack of preparat on needed to pass b. Lack of mot vac. Poor at endance d. Too many ests o prepare e. Language barr ers . Lack of credent aled ELA teachers
g. Lack of credent ed math eachers h. O her (spec
20. Based on what you know about your school, its teachers, and its students, what do you think has been the influence of the CAHSEE on instructional practices?
Considerably Improved Improved No Effect Weakened Considerably Weakened
21. Please describe any specific benefits and challenges for your school and students that you feel are associated with successfully meeting the requirements of the CAHSEE.