Index Changes and Losses to Investors in S&P 500 and Russell 2000 Index Funds By Honghui Chen, University of Central Florida Gregory Noronha, University of Washington Tacoma, and Vijay Singal, Virginia Tech This version: September 2005 Abstract We find that, due to arbitrage around index changes, investors in S&P 500-linked funds lose between 0.03% and 0.12% annually, while investors in Russell 2000-linked funds lose between 1.30% and 1.84%. In dollar terms, the losses range between $1.0 and $2.1 billion a year for the two indexes together; and can be higher if benchmarked assets, a longer pre-reconstitution period, and involuntary deletions are considered. These losses are an unexpected consequence of index fund investors evaluating index fund managers based on tracking error in an effort to control agency costs. Minimization of tracking error coupled with the predictability and/or pre-announcement of index changes creates the opportunity for a wealth transfer from index fund investors to arbitrageurs. We explore avenues available to interested parties for limiting these losses. *We thank Gary Gastineau, Gus Sauter, Mahesh Pritamani, Sean Collins, Ken O’Keeffe, Greg Kadlec, Mark Hulbert, Srikant Dash, Chester Spatt, and Hugh Marble for comments on the broad results and implications of the paper and participants at the Securities and Exchange Commission, 2004 FMA and SFA Meetings, University of Arkansas, University of Washington, Tacoma, and SUNY Albany for comments and suggestions. We also thank MSCI (Ken O’Keeffe and Neil Blundell), Frank Russell Company (Kevin Mulroney and Mahesh Pritamani), Standard and Poor’s (Reid Steadman, Maureen O’Shea, and Srikant Dash), and QuotesPlus for providing some of the data used in this paper, Authors’ names are in alphabetical order: Honghui Chen is at the University of Central Florida, Department of Finance, College of Business Administration, Orlando, FL 32826-1400, (407) 823-0895, [email protected], Greg Noronha is at University of Washington Tacoma, Milgard School of Business, 1900 Commerce St., Tacoma, WA 98402, (253) 692-5628, [email protected], and Vijay Singal is at Pamplin College of Business, 1016 Pamplin Hall, Virginia Tech, Blacksburg, VA 24061- 0221, (540) 231-7750, [email protected]. Chen acknowledges partial financial support from a University of Central Florida summer grant and Singal acknowledges partial financial support from a Virginia Tech summer grant.
Transcript
Index Changes and Losses to Investors in S&P 500 and Russell 2000 Index Funds
By
Honghui Chen, University of Central Florida
Gregory Noronha, University of Washington Tacoma, and
Vijay Singal, Virginia Tech
This version: September 2005
Abstract
We find that, due to arbitrage around index changes, investors in S&P
500-linked funds lose between 0.03% and 0.12% annually, while investors in
Russell 2000-linked funds lose between 1.30% and 1.84%. In dollar terms, the
losses range between $1.0 and $2.1 billion a year for the two indexes together;
and can be higher if benchmarked assets, a longer pre-reconstitution period, and
involuntary deletions are considered.
These losses are an unexpected consequence of index fund investors
evaluating index fund managers based on tracking error in an effort to control
agency costs. Minimization of tracking error coupled with the predictability
and/or pre-announcement of index changes creates the opportunity for a wealth
transfer from index fund investors to arbitrageurs. We explore avenues available
to interested parties for limiting these losses.
*We thank Gary Gastineau, Gus Sauter, Mahesh Pritamani, Sean Collins, Ken O’Keeffe, Greg Kadlec, Mark Hulbert, Srikant Dash, Chester Spatt, and Hugh Marble for comments on the broad results and implications of the paper and participants at the Securities and Exchange Commission, 2004 FMA and SFA Meetings, University of Arkansas, University of Washington, Tacoma, and SUNY Albany for comments and suggestions. We also thank MSCI (Ken O’Keeffe and Neil Blundell), Frank Russell Company (Kevin Mulroney and Mahesh Pritamani), Standard and Poor’s (Reid Steadman, Maureen O’Shea, and Srikant Dash), and QuotesPlus for providing some of the data used in this paper, Authors’ names are in alphabetical order: Honghui Chen is at the University of Central Florida, Department of Finance, College of Business Administration, Orlando, FL 32826-1400, (407) 823-0895, [email protected], Greg Noronha is at University of Washington Tacoma, Milgard School of Business, 1900 Commerce St., Tacoma, WA 98402, (253) 692-5628, [email protected], and Vijay Singal is at Pamplin College of Business, 1016 Pamplin Hall, Virginia Tech, Blacksburg, VA 24061-0221, (540) 231-7750, [email protected]. Chen acknowledges partial financial support from a University of Central Florida summer grant and Singal acknowledges partial financial support from a Virginia Tech summer grant.
1
Index Changes and Losses to Investors
in S&P 500 and Russell 2000 Index Funds
Abstract
We find that, due to arbitrage around index changes, investors in S&P
500-linked funds lose between 0.03% and 0.12% annually, while investors in
Russell 2000-linked funds lose between 1.30% and 1.84%. In dollar terms, the
losses range between $1.0 and $2.1 billion a year for the two indexes together;
but can be higher if benchmarked assets, a longer pre-reconstitution period, and
involuntary deletions are considered.
These losses are an unexpected consequence of index fund investors
evaluating index fund managers based on tracking error in an effort to control
agency costs. Minimization of tracking error coupled with the predictability
and/or pre-announcement of index changes creates the opportunity for a wealth
transfer from index fund investors to arbitrageurs. We explore avenues available
to interested parties for limiting these losses.
Key Words: Index funds; Index changes; Agency costs;
I. Introduction
“When it comes to choosing your index, don’t be too passive.”1
Modern portfolio theory suggests that holding a well-diversified portfolio of stocks
dominates holding a few individual stocks. However, since there are literally thousands of
financial securities in the marketplace, transactions costs and the burden of monitoring these
securities constrain investors from holding a well-diversified portfolio. The advent of the index
mutual fund as an investment vehicle afforded investors the opportunity to both diversify at a
reasonable cost as well as to transfer the monitoring function to professional fund managers.
Index fund investors expect index fund managers to merely construct a portfolio that mirrors the
1 Ryan (2004) in Fortune magazine.
2
return and risk of the index at the lowest possible cost. No stock picking or timing ability is
expected. Given that objective, a simple way to constrain the fund manager’s propensity to take
risk while at the same time evaluating the performance of the fund is to measure the fund’s
tracking error (the absolute difference between each month’s index return and fund return
summed over the time frame in question).2 Normally, for large pension fund sponsors a tracking
error in excess of 0.10% per year is unacceptable.
Minimizing tracking error would be a relatively simple exercise if indexing companies
did not periodically change the compositions of the underlying indexes.3 Index changes become
necessary when the status or ranking of a firm changes because of major corporate events such as
bankruptcy, liquidation, delisting, or merger. Index changes may also occur whenever a firm
ceases to meet the indexing company’s criteria for inclusion in the index. In an attempt to assist
managers to alter indexed portfolios concurrent with changes in the index, Standard and Poor’s
began pre-announcing index changes in October 1989. Similarly, changes to the Russell indexes
are usually known in advance. The prevailing custom is one where managers effect changes to
indexed portfolios on the effective date of the change, rather than on the day after announcement,
in order to minimize tracking error. We show that, in the presence of predictable or pre-
announced changes, fund managers acting to minimize tracking error do not serve the best
interests of their investors. 2 There is no universally accepted definition of tracking error. Tracking error calculations may be based on daily returns, monthly returns, quarterly returns, volatility, correlations, etc. Two common measures, TE1 and TE2 are given below (see Ammann and Zimmermann, 2001):
TE1 = 1
)( 2
−
−∑n
RRn
kBkpk
TE2 = 21)( pBpR ρσ −
Where “R” is the return for tracking portfolio “p” or the benchmark portfolio “B” over “n” periods, and
pBρ is the correlation between returns to the tracking portfolio and the benchmark portfolio. Our definition is one of the simplest. 3 Other important reasons for tracking error and expenses are reinvestment of dividends, and cash management to meet investor purchases and redemptions. Fund managers are adept at minimizing the impact of dividends and cash flows through index futures.
3
While foreknowledge of changes may prepare fund managers, it also allows arbitrageurs
to play a timing game. Realizing the constraints placed on indexers vis a vis tracking error,
arbitrageurs buy the stocks to be added to the index upon announcement expecting to sell them to
indexers at a higher price on the effective date. Similarly, they short sell stocks to be deleted
from the index upon announcement and expect to repurchase them from indexers at a lower price,
or buy the deleted stocks on the effective date and hold them for several weeks until prices
recover. Several researchers have found evidence of arbitrage activity around changes to the
S&P 500 index (see Beneish and Whaley, 1996; Chen, Noronha, and Singal, 2004; Blume and
Edelen, 2004). Similar evidence exists for the Russell 2000 (Madhavan, 2003; and Biktimirov,
Cowan, and Jordan, 2004).
Not surprisingly, arbitrage returns are realized at the expense of index fund investors. Our
estimates indicate that the loss is as high as 1.84% annually for investors in the Russell 2000
index and 0.12% for investors in the S&P 500 index. With about $1,100 billion and $43 billion
indexed to the S&P 500 and Russell 2000, respectively, passive investors in the S&P 500 index
incur a loss of as much as $1.32 billion every year while Russell 2000 investors lose as much as
$0.8 billion.4 Estimates are higher when benchmarked assets are considered instead of passively
indexed assets, when the months of April and May are also considered for Russell 2000 index
reconstitution, and when involuntary deletions are included.
Under conditions currently prevailing, index fund investors may be unaware of the loss or
consider it minor relative to the alternative of removing managerial constraints; arbitrageurs take
advantage of an opportunity for wealth transfer; index fund managers meet the objective of
minimizing tracking error. Further, predictability/pre-announcement of index changes has neither
the impropriety of market timing nor the illegality of late trading associated with it. Thus, no one
4 We distinguish between ‘passively indexed’ and ‘benchmarked’ in our computations. For example, around $264 billion in assets was benchmarked to the Russell 2000 index in 2003 (Smith and Haughton, 2003) compared to around $43 billion passively indexed to it during that year (Merrill Lynch, 2003). We use the passively indexed estimate.
4
seems to have an incentive to change the status quo. Nonetheless, the economic significance of
tracking error minimization in the presence of advance knowledge of index changes cannot be
understated since it results in very real losses to index fund investors.
Any one of the major participants, indexing companies like Standard and Poor’s and
Frank Russell, index fund managers, or index fund investors themselves, have the capacity to
change the current system to mitigate losses. For example, among index fund managers,
Vanguard has been proactive in protecting its investors from indexes that are amenable to
arbitrage. In Spring 2003, Vanguard changed its benchmark for small-cap index funds from
Russell 2000 to MSCI 1750, an index that is not popular and therefore less subject to index
arbitrage. Gus Sauter, manager of Vanguard’s index fund group, confirmed to Hulbert (2004) in
the New York Times that “one of the primary motivations [for the change] was to reduce the
ability of traders to exploit those index changes at the expense of index funds.” We demonstrate
that, between 1990 and 2002, index fund managers not bound by a tracking-error-minimization
constraint could have realized returns in excess of the underlying index with almost the same
level of risk as the underlying index.
The rest of the paper is organized as follows. In the next section, we briefly describe the
process of indexing and the pattern of returns around index changes for the S&P 500 and Russell
2000 indexes. In section III, we estimate losses to index fund investors when index fund changes
are made on the effective date and conditions under which these estimates may be biased
downward or upward. In section IV we discuss tracking error, its shortcomings, and the benefits
that could be achieved from eschewing it as a constraint. Section V contains a discussion of
appropriate indexes and actions by indexing companies that can reasonably solve the problem of
index fund arbitrage. Section VI contains concluding remarks.
5
II. Index Changes and Return Patterns
II.1. Indexes and Index Changes
Though numerous market indexes exist, we focus primarily on the S&P 500 and Russell
2000 indexes for two main reasons. First, S&P indexes and Russell indexes are constructed in
significantly different ways, a fact that allows us to contrast the impact of changes on index fund
investors. Second, the S&P 500 and the Russell 2000 are the most popular U.S. indexes with the
highest amount of passively indexed assets relative to index value. Thus, investors in these two
indexes are most affected by index changes.
Index changes may be voluntary or involuntary. Involuntary index changes occur when
firms cease to exist publicly because of bankruptcies, liquidations, delistings, leveraged buyouts,
or mergers. Voluntary changes occur when constituent firms do not meet the indexing
company’s criteria for inclusion. For example, Standard and Poor’s deletes firms when a firm
ceases to represent its industry or the industry itself ceases to represent the economy. On the
other hand, Frank Russell Company deletes companies from its indexes based on the market cap,
stock price, and float.
To pick a candidate firm for inclusion, Standard and Poor’s uses four criteria that are not
always strictly enforced: The firm must have sufficient liquidity; firm ownership must not be
concentrated in a single or few entities; the firm must be profitable; and the firm must be a leader
in an important U.S. industry. In an attempt to keep the number of firms in the S&P 500
constant, additions to the S&P 500 occur throughout the year usually concurrent with a deletion.
In contrast, changes to the Russell 2000 occur at fixed intervals. Since 1990, the index
has been reconstituted once a year, on the last day of June. Beginning with 2004,
additions/changes to the Russell indexes occur at the close on the last Friday of June. As with the
S&P indexes, firms that cease to exist are deleted from the Russell indexes. However, unlike the
S&P indexes, firms are not contemporaneously added to the Russell indexes to replace these
6
deleted firms until the time of reconstitution. Thus, the number of companies in the Russell 2000
continues to fall from July 1 until the next reconstitution in June the following year.5 Also, unlike
the S&P indexes, no firms are deleted from the Russell indexes during the year if they fail to
continue to meet the inclusion criteria, except at the time of reconstitution in June. Though the
S&P 500 firms may not be the largest firms in the economy or the industry, they are chosen on
the basis of their importance to the economy or the industry. On the other hand, additions to the
Russell 2000 are based entirely on the market cap of the firm, subject to their fulfilling certain
conditions relating to float and stock price.
The difference in choosing replacements has an effect on index arbitrage. Since changes
to the S&P indexes are somewhat subjective and largely unpredictable, arbitrageurs can trade on
changes only between the date of announcement of the change and the effective date.6 On the
other hand, changes to Russell 2000 provide more attractive arbitrage opportunities for two
reasons. First, Russell 2000 index changes are almost fully predictable because they are based
primarily on the market cap. Many large investors and financial institutions (Merrill Lynch,
Morgan Stanley, Goldman Sachs, to name a few) begin to predict changes as early as March
though the changes do not become effective until the end of June. Second, the larger number of
index changes in small-cap indexes (like the Russell 2000 where 25% of the firms change each
year) compared to large-cap indexes (like the S&P 500 where less than 5% of the firms are turned
over each year) gives arbitrageurs more opportunities for timing. By focusing on the number of
index changes, we make an implicit assumption: that the turnover (inflows and outflows) is the
same for each index change.
We report return patterns around changes in the S&P 500 and Russell 2000 indexes in the
next two subsections.
5 The exception is that in 2004 Russell commenced adding IPO firms to the index on a quarterly basis. See also section VI.4. 6 Until September 1989, there was no lag between announcement and the actual change. Changes were announced after the close of trading and became effective at the open on the next day.
7
II.2. Changes to the S&P 500 Index
The initial sample of S&P 500 index changes consists of 303 additions and 303 deletions
for the October 1989 – December 2002 period. We impose certain criteria for constructing the
final sample. First, to focus on a pure-index-change sample devoid of information effects, we
exclude firms whose addition to the index was caused by a significant contemporaneous event or
anticipated likely major corporate event (restructuring, bankruptcy, merger, etc.) based on an
inspection of news reports over three months prior to the announcement. Second, we exclude the
involuntary deletion of foreign firms in July 2002 as a result of a change in Standard and Poor’s
policy. The final additions sample consists of 263 firms and the final deletions sample consists of
72 firms. 7 While the above screens assist in generating a clean sample, they have the potential to
understate the true impact of index changes on index fund investors. This and other biases in our
estimates are discussed in III.3.
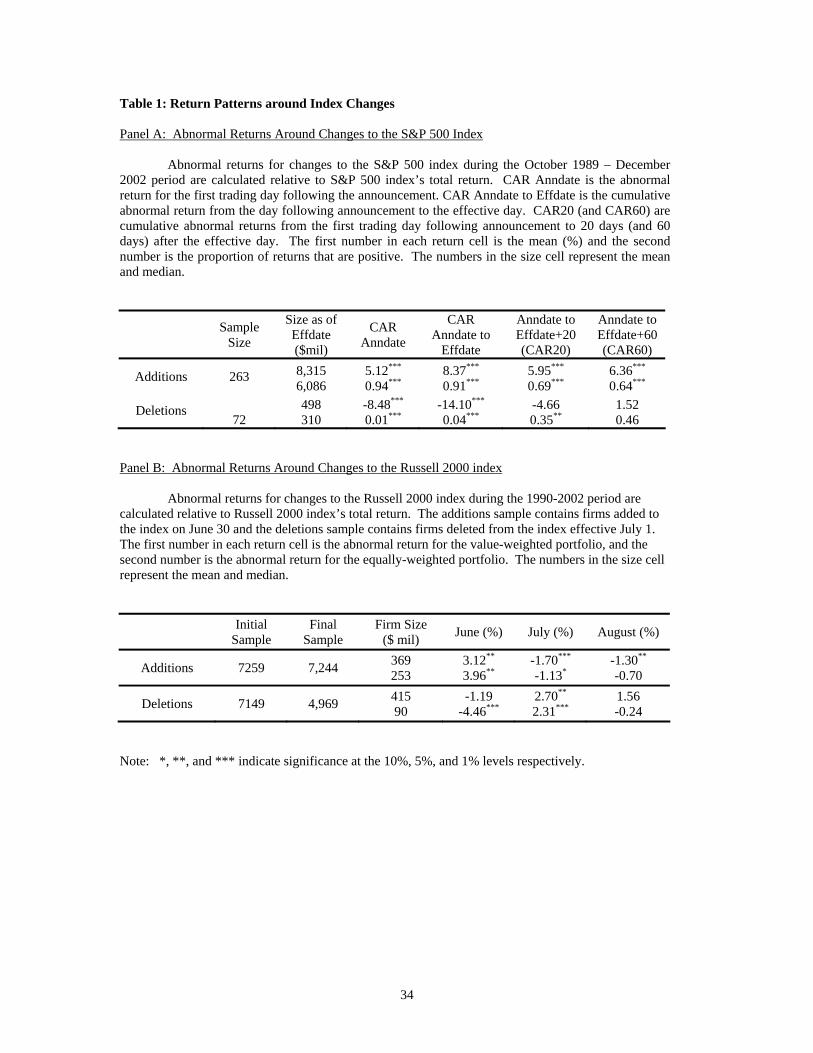
Excess returns are reported in Panel A of Table 1 based on abnormal and cumulative
abnormal returns measured relative to the S&P 500 index. The mean abnormal return upon
announcement of an addition is 5.12%.8 The added stock, however, continues to appreciate
between announcement and the actual change accumulating a total abnormal return of 8.37%.
The results show that there are two components of the abnormal returns due to additions: a
permanent effect and a temporary effect. The permanent change in the price of added stocks, as
reflected in the cumulative abnormal return from the announcement through 60 days after the
effective date (CAR60) is 6.36%. The temporary effect, measured by the difference between the
CAR from the announcement date up to the effective date and the CAR 60 days after the effective
date, is 2.01%.
7 Our overall sample selection process is similar to that in Chen, Noronha and Singal (2004). 8 Announcement day return refers to the return for the trading day following announcement because all announcements are made after the close of markets.
8
For the deletions sample, the loss upon announcement is a significant 8.48%, with an
additional loss of 5.62% between the announcement day and the effective day. There is a lack of
permanence in the excess return. The negative effect of deletions disappears completely 60 days
after the effective date. Thus, for deletions, the permanent effect is insignificant, but the
temporary effect is a large negative 15.62% (=14.10% + 1.52%).9
II.3. Changes to the Russell 2000 index
Since it is possible to anticipate changes to the Russell 2000, prior work has found an
upward price trend during the March-June period for stocks actually added to the index. For
example, Madhavan (2003) finds that additions to the Russell 2000 experience a cumulative
return of more than 20% in the March-June period compared with a loss of about 9% for
deletions during the same period. The firms added to the index lose approximately 7.7% in July,
suggesting a temporary price pressure similar to that for S&P 500 index changes. His sample
covers the 1996-2002 period.
We report similar results in Panel B of Table 1 for Russell 2000 index changes around the
time of reconstitution for the 1990-2002 period. Instead of considering the March-June period,
however, we consider only the month of June because relying on prior month returns introduces a
look-forward bias, since changes are not known with certainty until the end of May.10 From the
table, it is clear that added firms gain in June, as price pressure builds in anticipation of buying by
index funds upon reconstitution, and then lose in July and August as the added firms return to
price levels based on their fundamentals. By a symmetric argument, deleted firms lose in June
and gain in July and August. In summary, the excess returns in June (3.12%) earned by the firms
9 This result is similar to that in Chen, Noronha, and Singal (2004) and in Dash (2002), a study conducted by Standard and Poor’s. 10 We consider the negative bias introduced by excluding the months of March, April, and May. Even though the change list is known with a high degree of confidence as early as March in any year, the probability of addition/deletion for a firm on the list is not 1.0 and this induces an additional risk factor into a portfolio of additions or deletions formed earlier than May 31st. Please see discussion in III.3.1.
9
added to the Russell 2000 index are surrendered in the two months following the actual addition.
Deleted firms, in contrast, lose in June but appreciate by a total of 4.26% in July and August.
III. Losses to Index Fund Investors
It is evident from the previous section that there are price pressure effects around the
effective day of index additions and deletions. In this section, we estimate the losses to index
fund investors due to the inability of managers to trade on a day other than the effective day. We
first estimate the loss based on the temporary price pressure effect. A more precise estimate is
computed later by implementing trading strategies based on price patterns observed in this paper
and other papers around index changes.
III.1 Losses to Index Investors: An Approximation
We assume that fund managers, for purposes of illustration, unfettered by tracking error
constraints, will trade in accordance with the price patterns documented in the previous section.
That is, managers will buy additions on the day after announcement for the S&P 500 index and at
the end of May for the Russell 2000, and that they will sell deleted stocks 60 days after the
effective date for the S&P 500 and at the end of August for the Russell 2000. Our logic for using
different addition and deletion dates for S&P 500 index changes and Russell 2000 index changes
is based on Greenwood (2004). He finds that arbitrageurs realize abnormal returns by waiting for
several weeks after the event. In our scenario, fund managers could step into the shoes of the
arbitrageurs to capture the abnormal returns by waiting for a few weeks after the effective date.
III.1.1 S&P 500 index: Based on Panel A in Table 1, there are an average of 20 additions and 6
deletions every year. The temporary price effect is 2.01% for additions and -15.62% for
deletions. Since the size of an average company entering the index is $8.3 billion according to
10
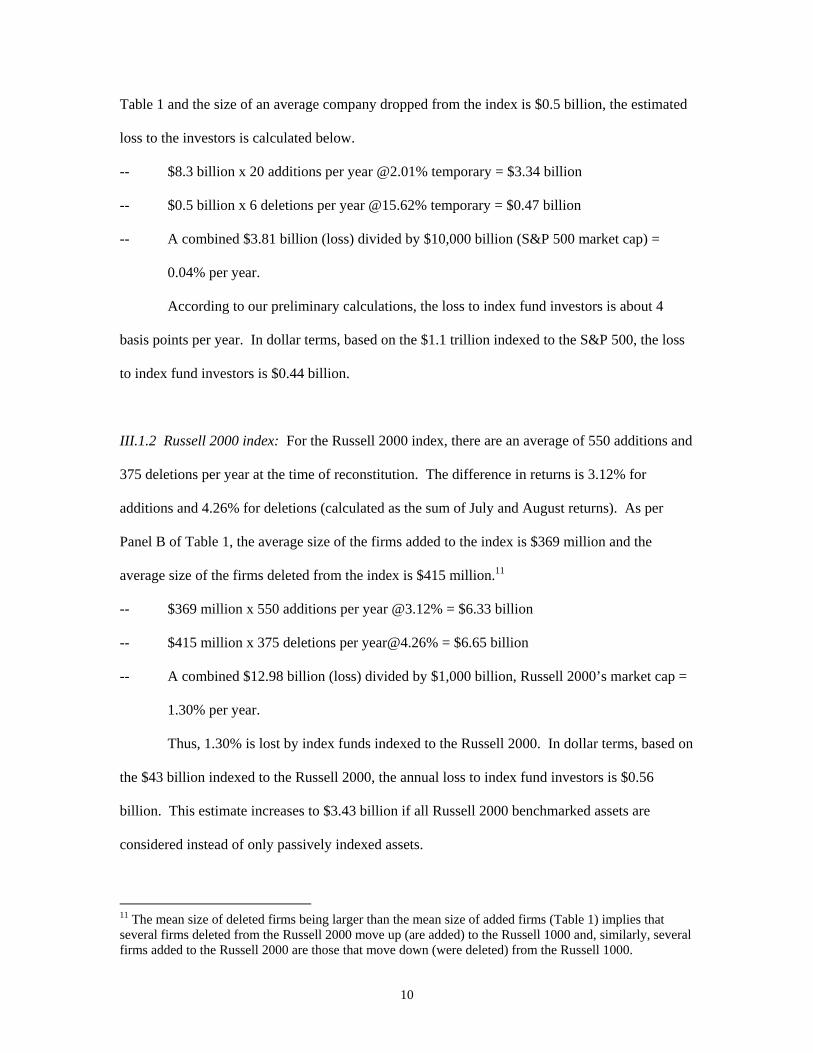
Table 1 and the size of an average company dropped from the index is $0.5 billion, the estimated
loss to the investors is calculated below.
-- $8.3 billion x 20 additions per year @2.01% temporary = $3.34 billion
-- $0.5 billion x 6 deletions per year @15.62% temporary = $0.47 billion
-- A combined $3.81 billion (loss) divided by $10,000 billion (S&P 500 market cap) =
0.04% per year.
According to our preliminary calculations, the loss to index fund investors is about 4
basis points per year. In dollar terms, based on the $1.1 trillion indexed to the S&P 500, the loss
to index fund investors is $0.44 billion.
III.1.2 Russell 2000 index: For the Russell 2000 index, there are an average of 550 additions and
375 deletions per year at the time of reconstitution. The difference in returns is 3.12% for
additions and 4.26% for deletions (calculated as the sum of July and August returns). As per
Panel B of Table 1, the average size of the firms added to the index is $369 million and the
average size of the firms deleted from the index is $415 million.11
-- $369 million x 550 additions per year @3.12% = $6.33 billion
-- $415 million x 375 deletions per [email protected]% = $6.65 billion
-- A combined $12.98 billion (loss) divided by $1,000 billion, Russell 2000’s market cap =
1.30% per year.
Thus, 1.30% is lost by index funds indexed to the Russell 2000. In dollar terms, based on
the $43 billion indexed to the Russell 2000, the annual loss to index fund investors is $0.56
billion. This estimate increases to $3.43 billion if all Russell 2000 benchmarked assets are
considered instead of only passively indexed assets.
11 The mean size of deleted firms being larger than the mean size of added firms (Table 1) implies that several firms deleted from the Russell 2000 move up (are added) to the Russell 1000 and, similarly, several firms added to the Russell 2000 are those that move down (were deleted) from the Russell 1000.
11
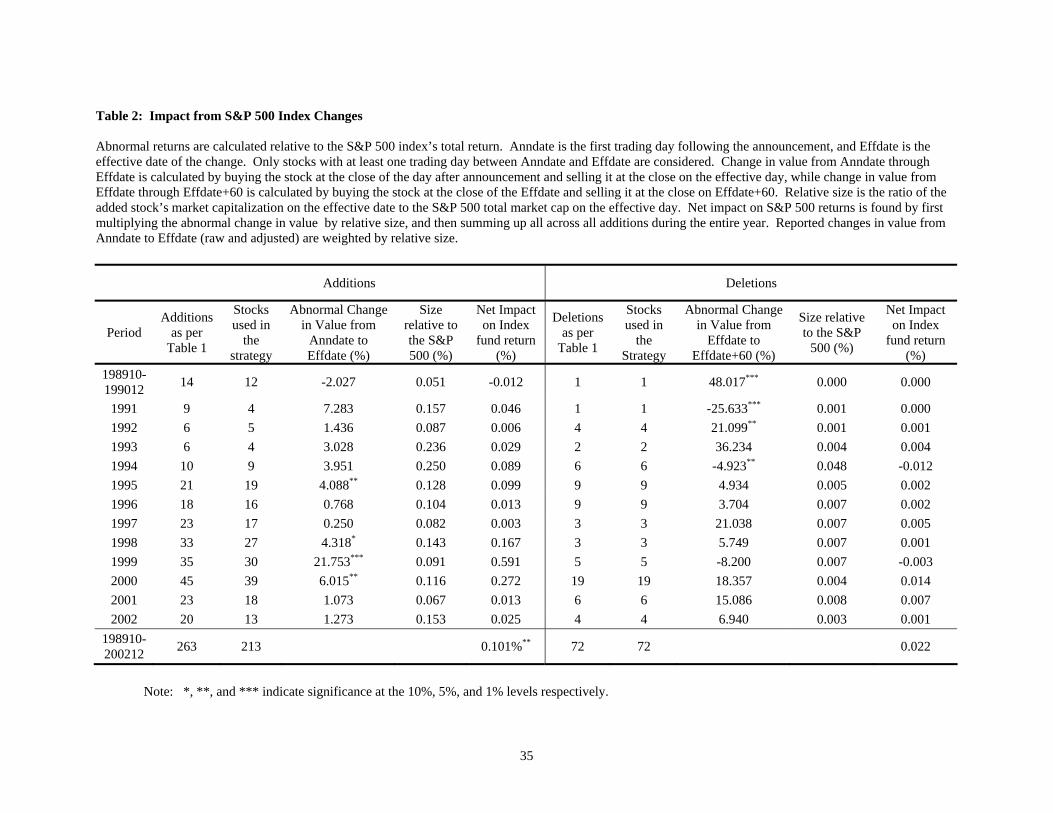
III.2 Losses to Index Investors: A More Precise Estimate
In order to calculate the impact of index changes on an index fund, we construct trading
strategies that take advantage of the known patterns in price changes around the effective date.
The effect of the trading strategy is separated from the normal operation of an index fund by
overlaying the trading strategy on the index fund which would normally make all changes on the
effective date. For example, in the case of S&P 500 additions, the normal strategy is to buy the
added stock on the effective date. Based on the evidence, the fund manager should buy the stock
on the day after announcement. Thus, the overlay trading strategy or the incremental trading
strategy entails buying the added stocks at the close on the day after announcement and selling on
the effective day. The incremental trading strategy combined with the normal operation gives the
desired result.
The abnormal return from the trading strategy is weighted by the size of the added firm
on the effective date relative to the contemporaneous size of the index to arrive at an estimate of
the net effect on the total fund return. Mathematically, the impact of the trading strategy is given
by equation (1).
Net Impact = ⎟⎟⎠
⎞⎜⎜⎝
⎛⎟⎟⎠
⎞⎜⎜⎝
⎛+−⎟⎟
⎠
⎞⎜⎜⎝
⎛+× ∏∏∑
= tmt
tit
C
i
i RRIndexSizeFirmSize
)1()1(1
(1)
where “C” is the number of index changes, Rit and Rmt are the daily return for stock i and
the relevant index on day t during the period of the trading strategy, respectively.
III.2.1 S&P 500 Index
For additions to the S&P 500 index, we construct a trading strategy where an added stock
is bought on the day after announcement and sold on the effective day.12 Essentially, the
strategies we propose are those that absent the focus on tracking error minimization, index funds
12 Since announcement takes place after exchanges have closed, we essentially buy at the closing price on the day after announcement. Thus we lose the announcement day return. This helps to explain why the numbers in Table 2 look considerably different from those in Table 1.
12
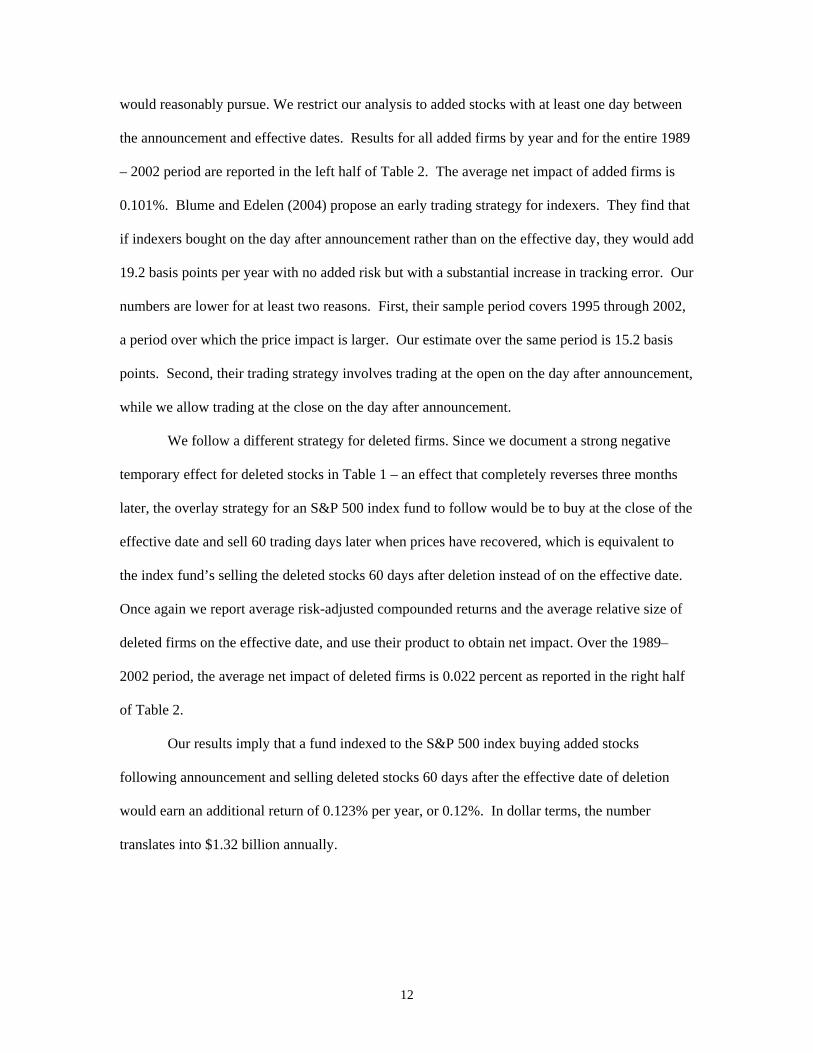
would reasonably pursue. We restrict our analysis to added stocks with at least one day between
the announcement and effective dates. Results for all added firms by year and for the entire 1989
– 2002 period are reported in the left half of Table 2. The average net impact of added firms is
0.101%. Blume and Edelen (2004) propose an early trading strategy for indexers. They find that
if indexers bought on the day after announcement rather than on the effective day, they would add
19.2 basis points per year with no added risk but with a substantial increase in tracking error. Our
numbers are lower for at least two reasons. First, their sample period covers 1995 through 2002,
a period over which the price impact is larger. Our estimate over the same period is 15.2 basis
points. Second, their trading strategy involves trading at the open on the day after announcement,
while we allow trading at the close on the day after announcement.
We follow a different strategy for deleted firms. Since we document a strong negative
temporary effect for deleted stocks in Table 1 – an effect that completely reverses three months
later, the overlay strategy for an S&P 500 index fund to follow would be to buy at the close of the
effective date and sell 60 trading days later when prices have recovered, which is equivalent to
the index fund’s selling the deleted stocks 60 days after deletion instead of on the effective date.
Once again we report average risk-adjusted compounded returns and the average relative size of
deleted firms on the effective date, and use their product to obtain net impact. Over the 1989–
2002 period, the average net impact of deleted firms is 0.022 percent as reported in the right half
of Table 2.
Our results imply that a fund indexed to the S&P 500 index buying added stocks
following announcement and selling deleted stocks 60 days after the effective date of deletion
would earn an additional return of 0.123% per year, or 0.12%. In dollar terms, the number
translates into $1.32 billion annually.
13
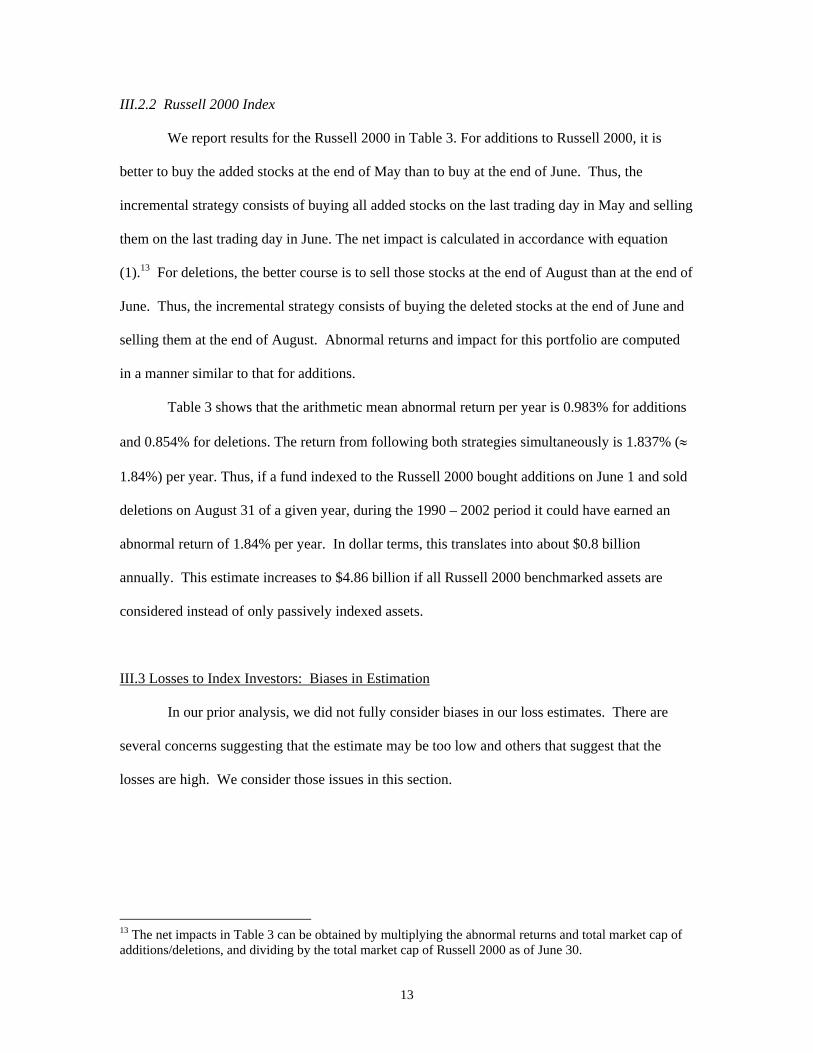
III.2.2 Russell 2000 Index
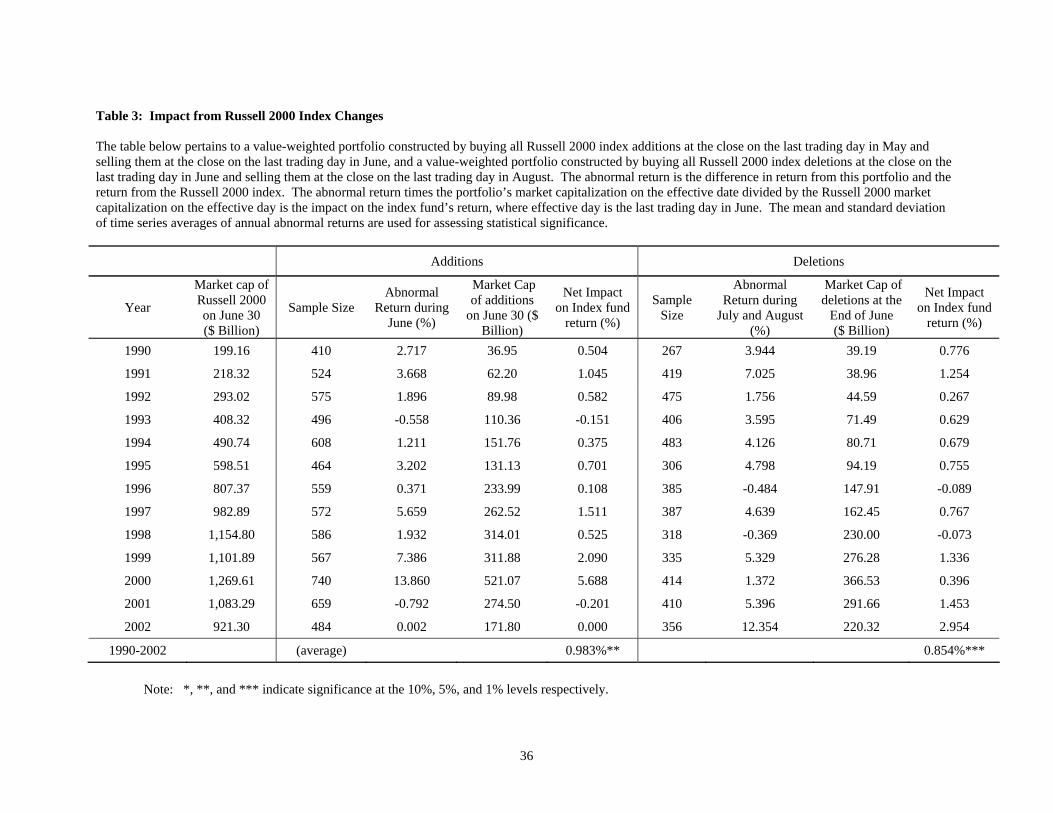
We report results for the Russell 2000 in Table 3. For additions to Russell 2000, it is
better to buy the added stocks at the end of May than to buy at the end of June. Thus, the
incremental strategy consists of buying all added stocks on the last trading day in May and selling
them on the last trading day in June. The net impact is calculated in accordance with equation
(1).13 For deletions, the better course is to sell those stocks at the end of August than at the end of
June. Thus, the incremental strategy consists of buying the deleted stocks at the end of June and
selling them at the end of August. Abnormal returns and impact for this portfolio are computed
in a manner similar to that for additions.
Table 3 shows that the arithmetic mean abnormal return per year is 0.983% for additions
and 0.854% for deletions. The return from following both strategies simultaneously is 1.837% (≈
1.84%) per year. Thus, if a fund indexed to the Russell 2000 bought additions on June 1 and sold
deletions on August 31 of a given year, during the 1990 – 2002 period it could have earned an
abnormal return of 1.84% per year. In dollar terms, this translates into about $0.8 billion
annually. This estimate increases to $4.86 billion if all Russell 2000 benchmarked assets are
considered instead of only passively indexed assets.
III.3 Losses to Index Investors: Biases in Estimation
In our prior analysis, we did not fully consider biases in our loss estimates. There are
several concerns suggesting that the estimate may be too low and others that suggest that the
losses are high. We consider those issues in this section.
13 The net impacts in Table 3 can be obtained by multiplying the abnormal returns and total market cap of additions/deletions, and dividing by the total market cap of Russell 2000 as of June 30.
14
III.3.1 Underestimation Bias – Price Drift during April and May
Previous work has revealed that there is a price drift in April, May, and June for stocks
likely to be added to and dropped from the Russell 2000. Yet the analysis in this paper considers
only the month of June. Not including the price drift during the earlier months biases the loss
estimate downwards.
We choose not to include the months of April and May in our calculations because of the
uncertainty associated with the changes and the necessity for implementation of a costly dynamic
trading strategy. Since the final list of changes is based on the market capitalization on the last
trading day of May, any earlier time used for ranking will generate a list of changes that is not
accurate. Consider a list of additions that is generated at the end of March based on market cap.14
Assume that long positions are taken accordingly. Since stock prices are volatile, the rankings on
later days could change, generating a different list of probable additions. This means that some
long positions would need to be closed and new ones created on a continuing basis until the end
of May.
Such a dynamic trading strategy has two drawbacks. First, the strategy will incur
excessive trading costs because of the need to open and close positions due to volatility of the
rankings. Second, a potential addition will cease to be an addition only when the stock price falls
(relative to other stocks). This implies that the trading strategy also incurs a loss on the position
besides incurring additional costs. These losses can be large and add volatility to the strategy.
Though the costs associated with a dynamic trading strategy can be controlled by not choosing
stocks too close to the breakpoints, it still introduces significant uncertainty and ad hoc decision
making, something which we try to avoid.
It is obvious that there are potential gains from starting early and not including earlier
months probably leads to an underestimate of losses. We choose not to start early because of
14 An identical analysis applies for deletions.
15
increased costs of a dynamic trading strategy and introduction of a level of arbitrariness to the
Our analysis is based on ensuring a clean sample of index changes so that the loss
estimates are credible. In the process of creating a clean sample though it is possible that many
sources of potential losses to index investors are not explicitly considered.
One factor not considered in the calculations is the effect of involuntary deletions, such
as bankruptcies, mergers, liquidations, and spinoffs. Approximately 75% of all deletions from
the S&P 500 are involuntary, as are 25% of all deletions in the Russell 2000. Since such
deletions are accompanied by important firm-specific news, we chose to exclude them from our
sample in order to isolate the index effect from the information effect.
While the actual deletion of firms due to major corporate events is involuntary, the timing
of deletion from the index is voluntary, which allows the fund managers to delete a company
from the portfolio without waiting for the corporate event (such as a merger) to become
effective.15 As a matter of fact, involuntary deletions are more transparent than voluntary
deletions, and provide additional opportunities for arbitrageurs and fund managers to beat the
index. Nonetheless, in many cases, it is difficult to estimate the impact of companies that cease to
trade concurrent with the effective date of deletion.
Firms close to bankruptcy provide some noisy information about potential losses because
they continue to trade even after the effective date. Pan Am is an example. The announcement of
Pan Am’s deletion was made on January 8, 1991 after the close of markets, with January 9, 1991
as the effective date. Its closing price on January 8, 1991 was $0.75. It closed at $0.375 the next
day (the effective day) and recovered to close at $0.75 on January 10, 1991. Over the next 60
trading days, its lowest closing price was $0.625, 67% above the effective day closing price. 15 We thank a referee for pointing this out.
16
Another example is Carter Hawley Hale Stores. The deletion announcement was made on
February 11, 1991 with February 12, 1991 as the effective day. The stock closed at $1.625 on
February 11, 1991, fell to $1.125 on the effective day, recovered to close at $1.375 the following
day. Over the next 60 trading days, its lowest closing price was $1.625, 44% above the effective
day price. Both examples illustrate the potential underestimation of the loss to index fund
investors because deletions with confounding events are not included in our sample.
The deletion of foreign firms in July 2002 provides another illustration of firms that
continue to trade after deletion. These firms were explicitly excluded from the analysis herein
because the deletions are a one-time event unlikely to be repeated in the future. According to one
estimate, however, purchasing the added firms and selling the deleted firms at the open on the day
after announcement could have added 0.58% to an index fund’s return relative to the S&P 500
index return for 2002.16
Besides constituting a large fraction of the changes to the S&P 500, the firms deleted
involuntarily are also much larger in size than the firms voluntarily deleted from the index. Thus,
exclusion of involuntary deletions from our analysis, though necessary and warranted, introduces
a downward bias in the loss estimate.
III.3.3 Overestimation Bias – Mismatched Trades, Transactions Costs, and Volatility
Trading strategies in subsections III.1 and III.2 for both S&P 500 index changes and
Russell 2000 index changes call for buying added firms before the effective date and selling
deleted firms after the effective date. Since these trades take place at different times, several
issues arise. The first concern relates to volatility. Do the different positions result in higher risk
for the portfolio? The summarized results are reported later in Table 5.17 The monthly standard
16 As pointed out in section III.2.1, trading at the open on the day after announcement can generate additional gains. We thank a referee for providing us an estimate of loss due to the deletion of foreign firms. 17 Year-by-year results can be obtained from the authors.
17
deviation of the index fund portfolio with the recommended strategy is almost the same as that of
the S&P 500. The monthly standard deviation of the Russell 2000 index fund is marginally
higher, 5.363% instead of 5.318%. These results show that there is no significant increase in risk.
The second concern relates to trading costs. The trading strategies we propose do not
actually result in additional trading costs. The added stock is bought only once and the deleted
stock is sold once except that the trades occur at different times. Therefore, there is no reason to
believe that the trading costs are significantly different.
The third concern relates to availability of funds. Since the added firms have to be
bought before selling deleted firms, this would require an additional outlay of funds. One way to
circumvent the funding constraint is to short-sell the appropriate index in the cash market,
perhaps, with exchange-traded funds, and use short sale proceeds to buy added stocks.18 Besides
relaxing the funding constraint, short-selling may also help align the portfolio more closely with
the index, which will reduce the overall risk and tracking error. Another criticism of relying on
mismatched buys and sells is that the design of the strategy is based on limited evidence
especially in the case of Russell 2000. Greenwood (2004) provides corroborating evidence based
on changes in the Nikkei 225 that suggests that waiting for a few weeks can generate excess
returns.
III.3.4 Overestimation Bias – Comparison of S&P 500 and Russell 2000 indexes
Though a comparison of the two popular indexes is valuable in highlighting the effect of
index changes, it gives the impression that, from an investor standpoint, the S&P indexes are
superior. However, such a conclusion is not necessarily valid since the S&P 500 is a large-cap
index while the Russell 2000 is a small-cap index. A natural bias arises from the fewer changes
that are necessary for a large-cap index and the smaller impact of each index change.
18 We recognize that short sale proceeds are not usually available for reinvestment. Therefore, we acknowledge that the actual savings from this strategy may be marginally smaller than those assumed here.
18
In the case of a small-cap index, a company may be deleted because it becomes too big or
too small. In contrast, most voluntary deletions from a large-cap index occur only because a
company becomes too small. The annual number of changes for the S&P 500 index is under 5%
whereas the number of changes for the S&P 600 is approximately three times as frequent at 13%.
Since each index change is a candidate for index arbitrage, fewer changes mean smaller losses for
index investors.
The second source of bias is the impact of deletions on the index. Since deletions from
the large-cap index occur only from below, the size of the company being changed is small
relative to the index. From Table 2 and Section III.1, it can be seen that the relative size of
deletions is approximately 0.01% of the S&P 500 index. On the other hand, deletions from a
small-cap index occur from above and below resulting in a relatively large firm size. For the
Russell 2000, the average size of a deleted firm is about 0.05% of the index value. Not only is
the relative size of deletions five times larger, the number of voluntary deletions for a small-cap
index as a percentage of total deletions is also larger (about 75%) compared with a large-cap
index (25%). Note that involuntary deletions are not included in the analysis because of
confounding events. Finally, the price impact of large-cap index changes may be smaller due to
greater liquidity of the stocks that belong to a large-cap index when compared with changes in a
small-cap index.
While a comparison between two small-cap indexes or two large-cap indexes may be
preferred, neither the S&P 500 index nor the Russell 2000 index has a similar sized index with a
comparable level of indexing. Thus, a comparison of the S&P 500 with the Russell 2000 is
appropriate and highlights the effects of differences in index construction and index changes. A
superficial comparison of indexes with similar capitalizations can be made by perusing Table 4
and is discussed in the next subsection. Briefly, we find that the Russell 2000 investors suffer
significantly higher losses primarily due to the objective criteria used for its construction.
19
III.4 Corroborating Evidence
Our results thus far demonstrate that index fund investors lose when index funds trade on
the effective date of index reconstitution, with losses to Russell 2000 index investors somewhat
greater in percentage terms than those to S&P 500 index investors. The question of whether the
manner in which indexes are reconstituted matters is thus a valid one. To answer this question,
we compare large-cap and small-cap indexes from three major indexing companies: Standard and
Poor’s, Frank Russell Co., and Morgan Stanley Capital International. Though the number of
stocks, market capitalization, and other characteristics of these indexes are different, we believe
that a comparison is reasonable because all large-cap indexes (and small-cap indexes) compete
for the same customers.
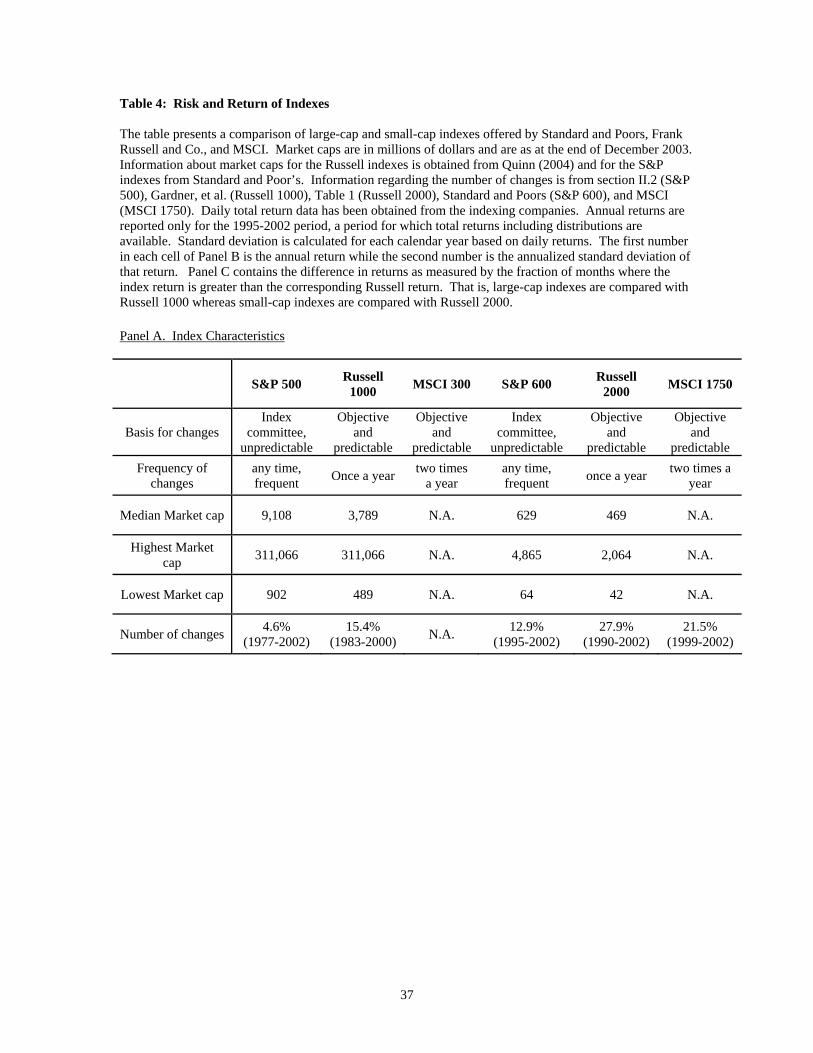
In Table 4, we report the main characteristics of the indexes followed by the annual
returns and associated risks of those indexes. Most of the data including the daily total returns are
obtained from the indexing companies. The risk and return analysis begins in 1995, the earliest
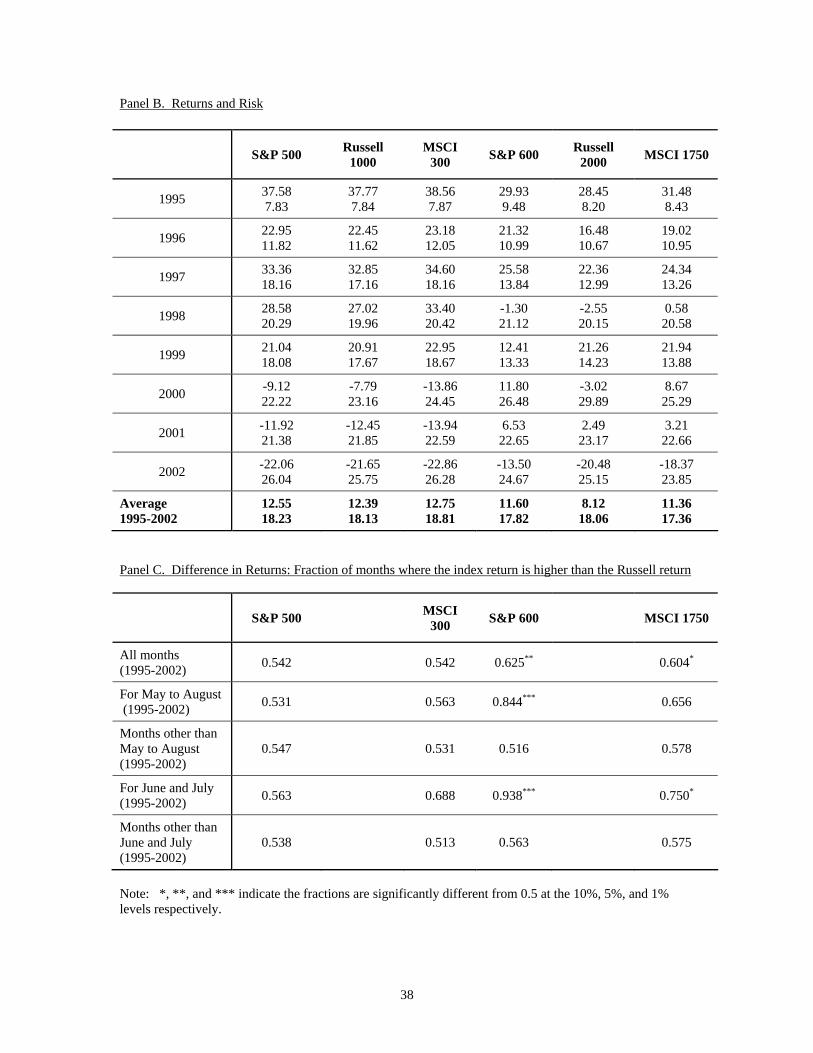
year for which total return data for all indexes are available. In Panel B, the average returns for
the 1995-2002 period show that the large-cap indexes (S&P 500, Russell 1000, and MSCI 300)
exhibit similar returns and risk. The small-cap indexes tell a different story. The Russell 2000
index earns a lower return than S&P 600 in all years except 1999, while it underperforms MSCI
1750 in all years. Overall, the average annual return to the Russell 2000 is more than 3% less
than the returns to the other two indexes. At the same time, the risk of the Russell 2000 index is
not less than that of either the MSCI 1750 index or the S&P 600 index.
In Panel C of Table 4, we evaluate whether returns are statistically different by
computing the fraction of months where the index return (S&P and MSCI) is higher than the
corresponding Russell return. That is, S&P 500 and MSCI 300 returns are compared with the
Russell 1000 return, and S&P 600 and MSCI 1750 returns are compared with the Russell 2000
20
return. For the large-cap indexes, we find that the fraction of months for which the S&P 500
return is larger than the Russell 1000 return is not significantly different from 0.50.
The comparison of the small-cap indexes is more interesting. S&P 600 index has a
higher return than the Russell 2000 index for 62.5% of the months, which is significantly greater
than 50%. To determine whether the excess return is related to the Russell reconstitution, we
examine whether or not the returns are different around the reconstitution date. Excluding the
months from May to August, the S&P 600 index outperforms the Russell 2000 index only 51.6%
of the time. However, it has a higher return than the Russell 2000 index for 84.4% of the time
from May to August and 93.8% of the time during June and July, both significantly higher than
50%.
The differences in returns for the Russell 2000 and S&P 600 indexes and the
concentration of those differences in the months around reconstitution are consistent with the loss
introduced by the arbitrage activity that occurs with predictable index changes in the Russell 2000
and the success of the Russell 2000 as evidenced by the high level of indexing. On the other hand,
the Russell 1000 does not severely underperform its competing large-cap indexes even with
predictable and numerous changes because the level of indexing is low. Moreover, the subjective
nature of index changes in the S&P indexes limits the losses from arbitrage with the result that
the popular S&P 500 index does not earn returns that are significantly different from other large-
cap indexes. The losses from index changes are well-known to mutual fund managers. For
example, Vanguard switched to the MSCI 1750 in Spring 2003 to attenuate losses due to timing
by arbitrageurs.
We can conclude from the discussions in this section that index fund investors are better
served when indexing companies introduce uncertainty into the process of index changes and
when indexes are not popular. In addition, a reduction in the turnover associated with index
changes and possibly a reduction in the period of pre-announcement should further limit the
ability of arbitrageurs to game index funds.
21
IV. Limitations of Tracking Error
The evidence in the previous section makes it quite clear that index fund investors lose
due to the activities of arbitrageurs. These results are consistent with those of Frino, Gallagher,
and Oetomo (2005) who find that passive Australian funds would benefit from employing less
rigid rebalancing and investment strategies. In this section we focus on the benefits and costs of
the tracking error constraint.
IV.1 Tracking Error as a Low-Cost Agency Solution
Given that arbitrageurs can time them, why do index fund managers focus on tracking
error minimization and why do investors instruct fund managers to minimize tracking error? A
major justification has its roots in the principal-agent problem. When investors delegate
investment decision-making to fund managers, they accept that these managers’ propensity to
assume risk to enhance performance may diverge from their own. One way to constrain
managerial risk-taking is to bind fund managers to an objective of minimizing tracking error.
Operationally, this translates to a full index replication strategy, where managers adjust fund
holdings to closely follow changes to the index, since sampling, or enhanced indexing, the other
common indexing strategy, is likely to result in larger tracking error. Thus, tracking error appears
a simple yet effective way of reducing investor-manager conflicts and evaluating performance.
IV.2 Tracking Error Is Inadequate
There are theoretical arguments showing that a policy of focusing on tracking error may
be sub-optimal. Roll (1992) demonstrates that optimizing portfolios with respect to tracking error
and its variance is not the same as optimization in a Markowitz mean-variance framework and
results in inefficient portfolios. Clarke, Krase, and Statman (1994) go even further and argue that
22
the tracking error framework of evaluation is not grounded in Markowitz mean-variance theory
and is part of a mental accounting framework related to aversion to regret. From an evaluative
standpoint, Pope and Yadav (1994) show that tracking error is subject to estimation bias from
negative serial correlation whenever the investment horizon is longer than the data frequency
interval used in estimation – presumably always the case for index fund investors. More recently,
Jorion (2003) demonstrates that constraining managers with tracking error volatility results in
their ignoring total portfolio risk and holding inefficient portfolios. Therefore, despite its
potential to mitigate an agency problem between investors and index-fund managers, on the basis
of the theoretical and empirical issues just mentioned, the use of tracking-error minimization
alone as an evaluative tool may not ultimately be in the best interests of index fund investors.
However, the use of tracking error continues to be popular. Though index fund managers
are aware of the unattractiveness of prices on the effective date, Chen, Noronha, and Singal
(2004) report that the trading volume on the effective date is several times the normal daily
volume.19 This suggests that index fund managers continue to change their portfolios on the
effective date with a view to minimizing tracking error.
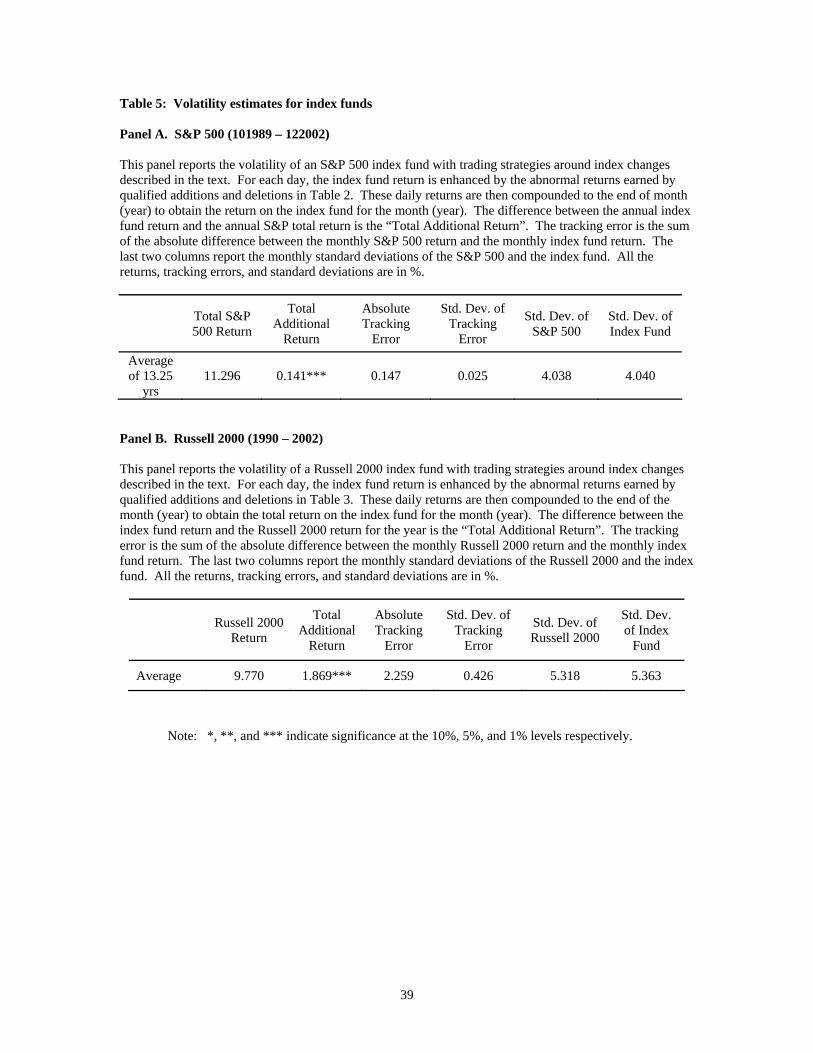
Indeed, if index fund managers did not change their portfolios on the effective date, their
tracking errors would be much higher. In Panels A and B of Table 5, we report tracking error and
total standard deviation estimates for the index funds following the strategy we document in
Tables 2 and 3 and compare these to the standard deviations of the S&P 500 and Russell 2000
indexes. Compounded strategy returns in excess of the S&P 500 index return are reported in the
third column of Table 5 and the sum of absolute tracking error for the year is listed in the fourth.
Not surprisingly, the absolute tracking error with the implementation of these strategies is 0.15%
19 Some observers have suggested that the actual trading volume on the effective day is much less than what would be expected if all index fund managers traded on that day. A quick check for all additions to the S&P 500 index in the latter half of 2002 reveals that the trading volume is sufficiently large to support all managers trading on that day. The trading volume on the effective date is 9% to 20% of the number of shares outstanding for NYSE stocks and between 20% and 25% for Nasdaq stocks without adjusting the volume for the upward bias in Nasdaq’s reported volume. This compares favorably with the ratio of 11.3% indexed value to total value for the S&P 500.
23
for the S&P 500 and much higher at 2.26% for the Russell 2000. But the higher tracking error is
accompanied by additional returns of 0.14% and 1.87% respectively. Equally important, in the
last two columns of Panel A, we report that the standard deviation of the S&P 500 index is almost
the same as that for the index fund pursuing the strategy we follow. Similar results for the
Russell 2000 index are reported in Panel B. The yearly results (not reported here) are consistent
with the overall average results in Table 5, suggesting that managers following the strategies we
advocate would not be assuming excess risk in any given year. The evidence indicates that
following the strategies we advocate would have resulted in generally positive alpha without
altering risk.
Though principals (index fund investors) would probably welcome higher returns without
significantly higher fund volatility, the additional return cannot be earned without increasing
tracking error. Thus, the tracking error focus, while restricting the risk-taking propensities of
fund managers, has also limited their ability to benefit their principals. Another measure of index
fund performance is required. However, until a new measure becomes available, it appears
prudent to eschew the use of tracking-error minimization as the only evaluative tool. Instead,
positive deviations from the benchmark (positive alpha) should be permitted when not
accompanied by greater risk for the fund portfolio or use of the Sharpe ratio should be extended
to index funds. This recommendation is consistent with Roll (1992).
V. Indexes and Index Construction
It is evident that arbitrageurs are able to front-run index fund managers and create wealth
transfers from index fund investors to themselves when
(i) index changes are transparent and known sufficiently in advance of the effective date,
(ii) the index is heavily used by passive index funds, and
24
(iii) fund managers are constrained to trade on the effective day by tracking error or other
performance metrics.
All three conditions must be met for fund investors to lose from index changes. We have
already considered how relaxation of the tracking error constraint can improve performance. In
this section, we discuss other choices that fund managers can make to minimize these losses as
well as explore ways in which indexing companies can make indexes less susceptible to arbitrage.
There are three types of indexes that are relevant to our discussion: silent indexes, open
but not heavily used indexes, and popular indexes.
V.1 Silent Indexes
According to Gastineau (2002), “a silent index is an index developed and maintained for
the use of a single exchange-traded fund or a single traditional mutual fund.” The constituents of
the silent index are publicly known and index construction is based on a defined set of rules.
Unlike a typical index, however, changes to the index are not made public until after the effective
date. Construction and creation of silent indexes is not necessarily onerous. Though several
silent indexes may have the same initial composition, index changes can still be different. For
example, if a new stock (like Google) has to be added to the index, it can be added at different
times – additions could be spaced by a week across different indexes but kept secret. Without
prior knowledge of index changes, it is not possible for arbitrageurs to front-run a fund. Thus, a
fund based on silent indexes will avoid most of the losses that are highlighted in this paper.
While a silent index avoids index arbitrage, the main concern with this kind of an index is
lack of transparency. Current SEC regulations don’t allow any index to be silent. That is, all
indexes must be published and all changes must be publicly available to all at the same time.
Lack of transparency also creates marketing issues as it introduces uncertainty in the minds of
25
investors. Moreover, creating a silent index might put enormous pressure on the fund manager to
keep everything silent, or secret.
Assuming it can be implemented within current SEC regulations, or after regulations are
changed, a silent index may be the best medicine for neutralizing index arbitrage in the long-term.
As we discuss below, all indexes have limitations but a silent index with a slight variation may
work best in the short term.
V.2 Open but Not Heavily Used Indexes
An open index is one which has its list of constituent firms publicly available and
changes to its composition freely available. A “not heavily used” index is one where passive
indexing doesn’t exceed 1% of the market value of all stocks in the index.20 Examples of these
indexes include Russell 1000, MSCI 300, and MSCI 1750. The 1% cutoff ensures that the excess
demand created by indexers does not have a significant impact on the price. An examination of
the returns of not heavily used indexes in Table 4 shows that such indexes do not suffer
significant losses due to arbitrage. Thus, an open but not heavily used index, while having the
characteristics of any typical index, will not be detrimental to passive investors because index
changes are of little interest to arbitrageurs.
An index of this kind has two limitations. First, a fund based on an open index is still
likely to experience some losses due to index arbitrage though those losses would not be as large
as those experienced by popular funds (see Section V.3). Second, once the index becomes
popular, the fund manager must switch to another index that fits the mold of an “open but not
heavily used” index. Continuing with a now popular index will make it much more susceptible to
arbitrage losses. However, the transition to a new index will be costly due to managerial time and
effort involved in the change, transactions costs for changing the index, and realization of taxable
capital gains when existing profitable positions are sold and replaced with new stocks. 20 The 1% cutoff is arbitrary and could be lower or higher.
26
V.3 Popular Indexes
At the other extreme of a silent index is an index where all changes are publicly known
and arbitrageurs have an incentive to front-run passive index funds because of the high level of
indexing. The evidence of index arbitrage presented in this paper relates to such open and
popular indexes like S&P 500 and Russell 2000. With popular indexes and minimization of
tracking error as an objective, the only way to avoid index arbitrage is by negating “transparent
index changes that are pre-announced or predictable.” A comparison of the process of index
changes for S&P 500 and Russell 2000 reveals the ways in which even popular indexes can limit
losses due to index arbitrage. These are discussed separately under number of index changes,
predictability of changes, and pre-announcement of changes.
V.3.1. Number of Index Changes21
The number of index changes in a given period depends on both the frequency with
which changes are made and the criteria driving those changes. A study by Russell staffers
[Gardner, Kondra, and Pritamani (2001)] finds that simply changing from annual reconstitution to
quarterly reconstitution would have increased the annual number of changes in the Russell 2000
from 546 (27% of all firms) to 899 (45% of all firms) over the 1983-2000 period, representing an
increase of 65%. Since each index change may be associated with an opportunity for index
arbitrage, a larger number of changes could translate into a larger loss for index fund investors.
But the frequency of index changes could be increased without increasing the number of changes
through a judicious choice of other criteria. For example, changes in the S&P 500 are more
frequent than changes in the Russell 2000 though the total number of changes as a fraction of the
total number of stocks in the S&P 500 is not as large as for the Russell 2000 or for Russell 1000.
21 As mentioned in Section II.1, we assume that the turnover associated with each index change is the same.
27
V.3.2. Predictability of Index Changes
The second important factor in gaming by arbitrageurs relates to the predictability of
index changes. Since subjective criteria are used for changes to S&P indexes, it is generally
difficult to predict which firms will be added to or deleted from the index.
As noted earlier, the Russell indexes and many other indexes are constructed
mechanically based on the market cap of firms. Since the criteria for index changes are specified
unambiguously, it is easy for arbitrageurs to predict changes with a great degree of accuracy
resulting in the large temporary price effect around the effective date. It appears that it would be
in the interest of investors if these indexing companies employed a random procedure to select
some, but not all, of the firms eligible (based on current criteria) for additions or deletions.
Introducing limited subjectivity into the selection process should ensure reduced predictability as
well as a reduction in the turnover associated with index changes every year.
V.3.3. Pre-announcement of Index Changes
The third factor contributing to losses to index fund investors is the lag between
announcement of a change and its effective date. The lag is of interest only for changes that are
unpredictable, as with the S&P 500 index. Indexing companies claim that the pre-announcements
are required to “ease order imbalances” that are likely to result from large transactions initiated
by indexers. On the other hand, the lag allows arbitrageurs to step in and trade ahead of the index
funds. There is no obvious solution except to minimize this period “to the extent possible.”
V.3.4. Characteristics of Popular Indexes
The above discussion suggests that open and popular indexes that are heavily used should
use an “opaque” process of index changes without necessarily employing any pre-announcement
period. If a pre-announcement period is unavoidable, it should be as short as possible. These
characteristics are similar to Gastineau’s silent index where silence of index changes makes the
28
process completely opaque to outsiders. A popular index cannot really avoid losses to index
funds due to index arbitrage because of openness but can attempt to minimize those losses by
reducing the turnover and predictability of changes.
V.4 Recent Changes Implemented by the Frank Russell Company
In an attempt to limit arbitrage activities and to make it easier for index funds to manage
tracking error, Frank Russell Company introduced several changes to the reconstitution process.
First, effective in 2004, it changed the reconstitution day from the last trading day in June to the
last Friday in June. Second, it posted “provisional” returns for the new index for a two-week
period prior to the reconstitution. Third, it used the Nasdaq Closing Cross to price Nasdaq-listed
securities for reconstitution. Finally, it has begun adding initial public offerings every quarter
instead of only at the time of annual reconstitution.
The change from last trading day of June to the last Friday of June makes it easier for
index fund managers to more effectively manage the reconstitution from an operational
standpoint. The change has no effect on index arbitrage. Posting of provisional returns based on
the new index is informative but tracking error would remain unchanged. So, as long as index
fund managers are responsible for minimizing tracking error, the posting of provisional returns
will not impact their trading at the close on the effective day, and will, therefore, leave index
arbitrage unaffected.
The use of the Nasdaq Closing Cross is useful for fund managers in their effort to exactly
match the index. It will probably reduce the volatility in prices on the effective day. It might also
induce managers to trade at the close instead of trading throughout the day. However, it should
have no significant effect on index arbitrage. Finally, the move to quarterly IPO additions has no
effect on index arbitrage other than to spread these additions and related index arbitrage to four
known dates instead of a single known date.
29
It is true, however, that the Russell 2000 reconstitution in the year 2004 had a much
smaller impact on stocks added to the index and on stocks deleted from the index than in earlier
years. Some observers have credited the year 2004’s inconsequential reconstitution effect to the
changes instituted by Frank Russell Company, though, based on our analysis above, it may be
premature to suggest that losses to passive fund investors have ceased. Index arbitrage for the
Russell 2000 in 2005 was as significant and pervasive as in earlier years, except 2004. Thus, it is
not clear that the changes in the implementation of the reconstitution have had a significant and
permanent impact on index arbitrage.
V.5 Recommendations relating to Indexes and Index Construction
No index, nor any type of index, is a perfect solution to index arbitrage. Among these, an
open but not heavily used index is the best short term solution. Such an index is good only in the
short-term because the index can create significant costs for the index fund when the index
becomes popular. The best long-term solution is a silent index except that a silent index is not
permissible under current SEC regulations. A popular index is not a good solution for small-cap
portfolios because index changes are usually large relative to the index’s market cap. It can,
however, be acceptable for large-cap portfolios because most index changes are small and
inconsequential to the overall index return. However, fund investors indexed to popular large-cap
indexes can also suffer when large firms like Yahoo!, JDS Uniphase, Goldman Sachs, and UPS
are added to the index.
Thus, each index type has virtues but also suffers from limitations. Recognition of these
limitations and further refinement of these ideas will lead to creation of index funds that are less
subject to manipulation by market participants.
30
VI. Conclusion
The growth in the popularity of index funds is a testament to portfolio theory and the
virtues of diversification. According to Frank Russell Company, about $2,000 billion dollars in
assets were benchmarked to major indexes as of June 2003 indicating that indexes are an
important component of the financial landscape.
Investors, drawn by the broad diversification levels and low turnover rates that
characterize index mutual funds and exchange traded funds, no doubt expect the fund to be
invested in the firms constituting the index in the proper proportions at any given time. But fund
managers rewarded for performance have an incentive to assume more risk than contracted for by
their investors. To address this agency problem, fund managers implicitly or explicitly contract
to minimize the size and volatility of tracking error. Accordingly, the performance of index fund
managers is usually measured both in terms of the cost of managing the fund and its tracking
error.
In this paper, we show that index fund investors lose a significant amount due to the
predictability and timing of index changes coupled with fund managers’ objective of minimizing
tracking error. The loss to an investor in the Russell 2000 index is about 130 basis points but can
be as high as 184 basis points per year, while S&P 500 investors could lose as much as 12 basis
points per year. Consistent with the above, we find that the Russell 2000 index underperformed
other small-cap indexes by more than 3% per year in the 1995-2002 period though the
comparable indexes did not entail greater risk. Moreover, the underperformance is concentrated
in months surrounding the annual reconstitution of the index.
We suggest steps that can be taken by index fund managers, index fund investors, and
indexing companies to recoup a significant part of their losses. Managers of index funds can
minimize losses by not trading on the effective date because the price pressure is the greatest at
that time. To provide the necessary flexibility to fund managers, investors should rely on overall
31
risk and return of the portfolio for performance evaluation instead of focusing on tracking error.
Indeed, we find that the risk of funds using the strategies we outline is not greater than the risk of
the benchmark index, though the return is higher by as much as 184 basis points. Finally, small,
individual investors could protect themselves by choosing their index fund based not only on
expenses and loads but also on the likelihood of the fund being timed by arbitrageurs.
Changes by indexing companies are the most effective way of protecting fund investors
from index arbitrage because they remove the cause of loss to investors. Since advance
knowledge of changes allows arbitrageurs to time those changes, we recommend that indexing
companies reduce the predictability and knowledge of index changes as much as possible. In
addition, the turnover associated with index changes should be reduced so that both the
opportunity for arbitrage and the transactions costs associated with index changes are limited.
Indexes, other than popular indexes, can probably be better designed for limiting front
running of index funds. One example is Gastineau’s (2002, 2004) silent indexes where changes
are not announced. Without prior knowledge of index changes, arbitrageurs would not be able to
game the funds. Another example is an open index that is not heavily followed. The limited
indexing will also curtail gains to index arbitrageurs. We hope that this paper will spawn much
greater discussion of the alternatives available to index fund investors, index fund managers, and
indexing companies in minimizing losses related to index changes, thereby making index funds
even more popular.
32
References
Ammann, M., and H. Zimmerman, 2001, “Tracking Error and Tactical Asset Allocation,”
Beneish, Messod D., and Robert E. Whaley, 1996, “An anatomy of the “S&P 500 Game”: The
effects of changing the rules, Journal of Finance, 51, 1909-1930.
Biktimirov, Ernest, Arnold Cowan, and Bradford Jordan, 2004, “Do Demand Curves for Small
Stocks Slope Down.” Journal of Financial Research, 27(2).
Blume, Marshall, and Roger Edelen, 2004, “S&P 500 Indexers, Tracking error, and Liquidity: A
Complex Answer to Profiting.” Journal of Portfolio Management, 30(3), Spring, 37-47.
Chen, Honghui, Gregory Noronha, and Vijay Singal, 2004, “The Price Response to S&P 500
Index Additions and Deletions: Evidence of Asymmetry and a New Explanation”
Journal of Finance, 59(4), 1901-29.
Clarke, Roger, Scott Krase, and Meir Statman, 1994, “Tracking Errors, Regret, and Tactical Asset
Allocation,” Journal of Portfolio Management, Spring, 16-24.
Dash, Srikant, 2002, Price changes associated with S&P 500 deletions: Time variation and effect
of size and share prices, Standard & Poor’s, July 9.
Frino, Alex, David R. Gallagher, and Teddy N. Oetomo, 2005, “The Index Tracking Strategies of
Passive and Enhanced Index Equity Funds,” Australian Journal of Management,
Forthcoming.
Gardner, Grant, Andra Kondra, and Mahesh Pritamani, 2001, “Examining the Frequency of U.S.
constitution,” Research Paper, Frank Russell Company.
Gastineau, Gary, 2002. “Silence is Golden,” Journal of Indexes, 2nd quarter.
Gastineau, Gary, 2004. “The Benchmark Index ETF Performance Problem,” Journal of Portfolio
Management, Winter: 96-103.
Greenwood, Robin, 2004, “Short- and long-term demand curves for stocks: theory and evidence
on the dynamics of arbitrage,” forthcoming in the Journal of Financial Economics.
33
Harris, Lawrence, and Eitan Gurel, 1986, Price and volume effects associated with changes in the
S&P 500: New evidence for the existence of price pressures, Journal of Finance, 41,
815-830.
Hulbert, Mark, 2004, “A Quick Path to Profit, in Index Funds.” New York Times, July 4, 2004.
Jorion, Philippe, 2003, “Portfolio Optimization and Tracking Error Constraints,” Financial
Analysts Journal, September/October, 70-82.
Lynch, Anthony W. and Richard R. Mendenhall, 1997. "New Evidence On Stock Price Effects
Associated With Changes In The S&P 500 Index," Journal of Business, 70, 351-383.
Madhavan, Ananth, 2003, “The Russell Reconstitution Effect,” Financial Analysts Journal,
July/August 2003, 51-64.
Pope, Peter, and Pradeep Yadav, 1994, “Discovering Errors in Tracking Error,” Journal of
Portfolio Management, Winter , 27-32.
Quinn, Jim, 2004, “US Stock Indexes: Is There a Best Choice?” April, www.djindexes.com.
Roll, Richard, 1992, “A Mean/Variance Analysis of Tracking Error,” Journal of Portfolio
Management, Summer, 12-22.
Shleifer, Andrei, 1986, Do demand curves for stocks slope down? Journal of Finance, 41, 579-
590.
Smith, Matthew and Eric Haughton, 2003, “US Equity Index Benchmark Usage.” Frank Russell
Company, September 30. Available at www.russell.com.
34
Table 1: Return Patterns around Index Changes Panel A: Abnormal Returns Around Changes to the S&P 500 Index
Abnormal returns for changes to the S&P 500 index during the October 1989 – December
2002 period are calculated relative to S&P 500 index’s total return. CAR Anndate is the abnormal return for the first trading day following the announcement. CAR Anndate to Effdate is the cumulative abnormal return from the day following announcement to the effective day. CAR20 (and CAR60) are cumulative abnormal returns from the first trading day following announcement to 20 days (and 60 days) after the effective day. The first number in each return cell is the mean (%) and the second number is the proportion of returns that are positive. The numbers in the size cell represent the mean and median.
Sample Size
Size as of Effdate ($mil)
CAR Anndate
CAR Anndate to
Effdate
Anndate to Effdate+20 (CAR20)
Anndate to Effdate+60 (CAR60)
Additions 263 8,315 6,086
5.12*** 0.94***
8.37*** 0.91***
5.95*** 0.69***
6.36*** 0.64***
Deletions 72
498 310
-8.48*** 0.01***
-14.10*** 0.04***
-4.66 0.35**
1.52 0.46
Panel B: Abnormal Returns Around Changes to the Russell 2000 index
Abnormal returns for changes to the Russell 2000 index during the 1990-2002 period are
calculated relative to Russell 2000 index’s total return. The additions sample contains firms added to the index on June 30 and the deletions sample contains firms deleted from the index effective July 1. The first number in each return cell is the abnormal return for the value-weighted portfolio, and the second number is the abnormal return for the equally-weighted portfolio. The numbers in the size cell represent the mean and median.
Initial Sample
Final Sample
Firm Size ($ mil) June (%) July (%) August (%)
Additions 7259 7,244 369 253
3.12** 3.96**
-1.70*** -1.13*
-1.30** -0.70
Deletions 7149 4,969 415 90
-1.19 -4.46***
2.70** 2.31***
1.56 -0.24
Note: *, **, and *** indicate significance at the 10%, 5%, and 1% levels respectively.
35
Table 2: Impact from S&P 500 Index Changes Abnormal returns are calculated relative to the S&P 500 index’s total return. Anndate is the first trading day following the announcement, and Effdate is the effective date of the change. Only stocks with at least one trading day between Anndate and Effdate are considered. Change in value from Anndate through Effdate is calculated by buying the stock at the close of the day after announcement and selling it at the close on the effective day, while change in value from Effdate through Effdate+60 is calculated by buying the stock at the close of the Effdate and selling it at the close on Effdate+60. Relative size is the ratio of the added stock’s market capitalization on the effective date to the S&P 500 total market cap on the effective day. Net impact on S&P 500 returns is found by first multiplying the abnormal change in value by relative size, and then summing up all across all additions during the entire year. Reported changes in value from Anndate to Effdate (raw and adjusted) are weighted by relative size.
Note: *, **, and *** indicate significance at the 10%, 5%, and 1% levels respectively.
36
Table 3: Impact from Russell 2000 Index Changes The table below pertains to a value-weighted portfolio constructed by buying all Russell 2000 index additions at the close on the last trading day in May and selling them at the close on the last trading day in June, and a value-weighted portfolio constructed by buying all Russell 2000 index deletions at the close on the last trading day in June and selling them at the close on the last trading day in August. The abnormal return is the difference in return from this portfolio and the return from the Russell 2000 index. The abnormal return times the portfolio’s market capitalization on the effective date divided by the Russell 2000 market capitalization on the effective day is the impact on the index fund’s return, where effective day is the last trading day in June. The mean and standard deviation of time series averages of annual abnormal returns are used for assessing statistical significance.
Note: *, **, and *** indicate significance at the 10%, 5%, and 1% levels respectively.
37
Table 4: Risk and Return of Indexes The table presents a comparison of large-cap and small-cap indexes offered by Standard and Poors, Frank Russell and Co., and MSCI. Market caps are in millions of dollars and are as at the end of December 2003. Information about market caps for the Russell indexes is obtained from Quinn (2004) and for the S&P indexes from Standard and Poor’s. Information regarding the number of changes is from section II.2 (S&P 500), Gardner, et al. (Russell 1000), Table 1 (Russell 2000), Standard and Poors (S&P 600), and MSCI (MSCI 1750). Daily total return data has been obtained from the indexing companies. Annual returns are reported only for the 1995-2002 period, a period for which total returns including distributions are available. Standard deviation is calculated for each calendar year based on daily returns. The first number in each cell of Panel B is the annual return while the second number is the annualized standard deviation of that return. Panel C contains the difference in returns as measured by the fraction of months where the index return is greater than the corresponding Russell return. That is, large-cap indexes are compared with Russell 1000 whereas small-cap indexes are compared with Russell 2000. Panel A. Index Characteristics
S&P 500 Russell 1000 MSCI 300 S&P 600 Russell
2000 MSCI 1750
Basis for changes Index
committee, unpredictable
Objective and
predictable
Objective and
predictable
Index committee,
unpredictable
Objective and
predictable
Objective and
predictable Frequency of
changes any time, frequent Once a year two times
a year any time, frequent once a year two times a
year
Median Market cap 9,108 3,789 N.A. 629 469 N.A.
Highest Market cap 311,066 311,066 N.A. 4,865 2,064 N.A.
Lowest Market cap 902 489 N.A. 64 42 N.A.
Number of changes 4.6% (1977-2002)
15.4% (1983-2000) N.A. 12.9%
(1995-2002) 27.9%
(1990-2002) 21.5%
(1999-2002)
38
Panel B. Returns and Risk
S&P 500 Russell 1000
MSCI 300 S&P 600 Russell
2000 MSCI 1750
1995 37.58 7.83
37.77 7.84
38.56 7.87
29.93 9.48
28.45 8.20
31.48 8.43
1996 22.95 11.82
22.45 11.62
23.18 12.05
21.32 10.99
16.48 10.67
19.02 10.95
1997 33.36 18.16
32.85 17.16
34.60 18.16
25.58 13.84
22.36 12.99
24.34 13.26
1998 28.58 20.29
27.02 19.96
33.40 20.42
-1.30 21.12
-2.55 20.15
0.58 20.58
1999 21.04 18.08
20.91 17.67
22.95 18.67
12.41 13.33
21.26 14.23
21.94 13.88
2000 -9.12 22.22
-7.79 23.16
-13.86 24.45
11.80 26.48
-3.02 29.89
8.67 25.29
2001 -11.92 21.38
-12.45 21.85
-13.94 22.59
6.53 22.65
2.49 23.17
3.21 22.66
2002 -22.06 26.04
-21.65 25.75
-22.86 26.28
-13.50 24.67
-20.48 25.15
-18.37 23.85
Average 1995-2002
12.55 18.23
12.39 18.13
12.75 18.81
11.60 17.82
8.12 18.06
11.36 17.36
Panel C. Difference in Returns: Fraction of months where the index return is higher than the Russell return
S&P 500 MSCI 300 S&P 600 MSCI 1750
All months (1995-2002) 0.542 0.542 0.625** 0.604*
For May to August (1995-2002) 0.531 0.563 0.844*** 0.656
Months other than May to August (1995-2002)
0.547 0.531 0.516 0.578
For June and July (1995-2002) 0.563 0.688 0.938*** 0.750*
Months other than June and July (1995-2002)
0.538 0.513 0.563 0.575
Note: *, **, and *** indicate the fractions are significantly different from 0.5 at the 10%, 5%, and 1% levels respectively.
39
Table 5: Volatility estimates for index funds Panel A. S&P 500 (101989 – 122002) This panel reports the volatility of an S&P 500 index fund with trading strategies around index changes described in the text. For each day, the index fund return is enhanced by the abnormal returns earned by qualified additions and deletions in Table 2. These daily returns are then compounded to the end of month (year) to obtain the return on the index fund for the month (year). The difference between the annual index fund return and the annual S&P total return is the “Total Additional Return”. The tracking error is the sum of the absolute difference between the monthly S&P 500 return and the monthly index fund return. The last two columns report the monthly standard deviations of the S&P 500 and the index fund. All the returns, tracking errors, and standard deviations are in %.
Total S&P 500 Return
Total Additional
Return
Absolute Tracking
Error
Std. Dev. of Tracking
Error
Std. Dev. of S&P 500
Std. Dev. of Index Fund
Average of 13.25
yrs 11.296 0.141*** 0.147 0.025 4.038 4.040
Panel B. Russell 2000 (1990 – 2002) This panel reports the volatility of a Russell 2000 index fund with trading strategies around index changes described in the text. For each day, the index fund return is enhanced by the abnormal returns earned by qualified additions and deletions in Table 3. These daily returns are then compounded to the end of the month (year) to obtain the total return on the index fund for the month (year). The difference between the index fund return and the Russell 2000 return for the year is the “Total Additional Return”. The tracking error is the sum of the absolute difference between the monthly Russell 2000 return and the monthly index fund return. The last two columns report the monthly standard deviations of the Russell 2000 and the index fund. All the returns, tracking errors, and standard deviations are in %.
Russell 2000 Return
Total Additional
Return
Absolute Tracking
Error
Std. Dev. of Tracking
Error
Std. Dev. of Russell 2000
Std. Dev. of Index
Fund
Average 9.770 1.869*** 2.259 0.426 5.318 5.363
Note: *, **, and *** indicate significance at the 10%, 5%, and 1% levels respectively.