Page 1
Index of Connectedness
by
Harshitha Harapanahalli
B.Tech, Sri Venkateswara University, 2011
M.Sc., University of Victoria, 2016
A Master’s Project Submitted in Partial Fulfillment of the
Requirements for the Degree of
MASTER OF SCIENCE
in the Department of Computer Science
c© Harshitha Harapanahalli, 2016
University of Victoria
All rights reserved. This project may not be reproduced in whole or in part, by
photocopying or other means, without the permission of the author.
Page 2
ii
Index of Connectedness
by
Harshitha Harapanahalli
B.Tech, Sri Venkateswara University, 2011
M.Sc., University of Victoria, 2016
Supervisory Committee
Dr. Yvonne Coady, Supervisor
(Department of Computer Science)
Dr. Sudhakar Ganti, Departmental Member
(Department of Computer Science)
Page 3
iii
Supervisory Committee
Dr. Yvonne Coady, Supervisor
(Department of Computer Science)
Dr. Sudhakar Ganti, Departmental Member
(Department of Computer Science)
ABSTRACT
The mental and physical health of young people significantly depends on their
level of connectedness to their family, school and community. This document focuses
on the visual representation of different indicators, identified by domain specialists in
health-care, that affect the mental and physical health condition of children. Our goal
is to represent them in the form of a visual chart which gives more immediate insight
to community members (teachers, family members, youth-care representatives) to
take corrective measures and improve the quality of living in affected communities.
This project also presents an alternative, side-by side view of the data for two different
communities so as to compare between the two. It also gives the option to the user to
view the individual data of a child of particular community. Furthermore, a detailed
description of the technology involved in this project’s implementation is provided
along with proposed extensions that can be added to make this platform accessible
and usable to large number of users in future.
Page 4
iv
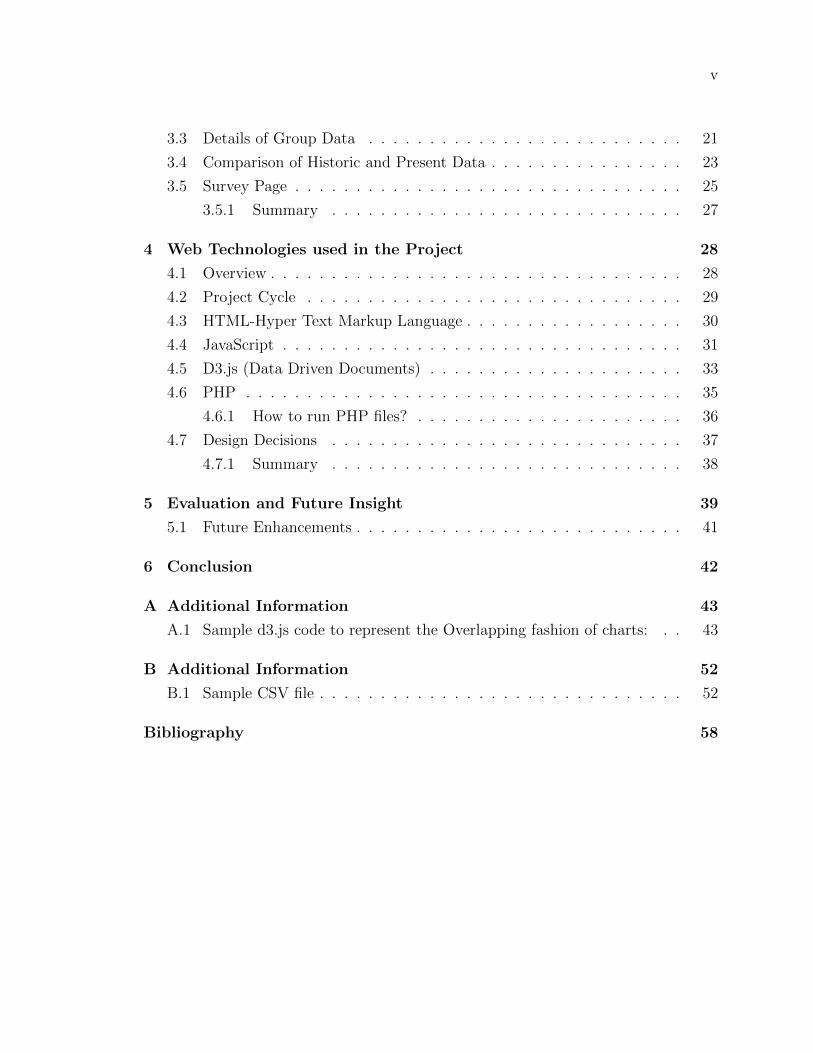
Contents
Supervisory Committee ii
Abstract iii
Table of Contents iv
List of Tables vi
List of Figures vii
Acknowledgements viii
Dedication ix
1 Introduction 1
1.1 Structure of the Project . . . . . . . . . . . . . . . . . . . . . . . . . 2
2 Background and Related Work 4
2.1 Visualization . . . . . . . . . . . . . . . . . . . . . . . . . . . . . . . 4
2.2 Connectedness . . . . . . . . . . . . . . . . . . . . . . . . . . . . . . . 5
2.3 Index of Connectedness . . . . . . . . . . . . . . . . . . . . . . . . . . 5
2.4 Details of the Project . . . . . . . . . . . . . . . . . . . . . . . . . . . 6
2.4.1 Individual Data Representation . . . . . . . . . . . . . . . . . 7
2.4.2 Group Data Representation . . . . . . . . . . . . . . . . . . . 10
2.5 Details of Radar chart . . . . . . . . . . . . . . . . . . . . . . . . . . 11
2.5.1 Summary . . . . . . . . . . . . . . . . . . . . . . . . . . . . . 16
3 Implementation Details 17
3.1 Welcome Page . . . . . . . . . . . . . . . . . . . . . . . . . . . . . . . 17
3.2 Details of Individual Data . . . . . . . . . . . . . . . . . . . . . . . . 18
Page 5
v
3.3 Details of Group Data . . . . . . . . . . . . . . . . . . . . . . . . . . 21
3.4 Comparison of Historic and Present Data . . . . . . . . . . . . . . . . 23
3.5 Survey Page . . . . . . . . . . . . . . . . . . . . . . . . . . . . . . . . 25
3.5.1 Summary . . . . . . . . . . . . . . . . . . . . . . . . . . . . . 27
4 Web Technologies used in the Project 28
4.1 Overview . . . . . . . . . . . . . . . . . . . . . . . . . . . . . . . . . . 28
4.2 Project Cycle . . . . . . . . . . . . . . . . . . . . . . . . . . . . . . . 29
4.3 HTML-Hyper Text Markup Language . . . . . . . . . . . . . . . . . . 30
4.4 JavaScript . . . . . . . . . . . . . . . . . . . . . . . . . . . . . . . . . 31
4.5 D3.js (Data Driven Documents) . . . . . . . . . . . . . . . . . . . . . 33
4.6 PHP . . . . . . . . . . . . . . . . . . . . . . . . . . . . . . . . . . . . 35
4.6.1 How to run PHP files? . . . . . . . . . . . . . . . . . . . . . . 36
4.7 Design Decisions . . . . . . . . . . . . . . . . . . . . . . . . . . . . . 37
4.7.1 Summary . . . . . . . . . . . . . . . . . . . . . . . . . . . . . 38
5 Evaluation and Future Insight 39
5.1 Future Enhancements . . . . . . . . . . . . . . . . . . . . . . . . . . . 41
6 Conclusion 42
A Additional Information 43
A.1 Sample d3.js code to represent the Overlapping fashion of charts: . . 43
B Additional Information 52
B.1 Sample CSV file . . . . . . . . . . . . . . . . . . . . . . . . . . . . . . 52
Bibliography 58
Page 6
vi
List of Tables
Table 2.1 Table showing the sample individual data stored in CSV file . . 8
Table 2.2 Table showing the sample Group Data stored in CSV file . . . . 14
Page 7
vii
List of Figures
Figure 2.1 Welcome Page . . . . . . . . . . . . . . . . . . . . . . . . . . . 7
Figure 2.2 Radar chart representing the individual data of a particular com-
munity . . . . . . . . . . . . . . . . . . . . . . . . . . . . . . . 10
Figure 2.3 Radar chart for multiple communities . . . . . . . . . . . . . . 11
Figure 2.4 Sample Code to explore Radar chart for multiple communities . 15
Figure 3.1 Welcome Page . . . . . . . . . . . . . . . . . . . . . . . . . . . 18
Figure 3.2 Overview of Individual Data Webpage . . . . . . . . . . . . . . 19
Figure 3.3 Figure recommending the user to select at least one community 20
Figure 3.4 Figure showing the Radar chart of an individual data . . . . . . 21
Figure 3.5 Figure showing the overlapping data of different communities . 22
Figure 3.6 Figure showing the side-by-side view of data of two communities 23
Figure 3.7 Option to enter the date in respective date fields . . . . . . . . 24
Figure 3.8 Figure representing the Radar charts for the given date values . 25
Figure 3.9 Survey Page . . . . . . . . . . . . . . . . . . . . . . . . . . . . . 26
Figure 3.10Data stored in text file . . . . . . . . . . . . . . . . . . . . . . . 27
Figure 4.1 Cycle representing the stages of project . . . . . . . . . . . . . 29
Figure 4.2 Sample HTML Code . . . . . . . . . . . . . . . . . . . . . . . . 31
Figure 4.3 Sample Java script code . . . . . . . . . . . . . . . . . . . . . . 33
Figure 4.4 Sample D3.js code . . . . . . . . . . . . . . . . . . . . . . . . . 35
Figure 4.5 Sample PHP code . . . . . . . . . . . . . . . . . . . . . . . . . 37
Page 8
viii
ACKNOWLEDGEMENTS
I would like to thank:
my parents, for their unconditional love and full support throughout my career.
Dr. Yvonne Coady, for mentoring, support, encouragement, and patience.
Petra Chambers-Sinclair, for raising the project idea and supporting me through-
out the implementation process.
Page 9
ix
DEDICATION
I dedicate this project report to my Professor Dr.Yvonne Coady who always
supports and encourages me.
Page 10
Chapter 1
Introduction
The future is always in the hands of young people. Healthy kids grow into strong
adults and assist in raising healthy kids, a continuous cycle of good health and life
which leads to an improved community health in the long term. The mental and
physical health condition of children depends on various factors such as their con-
nection to family, community, school and peers. The study of various indices help
us in understanding and improving the mental health condition of youth, as well as
reducing risks like self-harming behaviours, and frequent suicidal ideas. The Child
and Youth Health Network group has conducted a survey on children and collected
sample data to evaluate these factors. This project involves exhibiting the graphical
representation of the data in the form of a radar chart. Survey data related to differ-
ent communities is presented to give an insight about the community to the user. It
can help the user in understanding the community they are living in and evaluating
the possible effects of raising their children in such a community.
The project provides an opportunity to view the graphical data related to an
individual and a community. One of the features available in the project is to compare
different communities. The user is provided with an option to choose more than one
community and view the data related to the selected option. An option to view an
individual’s data in a particular community is taken into consideration. The project
has an option to compare the historic results of a particular community with the latest
data. This way of representing the data in a graphical chart helps the community
members, and government workers, to focus and work towards the improvement of a
particular child or a community. This leads to a balanced society with well-adjusted
children who in turn enhance the well-being of future children. Ideally, connectedness
begins in early childhood and continues throughout their span of life.
Page 11
2
The Child and Youth Health Network’s first 5-year campaign is scheduled to
launch in 2017 and we intend to use an “Index of Connectedness” as a strategy to [1]:
• Engage in knowledge mobilization about the importance of connectedness for
the mental health of young people.
• Engage the entire community in increasing connectedness for young people as a
way to improve their mental health and community well-being in the long-term
and
• Build additional partnerships within the network.
1.1 Structure of the Project
This section provides a map of the report and the content from each chapter is sum-
marized as follows:
Chapter 1 introduces the various factors that affect the mental health condition
of young children and describes why it is useful to raise children in a connected com-
munity. This chapter also describes the front-end development of the project and
gives an overview of how this data is useful for a user visiting this web page.
Chapter 2 explains the core technical implementation details of this project along
with the background knowledge about the various factors that affect the health con-
dition of a young child.
Chapter 3 provides the screen-shots of implementation of various functionalities
handled by this website to give a clear understanding to the reader.
Chapter 4 draws a full picture of the project, starting from presenting the raw
data into a graph, to collecting the user provided survey data. This chapter also
describes the various technologies that have been used as part of this project.
Chapter 5 includes the evaluation of the present view of “Index of connectedness”
website and also suggests the possible enhancements that can be done to this project
to make it available to large population.
Page 12
3
Chapter 6 concludes the purpose and solution of the project.
Page 13
4
Chapter 2
Background and Related Work
This chapter begins by defining the visualization and its use to the users in general. It
gives information about the Child and Youth Health Networks’ five year campaign and
describes the various connectedness factors that are necessary for raising the children
in a safe and sophisticated society. The technical details like various indicators that
are used to represent the Individual/Group data in the form of a Radar chart and
different options that are available to view the data are discussed in detail in this
section.
2.1 Visualization
Card, Mackinlay, and Shneiderman define visualization as “the use of computer-
supported, interactive, visual representations of data to amplify cognition”[9]. Visu-
alization was historically categorized into two major areas:“scientific visualization”
and “information visualization”. As stated by Tory and Moller, Visualization tax-
onomies can serve two major purposes[12]:
1. Guide users. People outside the visualization community may have trouble find-
ing conceptual elements if they are not categorized in a meaningful way. By visual
representation of data, people have better understanding of it.
2. Guide Research. Researchers need to know where their research fits into a
larger context and find people doing similar work. Also, research can sometimes be-
come more focused or progress more rapidly when we increase our appreciation and
comprehension for the field as a whole.
In this context, a more meaningful organization of current research may help us
Page 14
5
identify areas for future investigation. We believe this will motivate researchers to
think of visualization in a different way and therefore generate novel research ideas
and discussion. Information visualization is extending from research laboratories
to a growing number of commercial products (such as those from Spotfire, Inxight,
and HumanIT), additions to statistical packages (SPSS/SigmaPlot, SAS/GRAPH,
and Data Desk) and commercial development environments (e.g.ILOG JViews). The
general public is being exposed to visualizations with SmartMoney financial maps [10].
Citizens can find health information with interactive maps [6] and view real-time
highway traffic information. To make these visualization tools accessible by diverse
users regardless of their technical knowledge and personal disabilities is a challenge
for designers but is of a great use to the public[11].
2.2 Connectedness
It took 2 years of deep inquiry to realize that, to improve the mental and physical
health conditions of the young children, we need to mainly focus on their level of
connectedness to family, school and community.
The Child and Youth Health Network team has conducted a survey in different
communities and data related to the level of connectedness of the children to Family,
School, Peer, Community and culture is collected to show that it is directly linked
to improve the mental health of youth, as well as to reduce risk, including less self-
harming behaviours, and less frequent suicidal ideas. Connectedness and a sense of
belonging is also linked to increased likelihood of high school graduation and post-
secondary planning for youth. Ideally, connectedness begins in early childhood and
continues throughout one’s lifespan.
2.3 Index of Connectedness
Index of Connectedness is a tool used to represent the data related to various in-
dicators on a Radar chart and give an insight to the community members about
the mental and physical health conditions of children of a particular community and
work towards the better living conditions for children. Index of Connectedness tool
provides both the Individual and Group data related to different communities. This
tool is also helpful in comparing the data between two communities by representing
the Radar chart in a side-by-side fashion. It also makes comparisons for the different
Page 15
6
dates of a community to view the level of growth or decline between the past and
present situations. The Child and Youth Health Networks’ first 5-year campaign is
scheduled to launch in 2017 and we intend to use an ”Index of Connectedness” as a
strategy to:
• Engage in knowledge mobilization about the importance of connectedness for
the mental health of young people
• Engage the entire community in increasing connectedness for young people as a
way to improve their mental health and community well-being in the long-term
and
• Build additional partnerships within the network.
2.4 Details of the Project
Survey data of various indicators is stored in a Comma Separated Value (CSV) file.
A website is created for “Index of connectedness” which gives a graphical represen-
tation of data stored in CSV file. This information can be used to help a user, such
as a parent, to understand the type of community his/her child is being raised.
A welcome page is created, where the user is given with two choices.
1. To represent the individual child data.
2. To represent the average data of children of a particular community.
Page 16
7
Figure 2.1: Welcome Page
2.4.1 Individual Data Representation
If the user chooses this option, it provides a graphical representation of level of con-
nectedness of a particular child. This information helps community members to un-
derstand the health condition of a child in a community through developing/changing
environments and factors that may be related to depression, and protects children
from the risk of self-harming behaviours.
The user is asked to provide the First and Last name of the child to view the
data. The individual data of children is stored in a CSV file, from which the graphical
representation can be shown. A sample of data stored in CSV file is as shown in Table
2.1.
Page 17
8
FirstName
Last Name Indicator CommunityName
RollNo
Full Description ofIndicator
Value
SAM John FamilyConnect-edness1
McKenzie 1 In my home thereis a parent or an-other adult who lis-tens to me when Ihave something tosay
0.21
SAM John FamilyConnect-edness2
McKenzie 1 How much do youfeel that people inyour family under-stand you?
0.22
SAM John FamilyConnect-edness3
McKenzie 1 How much do youfeel that you andyour family havefun together?
0.23
Peter Kennedy FamilyConnect-edness1
McKenzie 2 In my home thereis a parent or an-other adult who lis-tens to me when Ihave something tosay
0.54
Peter Kennedy FamilyConnect-edness2
McKenzie 2 How much do youfeel that people inyour family under-stand you?
0.22
Peter Kennedy FamilyConnect-edness3
McKenzie 2 How much do youfeel that you andyour family havefun together?
0.98
Table 2.1: Table showing the sample individual data stored in CSV file
Page 18
9
As specified in the Table, the CSV file consists of 7 columns
1. First Name: holds the First Names of children.
2. Last Name: holds the Last Names of children.
3. Indicator: explains whether it is Family/School/Peer/Community/Cultural Con-
nectedness.
4. Community Name: refers to the community name which we are interested to
view the data.
5. Roll No: key factor used to distinguish between children with same First and
Last Names.
6. Full Description of Indicator: refers to the complete question that indicates a
particular connectedness.
7. Value: In the survey, questions are posed to a group of children in a commu-
nity and an average value for that community is collected. So, each indicator
representing a related question holds an average value.
Page 19
10
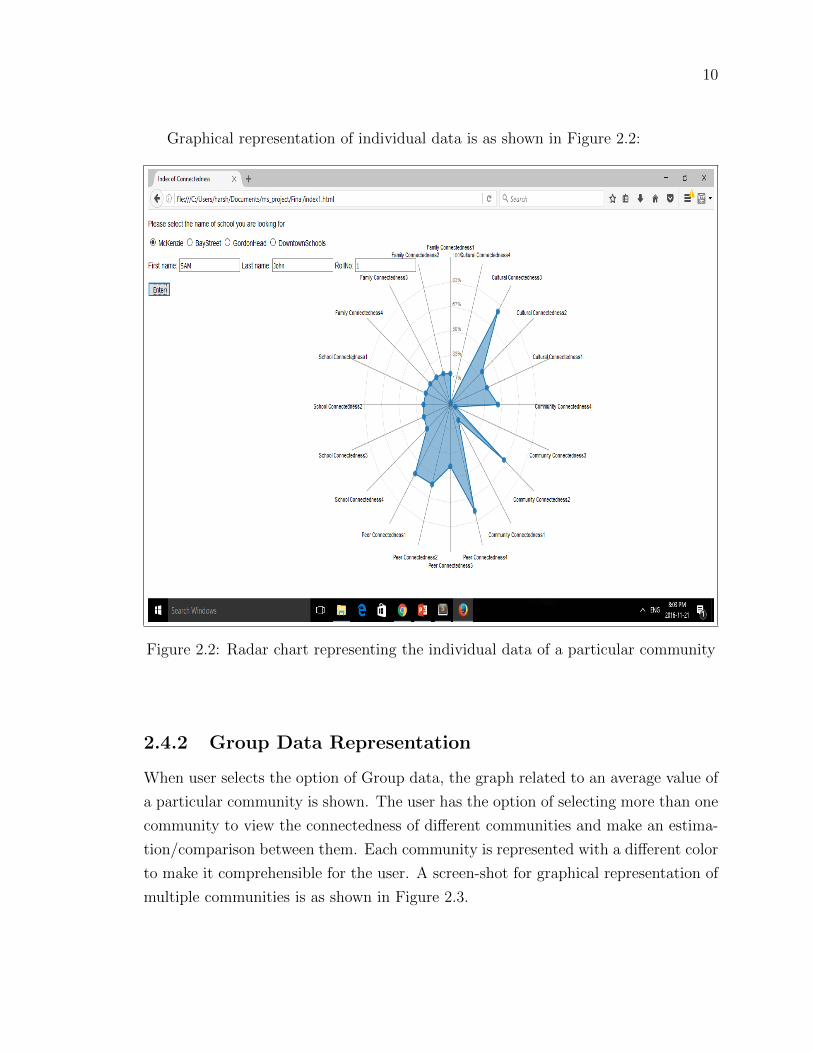
Graphical representation of individual data is as shown in Figure 2.2:
Figure 2.2: Radar chart representing the individual data of a particular community
2.4.2 Group Data Representation
When user selects the option of Group data, the graph related to an average value of
a particular community is shown. The user has the option of selecting more than one
community to view the connectedness of different communities and make an estima-
tion/comparison between them. Each community is represented with a different color
to make it comprehensible for the user. A screen-shot for graphical representation of
multiple communities is as shown in Figure 2.3.
Page 20
11
Figure 2.3: Radar chart for multiple communities
For better user experience, the option to view the graphs in a side- by-side fashion is
provided to the user.
2.5 Details of Radar chart
A Radar chart is a graphical method of displaying multivariate data in the form of
a two-dimensional chart of three or more quantitative variables represented on axes
starting from the same point [8]. There are 5 indicators namely Family, School,
Peer, Community, Culture that are used to measure the mental and physical health
condition of the children. As part of the survey, some questions related to each
indicator are questioned to the children and the results are recorded.
Page 21
12
1. Questions related to Family Connectedness:
(a) In my home there is a parent or another adult who listens to me when I
have something to say
(b) How much do you feel that people in your family understand you?
(c) How much do you feel that you and your family have fun together?
(d) If you were having a serious problem is there an adult in your family that
you would feel okay talking to?
2. Questions related to School Connectedness:
(a) At my school there is a teacher or another adult who really cares about
me?
(b) How many adults at your school care about you?
(c) I feel like I am part of this school.
(d) Number of schools a child/youth has attended in the past year
3. Questions related to Peer Connectedness:
(a) Are there safe places in your neighbourhood/community where you feel
comfortable to hang out with friends like playgrounds/parks/ or commu-
nity centres?
(b) When I am with other kids my age I feel I belong
(c) I have at least one really good friend I can talk to when something is
bothering me
(d) Ability to get along with peers
4. Questions related to Community Connectedness:
(a) In my neighbourhood/community (not from your school or family) there
is an adult who really cares about me
(b) If you were having a serious problem is there an adult who is NOT in your
family that you would feel okay talking to?
(c) I feel valued by adults in my community
Page 22
13
(d) How much do you agree or disagree with the following statement about
your neighbourhood? I know my neighbours
5. Questions related to Cultural Connectedness:
(a) Thinking about the ethnic or cultural group that you most identify with
how much do you agree or disagree with the following statement? I under-
stand pretty well what my ethnic group membership means to me
(b) I have spent time finding out more about my culture such as its history
traditions and customs
(c) I have talked to other people in order to learn more about my culture
(d) I feel a strong connection to my ancestors
The questions related to different indicators will give an overview of how the child
is feeling/living. This helps many researchers and community helpers to concentrate
on improving chosen areas and help the child to grow in a good community. As this
is an ongoing project, the estimation of Child and Youth Health Network team is to
analyse the real data over the past few years and come to and estimation for the level
of good and bad indicators. The collected data is classified accordingly to understand
the level of connectedness of a community. The data related to these indicators is
saved in a CSV file as shown in Table 2.2.
Page 23
14
Community Indicator Full Description of In-dicator
value Date
McKenzie Family Connect-edness1
In my home there isa parent or anotheradult who listens tome when I have some-thing to say
0.21 06/17/2016
McKenzie Family Connect-edness2
How much do you feelthat people in yourfamily understandyou?
0.56 06/17/2016
McKenzie Family Connect-edness3
How much do you feelthat you and yourfamily have fun to-gether?
0.73 06/17/2016
McKenzie Family Connect-edness4
If you were havinga serious problem isthere an adult in yourfamily that you wouldfeel okay talking to?
0.54 06/17/2016
Table 2.2: Table showing the sample Group Data stored in CSV file
As mentioned in the above table, the CSV file consists of 5 columns
1. Community-refers to the name of community in which we are interested to view
the data.
2. Indicator-explains whether it is Family/School/Peer/Community/Cultural Con-
nectedness.
3. Full Description of Indicator-refers to the question that belong to a particular
indicator.
4. Value-In the survey, questions are posed to a group of children in a commu-
nity and an average value for that community is collected. So, each indicator
representing a related question has an average value.
5. Date-data associated with different dates of same community.
All the above mentioned columns are reflected in our Radar chart.
Page 24
15
To represent this data on Radar chart, we have divided it into 20 axes, each repre-
senting the different questions related to five indicators. The data that is represented
on the Radar chart is taken upon a scale of 100. When you click on the tooltip of each
axis, it represents the full description of indicator and also gives the average value of
the indicator.
A link to user survey page is also provided where feedback from user is collected,
related to the website, to help the website owners in understanding how they could
improve it to have better user experience. The user feedback data is collected and
saved in a text file on submission of the data. Sample code to extract the data from
CSV file is shown in Figure 2.4.
Figure 2.4: Sample Code to explore Radar chart for multiple communities
Page 25
16
2.5.1 Summary
This chapter provides the background information necessary to understand this project.
The next chapter is an overview of the implementation details of our Connectedness
Visualization tool.
Page 26
17
Chapter 3
Implementation Details
This chapter gives the clear understanding of the usage of “Index of Connectedness”
website from a point of view of the user.
3.1 Welcome Page
The home page of the “Index of Connectedness” website is a welcome page.
In this page, the user is provided with two options.
1. To view the individual data of the children.
2. To view the group data related to a community or group of communities.
Page 27
18
Figure 3.1: Welcome Page
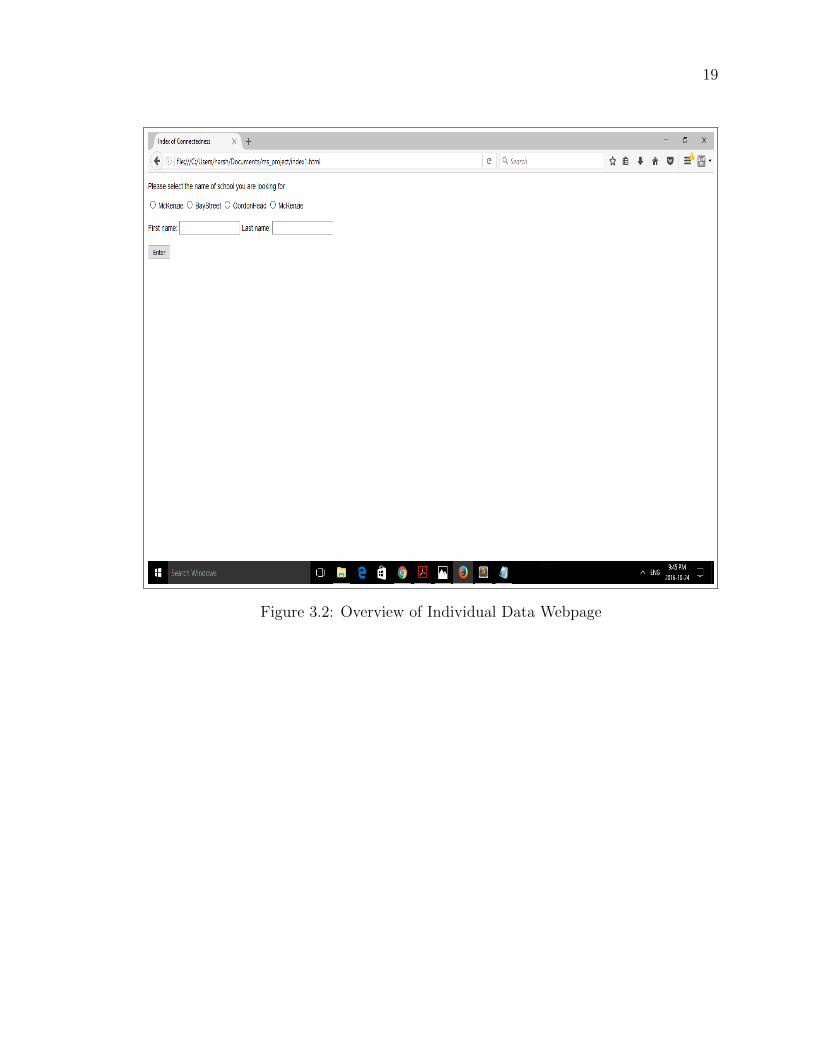
3.2 Details of Individual Data
When the user chooses the “Individual” data option, the user is suggested to choose
the community name of the child he/she is interested in.
Page 28
19
Figure 3.2: Overview of Individual Data Webpage
Page 29
20
This web page throws an error if the community is not selected.
Figure 3.3: Figure recommending the user to select at least one community
Page 30
21
After selecting the community, the First and Last name of child should be entered to
view their data.
The Radar Chart of an individual of a particular community is as shown below:
Figure 3.4: Figure showing the Radar chart of an individual data
3.3 Details of Group Data
If the user chooses the option of Group data, they must select at least one community
to view the data or else an error message is displayed on the web page. If the user
Page 31
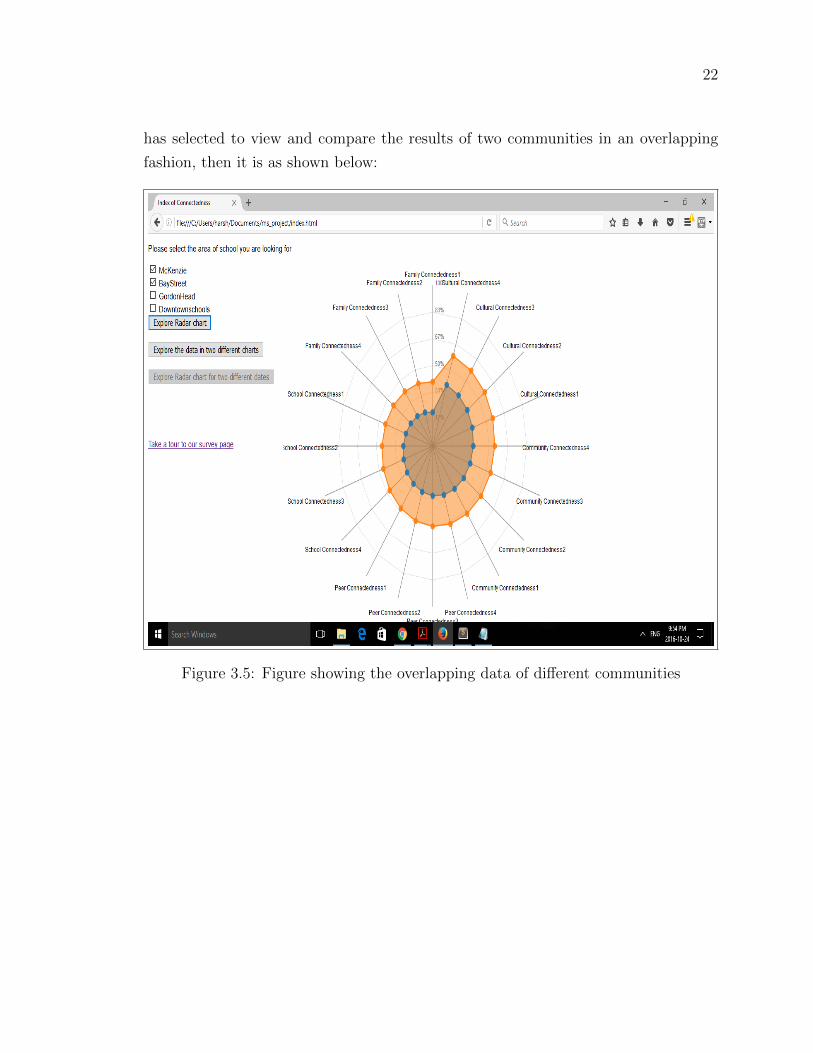
22
has selected to view and compare the results of two communities in an overlapping
fashion, then it is as shown below:
Figure 3.5: Figure showing the overlapping data of different communities
Page 32
23
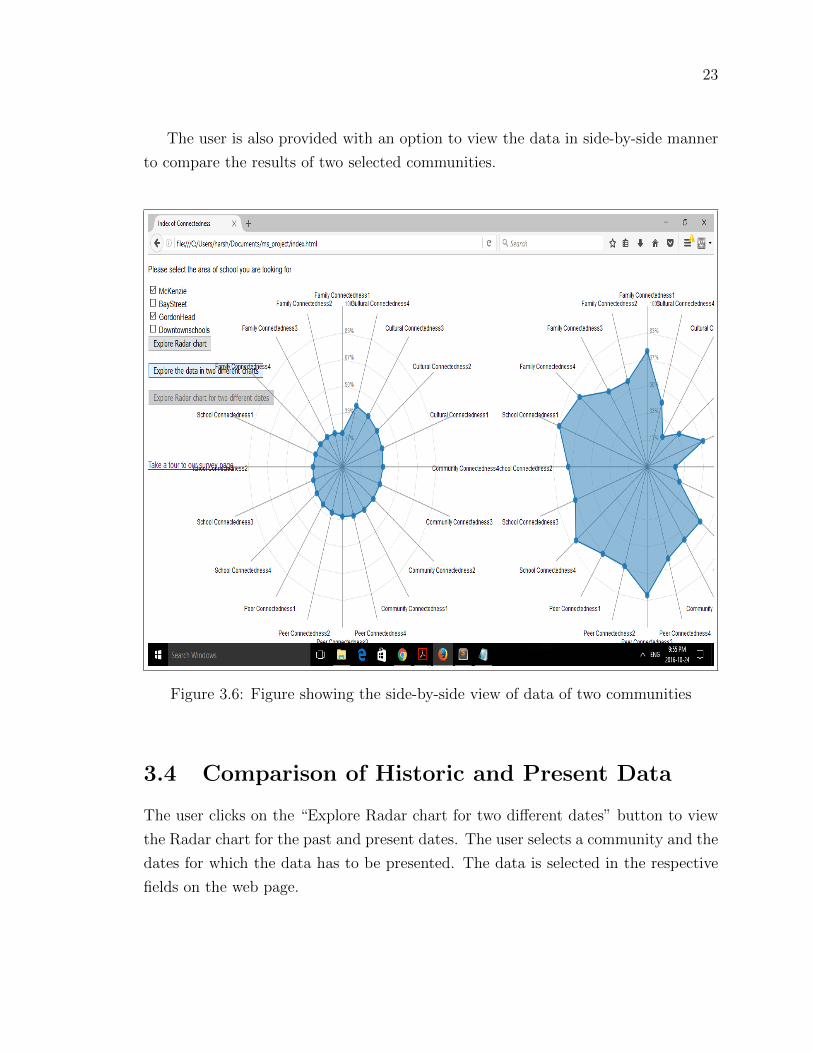
The user is also provided with an option to view the data in side-by-side manner
to compare the results of two selected communities.
Figure 3.6: Figure showing the side-by-side view of data of two communities
3.4 Comparison of Historic and Present Data
The user clicks on the “Explore Radar chart for two different dates” button to view
the Radar chart for the past and present dates. The user selects a community and the
dates for which the data has to be presented. The data is selected in the respective
fields on the web page.
Page 33
24
Figure 3.7: Option to enter the date in respective date fields
Page 34
25
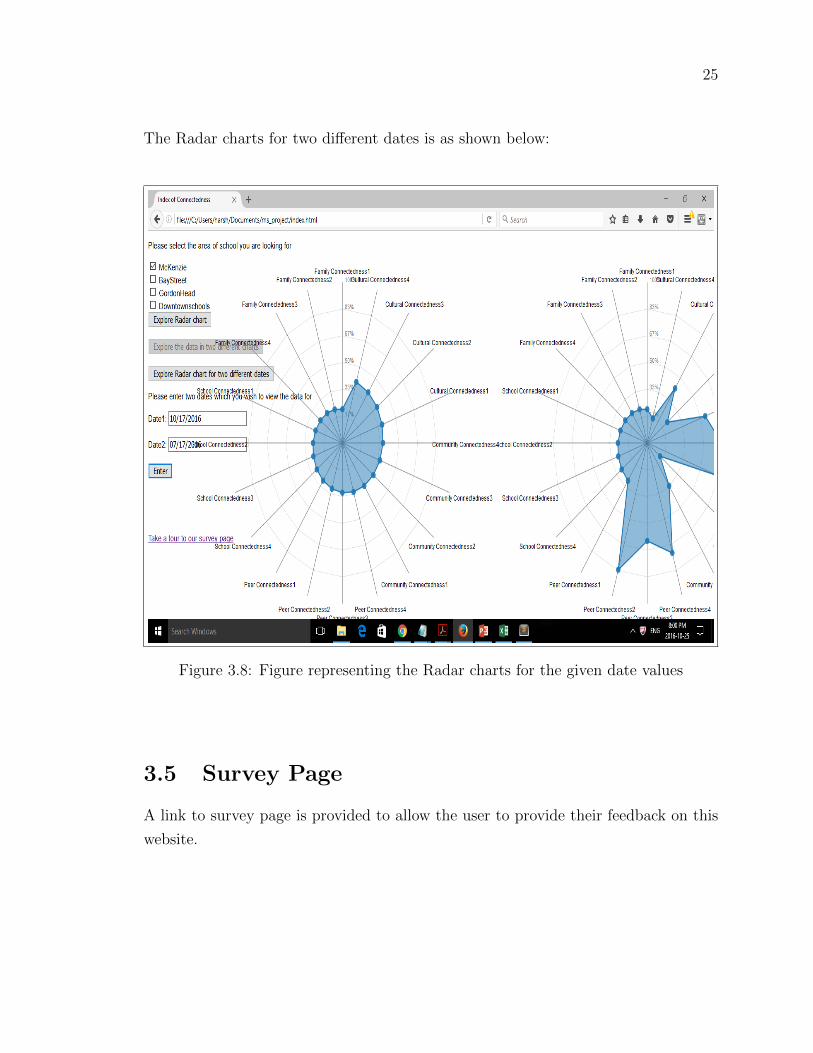
The Radar charts for two different dates is as shown below:
Figure 3.8: Figure representing the Radar charts for the given date values
3.5 Survey Page
A link to survey page is provided to allow the user to provide their feedback on this
website.
Page 35
26
Figure 3.9: Survey Page
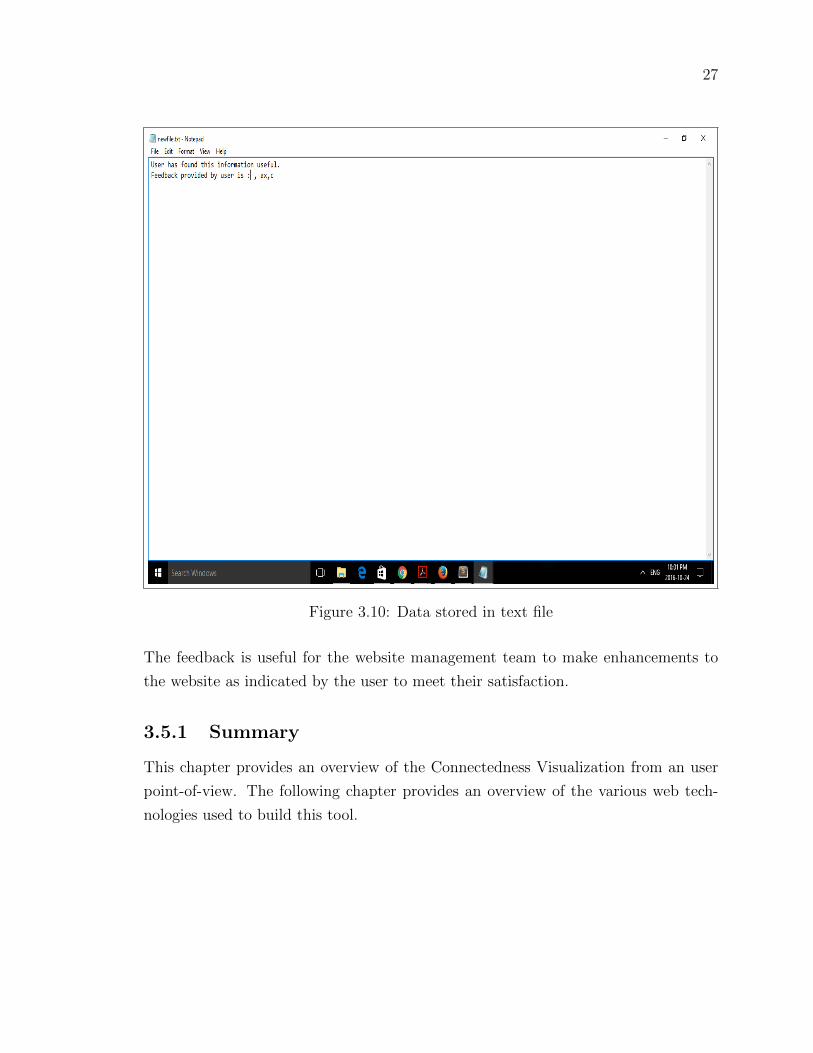
When user clicks on the submit button, the data entered by the user is stored in a
text file and saved in the back end of the system. The format of text file would be as
attached.
Page 36
27
Figure 3.10: Data stored in text file
The feedback is useful for the website management team to make enhancements to
the website as indicated by the user to meet their satisfaction.
3.5.1 Summary
This chapter provides an overview of the Connectedness Visualization from an user
point-of-view. The following chapter provides an overview of the various web tech-
nologies used to build this tool.
Page 37
28
Chapter 4
Web Technologies used in the
Project
This chapter discusses the various web technologies used in this project and gives an
overview of the implementation of the project.
4.1 Overview
As previously discussed in Chapter 1, the mental and physical health level of young
people primarily depends on their level of connectedness to their family, school and
community. Our work focuses on the different indicators that affect the mental and
physical health condition of children and represent them in the form of a chart. In
this project, raw data is collected and saved in a CSV file. The current data is just a
sample data set. A future enhancement is in pipeline to store the data in a database
to make use of the full scope of data that would be available in future. The data in
the CSV file is used to represent the information in a graphical radar chart which is
used to give an overview of the various factors that influence the physical and mental
health condition of children in a community. This helps the community members to
focus on specific areas which are inhibiting the growth of children and take a corrective
measure to provide a quality life and support the well-being of children.
In our project, a website is created to display the graphs of various indicators
of connectedness of the selected communities. This website also gives an option to
the user to view the graphs of two communities in a side-by-side manner. Individual
data of the children can also be viewed so as to pay more attention on those chil-
Page 38
29
dren who has low levels of Connectedness. An option to compare between historic
data and current data is also provided. A user feedback data is collected to provide
enhancements to the website in future according to user suggestions.
4.2 Project Cycle
Figure 4.1: Cycle representing the stages of project
The various technologies used in this project are:
1. HTML
2. JavaScript
3. d3.js (JavaScript library)
4. PHP
Page 39
30
4.3 HTML-Hyper Text Markup Language
HTML[4] is the standard markup language for creating web pages and web appli-
cations. With Cascading Style Sheets (CSS), and JavaScript, it forms a triad of
cornerstone technologies for the World Wide Web. Web browsers receive HTML doc-
uments from a webserver or from local storage and render them into multimedia web
pages. HTML describes the structure of a web page semantically and originally in-
cluded cues for the appearance of the document. HTML elements are the building
blocks of HTML pages. With HTML constructs, images and other objects, such as
interactive forms may be embedded into the rendered page. It provides a means to
create structured documents by denoting structural semantics for text such as head-
ings, paragraphs, lists, links, quotes and other items. HTML elements are delineated
by tags, written using angle brackets. Tags such as <img >and <input >introduce
content into the page directly. Others such as <p > </p >surround and provide infor-
mation about document text and may include other tags as sub-elements. Browsers
do not display the HTML tags, but use them to interpret the content of the page.
HTML can embed programs written in a scripting language such as JavaScript which
affect the behavior and content of web pages. Inclusion of CSS defines the look and
layout of content.
Page 40
31
Sample HTML code used for this project is
Figure 4.2: Sample HTML Code
4.4 JavaScript
JavaScript [5] is a high-level, dynamic, untyped and interpreted programming lan-
guage. Alongside HTML and CSS, it is one of the three core technologies of World
Wide Web content production; the majority of websites employ it and it is sup-
ported by all modern Web browsers without plug-ins. JavaScript is prototype-based
with first-class functions, making it a multi-paradigm language, supporting object-
oriented, imperative, and functional programming styles. It has an API for working
with text, arrays, dates and regular expressions, but does not include any I/O, such as
Page 41
32
networking, storage, or graphics facilities, relying for these upon the host environment
in which it is embedded.
Although there are strong outward similarities between JavaScript and Java, in-
cluding language name, syntax, and respective standard libraries, the two are distinct
languages and differ greatly in their design. JavaScript was influenced by program-
ming languages such as Self and Scheme. JavaScript is also used in environments
that are not Web-based, such as PDF documents, site-specific browsers, and desktop
widgets. Newer and faster JavaScript virtual machines (VMs) and platforms built
upon them have also increased the popularity of JavaScript for server-side Web ap-
plications. On the client side, JavaScript has been traditionally implemented as an
interpreted language, but more recent browsers perform just-in-time compilation. It
is also used in game development, the creation of desktop and mobile applications,
and server-side network programming with run-time environments such as Node.js.
Page 42
33
Sample JavaScript code used in this project is
Figure 4.3: Sample Java script code
4.5 D3.js (Data Driven Documents)
D3.js[2] is a JavaScript library for producing dynamic, interactive data visualizations
in web browsers. It makes use of the widely implemented SVG, HTML5, and CSS
standards. It is the successor to the earlier Protovis framework. In contrast to many
other libraries, D3.js allows great control over the final visual result. The webpages we
create using HTML, CSS are static. The only way for a user to interact with the web
was through clicking links and scrolling pages. There were many efforts to overcome
such limitations. One of the most significant was the integration of JavaScript as
the scripting language for web browsers. JavaScript gradually became the de facto
Page 43
34
standard language for creating web pages with rich user interactivity. This played a
crucial role in the decision to use JavaScript as the language of D3.js.
At the same time, researchers, engineers, and practitioners from various branches
of engineering and science looked for tools that would enable web browsers to visu-
ally present data within web pages. The most notable examples were the Prefuse,
Flare, and Protovis toolkits, which can all be considered as direct predecessors of
D3.js. Embedded within an HTML webpage, the JavaScript D3.js library uses pre-
built JavaScript functions to select elements, create SVG objects, style them, or add
transitions, dynamic effects or tooltips to them. These objects can also be widely
styled using CSS. Large datasets can be easily bound to SVG objects using simple
D3.js functions to generate rich text/graphic charts and diagrams. The data can be in
various formats, most commonly JSON, comma-separated values (CSV) or geoJSON,
but, if required, JavaScript functions can be written to read other data formats.
Page 44
35
Sample d3.js code that have been used in this project for displaying the Radar chart
is:
Figure 4.4: Sample D3.js code
Apart from generating charts and displaying the data, we also have an user survey
form where user inputs his feedback on the website and submits it to the web browser.
Then the survey feedback data is saved in a text file. PHP is used for storing this
submitted information.
4.6 PHP
PHP [7] is a server-side scripting language designed primarily for web development
but is also used as a general-purpose programming language. PHP originally stood
for Personal Home Page, but it now stands for the recursive acronym PHP: Hypertext
Page 45
36
Preprocessor. PHP code may be embedded into HTML code, or it can be used in
combination with various web template systems, web content management systems
and web frameworks. PHP code is usually processed by a PHP interpreter imple-
mented as a module in the web server or as a Common Gateway Interface (CGI)
executable. The web server combines the results of the interpreted and executed
PHP code, which may be any type of data, including images, with the generated web
page. PHP code may also be executed with a command-line interface (CLI) and can
be used to implement standalone graphical applications.
4.6.1 How to run PHP files?
The PHP files cannot be opened in web browser [3]. PHP files first need to be
processed in web server before sending their output to the web browser. Therefore,
before running PHP files, they should be placed inside the web folder of a web server
and then make a request to desired PHP file by typing its URL in the web browser.
If you installed a web server in your computer, usually the root of its web folder
can be accessed by typing
http://localhost in the web browser.
So, if you have placed a file called “hello.php” inside its web folder, you can run that
file by calling
http://localhost/hello.php.
In this project we haven’t hosted the website online, instead we have used XAMPP
to install the APACHE web server and the web folder is “htdocs”. PHP script is
written to send the user feedback data in a text file.
Page 46
37
Sample PHP code used for this project is:
Figure 4.5: Sample PHP code
4.7 Design Decisions
In this project, we have represented two different types of data.
1. Individual: To represent the individual data, a CSV file which contains details
like First Name, Last Name, Indicators, values etc. is used. Individual.js is the
JavaScript code used to represent this data.
2. Group: Group data is represented to address 3 requirements:
(a) Radar chart displaying the overlapping view of multiple commu-
nities: The file “RadarChart.js” is used to display the graph for multiple
communities, each with a different color.
Page 47
38
(b) Radar Chart in side-by-side fashion: This includes two requirements
i. Radar chart for comparison of two communities in side-by-side fashion
ii. Radar chart for two different dates of a particular community.
To display the chart in side-by-side fashion, we have used a single JavaScript file
called “another.js” and a single csv file called “mydata dup.csv”. The overlapping
fashion displays data for multiple communities on one axis and side-by-side fashion
displays the data on two different axes, we have used two JavaScript files to display
the data.
4.7.1 Summary
This chapter has provided an overview of the technology stack used to build the web-
based visualization for the “Index of Connectedness”. The next chapter considers our
conclusions and future insights.
Page 48
39
Chapter 5
Evaluation and Future Insight
This Chapter discusses the major contribution that are done to the “Index of Con-
nectedness” as part of this project. It includes the future enhancements that can be
done to enhance this project to make it more user friendly and available to a broad
segment of the public.
What changes are incorporated in this project?
The project gives an overview of the level of connectedness to various indicators that
affects the physical and mental health condition of children of a particular community.
This information of level of connectedness is useful to the community members to
measure the mental health conditions of children.
There are different indicators related to Family, School, Peer, Community and
Cultural connectedness that shows the direct link on the mental and physical health
condition of children. The children who are well connected to these indicators have
a less chance of pursuing self-harming behaviours such as committing suicides etc.
Research has been done to show that these factors highly influence the way that a
child is going to behave when he/she becomes an adult.
The estimated plan of Child and Youth Health Network team in measuring the
mental health conditions of children are as follows:
1. Thorough review of the literature on the subject of connectedness and mental
health in children and youth (complete).
2. Gather relevant data sources and indicators (complete).
3. Convene an expert panel to select indicators (complete).
4. Hire a researcher to analyze local data to feed into the Index (Complete).
Page 49
40
5. Convene a second expert panel to tie index to recommendations for action for
all members of our communities.
6. Develop measures to track the mental health of children and youth in the CRD.
7. Develop an instrument to fill data gaps, as required.
Data related to these different indicators is saved in a CSV file and radar chart is
generated according to the related data.
The following are the technical implementations that are done as part of this
project:
1. Created a Welcome web page for “Index of Connectedness” website.
2. On the Welcome page, the user is presented with two options:
(a) View Individual Data - to represent the radar chart of an individual (child).
(b) View Group Data - to represent the radar chart of children in a community
or group of communities.
3. If user clicks on the “Individual” option
(a) User should select a community of a particular child he/she is interested
in.
(b) First Name, Last Name and Roll No of the child should be entered.
(c) Radar chart related to the child is presented to the user.
4. If user clicks on the “Group” option
(a) User should select at least one community to view the radar chart.
(b) If user selects two or more options, he/she can view the data of all selected
communities in the same chart. Each set of data is distinguished by a
different color while representing the community in the chart so that they
can be differentiate from one and the other.
(c) If user selects two communities and click the “Explore the data in two
different graphs” option, then user can view two radar charts in the side-
by side view fashion.
Page 50
41
(d) If user selects “Explore Radar chart for two different Dates”, they can
compare the historic and present data of a particular community.
5. Option to allow the user to fill a survey form and provide his valuable feedback
about the website is provided.
5.1 Future Enhancements
The basic key components that assist in viewing the data in a graphical representation
is implemented. A few enhancements are proposed and are in pipeline to make this
project more user-friendly.
1. Database to hold the data that is currently stored in a CSV file (as of now).
2. Instead of collecting the data related to different indicators manually, there
could be an option to create a web page where the user can input the data to
related to the level of connectedness.
3. Instead of installing XAMPP on local computer and running the PHP file to
view the submitted data, this website can be hosted on a web online server to
make it available to a wide range of users connected through the Internet.
4. Cosmetic changes to improve the look and feel of the web page by adding CSS
tags.
5. For “Individual Data” option, the average data of the community should be
calculated to help the user in comparing the individual data with the average
data of the community.
Page 51
42
Chapter 6
Conclusion
The purpose of “Index of Connectedness” project is to showcase the mental and
physical health condition of children by taking various factors into consideration that
affect their growth. In some cases, a corrective measure must be taken to keep
the children in a safe environment. Research shows that connectedness to family,
community, school and peers is directly linked to improved mental health for youth,
as well as to reduced risk, including less self-harming behaviours and less frequent
suicidal ideas. Connectedness and a sense of belonging is also linked to increased
likelihood of high school graduation and post-secondary planning for youth.
A website has been created which helps the community members (parents, school
teachers, government, child care society, business owners) to have a look into the
different aspects of connectedness to the children and help them in contributing to
a sustainable life. Along with the group data representation, this project focuses on
displaying the individual data and an option to compare historic and current data
of a community. “Index of Connectedness” comprises of indicators of connectedness
rolled up into an index that can be tracked over time. Children and youth who are
connected will engage more often in healthier activities (and less often in harmful
activities) and are more likely to graduate and attend post-secondary school. This,
hopefully, will lead to an educated and improved community health in long term.
Page 52
43
Appendix A
Additional Information
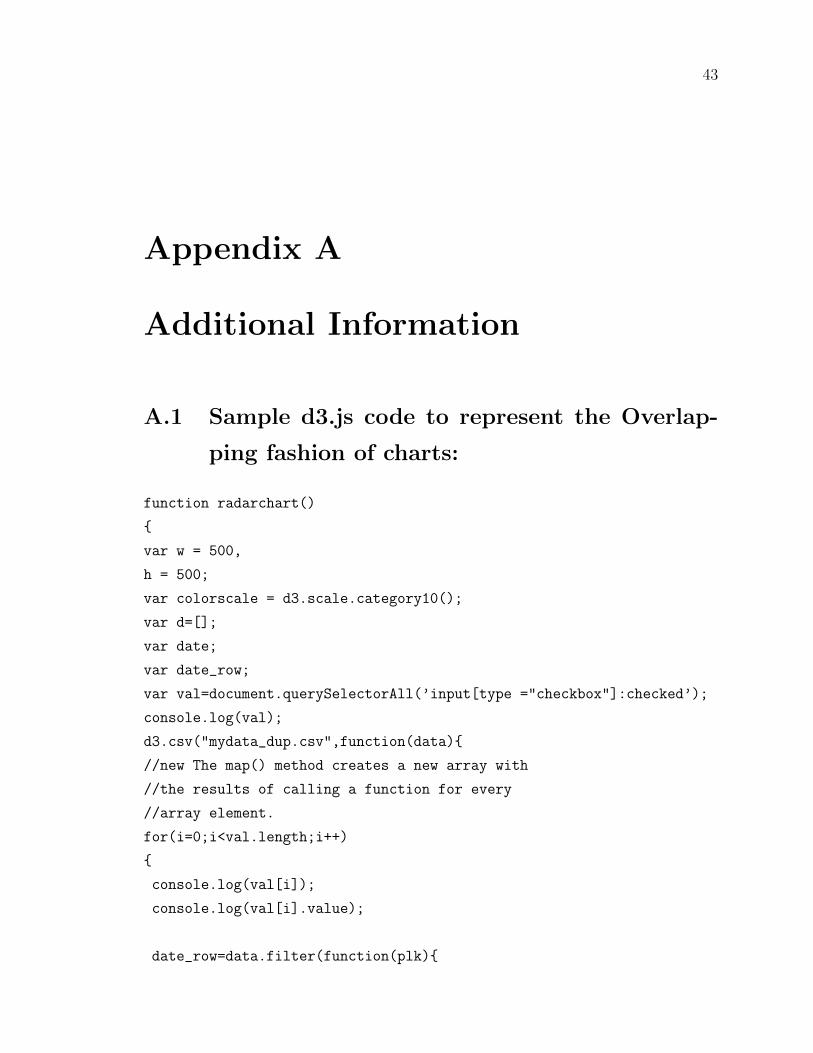
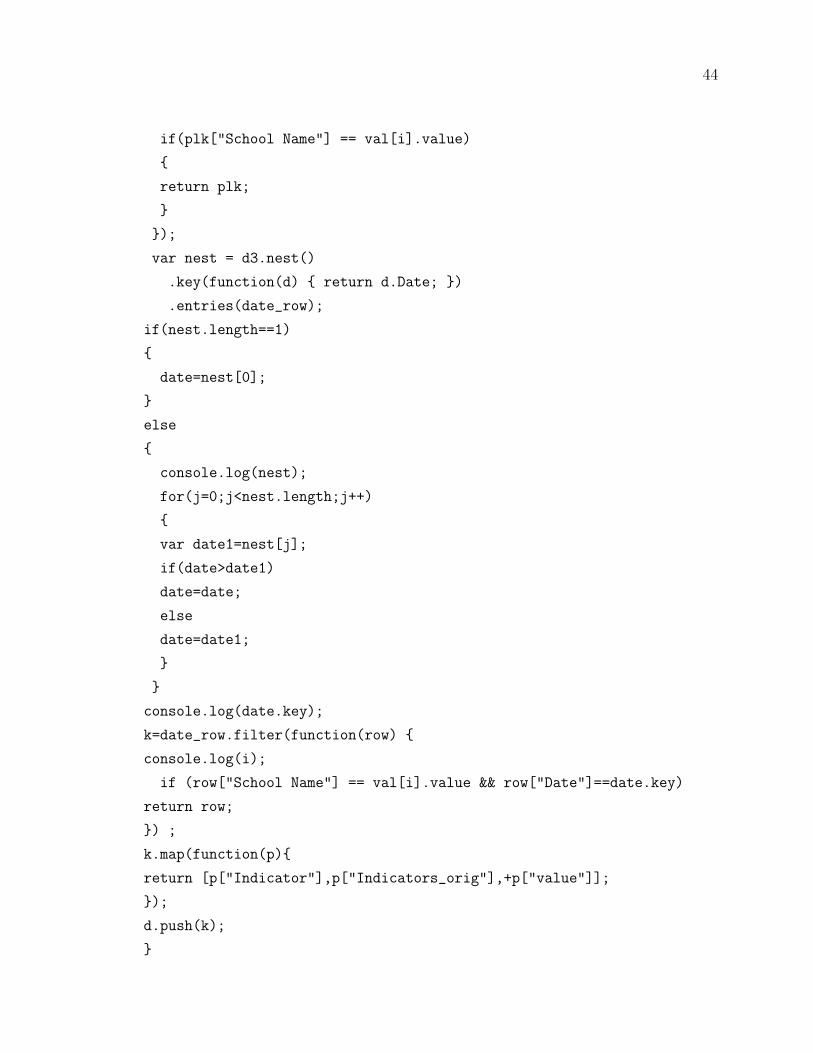
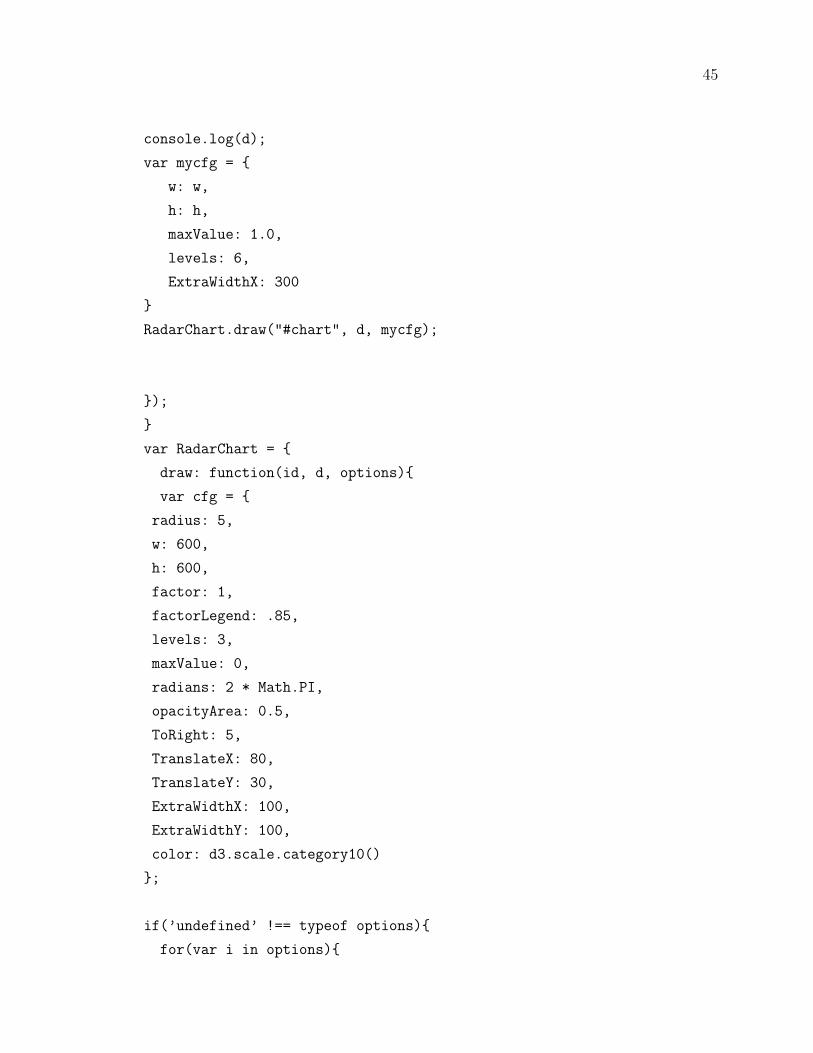
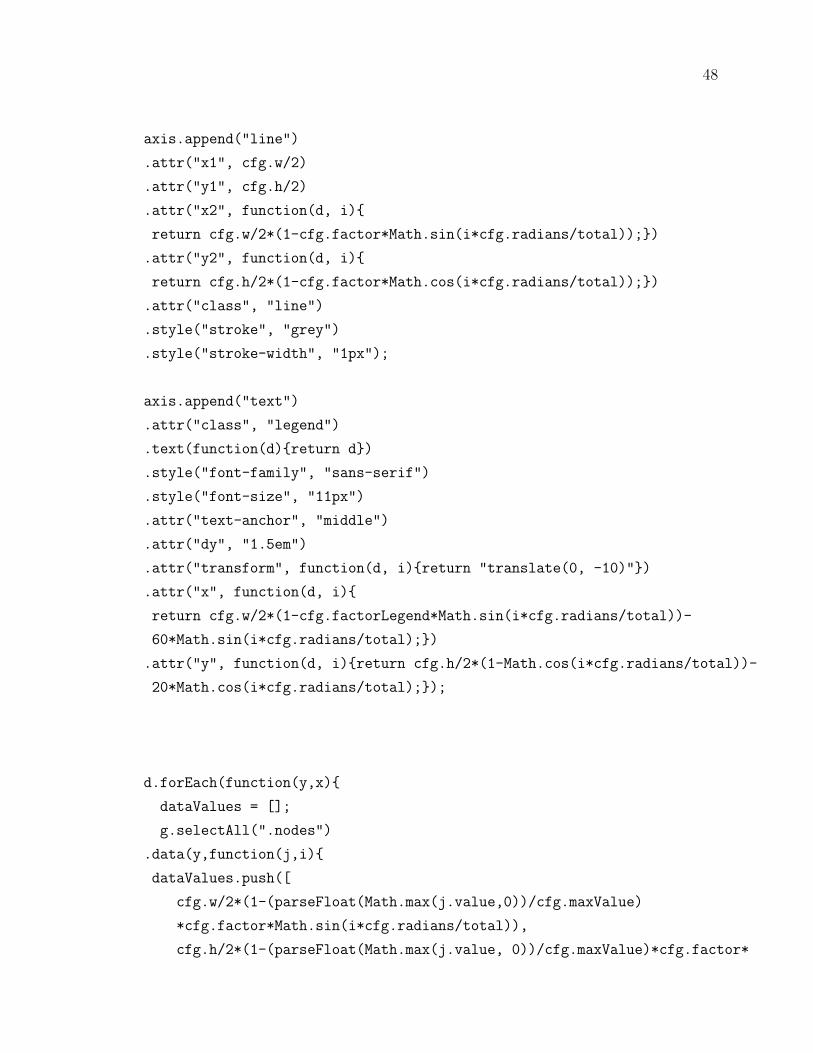
A.1 Sample d3.js code to represent the Overlap-
ping fashion of charts:
function radarchart()
{
var w = 500,
h = 500;
var colorscale = d3.scale.category10();
var d=[];
var date;
var date_row;
var val=document.querySelectorAll(’input[type ="checkbox"]:checked’);
console.log(val);
d3.csv("mydata_dup.csv",function(data){
//new The map() method creates a new array with
//the results of calling a function for every
//array element.
for(i=0;i<val.length;i++)
{
console.log(val[i]);
console.log(val[i].value);
date_row=data.filter(function(plk){
Page 53
44
if(plk["School Name"] == val[i].value)
{
return plk;
}
});
var nest = d3.nest()
.key(function(d) { return d.Date; })
.entries(date_row);
if(nest.length==1)
{
date=nest[0];
}
else
{
console.log(nest);
for(j=0;j<nest.length;j++)
{
var date1=nest[j];
if(date>date1)
date=date;
else
date=date1;
}
}
console.log(date.key);
k=date_row.filter(function(row) {
console.log(i);
if (row["School Name"] == val[i].value && row["Date"]==date.key)
return row;
}) ;
k.map(function(p){
return [p["Indicator"],p["Indicators_orig"],+p["value"]];
});
d.push(k);
}
Page 54
45
console.log(d);
var mycfg = {
w: w,
h: h,
maxValue: 1.0,
levels: 6,
ExtraWidthX: 300
}
RadarChart.draw("#chart", d, mycfg);
});
}
var RadarChart = {
draw: function(id, d, options){
var cfg = {
radius: 5,
w: 600,
h: 600,
factor: 1,
factorLegend: .85,
levels: 3,
maxValue: 0,
radians: 2 * Math.PI,
opacityArea: 0.5,
ToRight: 5,
TranslateX: 80,
TranslateY: 30,
ExtraWidthX: 100,
ExtraWidthY: 100,
color: d3.scale.category10()
};
if(’undefined’ !== typeof options){
for(var i in options){
Page 55
46
if(’undefined’ !== typeof options[i]){
cfg[i] = options[i];
}
}
}
var allAxis = (d[0].map(function(i, j){return i.Indicator}));
console.log(allAxis);
var total = allAxis.length;
var radius = cfg.factor*Math.min(cfg.w/2, cfg.h/2);
var Format = d3.format(’%’);
d3.select(id).select("svg").remove();
var g = d3.select(id)
.append("svg")
.attr("width", cfg.w+cfg.ExtraWidthX)
.attr("height", cfg.h+cfg.ExtraWidthY)
.append("g")
.attr("transform", "translate(" + cfg.TranslateX + "," + cfg.TranslateY + ")");
;
var tooltip;
for(var j=0; j<cfg.levels-1; j++){
var levelFactor = cfg.factor*radius*((j+1)/cfg.levels);
g.selectAll(".levels")
.data(allAxis)
.enter()
.append("svg:line")
.attr("x1", function(d, i){
return levelFactor*(1-cfg.factor*Math.sin(i*cfg.radians/total));})
.attr("y1", function(d, i){
return levelFactor*(1-cfg.factor*Math.cos(i*cfg.radians/total));})
.attr("x2", function(d, i){
return levelFactor*(1-cfg.factor*Math.sin((i+1)*cfg.radians/total));})
.attr("y2", function(d, i){
Page 56
47
return levelFactor*(1-cfg.factor*Math.cos((i+1)*cfg.radians/total));})
.attr("class", "line")
.style("stroke", "grey")
.style("stroke-opacity", "0.75")
.style("stroke-width", "0.3px")
.attr("transform", "translate(" + (cfg.w/2-levelFactor) +
", " + (cfg.h/2-levelFactor) + ")");
}
for(var j=0; j<cfg.levels; j++){
var levelFactor = cfg.factor*radius*((j+1)/cfg.levels);
g.selectAll(".levels")
.data([1])
.enter()
.append("svg:text")
.attr("x", function(d){return levelFactor*(1-cfg.factor*Math.sin(0));})
.attr("y", function(d){return levelFactor*(1-cfg.factor*Math.cos(0));})
.attr("class", "legend")
.style("font-family", "sans-serif")
.style("font-size", "10px")
.attr("transform", "translate(" + (cfg.w/2-levelFactor + cfg.ToRight) +
", " + (cfg.h/2-levelFactor) + ")")
.attr("fill", "#737373")
.text(Format((j+1)*cfg.maxValue/cfg.levels));
}
series = 0;
var axis = g.selectAll(".Indicator")
.data(allAxis)
.enter()
.append("g")
.attr("class", "Indicator");
Page 57
48
axis.append("line")
.attr("x1", cfg.w/2)
.attr("y1", cfg.h/2)
.attr("x2", function(d, i){
return cfg.w/2*(1-cfg.factor*Math.sin(i*cfg.radians/total));})
.attr("y2", function(d, i){
return cfg.h/2*(1-cfg.factor*Math.cos(i*cfg.radians/total));})
.attr("class", "line")
.style("stroke", "grey")
.style("stroke-width", "1px");
axis.append("text")
.attr("class", "legend")
.text(function(d){return d})
.style("font-family", "sans-serif")
.style("font-size", "11px")
.attr("text-anchor", "middle")
.attr("dy", "1.5em")
.attr("transform", function(d, i){return "translate(0, -10)"})
.attr("x", function(d, i){
return cfg.w/2*(1-cfg.factorLegend*Math.sin(i*cfg.radians/total))-
60*Math.sin(i*cfg.radians/total);})
.attr("y", function(d, i){return cfg.h/2*(1-Math.cos(i*cfg.radians/total))-
20*Math.cos(i*cfg.radians/total);});
d.forEach(function(y,x){
dataValues = [];
g.selectAll(".nodes")
.data(y,function(j,i){
dataValues.push([
cfg.w/2*(1-(parseFloat(Math.max(j.value,0))/cfg.maxValue)
*cfg.factor*Math.sin(i*cfg.radians/total)),
cfg.h/2*(1-(parseFloat(Math.max(j.value, 0))/cfg.maxValue)*cfg.factor*
Page 58
49
Math.cos(i*cfg.radians/total))
]);
});
dataValues.push(dataValues[0]);
console.log(dataValues);
g.selectAll(".area")
.data([dataValues])
.enter()
.append("polygon")
.attr("class", "radar-chart-serie"+series)
.style("stroke-width", "2px")
.style("stroke", cfg.color(series))
.attr("points",function(d) {
var str="";
for(var pti=0;pti<d.length;pti++){
str=str+d[pti]+","+d[pti]+" ";
}
return str;
})
.style("fill", function(j, i){return cfg.color(series)})
.style("fill-opacity", cfg.opacityArea)
.on(’mouseover’, function (d){
z = "polygon."+d3.select(this).attr("class");
g.selectAll("polygon")
.transition(200)
.style("fill-opacity", 0.1);
g.selectAll(z)
.transition(200)
.style("fill-opacity", .7);
})
.on(’mouseout’, function(){
g.selectAll("polygon")
.transition(200)
.style("fill-opacity", cfg.opacityArea);
});
Page 59
50
series++;
});
series=0;
d.forEach(function(y,z,x){
g.selectAll(".nodes")
.data(y).enter()
.append("svg:circle")
.attr("class", "radar-chart-serie"+series)
.attr(’r’, cfg.radius)
.attr("alt", function(j){return Math.max(j.value, 0)})
.attr("cx", function(j, i){
dataValues.push([
cfg.w/2*(1-(parseFloat(Math.max(j.value, 0))/cfg.maxValue)*cfg.factor*
Math.sin(i*cfg.radians/total)),
cfg.h/2*(1-(parseFloat(Math.max(j.value, 0))/cfg.maxValue)*cfg.factor*
Math.cos(i*cfg.radians/total))
]);
return cfg.w/2*(1-(Math.max(j.value,0)
/cfg.maxValue)*cfg.factor*Math.sin(i*cfg.radians/total));
})
.attr("cy", function(j, i){
return cfg.h/2*(1-(Math.max(j.value, 0)/cfg.maxValue)*cfg.factor*
Math.cos(i*cfg.radians/total));
})
.attr("data-id", function(j){return j.axis})
.style("fill", cfg.color(series)).style("fill-opacity", .9)
.on(’mouseover’, function (d){
newX = parseFloat(d3.select(this).attr(’cx’)) - 10;
newY = parseFloat(d3.select(this).attr(’cy’)) - 5;
tooltip
.attr(’x’, newX)
.attr(’y’, newY)
Page 60
51
.text(Format(d.value))
.text(d.Indicators_orig)
.transition(200)
.style(’opacity’, 1);
z = "polygon."+d3.select(this).attr("class");
g.selectAll("polygon")
.transition(200)
.style("fill-opacity", 0.1);
g.selectAll(z)
.transition(200)
.style("fill-opacity", .7);
})
.on(’mouseout’, function(){
tooltip
.transition(200)
.style(’opacity’, 0);
g.selectAll("polygon")
.transition(200)
.style("fill-opacity", cfg.opacityArea);
})
.append("svg:title")
.text(function(j){return Math.max(j.value, 0)});
series++;
});
tooltip = g.append(’text’)
.style(’opacity’, 0)
.style(’font-family’, ’sans-serif’)
.style(’font-size’, ’13px’);
}
};
Page 61
52
Appendix B
Additional Information
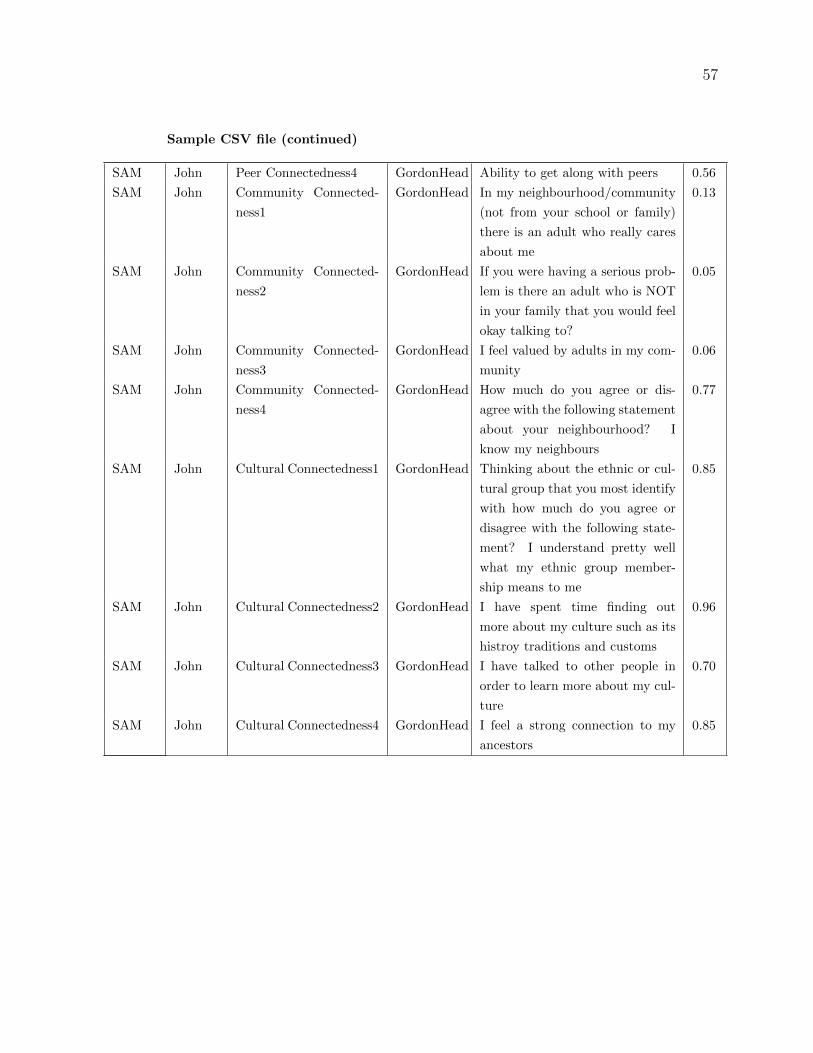
B.1 Sample CSV file
Given below is the sample CSV file that is used to generate the Radar chart
First
Name
Last
Name
Indicator Community
Name
Full Description of Indicator Value
SAM John Family Connectedness1 McKenzie In my home there is a parent or
another adult who listens to me
when I have something to say
0.21
SAM John Family Connectedness2 McKenzie How much do you feel that people
in your family understand you?
0.22
SAM John Family Connectedness3 McKenzie How much do you feel that you
and your family have fun to-
gether?
0.23
SAM John Family Connectedness4 McKenzie If you were having a serious prob-
lem is there an adult in your fam-
ily that you would feel okay talk-
ing to?
0.24
SAM John School Connectedness1 McKenzie At my school there is a teacher
or another adult who really cares
about me
0.25
SAM John School Connectedness2 McKenzie How many adults at your school
care about you?
0.26
SAM John School Connectedness3 McKenzie I feel like I am part of this school 0.27
Page 62
53
Sample CSV file (continued)
SAM John School Connectedness4 McKenzie No.of schools a child/youth has at-
tended in the past year
0.28
SAM John Peer Connectedness1 McKenzie Are there safe places in your
neighbourhood/community where
you feel comfortable to hang
out with friends like play-
grounds/parks/ or community
centres?
0.58
SAM John Peer Connectedness2 McKenzie When I am with other kids my age
I feel I belong
0.57
SAM John Peer Connectedness3 McKenzie I have at least one really good
friend I can talk to when some-
thing is bothering me
0.42
SAM John Peer Connectedness4 McKenzie Ability to get along with peers 0.76
SAM John Community Connected-
ness1
McKenzie In my neighbourhood/community
(not from your school or family)
there is an adult who really cares
about me
0.13
SAM John Community Connected-
ness2
McKenzie If you were having a serious prob-
lem is there an adult who is NOT
in your family that you would feel
okay talking to?
0.64
SAM John Community Connected-
ness3
McKenzie I feel valued by adults in my com-
munity
0.05
Page 63
54
Sample CSV file (continued)
SAM John Community Connected-
ness4
McKenzie How much do you agree or dis-
agree with the following statement
about your neighbourhood? I
know my neighbours
0.46
SAM John Cultural Connectedness1 McKenzie Thinking about the ethnic or cul-
tural group that you most identify
with how much do you agree or
disagree with the following state-
ment? I understand pretty well
what my ethnic group member-
ship means to me
0.37
SAM John Cultural Connectedness2 McKenzie I have spent time finding out more
about my culture such as its his-
tory traditions and customs
0.38
SAM John Cultural Connectedness3 McKenzie I have talked to other people in
order to learn more about my cul-
ture
0.78
SAM John Cultural Connectedness4 McKenzie I feel a strong connection to my
ancestors
0.01
PETER Kennedy Family Connectedness1 BayStreet In my home there is a parent or
another adult who listens to me
when I have something to say
0.99
PETER Kennedy Family Connectedness2 BayStreet How much do you feel that people
in your family understand you?
0.02
PETER Kennedy Family Connectedness3 BayStreet How much do you feel that you
and your family have fun to-
gether?
0.42
PETER Kennedy Family Connectedness4 BayStreet If you were having a serious prob-
lem is there an adult in your fam-
ily that you would feel okay talk-
ing to?
0.03
PETER Kennedy School Connectedness1 BayStreet At my school there is a teacher
or another adult who really cares
about me
0.44
PETER Kennedy School Connectedness2 BayStreet How many adults at your school
care about you?
0.05
Page 64
55
Sample CSV file (continued)
PETER Kennedy School Connectedness3 BayStreet I feel like I am part of this school 0.06
PETER Kennedy School Connectedness4 BayStreet No.of schools a child/youth has at-
tended in the past year
0.47
PETER Kennedy Peer Connectedness1 BayStreet Are there safe places in your
neighbourhood/community where
you feel comfortable to hang
out with friends like play-
grounds/parks/ or community
centres?
0.48
PETER Kennedy Peer Connectedness2 BayStreet When I am with other kids my age
I feel I belong
0.49
PETER Kennedy Peer Connectedness3 BayStreet I have at least one really good
friend I can talk to when some-
thing is bothering me
0.50
PETER Kennedy Peer Connectedness4 BayStreet Ability to get along with peers 0.51
PETER Kennedy Community Connected-
ness1
BayStreet In my neighbourhood/community
(not from your school or family)
there is an adult who really cares
about me
0.52
PETER Kennedy Community Connected-
ness2
BayStreet If you were having a serious prob-
lem is there an adult who is NOT
in your family that you would feel
okay talking to?
0.53
PETER Kennedy Community Connected-
ness3
BayStreet I feel valued by adults in my com-
munity
0.54
PETER Kennedy Community Connected-
ness4
BayStreet How much do you agree or dis-
agree with the following statement
about your neighbourhood? I
know my neighbours
0.55
PETER Kennedy Cultural Connectedness1 BayStreet Thinking about the ethnic or cul-
tural group that you most identify
with how much do you agree or
disagree with the following state-
ment? I understand pretty well
what my ethnic group member-
ship means to me
0.56
Page 65
56
Sample CSV file (continued)
PETER Kennedy Cultural Connectedness2 BayStreet I have spent time finding out
more about my culture such as its
histroy traditions and customs
0.57
PETER Kennedy Cultural Connectedness3 BayStreet I have talked to other people in
order to learn more about my cul-
ture
0.58
PETER Kennedy Cultural Connectedness4 BayStreet I feel a strong connection to my
ancestors
0.59
SAM John Family Connectedness1 GordonHead In my home there is a parent or
another adult who listens to me
when I have something to say
0.05
SAM John Family Connectedness2 GordonHead How much do you feel that people
in your family understand you?
0.64
SAM John Family Connectedness3 GordonHead How much do you feel that you
and your family have fun to-
gether?
0.05
SAM John Family Connectedness4 GordonHead If you were having a serious prob-
lem is there an adult in your fam-
ily that you would feel okay talk-
ing to?
0.24
SAM John School Connectedness1 GordonHead At my school there is a teacher
or another adult who really cares
about me
0.91
SAM John School Connectedness2 GordonHead How many adults at your school
care about you?
0.84
SAM John School Connectedness3 GordonHead I feel like I am part of this school 0.95
SAM John School Connectedness4 GordonHead No.of schools a child/youth has at-
tended in the past year
0.12
SAM John Peer Connectedness1 GordonHead Are there safe places in your
neighbourhood/community where
you feel comfortable to hang
out with friends like play-
grounds/parks/ or community
centres?
0.01
SAM John Peer Connectedness2 GordonHead When I am with other kids my age
I feel I belong
0.02
SAM John Peer Connectedness3 GordonHead I have at least one really good
friend I can talk to when some-
thing is bothering me
0.03
Page 66
57
Sample CSV file (continued)
SAM John Peer Connectedness4 GordonHead Ability to get along with peers 0.56
SAM John Community Connected-
ness1
GordonHead In my neighbourhood/community
(not from your school or family)
there is an adult who really cares
about me
0.13
SAM John Community Connected-
ness2
GordonHead If you were having a serious prob-
lem is there an adult who is NOT
in your family that you would feel
okay talking to?
0.05
SAM John Community Connected-
ness3
GordonHead I feel valued by adults in my com-
munity
0.06
SAM John Community Connected-
ness4
GordonHead How much do you agree or dis-
agree with the following statement
about your neighbourhood? I
know my neighbours
0.77
SAM John Cultural Connectedness1 GordonHead Thinking about the ethnic or cul-
tural group that you most identify
with how much do you agree or
disagree with the following state-
ment? I understand pretty well
what my ethnic group member-
ship means to me
0.85
SAM John Cultural Connectedness2 GordonHead I have spent time finding out
more about my culture such as its
histroy traditions and customs
0.96
SAM John Cultural Connectedness3 GordonHead I have talked to other people in
order to learn more about my cul-
ture
0.70
SAM John Cultural Connectedness4 GordonHead I feel a strong connection to my
ancestors
0.85
Page 67
58
Bibliography
[1] Child and youth health network. https://childyouthhealth.org (Visited on 2016-12-24).
[2] Data driven documents-javascript library. https://d3js.org/ (Visited on 2016-12-24).
[3] How to run php files. http://www.tutorialspoint.com/articles/run-a-php-program-in-xampp-
server (Visited on 2016-12-24).
[4] Html tutorial. http://www.w3schools.com/html/ (Visited on 2016-12-24).
[5] Javascript tutorial. http://www.w3schools.com/js/default.asp (Visited on 2016-12-24).
[6] National cancer institute cancer mortality maps and graphs. https://ratecalc.cancer.gov/. (Vis-
ited on 2016-12-24).
[7] Php tutorial. http://www.w3schools.com/php/default.asp (Visited on 2016-12-24).
[8] Radarchart. http://www.fusioncharts.com/chart-primers/radar-chart/ (Visited on 2016-12-24).
[9] S.K. Card, J. Mackinlay and B. Shneiderman. Readings in Information Visualization: Using
Vision to Think. Morgan Kaufmann Publishers, San Francisco, 1999.
[10] C. Plaisant. The challenge of information visualization evaluation. In Proceedings of Advanced
Visual Interfaces, pages 109-116, 2004.
[11] C. Plaisant. Information visualization and the challenge of universal access, in Exploring Geo-
visualization. Elsevier Publishers, Oxford, 2004.
[12] M. Tory and T. Moller. Rethinking visualizations: A high-level taxonomy. In Proceedings of
IEEE Infovis, pages 151-158, 2004.


![Financial and Macroeconomic Connectedness [Dr.soc]](https://static.documents.pub/doc/80x56/577c7c781a28abe0549ab7a8/financial-and-macroeconomic-connectedness-drsoc.jpg)


