25
INDEXATION OF MBS REBATES FOR GP CONSULTATION ITEMS REPORT BY ACCESS ECONOMICS PTY LIMITED FOR THE AUSTRALIAN MEDICAL ASSOCIATION JUNE 2004
INDEXATION OF MBS REBATES FOR GP
CONSULTATION ITEMS
REPORT BY ACCESS ECONOMICS PTY LIMITED
FOR
THE AUSTRALIAN MEDICAL ASSOCIATION
JUNE 2004
Indexation of MBS Rebates for GP Consultation Items
While every effort has been made to ensure the accuracy of this document, the uncertain nature of economic data, forecasting and analysis means that Access Economics Pty Limited is unable to make any warranties in
TABLE OF CONTENTS
EXECUTIVE SUMMARY _____________________________________________________i 1 BACKGROUND _______________________________________________________ 1 2 DEFINITIONAL ISSUES _________________________________________________ 3 3 ALTERNATIVE INDICES ________________________________________________ 4
3.1 Historical WCI5-based trends _______________________________________________ 4 3.2 AWE/AWOTE/WCI _______________________________________________________ 6 3.3 CPI ___________________________________________________________________ 8 3.4 AMA MFI_______________________________________________________________ 9 3.5 RDA NSW_____________________________________________________________ 12
4 COMPARISONS ______________________________________________________ 14 4.1 Trends in index changes__________________________________________________ 14 4.2 Absolute dollar differences ________________________________________________ 15
5 CRUCIAL ISSUES ____________________________________________________ 17 5.1 Connecting to a policy framework___________________________________________ 17 5.2 Adjusting for productivity gains _____________________________________________ 18
Appendix A: References__________________________________________________ 20 Appendix B: Acronyms___________________________________________________ 21 LIST OF FIGURES
Figure 1: Real MBS Item 23 rebate____________________________________________ 1 Figure 2: Average annual Federal spend per FTE GP, relative to AWOTE _____________ 8 Figure 3: Comparison of indices, 1995-96 to 2003-04 ____________________________ 14 LIST OF TABLES
Table 1: WCI5 and actual MBS item 23 changes 1 Nov 1992 to 1 Nov 2003____________ 5 Table 2: WCI5 and ACTUAL MBS ITEMS 1992-93 to 2003-04 _______________________ 6 Table 3: AWE, AWOTE and WCI changes 1992-93 to 2003-04 ______________________ 7 Table 4: CPI (headline and underlying) changes 1992-93 to 2003-04 _________________ 9 Table 5: AMA Medical Fees Index changes 1 Nov 1993 to 1 Nov 2003 _______________ 11 Table 6: AMA Medical Fees Index Changes 1992-93 to 2003-04 ____________________ 12 Table 7: RDA NSW Settlement Package Index changes 1993-94 to 2003-04 __________ 13 Table 8: Comparison of indices, 1995-96 to 2003-04 _____________________________ 14 Table 9: Comparison of GP rebate costs under different indices, 1996-2003, $m _______ 15
relation to the information contained herein. Access Economics Pty Limited, its employees and agents disclaim liability for any loss or damage which may arise as a consequence of any person relying on the information contained in this document.
Indexation of MBS Rebates for GP Consultation Items
i
EXECUTIVE SUMMARY Indexation of MBS rebates has been a source of controversy between public policy makers and GP groups for at least 15 years. Capricious changes in both the rates of indexation and the indexation arrangements have created considerable uncertainty and instability. Since the mid-1990s, the reference index for MBS fees and rebates has been the Department of Finance and Administration’s (DoFA’s) Wage Cost Index 5 (WCI5). However, the relationship between WCI5 and MBS fees for GP consultation items is somewhat erratic:
□□ Between 1993 and 1997, the Government pursued a policy of half-indexation of GP rebates on the basis that GPs were receiving alternative funding through the blended payments system;
□□ In November 1996, all MBS fees were frozen at the levels of 1 November 1995;
□□ Attempts have been made to address particular problem areas (the stand-out example being the 54% increase in rebates for after-hours attendances in 1 November 2001); and
□□ More generally, from time to time rebates have been increased by more than WCI5 in an attempt to stem the decline in bulk-billing (notably the 6.5% increase in GP items rebates, also in 2001).
The swings and roundabouts in fee setting in turn reflects swings and roundabouts in policy which sometimes emphasises equity and access and at other times budgetary constraints. Over the longer term, the practical effect of the WCI5 indexation is to force GPs to charge increasing patient gaps to avoid erosion of their incomes and/or a deterioration in the quality of the service they provide. In conducting this evaluation of the indexation arrangements, we modelled the outcomes for rebates paid to patients under a number of different indexation scenarios. Over the period 1995 to 2003, we found that:
□□ In the broad, actual increases in MBS fees for GP consultation items (average 2.7% p.a.) track only slightly ahead of headline inflation (average 2.4% p.a.) but further ahead of WCI5 (average 2.0% p.a.). In other words, WCI5 has not been a sustainable reference index for GP rebates;
□□ Other indices, which arguably better reflect the costs that GPs face and the income aspirations that GPs have, have increased rather faster over the period: Average Weekly Earnings (AWE) 4.2% p.a., Average Weekly Ordinary Time Earnings (AWOTE) 4.5% p.a., the Rural Doctors’ Association of New South Wales Settlement Package (RDA NSW SP) index 4.6% p.a. and the AMA medical fees index (MFI) for non-procedural GP items 5.4% p.a.;
□□ Had these alternative indices applied over the period 1995 to 2003, there would have been a cumulative effect on MBS rebates:
o AWE would have produced rebates higher by $1.5b over the seven years (and $275m higher in 2002-03);
o AWOTE would have produced rebates higher by $1.75b over the seven years (and $324m higher in 2002-03);
Indexation of MBS Rebates for GP Consultation Items
ii
o The RDA NSW SP indexation method would have produced rebates higher by $1.9b over the seven years (and $365m higher in 2002-03); while
o The AMA MFI would have produced rebates higher by $2.0b over the seven years (and $604m higher in 2002-03).
□□ Reflecting its construction, the AMA’s MFI usually occupies the “middle ground”, in most years returning an increase which is a little below AWE and AWOTE. The RDA NSW SP Index is constructed on a similar basis to the AMA MFI but with a higher weighting for indemnity and including procedural indemnity cover.
□□ In the case of both the AMA MFI and the RDA NSW SP there were point-in-time adjustments over and above the usual indexation. In 2001, most AMA GP fees were not indexed by the MFI. Rather, they were reset from first principles using the methodology and the information of the Relative Value Study. This produced quite large percentage increases, for example, the fee for AMA item AA020 (Level B service at consulting rooms) increased by 19.8% from $40.50 in 2000 to $48.50 in 2001. The NSW Government applied a further 10% indexation to all aspects of the RDA NSW SP index, as from 1 January 2002, to offset the impact of shifting medical indemnity into a component of practice costs indexed by the CPI. The same 10% was indexed into all AMA NSW sessional awards, including non-procedural.
□□ Circumstantial evidence suggests that in the absence of the RDA NSW SP index, it would have been rather harder to attract and retain adequate numbers of GPs in rural areas.
Indexation of MBS Rebates for GP Consultation Items
1
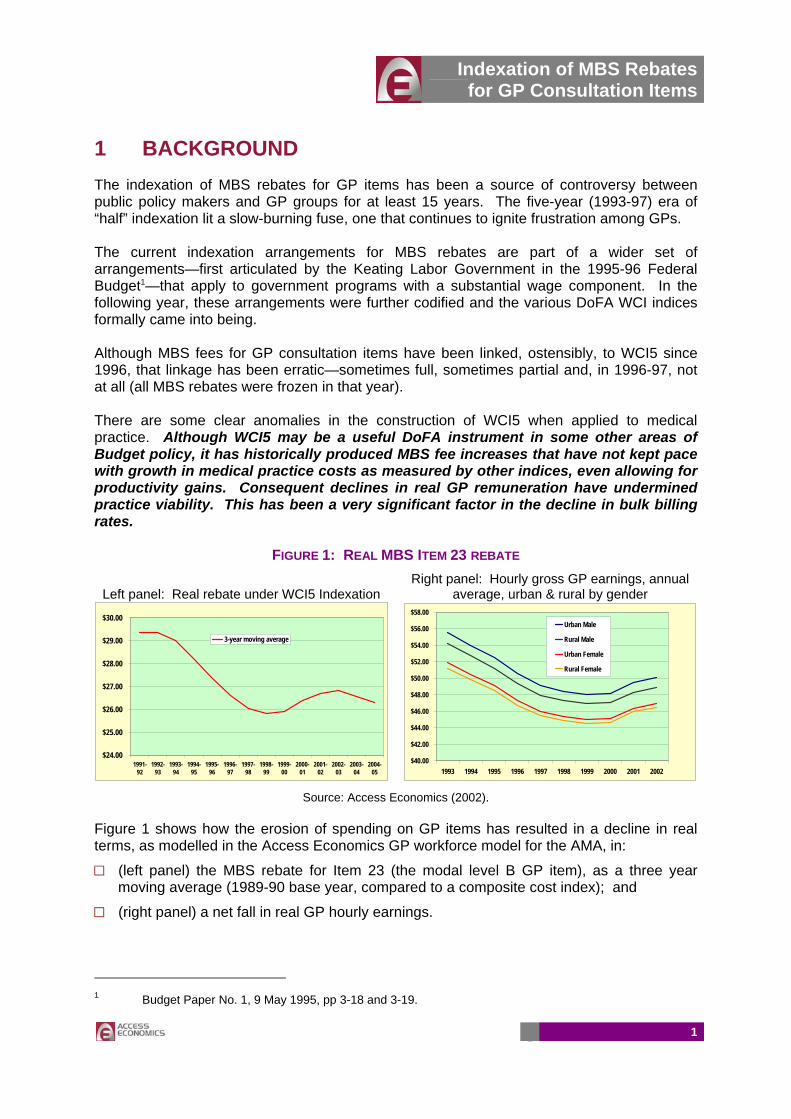
1 BACKGROUND The indexation of MBS rebates for GP items has been a source of controversy between public policy makers and GP groups for at least 15 years. The five-year (1993-97) era of “half” indexation lit a slow-burning fuse, one that continues to ignite frustration among GPs. The current indexation arrangements for MBS rebates are part of a wider set of arrangements—first articulated by the Keating Labor Government in the 1995-96 Federal Budget1—that apply to government programs with a substantial wage component. In the following year, these arrangements were further codified and the various DoFA WCI indices formally came into being. Although MBS fees for GP consultation items have been linked, ostensibly, to WCI5 since 1996, that linkage has been erratic—sometimes full, sometimes partial and, in 1996-97, not at all (all MBS rebates were frozen in that year). There are some clear anomalies in the construction of WCI5 when applied to medical practice. Although WCI5 may be a useful DoFA instrument in some other areas of Budget policy, it has historically produced MBS fee increases that have not kept pace with growth in medical practice costs as measured by other indices, even allowing for productivity gains. Consequent declines in real GP remuneration have undermined practice viability. This has been a very significant factor in the decline in bulk billing rates.
FIGURE 1: REAL MBS ITEM 23 REBATE
Left panel: Real rebate under WCI5 Indexation Right panel: Hourly gross GP earnings, annual
average, urban & rural by gender
$24.00
$25.00
$26.00
$27.00
$28.00
$29.00
$30.00
1991-92
1992-93
1993-94
1994-95
1995-96
1996-97
1997-98
1998-99
1999-00
2000-01
2001-02
2002-03
2003-04
2004-05
3-year moving average
$40.00
$42.00
$44.00
$46.00
$48.00
$50.00
$52.00
$54.00
$56.00
$58.00
1993 1994 1995 1996 1997 1998 1999 2000 2001 2002
Urban Male
Rural Male
Urban Female
Rural Female
Source: Access Economics (2002).
Figure 1 shows how the erosion of spending on GP items has resulted in a decline in real terms, as modelled in the Access Economics GP workforce model for the AMA, in:
□□ (left panel) the MBS rebate for Item 23 (the modal level B GP item), as a three year moving average (1989-90 base year, compared to a composite cost index); and
□□ (right panel) a net fall in real GP hourly earnings.
1 Budget Paper No. 1, 9 May 1995, pp 3-18 and 3-19.

Indexation of MBS Rebates for GP Consultation Items
2
The structure of the balance of this report is as follows:
□□ Section 2 addresses the key definitional issue, the definition of General Practice itself.
□□ Section 3 shows historical trends in GP item rebates under ostensible DoFA WCI5 indexation (Section 3.1), as well as trends in four other indices, outlining the rationale for use of each. These are the various Australian Bureau of Statistics (ABS) measures of Average Weekly Earnings (Section 3.2), the Consumer Price Index (Section 3.3), the AMA Medical Fees Index (Section 3.4) and the Rural Doctors Association of New South Wales (RDA NSW) Rural Doctors Settlement Package schedule fee indexation process.
□□ Section 4 compares the changes in these indices over the past decade (Section 4.1) and illustrates the implications for aggregate rebates had alternative indices been used (Section 4.2).
□□ Section 5 addresses some crucial issues. Section 5.1 discusses how the issue might link to a changing policy framework. Section 5.2 discusses the important issue of productivity gain.
□□ Lists of references and acronyms are to be found in Appendices A and B.
Indexation of MBS Rebates for GP Consultation Items
3
2 DEFINITIONAL ISSUES For the purposes of this analysis, we have defined “General Practice” as spanning:
□□ VRGP non-referred attendance items which currently comprise all of Group A1 (GP attendances to which to other items applies—items 1, 2, 3, 4, 13, 19, 20, 23, 24-25, 33, 35-40, 43, 44, 47-51, 601-602), Group A7 (acupuncture—items 173, 193, 195), and Group A18 (attendance items associated with PIP incentive payments). Note that over the years, some of these items have been renumbered. For example, items 14, 26, 39 and 49 existed pre-1990, but were then replaced by items 13, 25, 38 & 48.
□□ Enhanced primary care items which currently comprise all of Group A14 (health assessments—items 700-706), part of Group A15 (multidisciplinary care plans and case conferences—items 720-779) and Group A17 (domiciliary medication management review—item 900).
□□ Other non-referred attendances which currently comprise all of Group A2 (other non-referred attendances to which to other item applies—items 52-60, 65, 81-98, 697-698), Group A5 (prolonged attendances to which no other items applies—items 160-164), Group A6 (group therapy—items 170-172), Group A16 (sports physician attendances—items 444-449), Group A19 (other non-referred attendance associated with PIP incentive payments to which no other items applies—items 2600-2708) and Group A20 (focussed psychological strategies—items 2721-2727).
This definition accords with that used in the aggregated Medicare data is published quarterly on this same basis in DHA’s “Medicare Statistics”. Data compiled on a corresponding basis is available back to 1984-85 (over the period, new items have been added and some others removed). Some questions may arise as to whether all these items are relevant to what we might regard as “mainstream” General Practice. For example, Group A16 covers attendances by sports physicians. Although Sports Physicians can rightfully claim to be specialists in their own right (with a dedicated college and educational processes that meet all requirements for a specialty), their attempts to gain specialist recognition have fallen on fallow ground. In any consideration of the definition of General Practice, it is important to note that although the definition used here is a wide one that covers a significant number of items (127 in the year 2001-02), GP and other non-referred consultations are, in practice, concentrated among a small number of items. Using 2001-02 as the example, the top 3 items among the 127 accounted for over 90% of rebate expenditure, while the top 21 items accounted for 99%. For the record, the top 21 items (in descending order of rebate cost) are 23, 36, 53, 35, 3, 24, 54, 44, 193, 25, 33, 1, 37, 173, 57, 720, 97, 43, 700, 2 and 724. Expressed another way, the top 21 items involve rebate costs of which 92% are VRGP, 7% are OMP and 1% is split between enhanced primary care/multidisciplinary care plans and acupuncture). Items that are not “mainstream” GP involve such a small number of services and total rebate spend that their inclusion does not affect the analysis in any material way.
Indexation of MBS Rebates for GP Consultation Items
4
3 ALTERNATIVE INDICES This section briefly reviews historical trends in GP rebates under ostensible DoFA WCI5 indexation, as well as trends in four other indices, outlining the rationale for the use of each. These are:
□□ Average weekly earnings (AWE), including ordinary time earnings only (AWOTE) and the ABS Wage Cost Index (WCI);
□□ the Consumer Price Index (CPI)—underlying and headline;
□□ the AMA Medical Fees Index (MFI); and
□□ the Rural Doctors Association of New South Wales Settlement Package (RDA NSW SP) index.
3.1 HISTORICAL WCI5-BASED TRENDS DOFA calculates around ten wage cost indices (WCIs) to index all departmental funding, as well as all new and existing programs with substantial wage cost components. Wage Cost Index 5 (WCI5) is calculated by DoFA for use in adjusting a variety of health fees including those in the Medicare Benefits Schedule (MBS). DoFA advises that WCI5 is constructed to ensure that the indexation of Government payments includes only those wage increases that are not offset or expected to be offset by productivity improvements, which are not to be funded from the Budget. WCI5 is a weighted index of the Safety Net Adjustment (SNA)—determined by the Australian Industrial Relations Commission—for wage costs the Consumer Price Index (CPI) for non-wage costs, with a 60% weighting for the SNA and 40% for the CPI. There are some issues with the construction of WCI5 which remain unclear. For example, we are given to understand that DoFA previously used the Treasury underlying rate measure of the CPI (UCPI), a partial measure of the headline CPI (HCPI) abstracting from volatile influences such as oil prices and mortgage interest rates. The Australian Bureau of Statistics no longer publishes the underlying rate so it is not known whether another agency (Treasury or Finance) calculates the underlying rate or if another CPI measure is used. Furthermore, the rationale as stated in the 1995-96 Budget papers remains broadly relevant to the current indexation arrangements. Two further points are noted:
□□ Given the way in which it is calculated, the SNA-based increase is invariably a far lower figure than that seen for all other measures of the growth in earnings: the ABS WCI, survey-based measures of earnings (AWE or AWOTE), or the National Accounts derived measure of earnings. This seems to be the case because the dollar amount of the SNA increase (the numerator) is calculated as a percentage of AWOTE (the denominator). AWOTE is, of course, a much higher figure than the safety net wage itself. It follows that the DoFA method for calculating the wage component of WCI5 implicitly assumes very high gains in productivity.
□□ Second—but by no means a point of secondary importance—in adjusting MBS fees (both before and after the advent of WCI5 in 1996), the government has consistently ignored the increases in medical indemnity insurance premiums, notwithstanding the evidence that this component of practice costs has risen much faster than other components of
Indexation of MBS Rebates for GP Consultation Items
5
costs and that it now comprises a much higher percentage of all costs. In the Practice Costs Study for the Relative Value Study, PWC recommended that in the indexation of MBS fees, medical indemnity costs be a separate, appropriately weighted cost component, with adjustment for actual changes in premiums. In short, PWC recommended that the new indexation regime be pulled into line with the practice in the AMA MFI. This recommendation was, implicitly, rejected by the government along with all the other findings from the RVS.
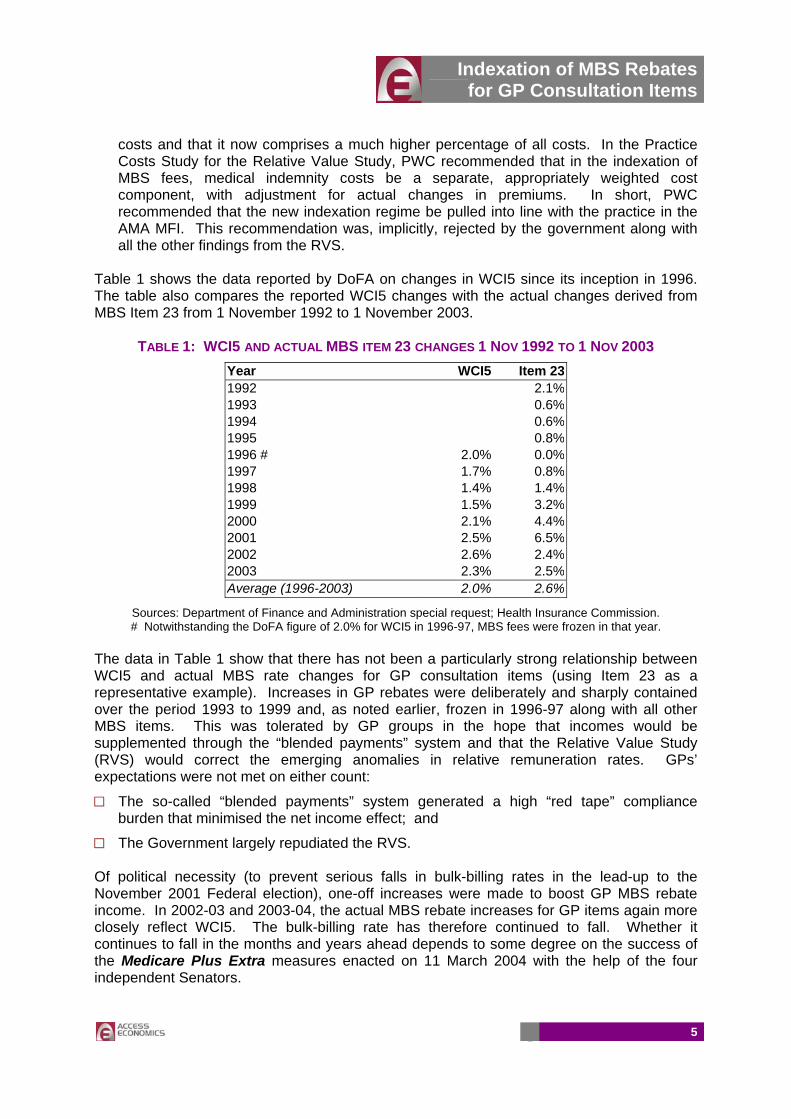
Table 1 shows the data reported by DoFA on changes in WCI5 since its inception in 1996. The table also compares the reported WCI5 changes with the actual changes derived from MBS Item 23 from 1 November 1992 to 1 November 2003.
TABLE 1: WCI5 AND ACTUAL MBS ITEM 23 CHANGES 1 NOV 1992 TO 1 NOV 2003 Year WCI5 Item 23 1992 2.1% 1993 0.6% 1994 0.6% 1995 0.8% 1996 # 2.0% 0.0% 1997 1.7% 0.8% 1998 1.4% 1.4% 1999 1.5% 3.2% 2000 2.1% 4.4% 2001 2.5% 6.5% 2002 2.6% 2.4% 2003 2.3% 2.5% Average (1996-2003) 2.0% 2.6%
Sources: Department of Finance and Administration special request; Health Insurance Commission. # Notwithstanding the DoFA figure of 2.0% for WCI5 in 1996-97, MBS fees were frozen in that year.
The data in Table 1 show that there has not been a particularly strong relationship between WCI5 and actual MBS rate changes for GP consultation items (using Item 23 as a representative example). Increases in GP rebates were deliberately and sharply contained over the period 1993 to 1999 and, as noted earlier, frozen in 1996-97 along with all other MBS items. This was tolerated by GP groups in the hope that incomes would be supplemented through the “blended payments” system and that the Relative Value Study (RVS) would correct the emerging anomalies in relative remuneration rates. GPs’ expectations were not met on either count:
□□ The so-called “blended payments” system generated a high “red tape” compliance burden that minimised the net income effect; and
□□ The Government largely repudiated the RVS. Of political necessity (to prevent serious falls in bulk-billing rates in the lead-up to the November 2001 Federal election), one-off increases were made to boost GP MBS rebate income. In 2002-03 and 2003-04, the actual MBS rebate increases for GP items again more closely reflect WCI5. The bulk-billing rate has therefore continued to fall. Whether it continues to fall in the months and years ahead depends to some degree on the success of the Medicare Plus Extra measures enacted on 11 March 2004 with the help of the four independent Senators.

Indexation of MBS Rebates for GP Consultation Items
6
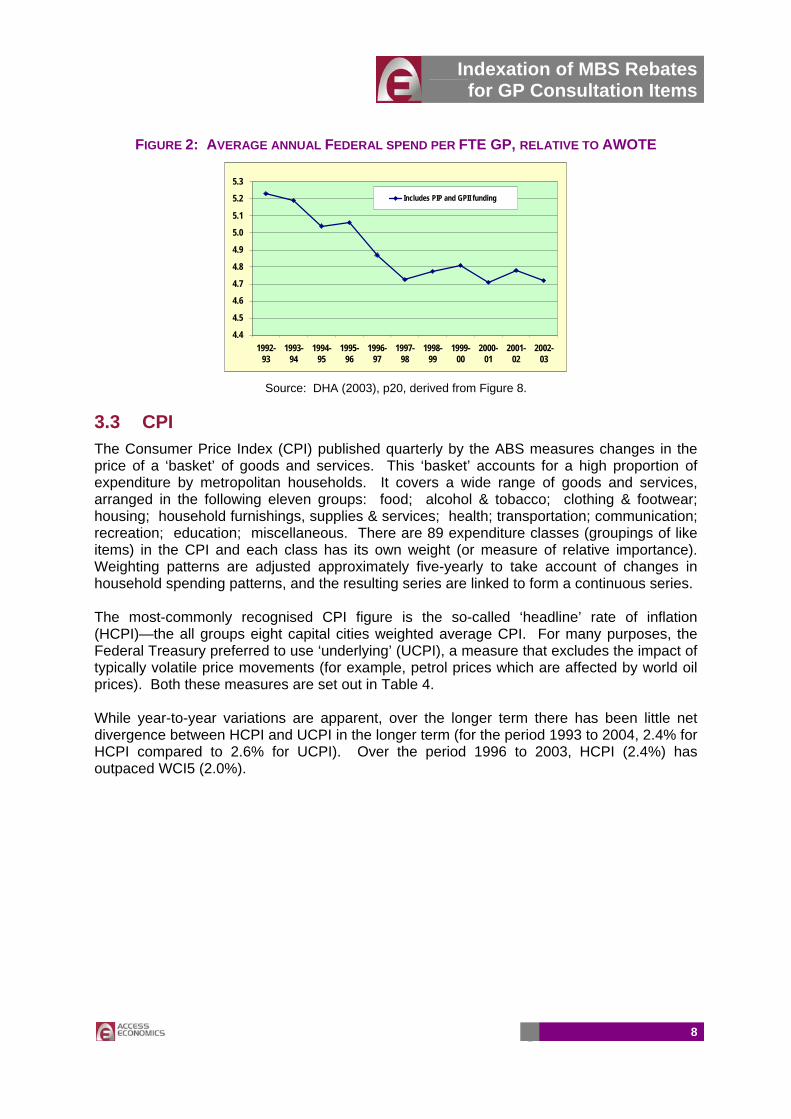
As noted above, the blended payments were introduced to top up GP funding outside the framework of the MBS, such as the Practice Incentives Program (PIP) and the General Practice Immunisation Incentives Scheme (GPII). The Productivity Commission has found the non-rebate payments impose a substantial burden on GPs due to complex and time-consuming administration and compliance costs.2 As a result, the Government established the Red Tape Taskforce. However, even including the top-up payments (and assuming away the substantial compliance costs), total Federal spending per FTE GP has been falling relative to average weekly overtime earnings (AWOTE) as shown in Figure 2 in the following section. To facilitate comparability with other indices and with expenditure data:
□□ WCI5 and MBS fees were converted to a financial year basis using a 5 months/7 months rule of thumb (in other words, assuming a lag on average of one month for the processing of claims);
□□ The MBS indexation figures used prior to the introduction of WCI5 were added, giving a longer history of the indexation of MBS fees;
□□ To supplement the MBS fees for the high volume Level B fee, we included a weighted average of all GP MBS fees and a weighted average of items A to D (using fixed weights). These data are shown in Table 2.
TABLE 2: WCI5 AND ACTUAL MBS ITEMS 1992-93 TO 2003-04
Year WCI5 All GP MBS Item B Items A-D 1992-93 3.0% 2.7% 3.1% 3.0% 1993-94 1.6% 1.1% 1.2% 1.2% 1994-95 1.3% 0.5% 0.6% 0.6% 1995-96 1.6% 0.7% 0.7% 0.8% 1996-97 1.9% 0.3% 0.3% 0.4% 1997-98 1.8% 0.5% 0.5% 0.5% 1998-99 1.5% 1.2% 1.2% 1.2% 1999-00 1.5% 2.2% 2.5% 2.4% 2000-01 1.9% 3.6% 3.9% 3.9% 2001-02 2.3% 6.7% 5.7% 6.8% 2002-03 2.6% 4.8% 4.1% 4.8% 2003-04 2.4% 2.4% 2.5% 2.5% Average (1992-04) 1.9% 2.2% 2.2% 2.3%
3.2 AWE / AWOTE / WCI Data on average weekly earnings (AWE) including both ordinary time earnings (AWOTE) as well as the total measure (including overtime) are published quarterly including seasonal adjustments by the ABS. The data is based on information obtained from a sample survey of some 4,700 employers selected from the ABS Business Register, stratified by state, sector, industry and employment size. AWE are calculated as gross (before tax) earnings of employees, derived by dividing estimates of weekly total earnings by estimates of number of employees. Several factors can contribute to changes, including the composition of the wage and salary earner segment
2 Productivity Commission (2003) “General Practice Administrative and Compliance Costs”, Research Report, 11 April, Canberra.
Indexation of MBS Rebates for GP Consultation Items
7
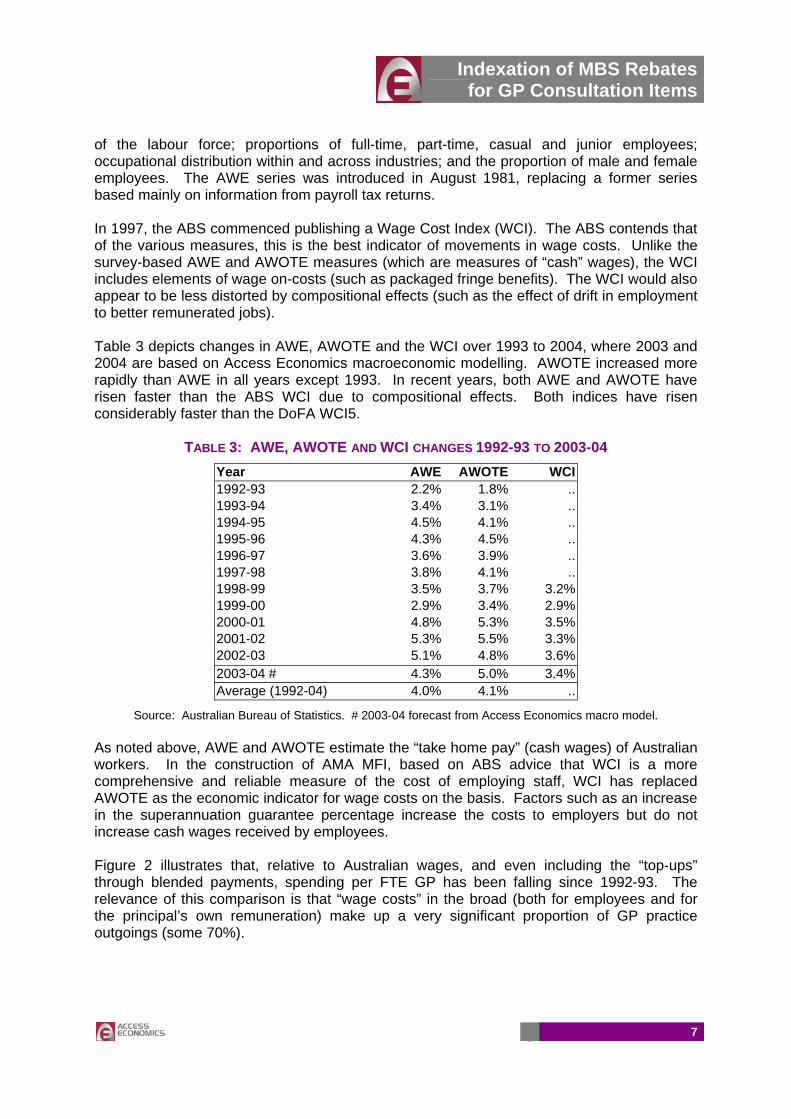
of the labour force; proportions of full-time, part-time, casual and junior employees; occupational distribution within and across industries; and the proportion of male and female employees. The AWE series was introduced in August 1981, replacing a former series based mainly on information from payroll tax returns. In 1997, the ABS commenced publishing a Wage Cost Index (WCI). The ABS contends that of the various measures, this is the best indicator of movements in wage costs. Unlike the survey-based AWE and AWOTE measures (which are measures of “cash” wages), the WCI includes elements of wage on-costs (such as packaged fringe benefits). The WCI would also appear to be less distorted by compositional effects (such as the effect of drift in employment to better remunerated jobs). Table 3 depicts changes in AWE, AWOTE and the WCI over 1993 to 2004, where 2003 and 2004 are based on Access Economics macroeconomic modelling. AWOTE increased more rapidly than AWE in all years except 1993. In recent years, both AWE and AWOTE have risen faster than the ABS WCI due to compositional effects. Both indices have risen considerably faster than the DoFA WCI5.
TABLE 3: AWE, AWOTE AND WCI CHANGES 1992-93 TO 2003-04 Year AWE AWOTE WCI 1992-93 2.2% 1.8% .. 1993-94 3.4% 3.1% .. 1994-95 4.5% 4.1% .. 1995-96 4.3% 4.5% .. 1996-97 3.6% 3.9% .. 1997-98 3.8% 4.1% .. 1998-99 3.5% 3.7% 3.2% 1999-00 2.9% 3.4% 2.9% 2000-01 4.8% 5.3% 3.5% 2001-02 5.3% 5.5% 3.3% 2002-03 5.1% 4.8% 3.6% 2003-04 # 4.3% 5.0% 3.4% Average (1992-04) 4.0% 4.1% ..
Source: Australian Bureau of Statistics. # 2003-04 forecast from Access Economics macro model. As noted above, AWE and AWOTE estimate the “take home pay” (cash wages) of Australian workers. In the construction of AMA MFI, based on ABS advice that WCI is a more comprehensive and reliable measure of the cost of employing staff, WCI has replaced AWOTE as the economic indicator for wage costs on the basis. Factors such as an increase in the superannuation guarantee percentage increase the costs to employers but do not increase cash wages received by employees. Figure 2 illustrates that, relative to Australian wages, and even including the “top-ups” through blended payments, spending per FTE GP has been falling since 1992-93. The relevance of this comparison is that “wage costs” in the broad (both for employees and for the principal’s own remuneration) make up a very significant proportion of GP practice outgoings (some 70%).
Indexation of MBS Rebates for GP Consultation Items
8
FIGURE 2: AVERAGE ANNUAL FEDERAL SPEND PER FTE GP, RELATIVE TO AWOTE
4.4
4.5
4.6
4.7
4.8
4.9
5.0
5.1
5.2
5.3
1992-93
1993-94
1994-95
1995-96
1996-97
1997-98
1998-99
1999-00
2000-01
2001-02
2002-03
Includes PIP and GPII funding
Source: DHA (2003), p20, derived from Figure 8.
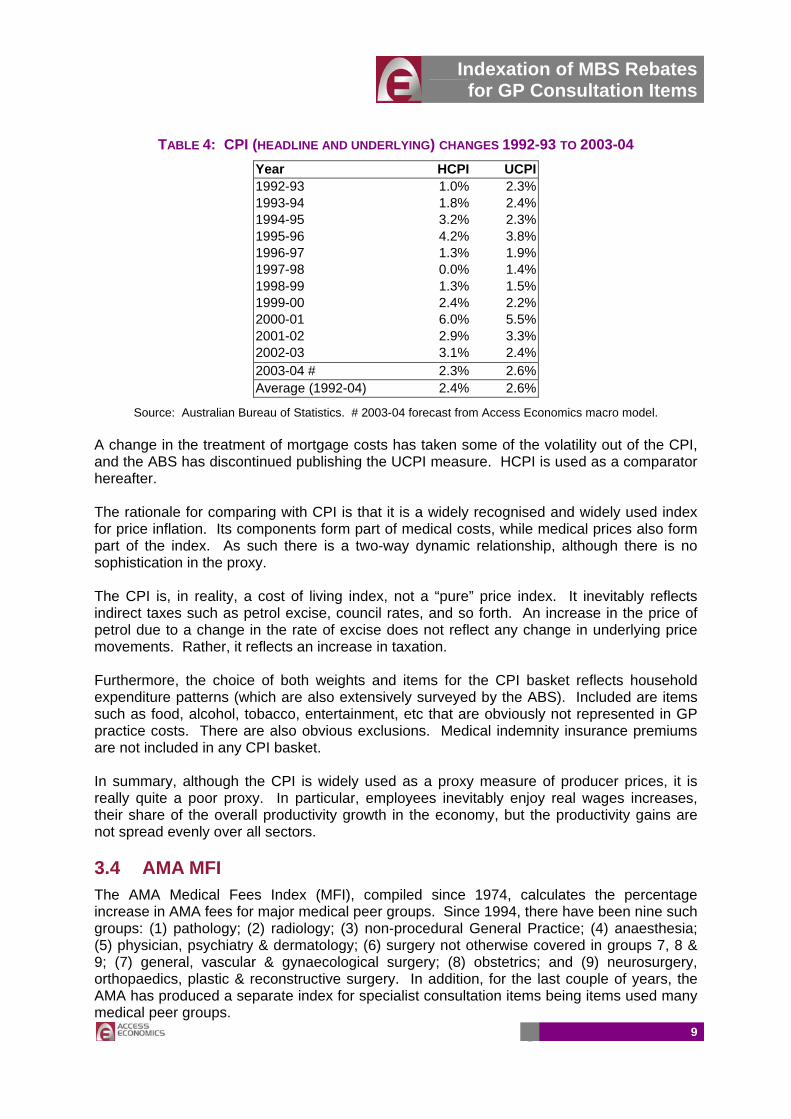
3.3 CPI The Consumer Price Index (CPI) published quarterly by the ABS measures changes in the price of a ‘basket’ of goods and services. This ‘basket’ accounts for a high proportion of expenditure by metropolitan households. It covers a wide range of goods and services, arranged in the following eleven groups: food; alcohol & tobacco; clothing & footwear; housing; household furnishings, supplies & services; health; transportation; communication; recreation; education; miscellaneous. There are 89 expenditure classes (groupings of like items) in the CPI and each class has its own weight (or measure of relative importance). Weighting patterns are adjusted approximately five-yearly to take account of changes in household spending patterns, and the resulting series are linked to form a continuous series. The most-commonly recognised CPI figure is the so-called ‘headline’ rate of inflation (HCPI)—the all groups eight capital cities weighted average CPI. For many purposes, the Federal Treasury preferred to use ‘underlying’ (UCPI), a measure that excludes the impact of typically volatile price movements (for example, petrol prices which are affected by world oil prices). Both these measures are set out in Table 4. While year-to-year variations are apparent, over the longer term there has been little net divergence between HCPI and UCPI in the longer term (for the period 1993 to 2004, 2.4% for HCPI compared to 2.6% for UCPI). Over the period 1996 to 2003, HCPI (2.4%) has outpaced WCI5 (2.0%).
Indexation of MBS Rebates for GP Consultation Items
9
TABLE 4: CPI (HEADLINE AND UNDERLYING) CHANGES 1992-93 TO 2003-04 Year HCPI UCPI1992-93 1.0% 2.3%1993-94 1.8% 2.4%1994-95 3.2% 2.3%1995-96 4.2% 3.8%1996-97 1.3% 1.9%1997-98 0.0% 1.4%1998-99 1.3% 1.5%1999-00 2.4% 2.2%2000-01 6.0% 5.5%2001-02 2.9% 3.3%2002-03 3.1% 2.4%2003-04 # 2.3% 2.6%Average (1992-04) 2.4% 2.6%
Source: Australian Bureau of Statistics. # 2003-04 forecast from Access Economics macro model. A change in the treatment of mortgage costs has taken some of the volatility out of the CPI, and the ABS has discontinued publishing the UCPI measure. HCPI is used as a comparator hereafter. The rationale for comparing with CPI is that it is a widely recognised and widely used index for price inflation. Its components form part of medical costs, while medical prices also form part of the index. As such there is a two-way dynamic relationship, although there is no sophistication in the proxy. The CPI is, in reality, a cost of living index, not a “pure” price index. It inevitably reflects indirect taxes such as petrol excise, council rates, and so forth. An increase in the price of petrol due to a change in the rate of excise does not reflect any change in underlying price movements. Rather, it reflects an increase in taxation. Furthermore, the choice of both weights and items for the CPI basket reflects household expenditure patterns (which are also extensively surveyed by the ABS). Included are items such as food, alcohol, tobacco, entertainment, etc that are obviously not represented in GP practice costs. There are also obvious exclusions. Medical indemnity insurance premiums are not included in any CPI basket. In summary, although the CPI is widely used as a proxy measure of producer prices, it is really quite a poor proxy. In particular, employees inevitably enjoy real wages increases, their share of the overall productivity growth in the economy, but the productivity gains are not spread evenly over all sectors. 3.4 AMA MFI The AMA Medical Fees Index (MFI), compiled since 1974, calculates the percentage increase in AMA fees for major medical peer groups. Since 1994, there have been nine such groups: (1) pathology; (2) radiology; (3) non-procedural General Practice; (4) anaesthesia; (5) physician, psychiatry & dermatology; (6) surgery not otherwise covered in groups 7, 8 & 9; (7) general, vascular & gynaecological surgery; (8) obstetrics; and (9) neurosurgery, orthopaedics, plastic & reconstructive surgery. In addition, for the last couple of years, the AMA has produced a separate index for specialist consultation items being items used many medical peer groups.
Indexation of MBS Rebates for GP Consultation Items
10
The MFI is a weighted average of the increases in various cost and income components determined by reference to three economic indices and specific data on medical defence subscriptions. In a little more detail:
□□ The ABS Wage Cost Index (WCI) is used for employee wages, principal’s superannuation and net practice income.
□□ The private motoring component of the consumer price index (CPI) is used for motor vehicle costs (with the GST impact removed).
□□ Subscriptions data from several medical defence insurers, cross-checked in 2002 with results of an AMA fax poll, is used to escalate medical defence subscriptions.
□□ The headline inflation rate (HCPI) is used for other practice costs (with the GST impact removed).
The economic index used to reflect earnings has a very heavy influence on the MFI, as it accounts for 60% to 80% of existing weights. The all groups CPI accounts for 10% to 40% of existing weights. Medical defence subscriptions account for 1% to 10% of existing weights. The private motoring CPI index accounts for 1% to 4% of existing weights. In the year 2000, there was a major review of cost weights based on the detailed material in the 1999 Practice Costs Survey undertaken for the RVS by PWC. The calculation of the MFI index includes an automatic correction mechanism to incorporate divergences between previous year’s forecast and actual figures, so there is no systematic bias in the MFI over time.
Medical defence increases are distilled from detailed premium data for six states and 23 medical peer groups for the current and previous year (276 data items). For each of the 23 groups, a national average is calculated using State population as the weight. To condense to the 9 major peer groups in the AMA MFI, Medicare benefit expenditure is used as the weighting factor. Considerable effort is expended to distil the pure price movement, by ensuring that the figures for the two years are on the same basis as far as possible, rather than reflecting changes in premiums due to a change in the practice profile.
Overall, the AMA MFI is a robust and defensible measure of costs. Areas for possible refinement are:
□□ adjustment to take account of productivity gains in private medical practice;
□□ review of the expenditure weights (based on either ABS data or a new AMA practice costs survey);
□□ ongoing review of the economic indices used so as to use the best proxy measures of actual cost or earnings experience that may be available at any point in time; and
□□ review of the peer groups, with potential for using a finer peer group classification if cost experience within any of the existing nine broad groups is seen as too divergent.
Changes in the AMA MFI for non-procedural GP items are shown in Table 5 below. The average—3.3% over the period 1993-2003, is higher than HCPI but significantly lower than AWE or AWOTE.
Indexation of MBS Rebates for GP Consultation Items
11
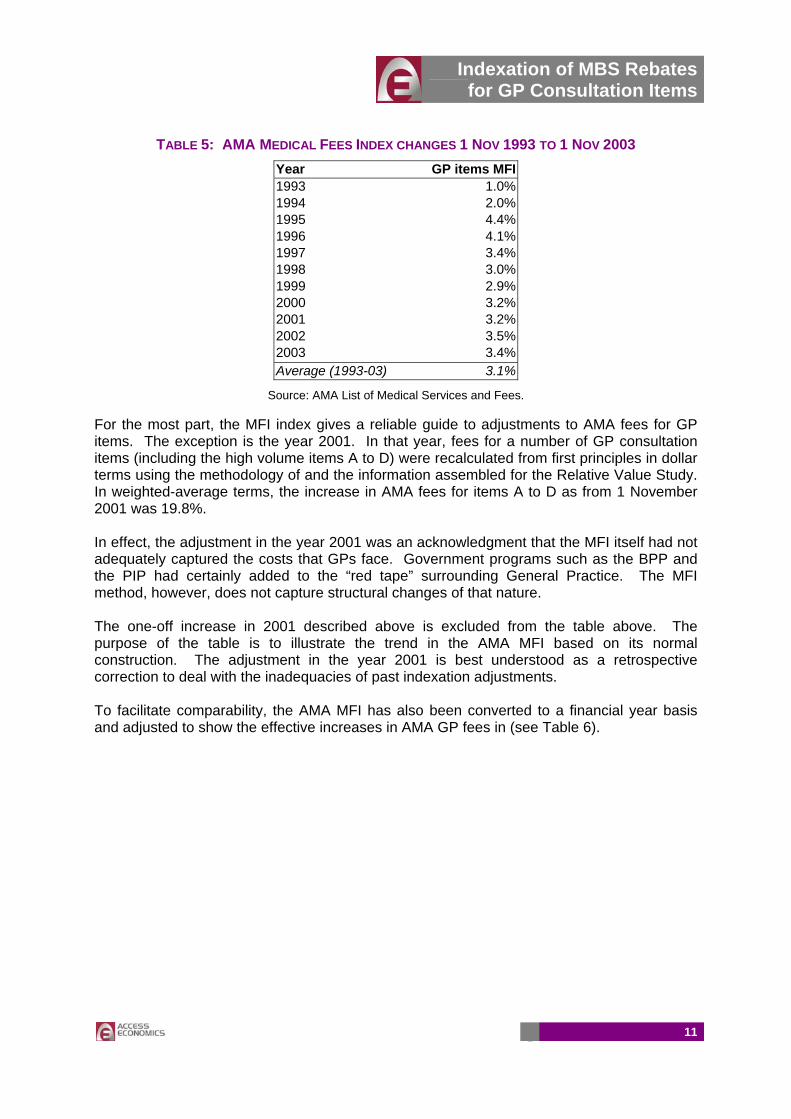
TABLE 5: AMA MEDICAL FEES INDEX CHANGES 1 NOV 1993 TO 1 NOV 2003 Year GP items MFI1993 1.0%1994 2.0%1995 4.4%1996 4.1%1997 3.4%1998 3.0%1999 2.9%2000 3.2%2001 3.2%2002 3.5%2003 3.4%Average (1993-03) 3.1%
Source: AMA List of Medical Services and Fees. For the most part, the MFI index gives a reliable guide to adjustments to AMA fees for GP items. The exception is the year 2001. In that year, fees for a number of GP consultation items (including the high volume items A to D) were recalculated from first principles in dollar terms using the methodology of and the information assembled for the Relative Value Study. In weighted-average terms, the increase in AMA fees for items A to D as from 1 November 2001 was 19.8%. In effect, the adjustment in the year 2001 was an acknowledgment that the MFI itself had not adequately captured the costs that GPs face. Government programs such as the BPP and the PIP had certainly added to the “red tape” surrounding General Practice. The MFI method, however, does not capture structural changes of that nature. The one-off increase in 2001 described above is excluded from the table above. The purpose of the table is to illustrate the trend in the AMA MFI based on its normal construction. The adjustment in the year 2001 is best understood as a retrospective correction to deal with the inadequacies of past indexation adjustments. To facilitate comparability, the AMA MFI has also been converted to a financial year basis and adjusted to show the effective increases in AMA GP fees in (see Table 6).
Indexation of MBS Rebates for GP Consultation Items
12
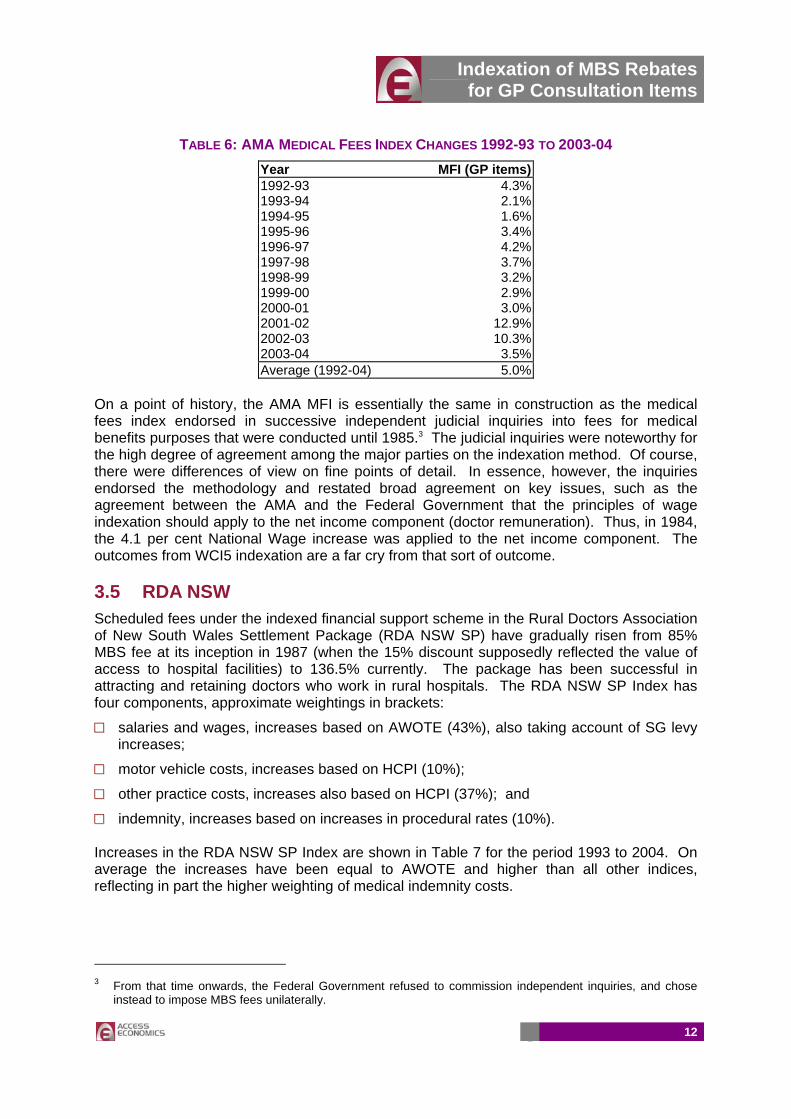
TABLE 6: AMA MEDICAL FEES INDEX CHANGES 1992-93 TO 2003-04 Year MFI (GP items)1992-93 4.3%1993-94 2.1%1994-95 1.6%1995-96 3.4%1996-97 4.2%1997-98 3.7%1998-99 3.2%1999-00 2.9%2000-01 3.0%2001-02 12.9%2002-03 10.3%2003-04 3.5%Average (1992-04) 5.0%
On a point of history, the AMA MFI is essentially the same in construction as the medical fees index endorsed in successive independent judicial inquiries into fees for medical benefits purposes that were conducted until 1985.3 The judicial inquiries were noteworthy for the high degree of agreement among the major parties on the indexation method. Of course, there were differences of view on fine points of detail. In essence, however, the inquiries endorsed the methodology and restated broad agreement on key issues, such as the agreement between the AMA and the Federal Government that the principles of wage indexation should apply to the net income component (doctor remuneration). Thus, in 1984, the 4.1 per cent National Wage increase was applied to the net income component. The outcomes from WCI5 indexation are a far cry from that sort of outcome. 3.5 RDA NSW Scheduled fees under the indexed financial support scheme in the Rural Doctors Association of New South Wales Settlement Package (RDA NSW SP) have gradually risen from 85% MBS fee at its inception in 1987 (when the 15% discount supposedly reflected the value of access to hospital facilities) to 136.5% currently. The package has been successful in attracting and retaining doctors who work in rural hospitals. The RDA NSW SP Index has four components, approximate weightings in brackets:
□□ salaries and wages, increases based on AWOTE (43%), also taking account of SG levy increases;
□□ motor vehicle costs, increases based on HCPI (10%);
□□ other practice costs, increases also based on HCPI (37%); and
□□ indemnity, increases based on increases in procedural rates (10%). Increases in the RDA NSW SP Index are shown in Table 7 for the period 1993 to 2004. On average the increases have been equal to AWOTE and higher than all other indices, reflecting in part the higher weighting of medical indemnity costs.
3 From that time onwards, the Federal Government refused to commission independent inquiries, and chose
instead to impose MBS fees unilaterally.
Indexation of MBS Rebates for GP Consultation Items
13
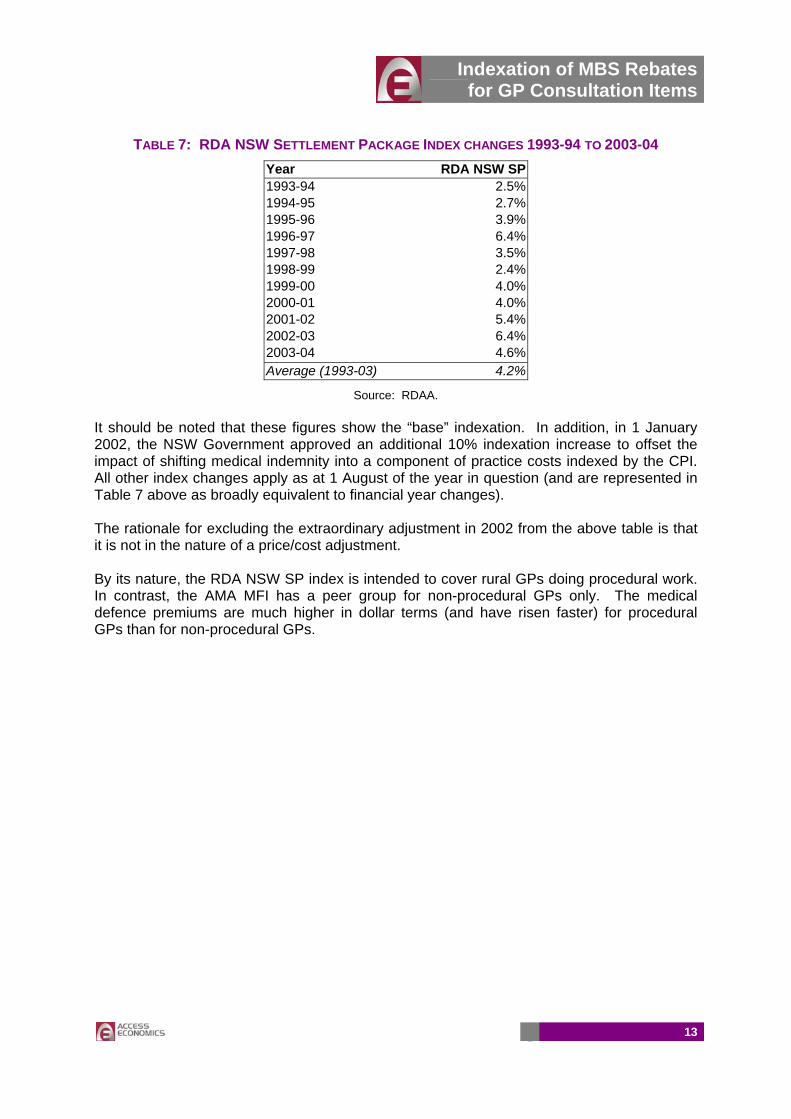
TABLE 7: RDA NSW SETTLEMENT PACKAGE INDEX CHANGES 1993-94 TO 2003-04 Year RDA NSW SP1993-94 2.5%1994-95 2.7%1995-96 3.9%1996-97 6.4%1997-98 3.5%1998-99 2.4%1999-00 4.0%2000-01 4.0%2001-02 5.4%2002-03 6.4%2003-04 4.6%Average (1993-03) 4.2%
Source: RDAA. It should be noted that these figures show the “base” indexation. In addition, in 1 January 2002, the NSW Government approved an additional 10% indexation increase to offset the impact of shifting medical indemnity into a component of practice costs indexed by the CPI. All other index changes apply as at 1 August of the year in question (and are represented in Table 7 above as broadly equivalent to financial year changes). The rationale for excluding the extraordinary adjustment in 2002 from the above table is that it is not in the nature of a price/cost adjustment. By its nature, the RDA NSW SP index is intended to cover rural GPs doing procedural work. In contrast, the AMA MFI has a peer group for non-procedural GPs only. The medical defence premiums are much higher in dollar terms (and have risen faster) for procedural GPs than for non-procedural GPs.
Indexation of MBS Rebates for GP Consultation Items
14
4 COMPARISONS
4.1 TRENDS IN INDEX CHANGES To compare growth in the various indices, they have been converted back to index numbers each with base year 1995-96. To further enhance comparability, MBS, WCI5 and AMA MFI figures have been converted from a 1 November basis to a financial year basis (as set above out in Table 2 and Table 6 respectively). Table 8 and Figure 3 compare the trends overall.
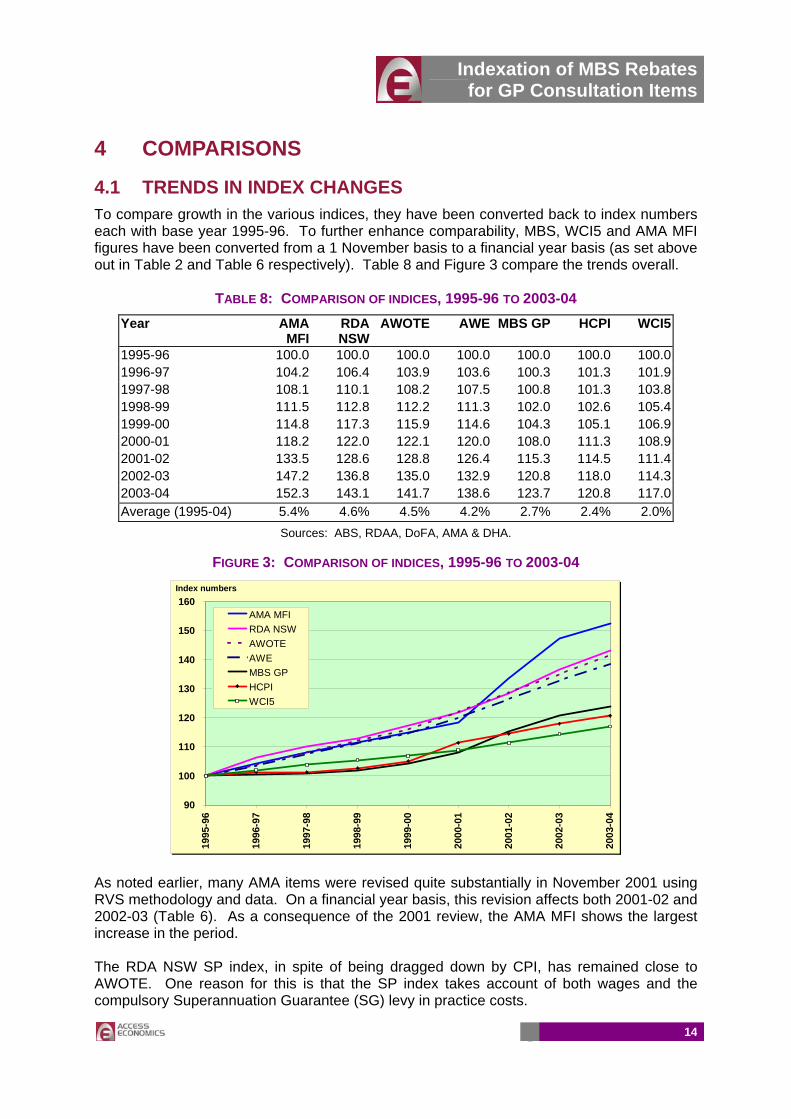
TABLE 8: COMPARISON OF INDICES, 1995-96 TO 2003-04 Year AMA
MFI RDA NSW
AWOTE AWE MBS GP HCPI WCI5
1995-96 100.0 100.0 100.0 100.0 100.0 100.0 100.01996-97 104.2 106.4 103.9 103.6 100.3 101.3 101.91997-98 108.1 110.1 108.2 107.5 100.8 101.3 103.81998-99 111.5 112.8 112.2 111.3 102.0 102.6 105.41999-00 114.8 117.3 115.9 114.6 104.3 105.1 106.92000-01 118.2 122.0 122.1 120.0 108.0 111.3 108.92001-02 133.5 128.6 128.8 126.4 115.3 114.5 111.42002-03 147.2 136.8 135.0 132.9 120.8 118.0 114.32003-04 152.3 143.1 141.7 138.6 123.7 120.8 117.0Average (1995-04) 5.4% 4.6% 4.5% 4.2% 2.7% 2.4% 2.0%
Sources: ABS, RDAA, DoFA, AMA & DHA.
FIGURE 3: COMPARISON OF INDICES, 1995-96 TO 2003-04
90
100
110
120
130
140
150
160
1995
-96
1996
-97
1997
-98
1998
-99
1999
-00
2000
-01
2001
-02
2002
-03
2003
-04
AMA MFIRDA NSWAWOTEAWEMBS GPHCPIWCI5
Index numbers
As noted earlier, many AMA items were revised quite substantially in November 2001 using RVS methodology and data. On a financial year basis, this revision affects both 2001-02 and 2002-03 (Table 6). As a consequence of the 2001 review, the AMA MFI shows the largest increase in the period. The RDA NSW SP index, in spite of being dragged down by CPI, has remained close to AWOTE. One reason for this is that the SP index takes account of both wages and the compulsory Superannuation Guarantee (SG) levy in practice costs.
Indexation of MBS Rebates for GP Consultation Items
15
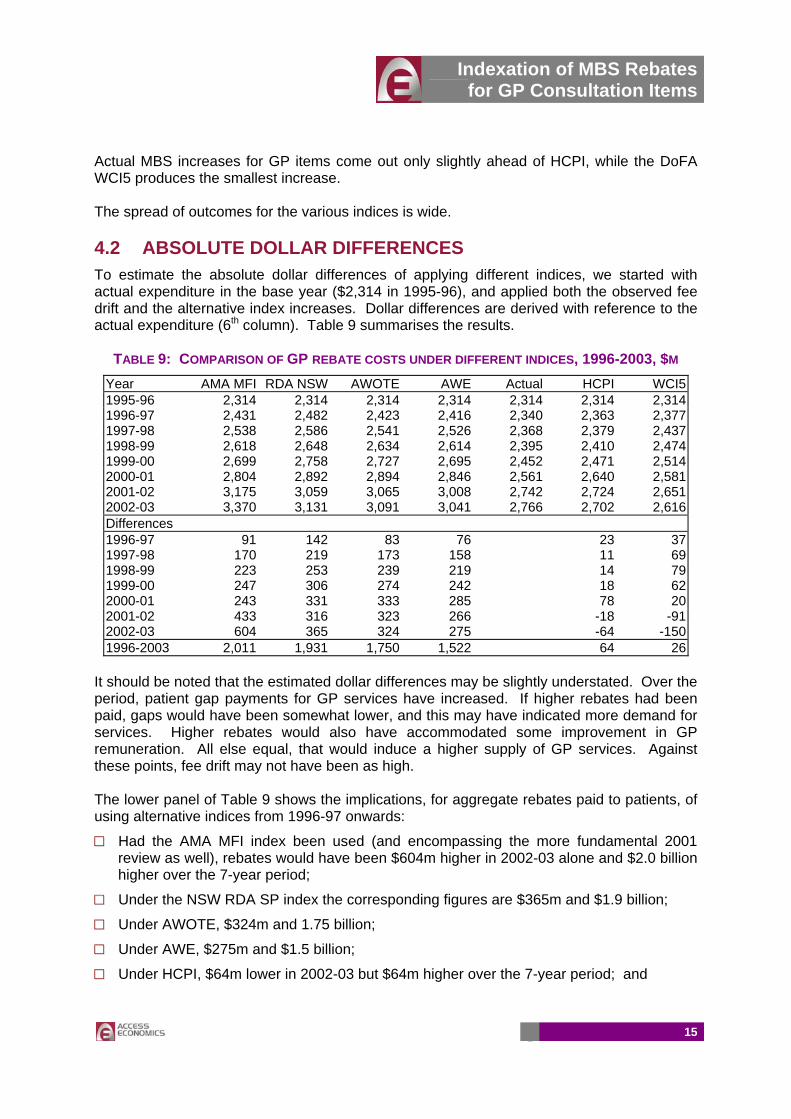
Actual MBS increases for GP items come out only slightly ahead of HCPI, while the DoFA WCI5 produces the smallest increase. The spread of outcomes for the various indices is wide. 4.2 ABSOLUTE DOLLAR DIFFERENCES To estimate the absolute dollar differences of applying different indices, we started with actual expenditure in the base year ($2,314 in 1995-96), and applied both the observed fee drift and the alternative index increases. Dollar differences are derived with reference to the actual expenditure (6th column). Table 9 summarises the results.
TABLE 9: COMPARISON OF GP REBATE COSTS UNDER DIFFERENT INDICES, 1996-2003, $M Year AMA MFI RDA NSW AWOTE AWE Actual HCPI WCI51995-96 2,314 2,314 2,314 2,314 2,314 2,314 2,3141996-97 2,431 2,482 2,423 2,416 2,340 2,363 2,3771997-98 2,538 2,586 2,541 2,526 2,368 2,379 2,4371998-99 2,618 2,648 2,634 2,614 2,395 2,410 2,4741999-00 2,699 2,758 2,727 2,695 2,452 2,471 2,5142000-01 2,804 2,892 2,894 2,846 2,561 2,640 2,5812001-02 3,175 3,059 3,065 3,008 2,742 2,724 2,6512002-03 3,370 3,131 3,091 3,041 2,766 2,702 2,616Differences 1996-97 91 142 83 76 23 371997-98 170 219 173 158 11 691998-99 223 253 239 219 14 791999-00 247 306 274 242 18 622000-01 243 331 333 285 78 202001-02 433 316 323 266 -18 -912002-03 604 365 324 275 -64 -1501996-2003 2,011 1,931 1,750 1,522 64 26
It should be noted that the estimated dollar differences may be slightly understated. Over the period, patient gap payments for GP services have increased. If higher rebates had been paid, gaps would have been somewhat lower, and this may have indicated more demand for services. Higher rebates would also have accommodated some improvement in GP remuneration. All else equal, that would induce a higher supply of GP services. Against these points, fee drift may not have been as high. The lower panel of Table 9 shows the implications, for aggregate rebates paid to patients, of using alternative indices from 1996-97 onwards:
□□ Had the AMA MFI index been used (and encompassing the more fundamental 2001 review as well), rebates would have been $604m higher in 2002-03 alone and $2.0 billion higher over the 7-year period;
□□ Under the NSW RDA SP index the corresponding figures are $365m and $1.9 billion;
□□ Under AWOTE, $324m and 1.75 billion;
□□ Under AWE, $275m and $1.5 billion;
□□ Under HCPI, $64m lower in 2002-03 but $64m higher over the 7-year period; and
Indexation of MBS Rebates for GP Consultation Items
16
□□ Under WCI5, $150m lower in 2002-03 but $26m higher over the 7-year period. The prime reason for this latter outcome is that in the actual case, MBS fees were frozen in November 1996, whereas the calculation models WCI5 without that fee freeze.
It is important to note that regardless of which index is used, the analysis in Table 9 does not build in any compensation for the compression in real fees in the earlier years of the half-indexation regime.
Indexation of MBS Rebates for GP Consultation Items
17
5 CRUCIAL ISSUES
5.1 CONNECTING TO A POLICY FRAMEWORK The policy framework under which MBS fees for GP items are set is in a process of transformation. Through the newly Senate-enhanced Medicare Plus Extra measures, the Government is seeking to swing the emphasis away from the elusive aim of universal bulk-billing towards more comprehensive safety nets. Although it may not be clearly articulated, it is part and parcel of this redirection of policy that, in aggregate in the longer term, households will bear more of the cost of GP services in future, both in terms of out-of-pocket gaps and costs pooled through private health insurance. Of course, in the short term, the package increases Government funding and should therefore decrease household out-of-pocket cost. Safety nets are the natural and inevitable companions of systems that emphasise patient co-payments. Without the safety nets, more of the burden of health care falls on sick people and access for income-poor people is reduced. Aside from the political assessment of the equity outcomes, inadequate safety nets can also produce poor health outcomes and poor cost outcomes (lack of appropriate primary care can result in much higher hospital costs). GPs play an important role in health prevention, a role that is often under-recognised and, they feel, under-valued. Medicare was designed as a “first dollar” insurance system. “Last dollar” insurance systems do a better job of spreading the financial risk of poor health status but they are invariably not as popular with the electorate as the first dollar systems. First dollar systems scatter the money around more thinly but more widely and in a less focused way. Benefits are bestowed on the rich, the poor and all those in between, on the healthy and the less healthy. The defenders of Medicare argue that the wider spread of benefits keeps the rich engaged in and committed to the system. There may be an element of truth in that, but there is more weight in the argument that “first dollar” systems become increasingly unfair when benefits fall well short of costs of delivering the service. Ultimately, the longevity of Medicare Plus will depend upon the speed with which its benefits are eroded.
Indexation of MBS Rebates for GP Consultation Items
18
5.2 ADJUSTING FOR PRODUCTIVITY GAINS WCI5 overestimates the likely productivity gains in General Practice. Because productivity gains are overestimated, when MBS fees are indexed to WCI5, they fall in real terms (relative to practice costs and GP incomes). The avenue for GPs to maintain practice viability is to increase the fees they charge relative to MBS fees. A reduction in bulk-billing is one way to achieve that outcome. Otherwise, to maintain a rate of bulk-billing, doctors must require those patients who are not bulk-billed to pay ever-rising fees to cross-subsidise those who are. That is very hard to sustain. The implicit assumptions in the construction of WCI5 is that:
□□ Productivity gains are uniform across all programs;
□□ The quality of the product or service rendered is unchanging; and
□□ All gains in productivity reflect in reduced costs of production. All three assumptions are seriously flawed. Of course there is productivity gain within General Practice. Ultimately, however, a large part of what GPs are selling is their time. They do not reap productivity gains of the order seen in, say, pathology or diagnostic imaging where rapid advances in digital equipment have substantially reduced costs of many sorts of investigations. Generally speaking, they don’t have the option of reducing unit costs by seeing more than one patient at a time or by reducing the length of the consultation. On the contrary, the available evidence points to some increases in average consultation times. WCI5 treats all peer groups as having the same high gains in productivity, but they are not the same. The second and third assumptions are linked. Some productivity advances have the prime effect of increasing quality. To take one example, electronic prescribing can make the prescription process more reliable (software can be written to support decision processes on dosage rates and there is less scope for a pharmacist to misread a script). An outcome of more reliable prescribing can be costs saved elsewhere—fewer cases of hospitalisation due to wrong dosages or inappropriate drugs. Perhaps there is scope to take it further. Known allergies to drugs might form part of a patient’s electronic health record, and any attempt to prescribe such a drug for that patient might trigger an on-screen warning. But does electronic prescribing reduce costs in the GP practice? Does it save time and, if so, how much? The patient details are captured electronically. The dosage rates and other decision support information is quickly accessible without thumbing through a reference book. Yet such systems require investment in hardware and software and time for training. MBS indexation systems never recognise additional capital investments. Arguably, quality improvement is the major impact of electronic prescribing. Cost saving, if any, is a minor consideration. It is axiomatic that if productivity gains result in a better product, that product will command a higher price relative to competing products. But WCI5 indexation effectively excludes quality improvement as a possibility. Indeed, it actively works against rewarding quality improvements. The SNA, as it is used, has a significant impact on WCI5. The Federal Government has argued consistently for low SNA increases on the grounds that these would increase employment opportunities for lower paid workers. It has received strong support for this stance from the International Monetary Fund. To date, it has not had a huge amount of
Indexation of MBS Rebates for GP Consultation Items
19
success in persuading either the unions or the Australian Industrial Relations Commission (AIRC) of the merits of its arguments.4 However, if such arguments were to carry the day in future, WCI5 increases would be lower and those smaller increases would not be reflecting any faster gain in productivity. All this places a very large question mark over the sustainability of WCI5 as the reference point for indexation of GP rebates. It has not proven to be durable in the past. In practice, every few years there is a “break out” (as in 2001) where one-off extraordinary increases in MBS fees for GP items become unavoidable. Each major readjustment in fees is followed by a lean period in which fees fall in real terms. The cycle is therefore bound to repeat itself.
4 SNA cases are heard annually by the AIRC. In the 2004 case, the ACTU argued for an increase of $26.60
per week, all State and Territory Governments supported $20 per week, while the Federal Government and industry groups argued for $10 per week. In may 2004, the AIRC awarded $19 per week, an increase of 4.2%.
Indexation of MBS Rebates for GP Consultation Items
20
APPENDIX A: REFERENCES Department of Health and Ageing (2003) "Inquiry into the access to and affordability of General Practice under Medicare" Submission to the Senate Select Committee on Medicare, July, Canberra.
Fees for Medical Benefit Purposes, Reports of Fees Inquiries, 1984 & 1985.
PricewaterhouseCoopers, Medical Schedule Review Board, A resource-based model of private medical practice in Australia, December 2001.

Indexation of MBS Rebates for GP Consultation Items
21
APPENDIX B: ACRONYMS
ABS Australian Bureau of Statistics ADGP Australian Divisions of General Practice AIRWG Attendance Item Restructure Working Group AMA Australian Medical Association AWE Average Weekly Earnings (ABS Cat. No. 6302.0) AWOTE Average Weekly Ordinary Time Earnings (ABS Cat. No. 6302.0) CPI Consumer Price Index (ABS Cat. No. 6401.0) DHA Department of Health and Ageing DoFA Department of Finance and Administration FTE Full-time Equivalent GP General Practice GPII General Practice Immunisation Incentives Scheme HCPI Headline Consumer Price Index (ABS Cat. No. 6401.0) MBS Medicare Benefits Schedule MFI Medical Fees Index compiled by the AMA PIP Practice Incentives Program PWC PricewaterhouseCoopers RACGP Royal Australian College of General Practitioners RDAA Rural Doctors Association of Australia RDA NSW Rural Doctors Association of New South Wales RDA NSW SP Rural Doctors Association of New South Wales Settlement Package SNA Safety Net Adjustment determined by the Industrial Relations Commission UCPI Underlying Consumer Price Index WCI Wage Cost Index (ABS Cat. No. 6345.0) WCI5 Wage Cost Index 5 compiled by DoFA
—oOo—


