INDIA INDIA CALLING CALLING 2009 2009 ‘ ‘ PORT LOGISTICS AND INFRASTRUCTURE DEVELOPMENT IN INDIA PORT LOGISTICS AND INFRASTRUCTURE DEVELOPMENT IN INDIA ’ ’ By RAHUL ASTHANA CHAIRMAN, MUMBAI PORT TRUST, BRUSSELS, 1st OCTOBER 2009
Transcript
INDIAINDIA CALLINGCALLING 20092009‘‘PORT LOGISTICS AND INFRASTRUCTURE DEVELOPMENT IN INDIAPORT LOGISTICS AND INFRASTRUCTURE DEVELOPMENT IN INDIA’’
By
RAHUL ASTHANACHAIRMAN,
MUMBAI PORT TRUST,
BRUSSELS, 1st OCTOBER 2009
India India –– Giant StridesGiant Strides
• Sustained high GDP growth 9% in 2007-08. 2008-09 - 6.7%; 2009-10 – 8%
• First in growth of FDI flow among countries in the region
• Second in International Trade growth in the region
• 4th in Purchasing Power Parity – next to USA, China and Japan
• Huge domestic market with large population–definite inward growth
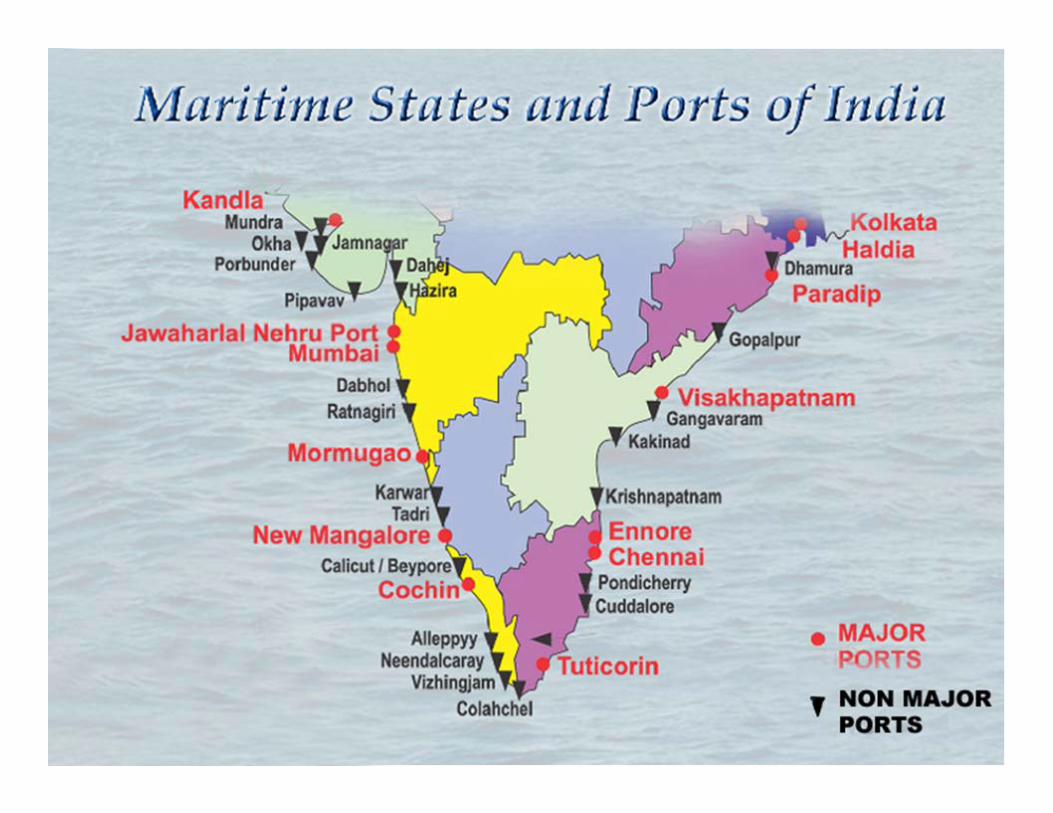
Indian Port SectorIndian Port Sector
• Total coastline consisting of 7, 517 Km spreadacross 5 different zones:- Gulf of Kutch- West Coast- Kolkata (Calcutta) Port- East Coast- Islands (Lakshadweep, Andaman & Nicobar)
• 12 Major Ports managed by the Federal Government (237 berths).• 185 Non-Major Ports managed by various State Governments –
Cargo operations at 61 ports (104 berths).• 6 Major ports & 39 Non-Major active ports on the West Coast.• 6 Major ports & 22 Non-Major active ports on the East Coast.
Contours of PresentationContours of Presentation
• Traffic Projections
• Port Capacity
• National Maritime Development Programme
2006-07- 2013-14
• Investments through Public Private
Participation
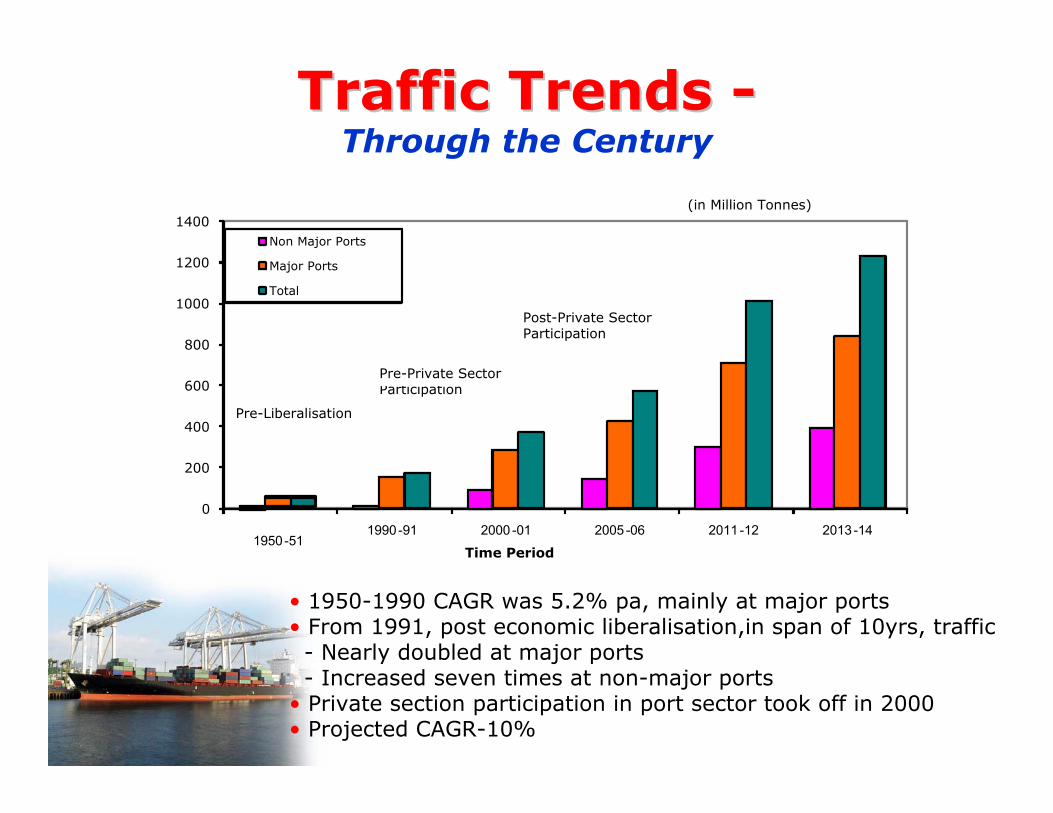
• 1950-1990 CAGR was 5.2% pa, mainly at major ports• From 1991, post economic liberalisation,in span of 10yrs, traffic
- Nearly doubled at major ports- Increased seven times at non-major ports
• Private section participation in port sector took off in 2000 • Projected CAGR-10%
Time Period
Pre-Liberalisation
Pre-Private Sector Participation
Post-Private Sector Participation
(in Million Tonnes)
0
200
400
600
800
1000
1200
1400Non Major Ports
Major Ports
Total
1950-511990-91 2000 -01 2005 -06 2011-12 2013-14
Traffic Trends Traffic Trends --Through the Century
Years
Traf
fic (i
n m
illio
n to
nnes
)
Series1 Series2
Series3
0
100
200
300
400
500
600
700
800
Years
Traf
fic (i
n m
illio
n to
nnes
) Non Major PortsMajor PortsTotal
Traffic GrowthTraffic GrowthPresent Decade
(Source : Indian Ports Association)
8728
136
8
2001-02
105
314
419
2002-03
115
345
460
2003-04
130
384
514
2004-05
147
417
564
2005-0618
646
465
0
2006-07
204
519
723
2007-08
202
530
732
2008-09
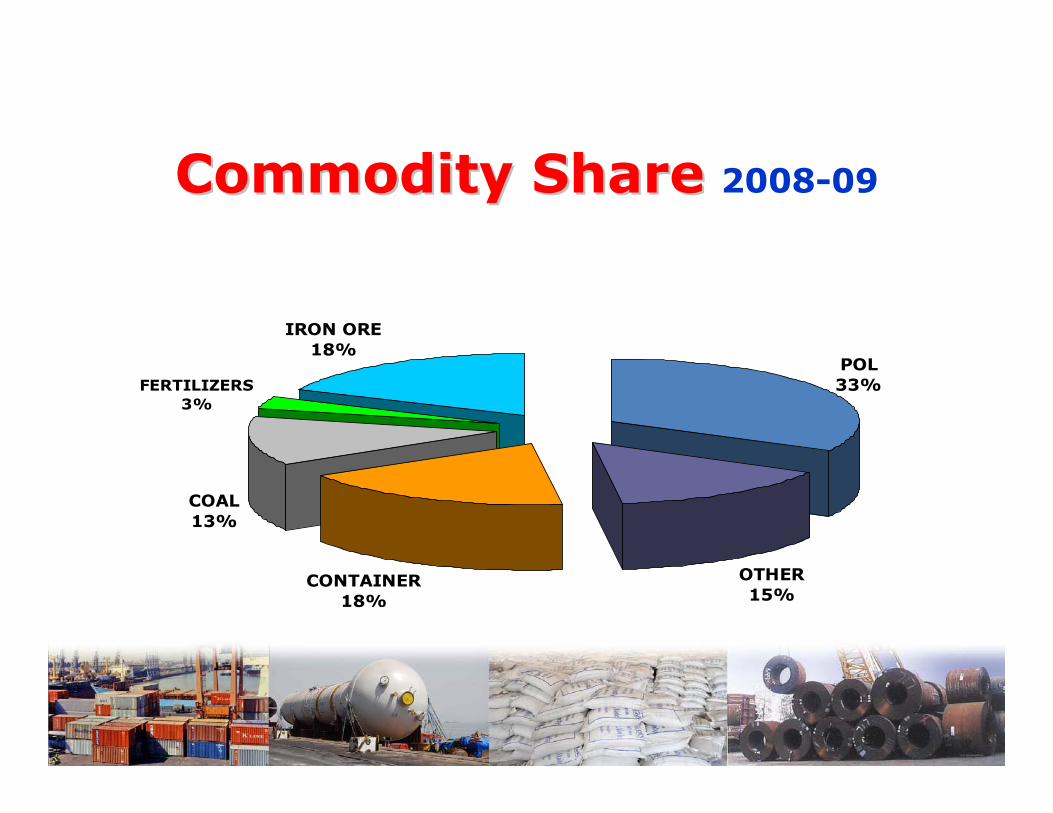
Commodity ShareCommodity Share 2008-09
OTHER15%
CONTAINER18%
COAL13%
POL33%FERTILIZERS
3%
IRON ORE18%
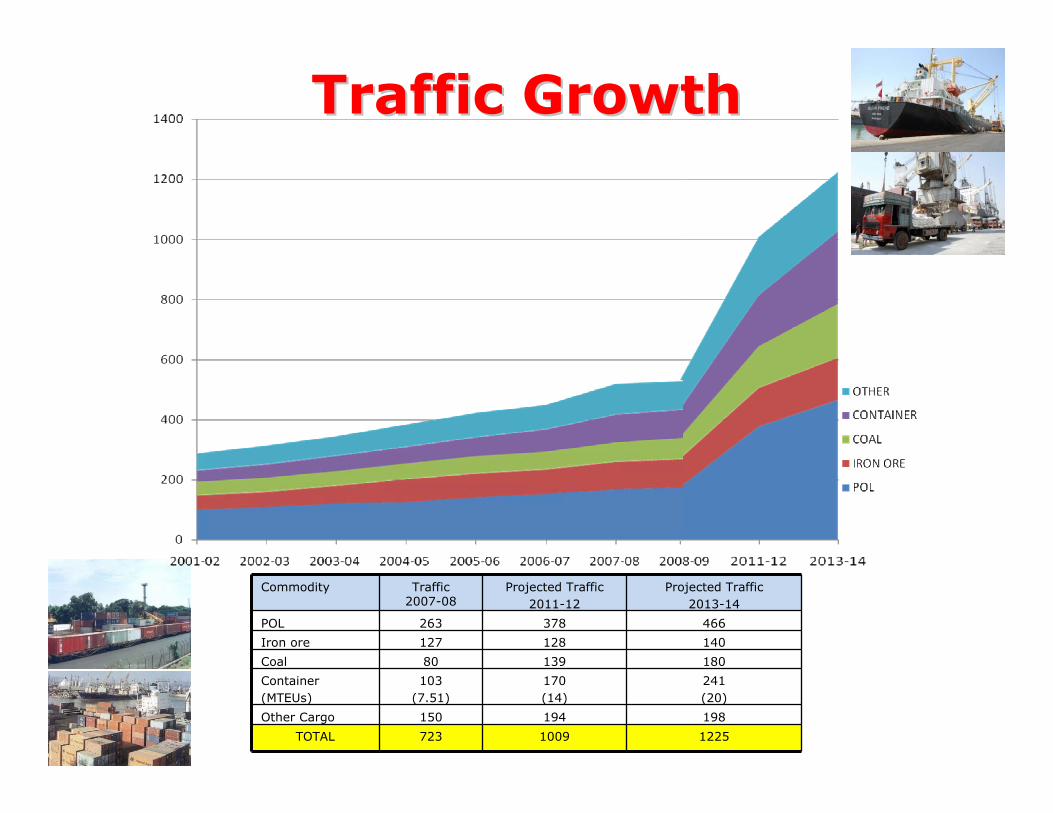
Traffic GrowthTraffic Growth
Commodity Traffic2007-08
Projected Traffic 2011-12
Projected Traffic 2013-14
POL 263 378 466
Iron ore 127 128 140
Coal 80 139 180
Container(MTEUs)
103(7.51)
170 (14)
241(20)
Other Cargo 150 194 198
TOTAL 723 1009 1225
Contours of PresentationContours of Presentation
• Traffic Projections
•• Port CapacityPort Capacity
• National Maritime Development Programme
2006-07- 2013-14
• Investments through Public Private
Participation
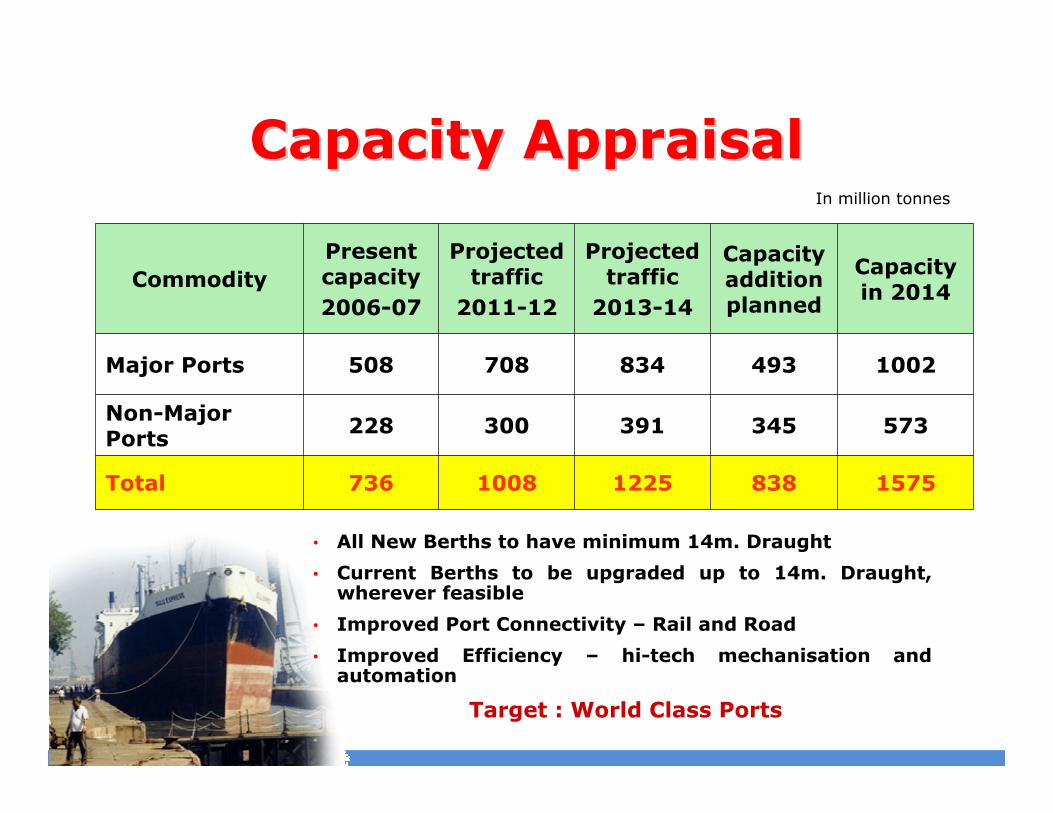
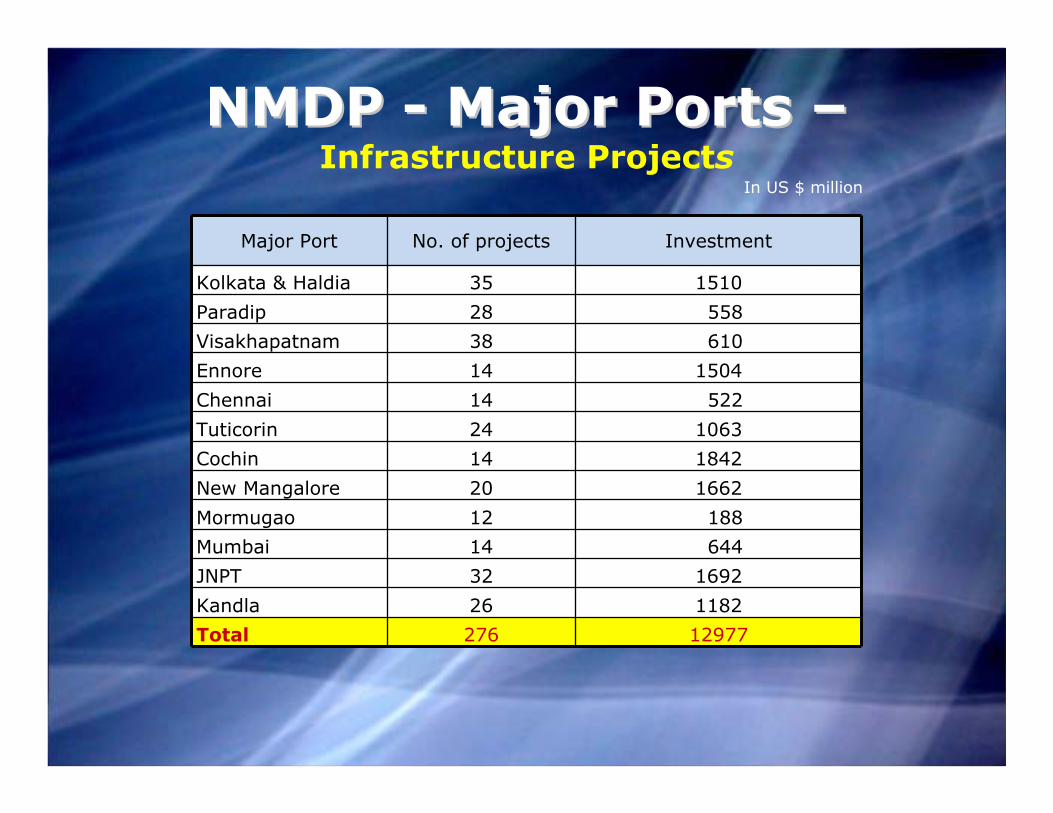
Capacity AppraisalCapacity Appraisal
CommodityPresent capacity2006-07
Projected traffic
2011-12
Projected traffic
2013-14
Capacity addition planned
Capacity in 2014
Major Ports 508 708 834 493 1002
Non-Major Ports
228 300 391 345 573
Total 736 1008 1225 838 1575
• All New Berths to have minimum 14m. Draught
• Current Berths to be upgraded up to 14m. Draught, wherever feasible
• Improved Port Connectivity – Rail and Road
• Improved Efficiency – hi-tech mechanisation and automation
Target : World Class Ports
In million tonnes
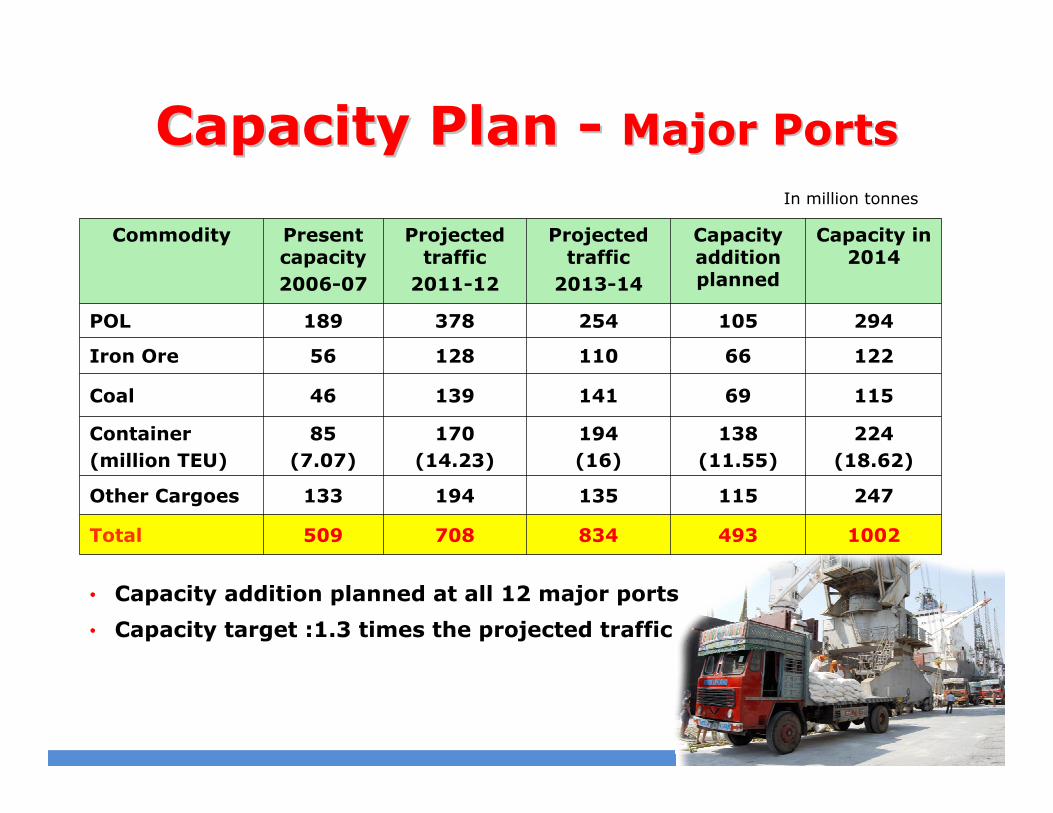
Commodity Presentcapacity2006-07
Projected traffic
2011-12
Projected traffic
2013-14
Capacity addition planned
Capacity in 2014
POL 189 378 254 105 294
Iron Ore 56 128 110 66 122
Coal 46 139 141 69 115
Container(million TEU)
85(7.07)
170(14.23)
194(16)
138(11.55)
224(18.62)
Other Cargoes 133 194 135 115 247
Total 509 708 834 493 1002
Capacity Plan Capacity Plan -- Major PortsMajor Ports
• Capacity addition planned at all 12 major ports
• Capacity target :1.3 times the projected traffic
In million tonnes
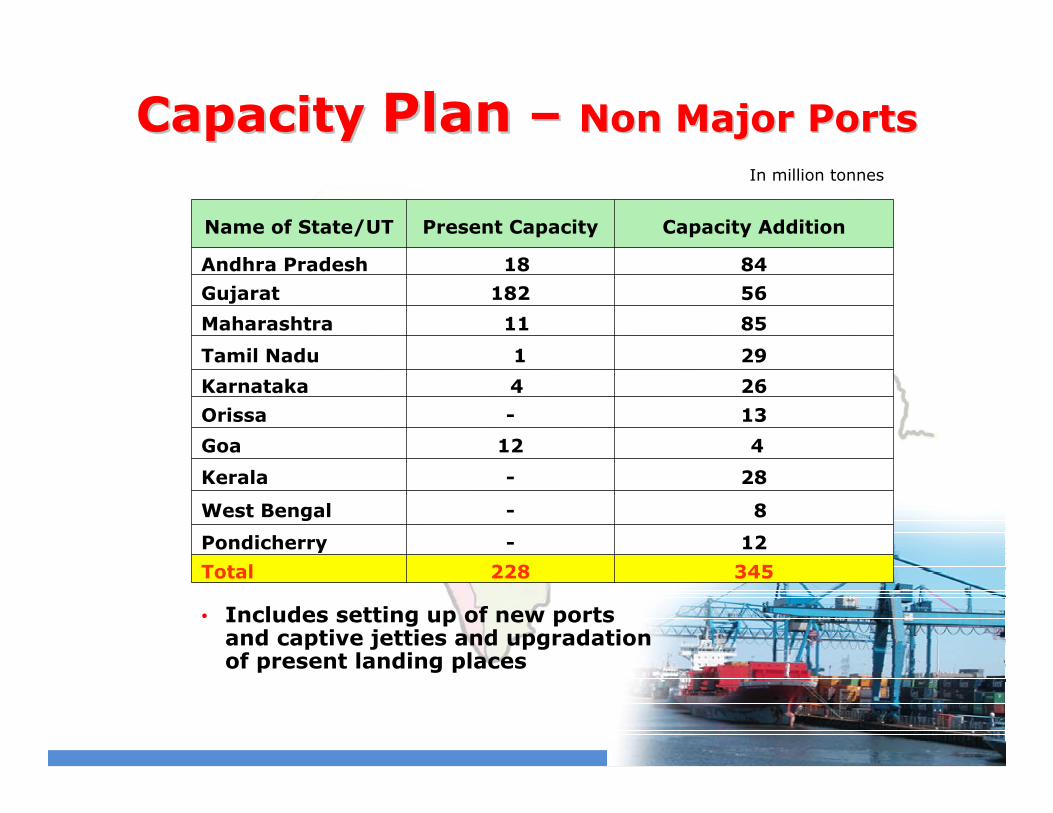
Capacity Capacity PlanPlan –– Non Major PortsNon Major Ports
• Includes setting up of new ports and captive jetties and upgradationof present landing places
In million tonnes
Name of State/UT Present Capacity Capacity Addition
Andhra Pradesh 18 84
Gujarat 182 56
Maharashtra 11 85
Tamil Nadu 1 29
Karnataka 4 26
Orissa - 13
Goa 12 4
Kerala - 28
West Bengal - 8
Pondicherry - 12
Total 228 345
Contours of PresentationContours of Presentation
• Traffic Projections
• Port Capacity
•• National Maritime Development National Maritime Development