India Gandhar Gas Based Combined Cycle Power Project (I) (II) (III) Report Date: August 2002 Field Survey: August 2001 1. Project Profile and Japan’s ODA Loan Location Map of the Project Gandhar Gas Based Combined Cycle Power Plant 1.1 Background The Western Region of India 1 has a relatively large number of commercial and industrial consumers, especially in its core city of Mumbai, and its power consumption accounted for 32% of India’s total at the time of appraisal. The region’s per capita power consumption of 334 kWh/year exceeded the national average of 236 kWh/year, and power demand had been increasing at 8% each year on average in the previous 4 years. In 1991, thermal power stations constituted 84% of the power-source facilities in the Western Region because there was a plentitude of coal resources in the eastern part of Madhya Pradesh State. Development of hydropower resources, however, had been delayed (63% of power generation in India was thermal-based). The urgent conditions surrounding power demand and supply in the Western Region, as in others, were characterized by the following: (a) Absolute shortage of power generating capacity and low plant load factor 2 of facilities; (b) Difficulty in flexible operations to follow the load curve, as a consequence of heavy dependence on coal-thermal power, which accounts for more than 70% of the total capacity; and (c) High transmission and distribution loss. The construction of a gas-based combined cycle power station, utilizing natural gases from off the coast of Mumbai and Gujarat, would be the core development project in the Western Region; construction of a gas-based thermal power station was indispensable to improving the demand-supply balance in the Western Region. 1.2 Objectives 1 The Western Region, comprising the states of Gujarat, Madhya Pradesh, Maharashtra and Goa and the Union Territories of Daman & Diu and Dadra & Nagar Haveli, has an area of about 851,000 square km, or 29% of the total land area of India. 2 Plant Load Factor (PLF): The ratio of the electrical energy produced by a generating unit in a year to the electrical energy that could have been produced at continuous full-power operation during the year. - 1 -
Transcript
India Gandhar Gas Based Combined Cycle Power Project (I) (II) (III)
Report Date: August 2002 Field Survey: August 2001
1. Project Profile and Japan’s ODA Loan
Location Map of the Project Gandhar Gas Based Combined Cycle Power Plant 1.1 Background
The Western Region of India1 has a relatively large number of commercial and industrial consumers, especially in its core city of Mumbai, and its power consumption accounted for 32% of India’s total at the time of appraisal. The region’s per capita power consumption of 334 kWh/year exceeded the national average of 236 kWh/year, and power demand had been increasing at 8% each year on average in the previous 4 years.
In 1991, thermal power stations constituted 84% of the power-source facilities in the Western Region because there was a plentitude of coal resources in the eastern part of Madhya Pradesh State. Development of hydropower resources, however, had been delayed (63% of power generation in India was thermal-based).
The urgent conditions surrounding power demand and supply in the Western Region, as in others, were characterized by the following:
(a) Absolute shortage of power generating capacity and low plant load factor2 of facilities; (b) Difficulty in flexible operations to follow the load curve, as a consequence of heavy dependence
on coal-thermal power, which accounts for more than 70% of the total capacity; and (c) High transmission and distribution loss.
The construction of a gas-based combined cycle power station, utilizing natural gases from off the coast of Mumbai and Gujarat, would be the core development project in the Western Region; construction of a gas-based thermal power station was indispensable to improving the demand-supply balance in the Western Region.
1.2 Objectives
1 The Western Region, comprising the states of Gujarat, Madhya Pradesh, Maharashtra and Goa and the Union Territories of Daman &
Diu and Dadra & Nagar Haveli, has an area of about 851,000 square km, or 29% of the total land area of India. 2 Plant Load Factor (PLF): The ratio of the electrical energy produced by a generating unit in a year to the electrical energy that could
have been produced at continuous full-power operation during the year.
- 1 -
To construct a 648MW Gandhar Combined Cycle Power Station and Associated Transmission System, in order to cope with the increase of electricity demand and also assure stable electricity supply in the Western Region of India, and thereby contribute to the development of regional industry and stabilize the social conditions.
1.3 Project Scope
I. Power Station and Facilities 1. Construction of power station comprising 3 gas turbine generators of 141.3MW capacity each, 3
heat recovery steam gas boilers and 1 steam turbine generator of approximately 224MW capacity combined cycle, including all associated accessories and auxiliaries, 220kV/400kV switchyard and associated civil works in the main plant area.
2. Construction of cooling towers, water pre-treatment plant, demineralising plant, make-up water and miscellaneous pumps, make-up water piping, workshop equipment and related accessories.
3. Construction of 400 kV Switchyard equipment and auxiliaries, power and control cables, instrument and control system and HV/LV switchgear and any other equipment deemed necessary.
4. Miscellaneous civil works including site levelling and grading, township, administrative building, site enabling works and etc.
II. Associated Transmission System
1. Transmission lines: Construction of the following transmission lines: 220kV D/C Gandhar- Bharuch 400kV D/C Gandhar- Ranasan (Dehgam) 400kV S/C Gandhar- Padghe 400kV S/C Gandhar (NTPC)-Gandhar (GEB3)
2. Sub-station: Construction of the following sub-stations: Bharuch Substation (Extension) Gandhar Substation (Extension) Padghe Substation (Extension) Dehgam Substation (New Construction)
3. Miscellaneous civil works including site levelling and grading, township, administrative building, site enabling and etc.
1.4 Borrower/Executing Agency
Government of India/ National Thermal Power Corporation Ltd. (NTPC) Power Grid Corporation of India Ltd.(Power Grid)
1.5 Outline of Loan Agreement
Loan I Loan II Loan III Loan Amount Loan Disbursed Amount
13,046 million yen 12,911 million yen
42,599 million yen 40,191 million yen
19,538 million yen 14,705 million yen
Exchange of Notes Loan Agreement
November 1989 March 1990
December 1991 January 1992
October 1992 December 1992
Terms and Conditions Interest Rate Repayment Period (Grace Period)
2.5 % p.a.
30 years (10 years)
2.6 % p.a.
30 years (10 years)
2.6 % p.a.
30 years (10 years)
3 Gujarat Electricity Board
- 2 -
Procurement Partially Untied Partially Untied Partially Untied Final Disbursement Date September 1997 April 1997 April 1998
2. Results and Evaluation
2.1 Relevance
Plans to build the Gandhar power station and the associated transmission lines were made to cope with increasing electricity demand and to ensure stable electricity supply in the Western Region of India. At the time of appraisal, the Western Region was facing a serious energy shortage . In order to ease the peaking shortage and overall energy shortage in the Western region, taking the availability of natural gas in the nearby fields into consideration, the Central Electricity Authority (CEA) has promoted the project as the base load station for the Western Region beneficiaries. The construction of Gandhar power station and the associated transmission system have fulfilled development policy as it was then delineated.
The Western Region was still facing a peak shortage4 of 19.1% and an overall energy shortage5 of 10.7% during 2000- 2001. Also, as per the draft program for capacity-addition, according to the 10th plan prepared by CEA, another 11,254MW is planned for the region. Even so, the region is likely to face shortages during the 10th plan implementation period (April 2002 – March 2007). In this context, the project objective has been and still is quite relevant in the Western Region’s power development plan.
2.2 Efficiency in Project Implementation
2.2.1 Project Scope
The project scope mainly consisted of the combined cycle power station and the associated transmission system. This scope was actualized without any major deviation from the design adopted at appraisal6.
2.2.2 Implementation Schedule
a) Power Station The construction of the power station was completed in December 1995, a delay of about 3 months
from the originally scheduled completion date of September 1995. The delay was brought about by the following unforeseeable circumstances:
i) Owing to an out-break of plague in areas near the power station in September 1994, construction workers and expatriates evacuated from the site.
ii) Owing to an earthquake in the Hanshin- Awaji area of Japan in January 1995, the manufacturing and shipping of equipment was delayed.
b) Associated Transmission System (ATS) The construction works for the associated transmission line project segment were completed in May
1998, a delay of about 40 months from the original completion date of January 1995. The above-mentioned reasons also contributed to this delay.
Two main transmission lines out of four sections were completed before the commissioning of the power station, so there was no severe bottleneck in energy evacuation from the power station. However, two lines, namely Gandhar- Padghe and NTPC Gandhar-GTEC7 Gandhar, were commissioned in March 1998 and May 1998, respectively. The delay in commissioning the former line was the result of
4 Peak Shortage: The difference between maximum load requirement and actual peak supply for one year. 5 Energy Shortage: The difference between consumers’ estimated energy requirement and the actual energy supply at the consumer’s end
for one year. 6 Unless otherwise noted, the appraisal, in this report means the appraisal of the third phase. 7 The substation is currently owned by GTEC (Gujarat Electricity Torent Energy Corporation)
- 3 -
time taken to obtain forest clearance for a 4-km stretch. The delay in commissioning the latter line was attributed to the absence of a transmission bay at the GTEC end substation.
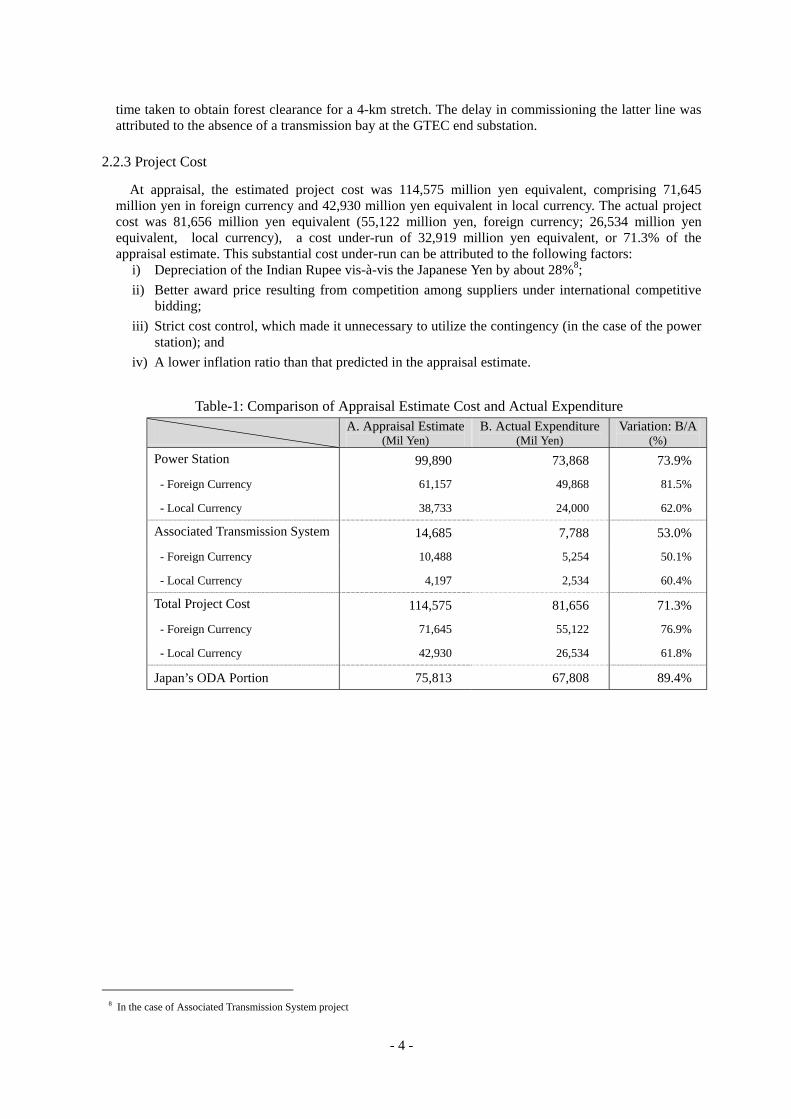
2.2.3 Project Cost
At appraisal, the estimated project cost was 114,575 million yen equivalent, comprising 71,645 million yen in foreign currency and 42,930 million yen equivalent in local currency. The actual project cost was 81,656 million yen equivalent (55,122 million yen, foreign currency; 26,534 million yen equivalent, local currency), a cost under-run of 32,919 million yen equivalent, or 71.3% of the appraisal estimate. This substantial cost under-run can be attributed to the following factors:
i) Depreciation of the Indian Rupee vis-à-vis the Japanese Yen by about 28%8; ii) Better award price resulting from competition among suppliers under international competitive
bidding; iii) Strict cost control, which made it unnecessary to utilize the contingency (in the case of the power
station); and iv) A lower inflation ratio than that predicted in the appraisal estimate.
Table-1: Comparison of Appraisal Estimate Cost and Actual Expenditure
A. Appraisal Estimate (Mil Yen)
B. Actual Expenditure (Mil Yen)
Variation: B/A (%)
Power Station 99,890 73,868 73.9%
- Foreign Currency 61,157 49,868 81.5%
- Local Currency 38,733 24,000 62.0%
Associated Transmission System 14,685 7,788 53.0%
- Foreign Currency 10,488 5,254 50.1%
- Local Currency 4,197 2,534 60.4%
Total Project Cost 114,575 81,656 71.3%
- Foreign Currency 71,645 55,122 76.9%
- Local Currency 42,930 26,534 61.8%
Japan’s ODA Portion 75,813 67,808 89.4%
8 In the case of Associated Transmission System project
- 4 -
2.3 Effectiveness
2.3.1 Net Electric Energy Production and Gas Availability
The Gandhar thermal power station runs on natural gas. For a target operation level of 63 % PLF at the power plant, about 2.25 MCMD9 natural gas is required. However, the actual volume of gas available at commissioning was far below this level. Insufficient supply of natural gas constituted the main constraint on achieving the project’s purposes.
At the time of the 1st Phase Appraisal, the Gandhar gas fields, located 45km away from the power station, were supposed to supply 2.25 MCMD of natural gas through a pipeline. However, gas availability at the Gandhar gas fields had been decreasing, so their gas allotment was revised down to 1.92 MCMD, equivalent to a 53 % PLF level, in the 2nd Phase Appraisal. Ultimately, the allotment was further reduced to 1.50 MCMD, equivalent to 43 % PLF, in the 3rd Phase Appraisal. However, the gas production at the gas fields are expected to increase gradually, and allotment for the Gandhar power station was supposed to increase up to 2.25 MCMD accordingly. Such terms had been agreed to by NTPC and the Oil & Natural Gas Corporation Ltd. (ONGC)10, and were approved by the Government of India.
The power plant started operations between March 1995 and November 1995. Mirroring decreasing gas production levels of the Gandhar gas fields since 199811, gas allotment and energy production also experienced a gradual decline, and both figures fell short of their target levels. To make matters worse,
Figure-1: Monthly Net Energy Production
Figure-2: Average Daily Gas Availability 9 MCMD: Million Cubic Meters per Day 10 ONGC is one of the leading National Oil Companies of the country, engaged mainly in exploration, development and production of
crude oil, natural gas and some value added products. It was established in 1956 in a modest corporate house with strategic national objective to explore and exploit hydrocarbon resources of the country.
11 ONGC had originally projected around 7.5 MCMD of gas reserves during the early nineties in the Gandhar region, but these projections were scaled down to 6.0 MCMD and then to 5.0 MCMD during the late nineties.
- 5 -
forecasts showed that in the future it would continue to be difficult to supply sufficient quantities of gas from the Gandhar gas fields.
In order to overcome the fuel problem, NTPC had negotiated with the Gas Authority of India Ltd (GAIL)12 to start allocation of natural gas through the Hazira-Bijaipur-Jagdishpur (HBJ) pipeline13 but the amount had not been agreed upon. As a result, NTPC decided to convert its gas-fired power station, Kawas, which received natural gas through the HBJ pipeline, into a multi-fuel type (natural gas and naphtha) boiler, with the intention of diverting surplus gas to the Gandhar power station. With the approval of GAIL and the Ministry of Petroleum and Natural Gas, a new pipeline tapping off the HBJ pipeline at Vernar, about 25 km away from the power station, was constructed and commissioned in August 2000. Thereafter, the power station received a steady supply of gas totaling 1.85 MCMD, 1.30 MCMD from the HBJ pipeline and 0.55 MCMD from the Gandhar gas fields.
The heat value of the gas from the HBJ pipeline (9,950 kcal/ Nm3) is much higher than that from the Gandhar gas fields (8,700 kcal/ Nm3). In addition, since the generators were modified14 by the supplier, the efficiency of the power station has improved (see Table-3). As a result, PLF at the power station has almost achieved the target level due to the increased gas supply and the improved gas heat value, although PLF is slightly less than the original target level since the amount of gas supply has not reached the originally required amount.
Table-2: Peak Load and Plant Load Factor of Each Unit 1995-96 1996-97 1997-98 1998-99 1999-00 2000-01 2001-02**
(%) Total 41.10 50.13 45.80 37.50 39.51 48.46 60.89
Note: * During the commissioning test of the power station. ** From April 2001 to July 2001 Source: NTPC
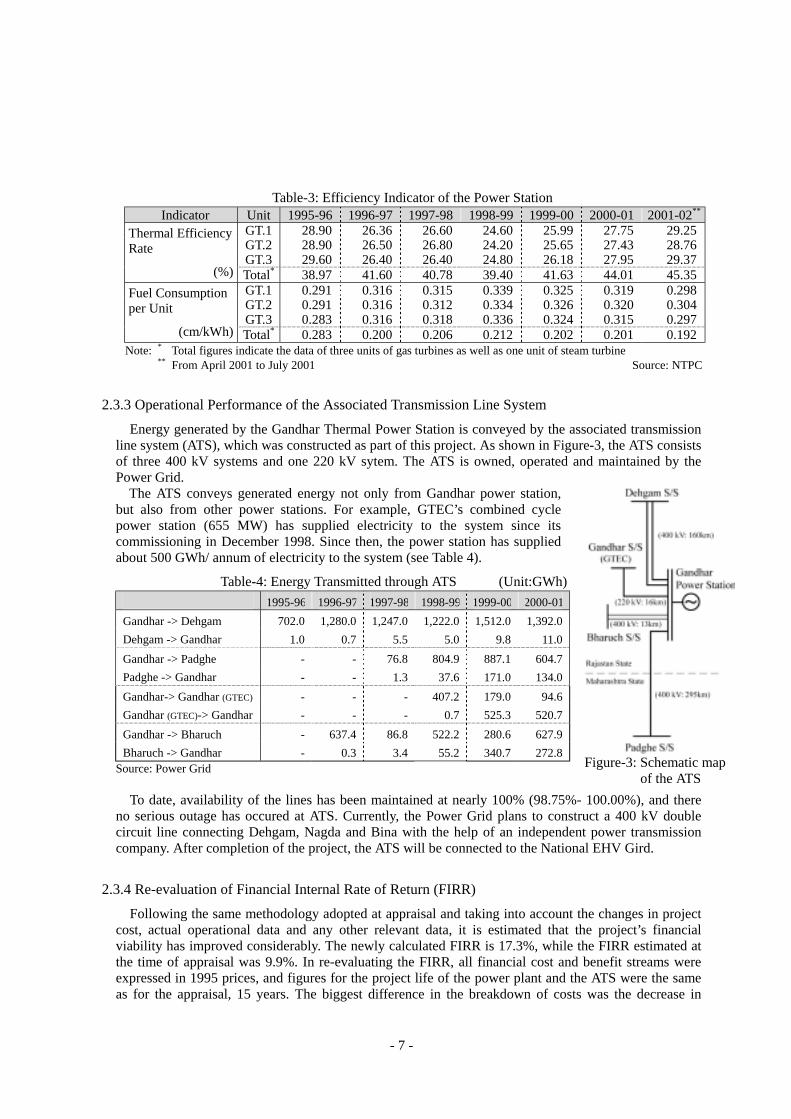
2.3.2 Thermal Efficiency and Other Indicators
The power station consists of three gas turbines of 144.3MW each, and one steam turbine with a capacity of 224.5MW, resulting in a total capacity of 657.4MW. The steam turbine in the power station was designed to generate energy utilizing waste heat from the gas turbines, and thereby achieve better efficiency. This kind of generation system, which is relatively new, is called a combined cycle system. Generally, the average thermal efficiency of combined cycle power stations, at the time of appraisal, was considered to be between 42% and 45%, higher than conventional thermal power stations.
In the case of Gandhar, thermal efficiency16 was 40% on average before the 1999-2000 period. However, with the improvement of PLF as a result of gas availability and the modification of generators, thermal efficiency has been improving.
12 GAIL: Gas Authority of India Ltd. This company is the largest gas transmission and marketing company in India. It was established as
a wholly owned Company of the Government of India in August 1984. Recently the equity held by government has fallen to about 67%.
13 HBJ Pipeline: India’s first major inland, cross-country gas pipeline, which crosses the States of Gujarat, MP, Rajasthan and UP. The pipeline was completed in August 1987 in cooperation with Japan’s ODA Loan.
14 These modifications were implemented during the overhaul of the gas turbines. Overhauling gas turbines 1,2 and 3 was completed in July 1999, April 2000 and December 1999, respectively
15 Since three gas turbines were commissioned at about the same time, the periodic overhaul of these units is required at almost the same time. In order to avoid overlap, NTPC adopted a plan for the rotational operation of each unit. Thus, the plant load factor of each unit has fluctuated.
16 Thermal Efficiency: Ability to transfer heat from a fuel source into energy ((energy production(kWh)*860(kcal/kWh)/(fuel consumption(kg or kl)*fuel caloric amount (kcal/kg or kcal/kl)*100)
- 6 -
Table-3: Efficiency Indicator of the Power Station Indicator Unit 1995-96 1996-97 1997-98 1998-99 1999-00 2000-01 2001-02**
(cm/kWh) Total* 0.283 0.200 0.206 0.212 0.202 0.201 0.192 Note: * Total figures indicate the data of three units of gas turbines as well as one unit of steam turbine ** From April 2001 to July 2001 Source: NTPC
2.3.3 Operational Performance of the Associated Transmission Line System
Energy generated by the Gandhar Thermal Power Station is conveyed by the associated transmission line system (ATS), which was constructed as part of this project. As shown in Figure-3, the ATS consists of three 400 kV systems and one 220 kV sytem. The ATS is owned, operated and maintained by the Power Grid.
The ATS conveys generated energy not only from Gandhar power station, but also from other power stations. For example, GTEC’s combined cycle power station (655 MW) has supplied electricity to the system since its commissioning in December 1998. Since then, the power station has supplied about 500 GWh/ annum of electricity to the system (see Table 4).
Table-4: Energy Transmitted through ATS (Unit:GWh)
To date, availability of the lines has been maintained at nearly 100% (98.75%- 100.00%), and there no serious outage has occured at ATS. Currently, the Power Grid plans to construct a 400 kV double circuit line connecting Dehgam, Nagda and Bina with the help of an independent power transmission company. After completion of the project, the ATS will be connected to the National EHV Gird.
2.3.4 Re-evaluation of Financial Internal Rate of Return (FIRR)
Following the same methodology adopted at appraisal and taking into account the changes in project cost, actual operational data and any other relevant data, it is estimated that the project’s financial viability has improved considerably. The newly calculated FIRR is 17.3%, while the FIRR estimated at the time of appraisal was 9.9%. In re-evaluating the FIRR, all financial cost and benefit streams were expressed in 1995 prices, and figures for the project life of the power plant and the ATS were the same as for the appraisal, 15 years. The biggest difference in the breakdown of costs was the decrease in
- 7 -
capital cost, from 30,819 million rupees at appraisal to the actual expenditure of 25,120 million rupees, in 1995 prices. The actual total cost in 1995 prices is 5,699 million rupees less than the appraisal estimate, or 72.9 % of the appraisal estimate.
2.4 Impact
2.4.1 Positive Socioeconomic Impacts
a) Contribution to improvement of the demand-supply balance in the Western Region Electricity generated by the power station is distributed mainly to Gujarat, Maharashtra, and Madhya
Pradesh by the Power Grid through the ATS. Allocation of power from the power station is decided by mutual agreement of NTPC and each State Electricity Board (SEB). The allocation of electricity from the power station to the various states for 2001 is illustrated in the Figure-4.
At the time of appraisal, the Western Region was facing a serious shortage of energy, a situation that persisted even after the commissioning of the Gandhar Power station. According to the NTPC, during 2000-01, energy demand in the Western Region was 173,975 GWh, whereas energy supply was only 155,384 GWh. This discrepancy translates into a load shedding17 of as much as 18,591 GWh in the region. Peak supply shortages as well as electricity supply shortages in the region had an adverse impact on both domestic and industrial consumers.
This project has made a definite contribution to minimizing the imbalance that adversely affected consumers in the Western Region.
Figure-4 Allocation of Power from the Gandhar b) Improvement of living standards in the vicinity of the power station
NTPC executed various social projects in villages near the power station. These included construction of streetlights, a bus shelter, a concrete paved road, a drinking water pipeline and an underground water tank; renovation of a primary school; construction of toilets and watering places; distribution of utensils for school lunches; and other public works. NTPC organized a cancer detection camp, a skin disease diagnostic center, an eye camp, a family welfare center and a polio education camp. As a result, villagers can go for medical examinations in the power station’s host township, and a medical team from the power station visits surrounding villages periodically. All of these activities have benefited the nearby population directly and indirectly.
2.4.1 Negative Socioeconomic Impacts
a) Land Acquisition/ Relocation for the Power Station 483 acres of land, comprising 16 acres of Government-owned land and 467 acres of private land,
were acquired for the power station site. As no one was living on the land, the project did not involve any relocation or resettlement. Compensation for the 158 landowners totaled 150 million rupees, an amount determined by government regulation. Of the 158 landowners, 37 were given a job in the power station, and another 20 were engaged as construction workers during the construction period. Landowners also benefited from the above-mentioned social projects.
b) Land Acquisition/ Relocation for ATS Project
The transmission lines were routed through barren land where there were no residents; in this case,
no land acquisition was required for transmission towers, as per provisions in the Indian Electricity
- 8 -
17 Load Shedding: Removal of pre-selected demand from a customer’s electric system in the facility to maintain electric load below a
certain level.
Laws, and no claims have been reported as to the land usage.
Consequently, there was no relocation/ land acquisition in the transmission line project. The ATS
project involved the extension of two existing substations for which land was already available;
consequently, no additional land was acquired for these substations. A total of 82 ha of land was
acquired for the new construction of the Dehgam substation. However, as this barren land originally
belonged to the state government and there were no people living on the land, land acquisition was executed without any complications.
2.4.2 Environmental Impact
a) The Power Station’s Environmental Impact To prevent negative impacts on the surrounding area, the power station is equipped with water
injection facilities in the combustion chamber, which ensure a low level of NOX emissions. As a consequence, the results of NOX emission (42-45ppm) monitoring showed emissions below the permissible limit of 50ppm18. In addition, as the natural gas used in the power station contains little sulphur, the emission of sulphur oxide is negligible.
The station’s 70m chimneys ensure still lower concentrations of air pollution. The environmental monitoring group (EMG) of the power station monitors ambient air quality three times a month, and records emissions every week. All monitoring results complied with the environmental standards of the State Pollution Control Board. Monitoring records are shown below.
Table-5: Monitoring Result of Ambient Air Quality (April 1999- March 2000)
NOx 80g/mμ3 9.0 – 26.0 11.0 – 23.0 12.0 – 24.0 11.0 – 14.5 10.0 – 17.6 Source: NTPC, Environmental Monitoring Group Note: *a: SPM= Suspended Particulate Matter *b: Environmental standards for residential and rural area regulated by State Pollution Control Board. The power station takes in water from the Narmada River, uses it for cooling purposes, and
discharges the effluent into the same river. As the effluent water is treated in the treatment plant, the parameters of water quality are maintained well within the standards prescribed by the State Environmental Pollution Control Board. The EMG monitors water quality three times a month, and monitoring results for 1999-2000 are shown in the table below.
Table-6: Monitoring Result of Water Effluent Quality (April 1999- March 2000)
pH TSS*a Oil & Greases Iron Copper Chromium Zinc Phosphate
Source: NTPC, Environmental Monitoring Group Note: *a: TSS= Total Suspended Solid, *b: Environmental standards regulated by State Pollution Control Board.
The EMG also monitored noise at the boundary of the power station, and recorded a level of 50dB, well within the environmental standard. In addition to noise level reduction efforts, NTPC developed the 30 m-wide green belt all around the power station’s borders, where over 130,000 trees have been planted. Considering all these measures as a whole, it can be said that the power station has not had
18 Environmental standards regulated by State Pollution Control Board
- 9 -
significant environmental impacts19.
b) The Associated Transmission System’s Environmental Impact Operation and maintenance of the transmission line and substation do not pollute the surrounding
environment. The only problem concerning the ATS project arose during the construction period. A small stretch (3.89 km) of the Gandhar–Padghe section passes through a forested area in the Thane district of Maharashtra (20.247 ha). The Power Grid obtained forest clearance from the Ministry of Environment and Forest, and afforested 20.5 ha of non-forest land in the Aurangabad district in Maharashtra state as compensation. Since the remaining sections of the transmission line and the newly constructed substation were located in barren areas, the negative impact of the project has been negligible.
2.5 Sustainability
2.5.1 Organization in Charge of Operation and Maintenance
The operation and maintenance of the power station and the ATS are undertaken by NTPC and Power Grid, respectively.
a) National Thermal Power Corporation Ltd. (NTPC) The power station has been well operated and maintained in a proper manner by NTPC, which
is a public sector company wholly owned by the Government of India. NTPC is the largest thermal-power generating company in the country. It was incorporated in 1975, with the objective of planning, promoting and organizing the integrated development of thermal power in the country. The presently commissioned capacity of NTPC is 19,435 MW. As of March 31, 2001, NTPC's share of the total installed capacity of the country amounted to 19.3%. NTPC contributed 26% of the total power generation of the country during 2000-2001(FY2000). Performance indicators, in terms of employee efficiency, as shown in the table below, are improving every year.
As of the end of 2000, the power station had 217 employees, including 69 personnel in the operation section, and 45 personnel in the maintenance section. Since Gandhar is highly automated, there are fewer employees there than at other power stations. The technical skill of both regular staff and management level is said to be higher than at other power stations owned by the SEB20. This level of technical skill was obtained through a well-prepared training program. In addition, routine maintenance, preventive maintenance and the overhaul of each unit are executed according to the schedule recommended by the supplier.
During the commissioning test, there were some problems with the condenser tube, water injection system and pre-treatment plant. Due to these problems, the power station had to shut down frequently in the preliminary phase of operation. However, they were completely resolved during the first year, and since then, the power station has experienced no major mechanical trouble. NTPC’s capability in
19 The power station already obtained ISO 14001, which is an environmental management standards developed by the International
Organization for Standardization (ISO), one of the world’s principal voluntary standards development bodies. The ISO 14000 standards are designed to provide an internationally recognized framework for environmental management, measurement, evaluation and auditing.
20 In 2001, Six of the nation’s 10 best power stations in terms of PLF belonged to NTPC. In addition, in a global electricity utility benchmarking survey for the year 1998 conducted by Datamonitor, U.K., NPTC has been ranked the second most efficient large thermal utility in terms of capacity utilization.
- 10 -
executing operation, maintenance and management of the power station is deemed satisfactory.
b) Power Grid Corporation of India Ltd. (Power Grid) The operation and maintenance of the project facilities are executed by the Dehgam division of the
Power Grid. The Power Grid, established in 1989 as a public sector company wholly owned by the Government of India, , carries 40% of the generated power and one-third of the installed power in the country. It is responsible for: i) development of an optimal evacuation system for the central sector and mega power generation projects, ii) strengthening the regional transmission system and establishing inter-regional links leading to the formation of the National Power Grid, and iii) operation and maintenance of these transmission systems.
The Dehgam division of the Power Grid is responsible for the complete evacuation of the Gandhar power station, and partial evacuation of Kawas, KAPP, and the Korba and Vindhyachal power stations. In the Dehgam substation, which was newly constructed under this project, 43 employees are engaged in operation and maintenance and an additional 83 people are in charge of maintenance of the transmission line in the command area of the Dehgam division. Operation and maintenance are executed according to the manual provided by the supplier, and funded by the division’s internal budget. As the transmission system was well maintained, the availability of the system in the Western Region was 99.65 %, as against the MOU target of 98.30 %, during 1999-2000. There is no major constraint on the operation and maintenance of the project facilities.
2.5.2 Financial Viability of the O&M Agencies
The power station sells its energy to SEBs through the Power Grid’s transmission line. Each SEB has to pay an electricity tariff to NTPC and a transmission fee to Power Grid. These tariffs are decided by the Central Electricity Regulatory Committee (CERC), which was constituted on 2nd July 1998 as part of the reform of the power sector. CERC is responsible for regulating i) the tariff of generating companies owned or controlled by the Central Government, and ii) inter-state transmission of energy, including the tariff of the transmission utilities. CERC also aids and advises the Central Government in the formulation of tariff policy, which must be fair to the consumers and to the electric utilities.
In accordance with CERC guidelines, the selling price and transmission fee are charged to beneficiary states using parameters such as: i) operation and maintenance cost, ii) depreciation cost, iii) interest on loan, iv) working capital fund v) actual fuel cost, so that NTPC and Power Grid can remain financially viable entities. Consequently, the financial condition of the companies is fair. The profit and loss performance of the companies is shown in the tables below.
Table-8: Profit and Loss of NTPC for the Last 5 years (Unit: Million rupees)
1995-96 1996-97 1997-98 1998-99 1999-00 1. Revenue from Sale of Energy 83,441.9 98,396.5 124,125.7 140,573.7 161,017.5 2. Cost of Sales 48,807.1 55,512.9 72,867.4 80,249.0 96,438.6 3. Depreciation 11,614.6 14,725.5 17,444.1 19,863.8 20,831.1 4. Interest and Finance Charges 9,492.9 10,930.2 13,860.1 10,829.6 9,827.6 5. Provision for Tax 1.2 433.5 1,197.5 1,003.5 2,063.4 6. Net Profit after Tax 13,526.1 16,794.3 21,535.0 28,157.3 34,245.3
Source: NTPC
Table-9: Profit and Loss of the Power Grid for the Last 5 years (Unit: Million rupees) 1995-96 1996-97 1997-98 1998-99 1999-00
1. Revenue from Transmission Charge 8,611.9 9,342.2 12,465.3 15,770.1 17,895.0 2. Other Revenue 1,223.9 1,239.3 1,881.5 1,932.5 3,343.7 3. Cost of Sales 1,966.0 2,226.8 3,006.2 3,712.2 4,454.1 4. Depreciation 3,204.0 3,300.4 3,662.6 5,211.4 5,776.3 5. Interest and Finance Charges 1,966.2 1,996.7 3,457.4 3,808.7 4,201.9 6. Provision for Tax 0.1 0.1 849.0 526.1 797.6 7. Net Profit after Tax 2,759.5 3,057.5 3,371.6 4,444.2 6,008.8
Source: Power Grid
- 11 -
The accounts receivable of Central Power Sector Utilities (CPSUs)21, including NTPC and the Power
Grid from SEBs, have been increasing. In the case of NTPC and the Power Grid, the accounts receivable as of 31st March 2000 reached 89,164.4 million rupees and 12,363.9 million rupees, respectively, which equals 55.4 % and 62.47 % of sundry debtors to sales, again respectively. To ensure the financial health of the O&M agencies, settlement of the SEB dues is imperative.
An expert group assigned by the Government of India and tasked with finding a solution to the dues settlement problem, submitted a report22 in May 2001. The following transactions were recommended:
- 50 % of the interest/ surcharge on delayed payments should be waived. The rest of dues amounting to full principal amounts, as well as the remaining 50 % of the interest/ surcharges, should be securitized through tax- free bonds issued by the respective State Governments.
- If SEBs do not default on their current dues and adhere to the performance milestones, such as metering of distribution feeders and improvement of revenue realization, as defined by the SERCs23, CPSUs should pay a cash incentive equal to 2.0 % of the value of the bonds.
- If SEBs open and maintain Letters of Credit until the end of December 2001, CPSUs should pay them a one-time cash incentive equal to 2.0 % of the value of the bonds.
2.5.3 Future Prospect of Natural Gas Availability
As mentioned already, starting in August 2000 , the HBJ pipeline became a main source of gas supply for the power station. The HBJ pipeline system was originally designed to handle 18.2 MCMD. Along with the development of its gas fields, known as Bombay High24, and an increase in gas consumption, the system’s gas handling capacity was upgraded to 33.4 MCMD in the 1997-98 period. Moreover, GAIL is to undertake a further doubling of capacity on the HBJ pipeline. Work on the capacity expansion is to begin in 2002.
With the abundant gas deposits in Bombay High and the expansion of the HBJ pipeline, gas availability for the power station should not be a problem in the future. NTPC continues to negotiate with GAIL for further gas allocation.
21 CPSUs, Central Power Sector Undertakings, made up of 9 generation companies, one transmission company, and two finance
corporations, were constituted to support the SEB’s. They are 100% owned by the central government. 22 Report of the expert group “Settlement of SEB Dues”, May 2000, Planning Commission 23 SERC: State Electricity Regulatory Committee 24 Confirmed deposits in the Bombay High gas fields amounted to 369 billion cubic meters in 1999, representing 53% of natural gas
deposits in India.
- 12 -
Comparison of Original and Actual Scope Item Original Plan Actual
(1) Project Scope 1. Power station and facilities a) Gas turbine generator b) Waste water recovery boiler c) Steam turbine generator d) Other equipment
3Nos. (capacity 141MW) 3Nos. 1Nos. (capacity 282MW) - 220kV/400kV Switchyard - Cooling towers - Water Pre-treatment plant - De-mineralizing plant - Water softening plant - Workshop equipment - AC and ventilation - Power and control cables - Instrument and Control system - HV/LV Switchgear
3Nos. (capacity 144.3MW) As Planned 1No. (capacity 224.5MW)
As Planned As Planned As Planned As Planned As Planned As Planned As Planned As Planned As Planned As Planned
2. Associated Transmission System a) Gandhar-Bharuch b) Gandhar-Ranasan (Dehgam) c) Gandhar-Padghe d) Gandhar (GEB)-Gandhar (NTPC) e) Sub-station
(3) Project Cost Foreign currency Local currency Total ODA loan portion Exchange Rate
71,645 million yen 9,691 million rupees 114,575 million yen 75,183 million yen
1.0 rupee= 4.43 yen (as of 1992)
55,122 million yen 26,534 million yen 81,656 million yen 67,808 million yen
1.0 rupee= 3.19 yen (Average of ATS project)
- 13 -
Independent Evaluator’s Opinion on Gandhar Gas Based Combined Cycle Power Project (I) (II) (III)
Mr. M. C. Gupta Director, Indian Institute of Public Administration
It is an extremely beneficial project – socio-economically to the Western Region of India, particularly the State of Gujarat. In fact, Gujarat is one of the fastest developing states of India with an impressive growth rate in spite of some major natural disasters like the earthquake and some social tensions. Unfortunately, like the other states of the Indian Union, Gujarat has also suffered from power shortage and may continue to face problem for some more time. On 31st March, 2002 (at the end of the Ninth Plan) it was expected to have its own installed capacity of 7176 M.W. and another 1517 M.W. as its share in Central Power Stations in the Western Region including 234 M.W. from the Gandhar Gas Based Project, set up and operated by NTPC. However, at the end of 2000-1, Gujarat still had a peak deficit of 11.5% and an energy deficit of 9.7%. Hence, the critical relevance of the 650MW Gandhar Project and the continued relevance thereof. Its relevance is apparent, both for NTPC, an undertaking of Government of India as also for the State of Gujarat.
The project has had a positive impact in realizing its objectives of coping with increased electricity demand and assuring stable electricity supply in the Western Region of India resulting in Socio-economic development. The project has a unique feature – it was commissioned at a cost much lower than was originally projected. This speaks, among others of an efficient project commissioning which is highly admirable and should enhance its impact and per unit cost of generation. The project continues to be justified/relevant at base load operation from demand-supply point of view. In addition to contributing to economic development in the region through energy supply, the project has made significant social impact with minimum environmental impact. Emission and ambient air quality such as SPM, SOx and NOx are regularly measured at 5 points and the parameters are reported to be within permissible limits.
In regard to sustainability and the future prospects, two issues arise: one in positive while the other is disturbing. The positive feature is in regard to NTPC’s state of health, its work culture and its strengths. It is doing extremely well. Its country wide PLF is of a high order as also its profits. The performance parameters of the Gujarat Electricity Board (GEB) are also fairly impressive. In this respect the future of the project would look assuring. However, the disturbing feature is the availability of gas for the Gandhar Project. The project needed 3 MCMD for an 80% PLF and 2.25 MCMD for PLF of 62.8% as was planned. Unfortunately the availability from the original source (Gandhar field) has reduced from 1.55 MCMD in 1995-96 to 0.46 MCMD in 2001-2. Fortunately, the additional linkage to HBJ is compensating for this shortfall and in 2001-2 HBJ linkage gave it 1.49 MCMD, making a total of 1.95 MCMD. It would be appropriate if this project receives its due priority from the Government of India and all others and at least 2.25 MCMD of gas, if not 3 MCMD is available on an assured basis. Already heavy loss of generation has occurred because of short supply of gas: over 12 B units in a five years period between 1997-98 and 2001-2. the reported commitments being made to other users like Essar Steel, RIL and Torrent’s Power Plant at the expense of the Gandhar Plant need to be reconsidered. In any case, JBIC seems to be impressed with the funding needs for the power sector in India like the Sardar Sarover Multi Purpose ITEP (1450MW) in Gujarat itself.
The evaluation Report is well written and precise. On one aspect, however, I have a different perception. While analyzing the reasons for the substantial cost under run (page 4 of the Report), I would put NTPC’s Project management efficiency as one of the factors because the local currency (actual) expenditure itself was only 61.8% of that originally envisaged as against 76.9% in the case of the foreign currency cost. The rest is fine.