Page 112 find SPARK RESEARCH on (SPAK <go>) RESEARCH ANALYSTS INTERNET SECTOR UPDATE 24 June 2019 IndiaMART IPO SOUMITRA CHATTERJEE [email protected]+91 22 6176 6805 OMPRAKASH KAVADI [email protected]+91 44 4344 0096 INDIA INTERNET SECTOR IndiaMART IPO offers investors an additional play on the Indian Internet sector, which currently has only three listed players viz. Info Edge, Just Dial (Rating: REDUCE, target price: Rs. 530) and Matrimony (Not Rated). Our preferred pick remains Info Edge (Rating: BUY, target price: Rs. 2,290), as it is a verticalized player with leadership position in all its verticals except the matrimonial segment. This verticalization brings in pricing power (7.5% CAGR in recruitment segment for Info Edge and 7% CAGR for Matrimony ltd versus -1% CAGR for Just Dial during FY14-19) and improves the quality of revenue and earnings. Whilst IndiaMART pricing has improved 7% CAGR over the last 3 years and is greater than 2x of Just Dial’s pricing thereby indicating stickiness from suppliers, based on our channel checks with over 75 suppliers across the country (slide 5), the stress in the MSME sector (slide 6 and 7) could be the single biggest risk for IndiaMART’s revenue and pricing growth (deferred revenue is 85% of cash and bank balance). The recent appreciation in the stock price of Just Dial (up 56% in last 3 months) followed by the launch of IPO of IndiaMART reminds us of the 56% appreciation in the stock price of Navneet Education from December 2016 till May 2017, when IPO of SChand was launched and fully subscribed. In sectors where investible options are limited, investors tend to lean towards the best available option till the investible universe within the sector expands and the Indian Internet sector is one such sector. Thus, the appreciation in stock price of Just Dial and expected valuations of IndiaMART can pose valuation related risks for a segment, where growth headwinds in the near term are a possibility. Just Dial is the only comparable company Comparable with Just Dial and provides an additional option to play Indian Internet sector – While Info Edge (recruitment, real estate and marriage classifieds) and Matrimony (marriage classifieds) are vertical players, Just Dial and IndiaMART are horizontal players and operates in the SME classified segment with just one exception - IndiaMART operates in the B2B segment while Just Dial operates in B2C segment and are hence comparable on growth profile, margins, balance sheet, return ratios and metrics. Therefore IndiaMART offers investors an additional option to play the Indian Internet sector. IndiaMART is the largest online B2B marketplace for business products and services with approximately 60% market share of the online B2B classifieds space in India (FY17 data). IndiaMART’s growth in billings is significantly higher than that of Just Dial – The companies in the Indian internet segment enjoys a negative working capital cycle, as subscriptions are collected upfront and services are delivered over the tenure of the contract, which could be one year or even more. Thus, the cash generation (pre tax OCF as % of EBITDA) is higher than 100%. The flip side of this negative working capital argument is slowdown in revenue growth, which impacts deferred revenue growth and consequently cash generation negatively. Thus, the metric to look into is growth in billings, which is the balancing figure computed using opening and closing deferred revenue and revenue accounted in the quarter/year. IndiaMART’s growth in billings has been 36% over the last two years, which is higher than Just Dial’s 8% in FY18 and 15% in FY19. However, roughly, 40% of the billings is from services to be rendered beyond 12 months and hence consistent growth in economy and MSME segment is vital. Channel checks with suppliers – Our channel checks with 75 vendors across the 4 regions of country indicates, stress in the MSME segment as the single biggest risk, which can impact FY21 growth expectations of IndiaMART. Amongst various parameters surveyed, ~46% of vendors have seen an improvement in their sales post listing on IndiaMART while ~54% have not seen any impact on their sales post listing. Brief contours of the IPO and valuations – IndiaMART IPO opens on 24 th June 2019 and closes on 26 th June 2019 with entire 4.9mn shares being an offer for sale translating to an amount of Rs. 4.76bn at Rs. 973 per share. At market cap of Rs. 28bn, this translates to FY19 valuation of 5.6x on revenue and is comparable to Just Dial’s FY19 valuation on revenue. However, on EV basis, IndiaMART is 6% premium to revenues, 60% on EBITDA and 27% discount on OCF. As IndiaMART’s 85% of the cash balance is in the form of deferred revenues (cash collected upfront but services to be delivered over next 1 year or multiple years), investors should remove the deferred revenues from cash to make valuations comparable, as in event of any mid term cancellation of subscription, cash balance would come down and future revenue would get impacted. On a deferred revenue adjusted basis, IndiaMART is 21% and 80% premium on revenues and EBITDA to Just Dial and only 16% discount to Pre Tax OCF. -10% -5% 0% 5% 10% 15% 20% 25% Jun-18 Sep-18 Dec-18 Mar-19 Jun-19 NSE IT index Sensex Stock performance (%) 1m 3m 12m Sensex 0.6% 3.2% 11.4% CNXIT 2.2% 4.6% 18.1%
IndiaMART IPO offers investors an additional play on the Indian Internet sector, which currently has only three listed players viz. Info Edge, Just Dial (Rating: REDUCE, target price: Rs. 530) and Matrimony (Not Rated). Our preferred pick remains Info Edge (Rating: BUY, target price: Rs. 2,290), as it is a verticalized player with leadership position in all its verticals except the matrimonial segment. This verticalization brings in pricing power (7.5% CAGR in recruitment segment for Info Edge and 7% CAGR for Matrimony ltd versus -1% CAGR for Just Dial during FY14-19) and improves the quality of revenue and earnings. Whilst IndiaMART pricing has improved 7% CAGR over the last 3 years and is greater than 2x of Just Dial’s pricing thereby indicating stickiness from suppliers, based on our channel checks with over 75 suppliers across the country (slide 5), the stress in the MSME sector (slide 6 and 7) could be the single biggest risk for IndiaMART’s revenue and pricing growth (deferred revenue is 85% of cash and bank balance). The recent appreciation in the stock price of Just Dial (up 56% in last 3 months) followed by the launch of IPO of IndiaMART reminds us of the 56% appreciation in the stock price of Navneet Education from December 2016 till May 2017, when IPO of SChand was launched and fully subscribed. In sectors where investible options are limited, investors tend to lean towards the best available option till the investible universe within the sector expands and the Indian Internet sector is one such sector. Thus, the appreciation in stock price of Just Dial and expected valuations of IndiaMART can pose valuation related risks for a segment, where growth headwinds in the near term are a possibility.
Just Dial is the only comparable company
Comparable with Just Dial and provides an additional option to play Indian Internet sector – While Info Edge (recruitment, real estate and marriage classifieds) and Matrimony (marriage classifieds) are vertical players, Just Dial and IndiaMART are horizontal players and operates in the SME classified segment with just one exception - IndiaMART operates in the B2B segment while Just Dial operates in B2C segment and are hence comparable on growth profile, margins, balance sheet, return ratios and metrics. Therefore IndiaMART offers investors an additional option to play the Indian Internet sector. IndiaMART is the largest online B2B marketplace for business products and services with approximately 60% market share of the online B2B classifieds space in India (FY17 data).
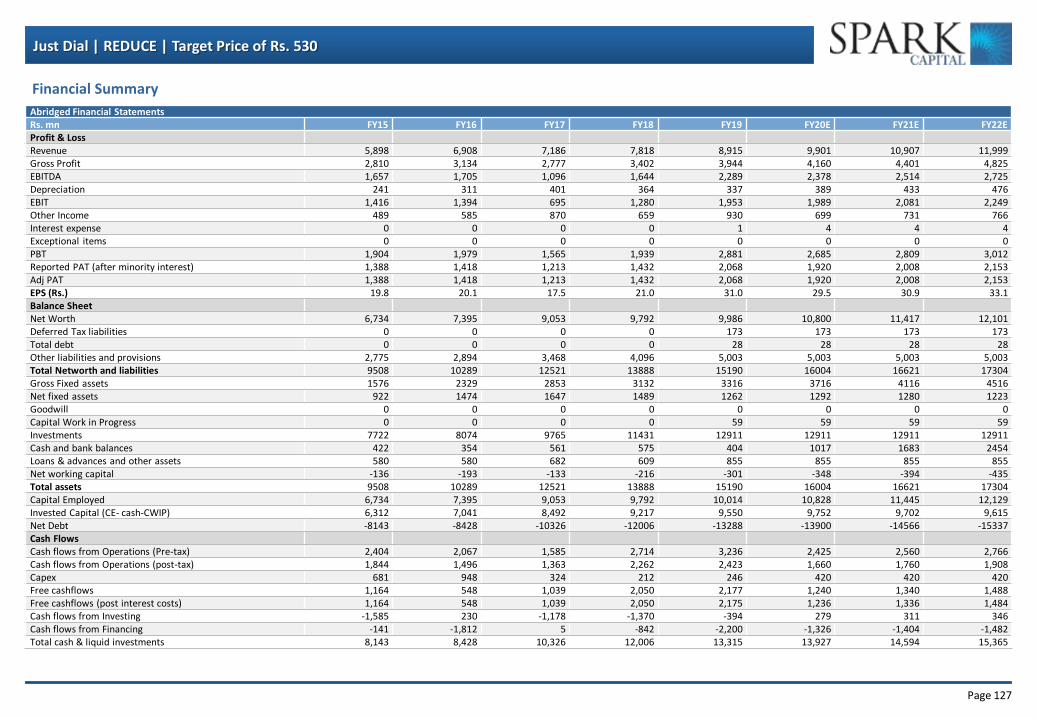
IndiaMART’s growth in billings is significantly higher than that of Just Dial – The companies in the Indian internet segment enjoys a negative working capital cycle, as subscriptions are collected upfront and services are delivered over the tenure of the contract, which could be one year or even more. Thus, the cash generation (pre tax OCF as % of EBITDA) is higher than 100%. The flip side of this negative working capital argument is slowdown in revenue growth, which impacts deferred revenue growth and consequently cash generation negatively. Thus, the metric to look into is growth in billings, which is the balancing figure computed using opening and closing deferred revenue and revenue accounted in the quarter/year. IndiaMART’s growth in billings has been 36% over the last two years, which is higher than Just Dial’s 8% in FY18 and 15% in FY19. However, roughly, 40% of the billings is from services to be rendered beyond 12 months and hence consistent growth in economy and MSME segment is vital.
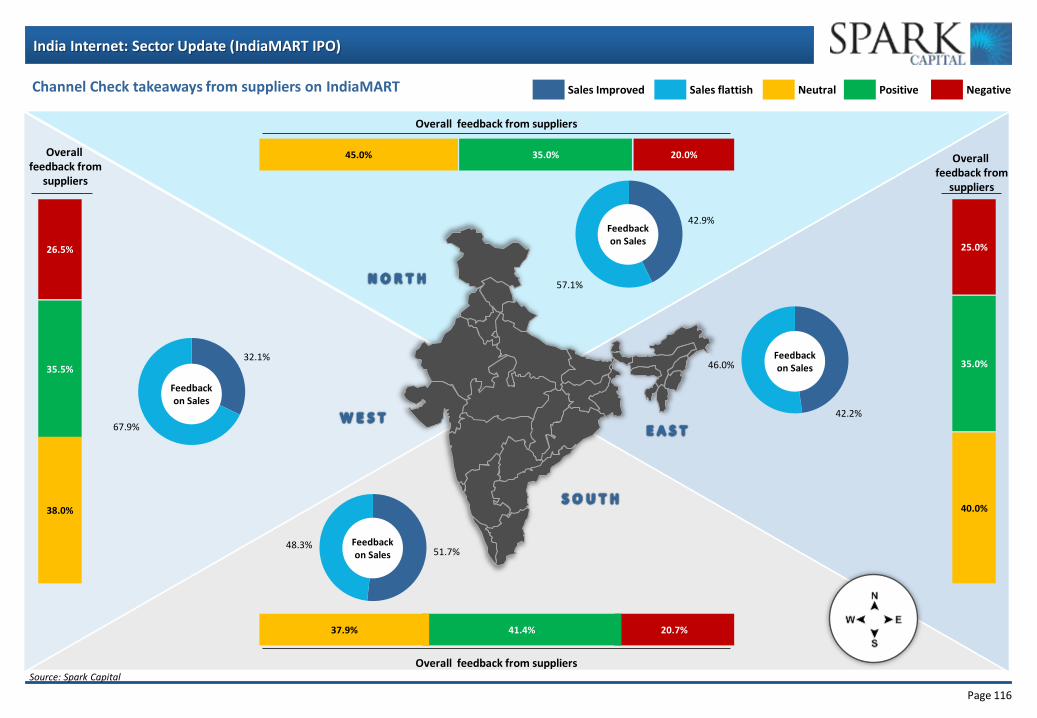
Channel checks with suppliers – Our channel checks with 75 vendors across the 4 regions of country indicates, stress in the MSME segment as the single biggest risk, which can impact FY21 growth expectations of IndiaMART. Amongst various parameters surveyed, ~46% of vendors have seen an improvement in their sales post listing on IndiaMART while ~54% have not seen any impact on their sales post listing.
Brief contours of the IPO and valuations – IndiaMART IPO opens on 24th June 2019 and closes on 26th June 2019 with entire 4.9mn shares being an offer for sale translating to an amount of Rs. 4.76bn at Rs. 973 per share. At market cap of Rs. 28bn, this translates to FY19 valuation of 5.6x on revenue and is comparable to Just Dial’s FY19 valuation on revenue. However, on EV basis, IndiaMART is 6% premium to revenues, 60% on EBITDA and 27% discount on OCF. As IndiaMART’s 85% of the cash balance is in the form of deferred revenues (cash collected upfront but services to be delivered over next 1 year or multiple years), investors should remove the deferred revenues from cash to make valuations comparable, as in event of any mid term cancellation of subscription, cash balance would come down and future revenue would get impacted. On a deferred revenue adjusted basis, IndiaMART is 21% and 80% premium on revenues and EBITDA to Just Dial and only 16% discount to Pre Tax OCF.
-10%
-5%
0%
5%
10%
15%
20%
25%
Jun-1
8
Se
p-1
8
Dec-1
8
Ma
r-19
Jun-1
9
NSE IT index Sensex
Stock performance (%)
1m 3m 12m
Sensex 0.6% 3.2% 11.4%
CNXIT 2.2% 4.6% 18.1%
Page 113
India Internet: Sector Update (IndiaMART IPO)
Company Factsheet
Corporate Factsheet
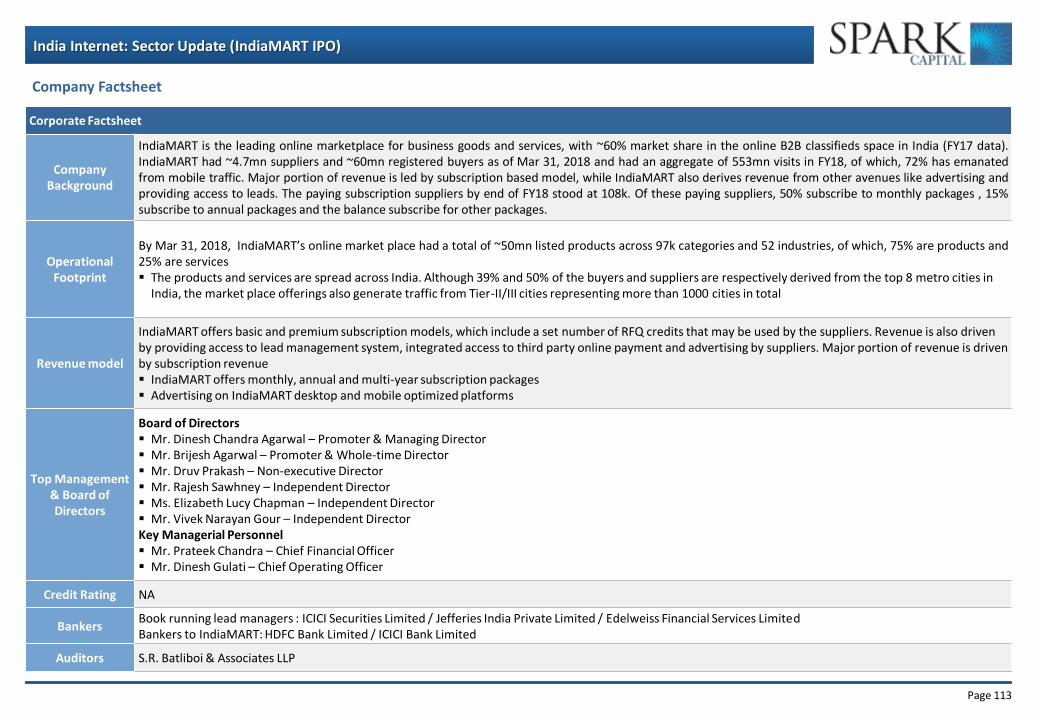
Company Background
IndiaMART is the leading online marketplace for business goods and services, with ~60% market share in the online B2B classifieds space in India (FY17 data). IndiaMART had ~4.7mn suppliers and ~60mn registered buyers as of Mar 31, 2018 and had an aggregate of 553mn visits in FY18, of which, 72% has emanated from mobile traffic. Major portion of revenue is led by subscription based model, while IndiaMART also derives revenue from other avenues like advertising and providing access to leads. The paying subscription suppliers by end of FY18 stood at 108k. Of these paying suppliers, 50% subscribe to monthly packages , 15% subscribe to annual packages and the balance subscribe for other packages.
Operational Footprint
By Mar 31, 2018, IndiaMART’s online market place had a total of ~50mn listed products across 97k categories and 52 industries, of which, 75% are products and 25% are services The products and services are spread across India. Although 39% and 50% of the buyers and suppliers are respectively derived from the top 8 metro cities in
India, the market place offerings also generate traffic from Tier-II/III cities representing more than 1000 cities in total
Revenue model
IndiaMART offers basic and premium subscription models, which include a set number of RFQ credits that may be used by the suppliers. Revenue is also driven by providing access to lead management system, integrated access to third party online payment and advertising by suppliers. Major portion of revenue is driven by subscription revenue IndiaMART offers monthly, annual and multi-year subscription packages Advertising on IndiaMART desktop and mobile optimized platforms
Top Management & Board of Directors
Board of Directors Mr. Dinesh Chandra Agarwal – Promoter & Managing Director Mr. Brijesh Agarwal – Promoter & Whole-time Director Mr. Druv Prakash – Non-executive Director Mr. Rajesh Sawhney – Independent Director Ms. Elizabeth Lucy Chapman – Independent Director Mr. Vivek Narayan Gour – Independent Director Key Managerial Personnel Mr. Prateek Chandra – Chief Financial Officer Mr. Dinesh Gulati – Chief Operating Officer
Credit Rating NA
Bankers Book running lead managers : ICICI Securities Limited / Jefferies India Private Limited / Edelweiss Financial Services Limited Bankers to IndiaMART: HDFC Bank Limited / ICICI Bank Limited
Auditors S.R. Batliboi & Associates LLP
Page 114
India Internet: Sector Update (IndiaMART IPO)
IndiaMart product distribution across industries
Source: Company data, Spark Capital
8%
9%
4%
7%
4%
3%
3% 3%
3% 3%
53%
Apparel Clothing and garments
Construction and Building materials
Electronics and Electrical
FMCG, Vegetables, Fruits and Grocery
Medical, Surgical and Healthcare
Auto, spare parts and auto ancs
Travel and Tourism
IT Hardware and Software
Educational Institutes
Trade Event Organiser
Others
Packages
Silver
7 RFQ each week for Rs. 25,000 p.a.
Gold
Silver package with TrustSEAL
14 RFQ each week from Rs. 25,000
p.a. to Rs. 50,000 p.a.
Maximiser
21 RFQ each week from Rs. 25,000
p.a. to Rs. 50,000 p.a.
Platinum
Priority listing plus all benefits of Gold and Silver package
City categorization definition No. Buyers (%) Suppliers (%)
Population >1 lacs <5 lacs (excluding top 77) 394 19% 13%
Remaining Cities 15% 10%
IndiaMART provides a robust two-way discovery marketplace connecting buyers and suppliers.
Buyers locate suppliers on the marketplace, including both Indian SMEs, and large corporates, by viewing a webpage containing the supplier’s product and service listings, or a “supplier storefront”, or by posting requests for quotes called “RFQs” or “BuyLeads”.
IndiaMART’s marketplace offerings from which buyers can search for and view product and service listings cover a widespread range of industries spread across India, rather than relying on a single target industry or type of geography.
As of March 31, 2019, IndiaMART has organized listings across 54 industries.
IndiaMART premium number service, operated by Third Party Service Provider, allotted unique phone numbers to approximately 470,053 suppliers as of March31, 2019, and connects calls directly to suppliers while also providing them with software-based missed call alerts.
IndiaMart – A brief overview
Revenue model for IndiaMART
Page 115
India Internet: Sector Update (IndiaMART IPO)
Particulars FY16 FY17 FY18 FY19 Aggregate visits (in mn) 262 326 553 724 Growth 24.3% 69.6% 30.9% Aggregate visits from Mobile (in mn) 155 205 397 550 Growth 32.4% 93.8% 38.6% % of visits from Mobile 59.0% 62.9% 71.8% 76.1% Business enquiries delivered to IndiaMART (in mn) 115 157 290 449 Growth 36.3% 84.9% 54.8% Daily unique buyer request (in mn) NA NA 52.6 72.5 Repeat buyers calculated on the basis of the past 90 days NA NA 52% 55% Types of industries listed in IndiaMART NA NA 52 54 Supplier Storefronts (in mn) 2.3 3.2 4.7 5.6 Growth 36.2% 49.4% 17.6% Paying subscription suppliers 72,335 96,025 1,08,347 1,29,589 Growth 32.8% 12.8% 19.6% Registered Buyers (in mn) 27 39 60 83 Growth 45.5% 51.9% 38.3% Revenue per paid supplier (Average) 33,974 37,748 40,173 41,801 Growth 11% 6% 4% India Mart Premium members NA NA 4,72,855 4,70,053 Revenues 2,458 3,178 4,105 4,973 Growth 39.6% 29.3% 29.2% 21.1% Employee Costs 1,819 2,097 1,949 2,223 Growth 52.9% 15.3% -7.1% 14.1% Other Expenses 1,894 1,625 1,690 1,890 Growth 94.5% -14.2% 4.0% 11.8% EBITDA -1,256 -544 466 860 Growth -211.7% 143.3% 185.7% 84.4% EBITDA (%) -51.1% -17.1% 11.4% 17.3% OCF -537 6 1,800 2,603 OCF as % of EBITDA 42.7% -1.1% 386.1% 302.7% Deferred Revenue (Rs Mn.) 2,361 2,932 3,920 5,860 Growth 24.2% 33.7% 49.5% Deferred Revenue as proportion of LTM Revenues 96.1% 92.3% 95.5% 117.8% Deferred Revenue as proportion of Cash and Bank 148.7% 165.7% 101.0% 85.5%
Channel Check takeaways from suppliers on IndiaMART
Source: Spark Capital
Page 117
India Internet: Sector Update (IndiaMART IPO)
MSME credit constitutes ~23% of systemic credit, of which 10% is commercial credit to individuals and the remaining 14% is commercial credit to entities; large & mid corporate form the bulk of the systemic credit at 42%
Source: CIBIL, Spark Capital
Market share of PSU banks in the overall lending to MSMEs have been steadily coming off, from 58% in Dec’13 to 39% in Dec’18 (decline of 19% market share), with the market share losses getting distributed between Private banks & NBFCs
Source: CIBIL, Spark Capital
In MSME loans to individuals, PSU banks have largely maintained their market share at ~30% levels over 2013-2018…
Source: CIBIL, Spark Capital
… implying that market share losses of PSU banks have come entirely from the MSME lending to entities (69% in 2013 to 46% in 2018)
Source: CIBIL, Spark Capital
Agri & Retail Credit, 35%
Mid & Large Corporate,
42%
MSME Credit to Individual, 10%
MSME Credit to Entity, 14%
MSME Credit, [VALUE]
Systemic Credit breakup (%)
58% 55% 50% 48% 47% 39%
22% 23% 27% 28% 29% 33%
13% 15% 15% 17% 18% 21%
7% 7% 7% 7% 6% 7%
0%
20%
40%
60%
80%
100%
Dec'13 Dec'14 Dec'15 Dec'16 Dec'17 Dec'18
Share of Lenders in MSME Segment (%)
PSU PVT NBFC Others
34% 33% 32% 31% 34% 29%
26% 29% 29% 30% 30% 30%
29% 30% 29% 31% 29% 33%
11% 8% 11% 8% 7% 8%
0%
20%
40%
60%
80%
100%
Dec'13 Dec'14 Dec'15 Dec'16 Dec'17 Dec'18
Share of Lenders in Individual Segment (%)
PSU PVT NBFC Others
69% 67% 61% 58% 55% 46%
20% 20% 26% 27% 29% 34%
6% 7% 8% 9% 10% 13%
6% 6% 5% 6% 6% 7%
0%
20%
40%
60%
80%
100%
Dec'13 Dec'14 Dec'15 Dec'16 Dec'17 Dec'18
Share of Lenders in Entity Segment (%)
PSU PVT NBFC Others
MSME Sector
Page 118
India Internet: Sector Update (IndiaMART IPO)
Contrary to popular belief, it is the lower ticket size lending that has the least delinquencies, with micro loans (<Rs. 10mn) having GNPAs of 8.7%, while the larger ticket size Corporate (>Rs.1bn) exhibiting GNPAs of 19.0%
Private banks have the best set of customers among the MSMEs, with private bank GNPAs being the lowest at 3.5%, compared to NBFCs at 5.2% & PSU banks at 15.6%
Source: CIBIL, Spark Capital
Source: CIBIL, Spark Capital
While, MSME lending to individuals have lower delinquencies than MSME lending to entities, the GNPAs in the individuals segment has been steadily increasing over 2015-18
Info Edge (Billings in Rs. million and growth in billings)
Source: Company, Spark Capital
IndiaMART (Billings in Rs. million and growth in billings)
Source: Company, Spark Capital
Just Dial (Billings in Rs. million and growth in billings)
Source: Company, Spark Capital
Matrimony (Billings in Rs. million and growth in billings)
Source: Company, Spark Capital
7,534 8,606
9,767
11,770
14% 13%
21%
FY16 FY17 FY18 FY19
Rs.
mn
Billings Growth in Billings
3,883 4,876
6,382 6,919
7,816 8,405
9,639
26%
31%
8%
13%
8%
15%
FY13 FY14 FY15 FY16 FY17 FY18 FY19
Rs.
mn
Billings Growth in Billings
3,355 3,749
5,093
6,913
12%
36% 36%
FY16 FY17 FY18 FY19
Rs.
mn
Billings Growth in Billings
2,037 2,376
2,588 2,853
3,333 3,488
17%
9% 10%
17%
5%
FY14 FY15 FY16 FY17 FY18 FY19
Rs.
mn
Billings Growth in Billings
Billings growth trends across Internet companies
Page 120
India Internet: Sector Update (IndiaMART IPO)
27% 28%
17%
4%
9%
14%
124%
145%
121%
145% 165%
141%
19% 30%
0%
30%
21% 22%
FY14 FY15 FY16 FY17 FY18 FY19
Revenue growth (LHS) Pre Tax OCF as % of EBITDA (RHS) Deferred revenue growth (RHS)
1,355 1,618
2,102 2,113
2,743
3,330
4,054
27% 24%
26% 25% 27%
28% 30%
37% 35%
36% 31%
38%
43%
45%
FY13 FY14 FY15 FY16 FY17 FY18 FY19
Rs.
in m
illio
n
Deferred Revenues As % of cash balance (RHS) As % of LTM revenues (RHS)
Growth in actual revenue vs. deferred revenue
Deferred revenue as % of cash balance and LTM revenue
Growth in actual revenue vs. deferred revenue
Deferred revenue as % of cash balance and LTM revenue
IndiaMART vs. Just Dial
30%
40%
29% 29%
21%
61%
24% 34%
49%
-13% 43%
-1%
386%
303%
FY15 FY16 FY17 FY18 FY19
Revenue growth (LHS) Deferred revenue growth (LHS) Pre Tax OCF as % of EBITDA (RHS)
2,361 2,361 2,932
3,920
5,860
208%
149%
166%
101%
86% 83%
96% 92%
95%
118%
FY15 FY16 FY17 FY18 FY19
Rs.
in m
illio
n
Deferred Revenues As % of cash balance (RHS) As % of LTM revenues (RHS)
Source: Company data, Spark Capital
Page 121
India Internet: Sector Update (IndiaMART IPO)
Growth in total listings vs. paid listings
Revenue from paid listing
Growth in total registered suppliers vs. paying suppliers
Revenue per paid supplier
23%
28% 28%
17%
9%
16%
20%
30%
24% 27%
18%
15%
9% 7%
FY13 FY14 FY15 FY16 FY17 FY18 FY19
Growth in total listings Growth in paid listings
19,219 19,686 19,880 19,738 17,872 17,758 18,849
2% 1%
-1%
-9%
-1%
6%
FY13 FY14 FY15 FY16 FY17 FY18 FY19
INR
Revenue Per Paid Listing Growth in Revenue Per Paid Listing (RHS)
36%
49%
11%
16%
21%
16%
FY17 FY18 FY19
Growth in total registered suppliers Growth in total paying suppliers
33,974 37,748
40,173 41,801
11%
6%
4%
FY16 FY17 FY18 FY19
INR
Revenue per paid supplier Revenue per paid supplier (RHS)
IndiaMART vs. Just Dial
Source: Company data, Spark Capital
Page 122
India Internet: Sector Update (IndiaMART IPO)
Employee break-up
Sales productivity : IndiaMART vs. Just Dial (calculated after removing corporate and IT headcount)
Employee break-up
3,544 4,350 4,057 4,072
1,327 1,484 1,410 1,461
1,911 2,055 2,663 3,896
4,416 3,445 3,322 3,262
FY16 FY17 FY18 FY19
Telemarketing Feet-On-Street (Marketing)
Feet-On-Street (JDAs and Cold Calling) Corporate
60
40 43
40
54
FY17 FY18 FY19
Just Dial IndiaMART
794 488 407
1,289
1,454 1,842
532 979 1,067
424 424 520 147 173 149
FY17 FY18 FY19
Sales Services Outsourced field representative Product Development + IT Corporate
IndiaMART vs. Just Dial
Source: Company data, Spark Capital
Page 123
India Internet: Sector Update (IndiaMART IPO)
Comparative Valuation
All fig in Rs.mn Info Edge Just Dial Matrimony IndiaMART
Market Cap 2,58,892 49,430 13,600 28,000
Net Cash 19,052 13,414 2,123 6,852
Deferrred Revenue 4,744 4,054 721 5,860
Net cash after Deferred Revenue 14,308 9,360 1,402 992
Enterprise Value 2,44,584 40,070 12,198 27,008
FY21 Revenue 15,452 10,907 4,236 NA
FY21 EBITDA 5,966 2,514 844 NA
FY21 PAT 5,339 2,008 652 NA
FY21 Pre Tax OCF 7,246 2,560 991 NA
FY21 Market Cap to PAT (x) 48.5 24.6 20.9 NA
FY21 EV to EBITDA (x) 41.0 15.9 14.5 NA
FY21 EV to OCF (x) 33.8 15.7 12.3 NA
FY21 EV to Revenue (x) 15.8 3.7 2.9 NA
Last 5 years Revenue CAGR 21.4% 14.1% 11.1% 30.2%
Last 5 years Revenue CAGR - Naukri.com 16.1% NA NA NA
Last 5 years Volume CAGR 8.6% 15.1% 4.1% 18.0%
Last 5 years Pricing CAGR 7.5% -1.0% 7.0% 7.0%
Last 5 years EBITDA CAGR 19.6% 10.0% 38.4% 45.6%
Last 5 years Employee Costs CAGR 18.4% 16.8% 10.1% 19.6%
Last 5 years Other Costs CAGR 16.0% 12.8% 7.4% 29.1%
Last 5 years PAT CAGR 24.5% 11.4% 26.7% 20.6%
ROIC 19.8% 20.4% 16.9% 95.2%
Note: 1. Volume CAGR for Info Edge is only for recruitment business 2. Pricing CAGR for Info Edge is only for recruitment business 3. Matrimony FY21 estimates is from Bloomberg Consensus and 4. Volume and Pricing CAGR for IndiaMART is for last 3 years Source: Company data, Spark Capital
Page 124
India Internet: Sector Update (IndiaMART IPO)
0
20
40
60
80
100
120
140
160
180
200
Jan
-13
Mar
-13
May
-13
Jul-
13
Sep
-13
No
v-1
3
Jan
-14
Mar
-14
May
-14
Jul-
14
Sep
-14
No
v-1
4
Jan
-15
Mar
-15
May
-15
Jul-
15
Sep
-15
No
v-1
5
Jan
-16
Mar
-16
May
-16
Jul-
16
Sep
-16
No
v-1
6
Jan
-17
Mar
-17
May
-17
Jul-
17
Sep
-17
No
v-1
7
Jan
-18
Mar
-18
May
-18
Jul-
18
Sep
-18
No
v-1
8
Jan
-19
Mar
-19
May
-19
DRHP Filed by SChand
Listing of SChand
0
100
200
300
400
500
600
700
800
900
Jan
-17
Jan
-17
Feb
-17
Mar
-17
Mar
-17
Ap
r-1
7
May
-17
May
-17
Jun
-17
Jul-
17
Jul-
17
Au
g-1
7
Sep
-17
Oct
-17
Oct
-17
No
v-1
7
Dec
-17
Dec
-17
Jan
-18
Feb
-18
Feb
-18
Mar
-18
Ap
r-1
8
Ap
r-1
8
May
-18
Jun
-18
Jul-
18
Jul-
18
Au
g-1
8
Sep
-18
Sep
-18
Oct
-18
No
v-1
8
No
v-1
8
Dec
-18
Jan
-19
Jan
-19
Feb
-19
Mar
-19
Ap
r-1
9
Ap
r-1
9
May
-19
Jun
-19
DRHP Filed by IndiaMART
IndiaMART IPO launched
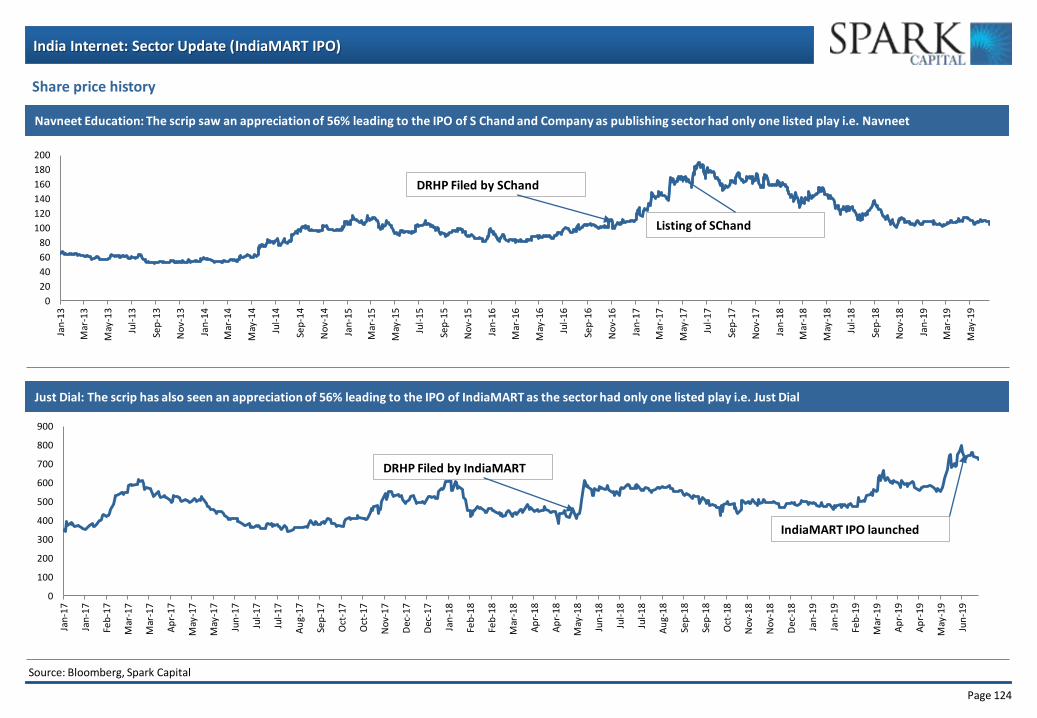
Share price history
Source: Bloomberg, Spark Capital
Navneet Education: The scrip saw an appreciation of 56% leading to the IPO of S Chand and Company as publishing sector had only one listed play i.e. Navneet
Just Dial: The scrip has also seen an appreciation of 56% leading to the IPO of IndiaMART as the sector had only one listed play i.e. Just Dial