Page 1
JM Financial Institutional Securities Limited
1QFY17 preview: Stable June, uncertain March
We expect a modest 2–4% organic USD revenue growth in 1QFY17 across the
top-6 players (except a flat quarter for TECHM), helped by seasonal recovery
in volume and a stable cross-currency. While the margin will expectedly
decline QoQ for most players due to seasonal factors (annual wage hike
and/or visa costs), mild INR appreciation (c1% QoQ) and adjustments due to
shift to IndAS, we believe the impact could be lower than traditional levels
given the adjustments we see across players in their appraisals/payout
methodologies to manage the margin impact vs. traditional levels. A steady
1QFY17 notwithstanding, an increased uncertainty on the medium-term
growth outlook following ‘Brexit’ could weigh on sector valuations, in our
view. TECHM (stability in telecom vertical + improving deal wins +
inexpensive valuations) and OFSS (seasonal strength in licence sales + U/P
vs. global peers) are our preferred picks.
1QFY17F – revenue growth to recover… We estimate the USD revenue to
increase 0–4% QoQ for our IT services coverage, driven by seasonal recovery in
volume growth and modest cross-currency tailwinds (0–60bps). In constant
currency organic revenue growth, we estimate INFO at the upper end (ramp-up
in large deals) and TECHM at the lower end (seasonal decline in Comviva).
Among mid-caps, we expect a strong 12% USD revenue growth for OFSS, led by
seasonally strong license sales.
… with seasonal softness in margin. EBIT margin could decline 50–180bps
QoQ across the top-6 players; the decline should be sharper for INFO and TCS
due to the annual wage hike, though we expect the impact could be lower than
the traditional levels (c220bps), given the shift in appraisal methods (individual
evaluation vs. bell-curve based earlier) and coverage (INFO has moved wage hike
for middle and senior management to July). We expect FX gains to be positive,
despite the translation impact due to the swing in quarter-close rates. We expect
a -5–2% QoQ PAT growth for the top-6 players (player-wise details in Exhibit 5).
‘Brexit’ is the incremental headwind… While the immediate impact of ‘Brexit’
will be from the adverse cross-currency movement – likely to be more visible in
2QFY17 than 1Q – a slower decision making on large deals/discretionary spend
could affect medium-term volume growth, in our view. The UK accounted for
13%, in TCV terms, of large deals awarded globally in FY16, according to ISG, an
outsourcing advisor. Also, the sharp GBP depreciation, if not re-negotiated,
could affect profitability of ongoing deals and consequently players’ medium-
term margins, in our view. Indian companies may also need to make changes in
the European delivery/sales infrastructure that could affect longer-term margin.
… though players may remain circumspect. We expect companies to retain
their current FY17 volume growth outlook with a cautious (but indefinite) stance
on the ‘Brexit’ impact. INFO could adjust the FY17 USD revenue growth guidance
for the currency; we estimate the constant currency growth guidance could get
revised to 11.1–13.1% (11.5–13.5% at present).
Margin management to be the differentiator. Our channel checks indicate IT
spend by clients remains calibrated with a heightened due diligence of vendor
responses to RFPs. An incremental slow-down in volume growth (from ‘Brexit’) is
thus an incremental margin risk; note, EBIT margins have declined up to 400bps
for the top-4 players over the past eight quarters, adjusted for currency impact
(INR+cross-currency). We see minimal EPS upgrades post results for most
players. We retain our preference for players with subdued/modest margin
expectations and relatively inexpensive valuations.
Pankaj Kapoor
[email protected]
Tel: (+91 22) 66303089
Abhishek Kumar
[email protected]
Tel: (+91 22) 66303057
IT coverage universe: Ratings and TPs
RECO TP Upside
INFO BUY 1,340 14.5%
TCS BUY 2,750 7.7%
TECHM BUY 680 34.5%
PSYS HOLD 800 14.7%
MTCL HOLD 780 17.3%
NITEC BUY 640 24.8%
ECLX HOLD 1,400 -3.2%
OFSS BUY 4,050 16.9%
BSE IT vs. Sensex
70
75
80
85
90
95
100
105
110
115
Jun-15 Aug-15 Oct-15 Dec-15 Feb-16 Apr-16 Jun-16
Sensex BSE-IT
IT coverage universe: Valuation
EPS PER
FY1E FY2E FY1E FY2E
INFO 64.9 74.3 18.1x 15.8x
TCS 136.4 154.1 18.7x 16.6x
TECHM 40.3 49.8 12.5x 10.2x
PSYS 42.2 52.5 16.5x 13.3x
MTCL 40.8 48.5 16.3x 13.7x
NITEC 50.2 58.3 10.2x 8.8x
ECLX 94.1 101.6 15.4x 14.2x
OFSS 155.9 181.1 22.2x 19.1x
Source: JM Financial
India IT Services and Software
4 July 2016
India | IT | Sector Update
JM Financial Research is also available
on: Bloomberg - JMFR <GO>,
Thomson Publisher & Reuters,
S&P Capital IQ and FactSet.
Please see Appendix I at the end of this
report for Important Disclosures and
Disclaimers and Research Analyst
Certification.
Page 2
India IT Services and Software 4 July 2016
JM Financial Institutional Securities Limited Page 2
1QFY17 earnings preview
Exhibit 1. JMF IT coverage universe: 1QFY17’s key estimates
Revenue
EBITDA
EBIT PAT
(USD mn)
Growth
(QoQ)
Cross-
currency
CC* grow.
(QoQ) Margin (%) Change Margin (%) Change (` mn) Change
INFO 2,535 3.6% 33bps 3.3% 26.3% -178bps 23.7% -178bp 34,325 -4.6%
TCS 4,355 3.5% 58bps 2.9% 26.1% -174bps 24.3% -174bp 60,207 -5.1%
TECHM 1,026 0.3% 14bps 0.2% 16.0% -87bps 12.6% -106bp 7,336 -18.1%
PSYS 103 2.3% 0bps 2.3% 14.3% -155bps 10.5% -157bp 671 -16.9%
MTCL 201 2.9% 16bp 2.7% 16.6% -42bp 13.2% -121bp 1,484 -4.9%
NITEC 103 1.3% 10bps 1.2% 16.6% -186bps 12.4% -205bp 646 -17.6%
ECLX 52 1.5% 18bps 1.3% 37.9% -307bps 33.8% -319bp 956 -11.7%
OFSS 168 11.9% 0bps 11.9% 44.6% 875bps 43.5% 890bp 3,614 61.2%
*CC: Constant currency; Source: JM Financial
Exhibit 2. Select players’ estimated cross-currency impact during 1QFY17
Revenue share Change (QoQ) Cross-currency impact
USD GBP EUR AUD USD GBP EUR AUD GBP EUR AUD Total
INFO 69% 7% 10% 7% -0.9% 0.1% 1.9% 1.9% 1bps 19bps 13bps 33bps
TCS 57% 14% 8% 6% -1.0% -0.7% 1.3% 1.2% -10bps 10bps 7bps 58bps
TECHM 51% 11% 11% 5% 1.8% -0.6% 1.3% 1.2% -7bps 15bps 6bps 14bps
MTCL 73% 5% 12% NA 2.7% 0.0% 1.7% NA 0bps 0bps NA 16bps
NITEC 51% 20% 10% 5% 1.5% 0.0% 1.7% 1.1% 0bps 0bps 0bps 10bps
Source: Companies, JM Financial
Exhibit 3. Potential impact on FY17 EBIT margin/EPS due to cross-currency
INFO TCS TECHM MTCL NITEC
If GBP depreciates by 10% -
GBP denominated revenue share 6.70% 13.16% 10.80% 5.00% 20.00%
Reported USD revenue impact -67bps -132bps -108bps -50bps -200bps
EBIT margin impact -23bps -46bps -38bps -18bps -70bps
Reported INR EPS impact -0.70% -1.38% -1.70% -0.79% -3.15%
Additionally if Euro depreciates by 5% -
Euro denominated revenue share 9.60% 7.87% 11.30% 12.00% 10.00%
Reported USD revenue impact -48bps -39bps -57bps -60bps -50bps
EBIT margin impact -17bps -14bps -20bps -21bps -18bps
Reported INR EPS impact -0.50% -0.41% -0.89% -0.95% -0.79%
Combined
Reported USD revenue impact -115bps -171bps -165bps -110bps -250bps
EBIT margin impact -40bps -60bps -58bps -39bps -88bps
Reported INR EPS impact -1.21% -1.79% -2.59% -1.73% -3.94%
Source: Companies, JM Financial
Exhibit 4. At current exchange rate, Infosys’ FY17 cc/USD revenue guidance could be lower by 40/80bps
Rev. dist. Constant Currency Guidance (FY17) USD Revenue Growth Guidance (FY17)
FY16 Assumed rate Revised rate Impact Assumed rate Revised rate Impact
USD 69.9% 65.59 67.48 2.01% 66.26 67.48 1.29%
GBP 6.6% 1.51 1.36 -0.65% 1.44 1.36 -0.36%
Euro 9.3% 1.1 1.11 0.10% 1.14 1.11 -0.23%
AUD 6.9% 0.73 0.74 0.12% 0.77 0.74 -0.24%
Total 100.00% - - -0.4% - - -0.8%
Source: Companies, JM Financial
Page 3
India IT Services and Software 4 July 2016
JM Financial Institutional Securities Limited Page 3
Exhibit 5. JMF’s IT services and software coverage universe: Estimates for key financials (Apr–Jun 2016)
Revenue Op. margin PAT
USD mn ` mn (%) ` mn Comments and key assumptions
Infosys 2,535 170,277 26.3% 34,325
Estimate IT services volume/pricing growth of 3.6%/0.3% QoQ
Change – QoQ 3.6% 2.9% -178bp -4.6%
TCS 4,355 291,598 26.1% 60,207 Assume 200bps impact on margins due to wage hike/higher
sub-contracting cost Change – QoQ 3.5% 2.5% -174bp -5.1%
Tech Mahindra 1,026 69,018 16.0% 7,336 Est. USD86mn contribution from LCC+Sofgen (-5% QoQ)
Enterprise growth estimate: 3.3% QoQ; FX gain: `336mn Change – QoQ 0.3% 0.3% -87bp -18.1%
Persistent 103 6,881 14.3% 671 0.5%/7.1% QoQ organic USD revenue growth in Services/IP
Higher G&A due to one-time facility set-up to impact margins;
higher (normalised) tax rate to impact QoQ PAT growth
Change – QoQ 2.3% 1.6% -155bp -16.9%
Mindtree 201 13,405 16.6% 1,484 Estimate volume/pricing growth of 2.2%/0.7% QoQ
Amortization of Intangible (as per IndAS) + incentive pay-out
of USD 2.5mn to impact EBIT margin by 80bps
Change – QoQ 2.9% 1.2% -42bp -4.9%
NIIT Tech 103 6,878 16.6% 646 GIS revenues estimated to decline 33% QoQ due to seasonality
We estimate hedge gain of `20mn reported in revenues Change – QoQ 1.3% 0.5% -186bp -17.6%
eClerx 52 3,452 37.9% 956 Expect utilisation to decline 100bps as short-term project tail
off; wage hike/investments to hit margins Change – QoQ 1.5% 0.6% -307bp -11.7%
OFSS 168 11,255 44.6% 3,614
License revenue estimated to be USD28.8mn (+15% YoY)
Change – QoQ 11.9% 38.2% 875bp 61.2%
Notes: All numbers are consolidated Indian GAAP numbers except Infosys and TCS; Source: Companies, JM Financial
Exhibit 6. JMF’s IT services coverage universe: Apr–Jun 2016 quarter results calendar and key issues
Key issues to focus on
Infosys
(15th
Jul, 2016)
Commentary around impact of Brexit on demand/client spending, especially in BFSI
Potential revision of FY17 constant currency revenue guidance on cross-currency headwinds (11.5–13.5% currently)
Comment on margin band (currently at 24–26%)
TCS
(14th
Jul, 2016)
Outlook for the BFSI vertical especially for UK/EU clients after Brexit
Update on Diligenta/Japan business after headwinds in FY16
Growth in digital business + large deal wins; comments on profile/size of digital deals
Tech Mahindra
(01st
Aug, 2016)
Deal wins/pipeline in telecom + update on post-acquisition integration works in large telecom clients
Margin trajectory in LCC after divesting the low-margin business
Persistent
(24h
Jul, 2016)
Progress on integration of IBM business; potential growth prospects and margin impact on the consol. business
Outlook on the core product development business; progress on enterprise business
NIIT Tech
(15th
Jul, 2016)*
Deal wins and order book position; update on large deal pipeline
Commentary around impact of Brexit on demand/client spending, specifically in EU/UK travel accounts
Mindtree
(18th
Jul, 2016)
FY17 organic revenue growth outlook + TCV of new deal wins; update on digital business
Margin impact of increased amortization due to IndAS
eClerx
(Jul 4th
week)*
Any revision to FY17 outlook after a guiding for a softer 1HFY17
Commentary around impact of Brexit on BFSI clients/EU digital business
OFSS
(Aug 2nd
week)*
License booking + QoQ change in implementation and AMC revenues (static for past few quarters)
Commentary around impact of Brexit on deal pipeline/conversion
Note: * - Tentative; Source: JM Financial
Exhibit 7. Impact of IndAS on reported financials
Company Potential impact
Tech Mahindra ESOP charges: Impact of USD 7–8mn on FY17 margins
Treasury shares: 96mn treasury shares to be extinguished resulting in 10% higher reported EPS
Non-current investment of `12bn (in TML benefit trust) to be offset against treasury shares in reserve and surplus
This will result in 8% decline in equity base and 1 ppt increase in RoE
Mindtree Lower EBIT due to amortisation of intangible assets
Source: JM Financial
Page 4
India IT Services and Software 4 July 2016
JM Financial Institutional Securities Limited Page 4
Exhibit 8. Apr–Jun 2016 quarter: Estimated QoQ variance in realised USD-INR rate
Jan–Mar 16 Apr - Jun 16 Variance (%) Comments
Infosys 67.7 67.2 -0.7% We expect a -1.0% to 1.0% QoQ change in the realised USD-
INR rate for our coverage universe. The variation is due to
the different methodologies followed to calculate realised
rates.
TCS 67.6 67.0 -1.0%
Tech Mahindra 67.3 67.3 -0.1%
Persistent 67.4 67.0 -0.7%
Mindtree 67.7 66.6 -1.6%
NIIT Tech 65.6 66.6 1.5%
eClerx 67.6 67.0 -0.9%
OFSS 67.6 67.0 -0.9%
Source: JM Financial
Exhibit 9. Apr–Jun 2016 quarter: Movements in key currencies versus the USD
Apr - Jun 16
Change in Change in
Comments Apr - Jun 16 Jan - Mar 16
Indian rupee/US Dollar – period-end 67.53 1.9% 0.1% Brexit vote towards the end of the quarter
resulted in sharp GBP depreciation against the
USD. However, GBP appreciation against the USD
in the first half of the quarter results in almost
similar average GBP-USD rate QoQ
Currencies of commodity linked economies such
as the Brazilian Real appreciated sharply against
the USD as crude prices bounced back to almost
USD50/barrel.
We estimate a 0bps to 60bps positive cross-
currency impact on reported USD revenue for the
coverage universe; TCS, with higher exposure to
BRL and JPY, will likely see the highest cross-
currency tailwind (60bps) in our coverage
universe, in our view.
Indian rupee/US Dollar – average 66.94 -0.8% 2.4%
British pound/US Dollar – period-end 1.33 -7.3% -2.6%
British pound/US Dollar – average 1.44 0.2% -5.6%
Euro/US Dollar – period-end 1.11 -2.4% 4.8%
Euro/US Dollar – average 1.13 2.3% 0.8%
Australian Dollar/US Dollar – period-end 0.75 -2.7% 5.1%
Australian Dollar/US Dollar – average 0.75 3.1% 0.4%
Brazilian Real/US Dollar – period-end 0.31 11.5% 10.3%
Brazilian Real/US Dollar – average 0.29 11.3% -1.2%
Mexican Peso/US Dollar – period-end 0.05 -5.5% -0.4%
Mexican Peso/US Dollar – average 0.06 -0.4% -7.0%
Uruguay Peso/US Dollar – period-end 0.03 3.9% -5.6%
Uruguay Peso/US Dollar – average 0.03 0.8% -6.3%
Chilean Peso/US Dollar – period-end 0.15 0.9% 6.1%
Chilean Peso/US Dollar – average 0.15 3.4% -0.4%
Source: JM Financial
Exhibit 11. JMF’s IT services and software coverage universe: Recommendations and valuations
EPS (`)
JMF vs. Cons.
P/E
EV/EBITDA
RoE
CPS Div.
Yld
Rating TP FY17E FY18E FY17E FY18E FY17E FY18E FY17E FY18E FY17E FY16 FY16
INFO BUY 1,340 64.9 74.3
-2.0 -1.2
18.1 15.8
11.7 10.1
22.6
143.1 1.9
TCS BUY 2,750 136.4 154.1 1.3 2.5 18.7 16.6 13.4 11.7 33.1 150.6 3.1
TECHM BUY 680 40.3 49.8
9.2 18.0
12.5 10.2
13.8 11.9
22.5
51.2 1.2
PSYS HOLD 800 42.2 52.5 -0.7 2.1 16.5 13.3 15.9 11.4 19.0 94.8 2.2
MTCL HOLD 780 40.8 48.5 -1.7 -0.1 16.3 13.7 10.6 8.7 26.4 26.7 2.6
NITEC BUY 640 50.2 58.3
-0.2 4.1
10.2 8.8
4.9 4.1
18.3
54.5 1.9
ECLX HOLD 1,400 94.1 101.6 3.2 0.2 15.4 14.2 8.5 7.5 31.5 131.4 3.2
OFSS BUY 4,050 155.9 181.1 -2.8 -4.8 22.2 19.1 13.8 11.9 35.0 322.2 2.9
Note: Prices as of June 30, 2016; Source: JM Financial
Page 5
India IT Services and Software 4 July 2016
JM Financial Institutional Securities Limited Page 5
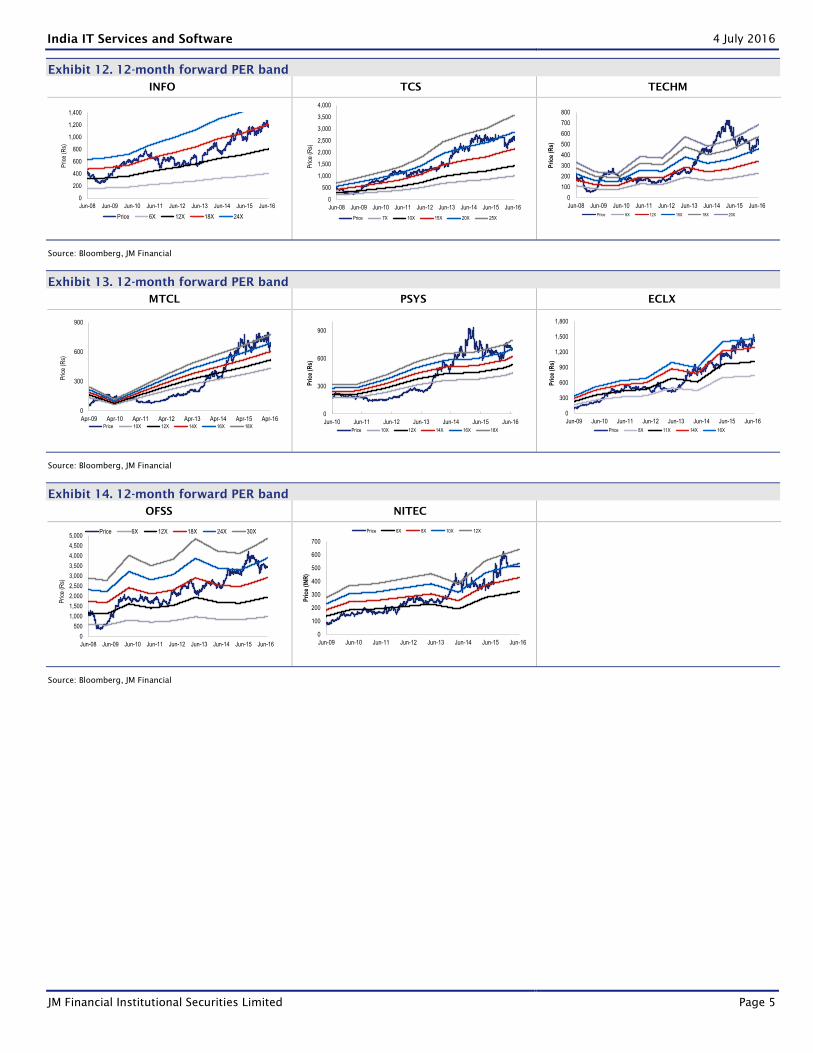
Exhibit 12. 12-month forward PER band
INFO TCS TECHM
0
200
400
600
800
1,000
1,200
1,400
Jun-08 Jun-09 Jun-10 Jun-11 Jun-12 Jun-13 Jun-14 Jun-15 Jun-16
Pric
e (R
s)
Price 6X 12X 18X 24X
0
500
1,000
1,500
2,000
2,500
3,000
3,500
4,000
Jun-08 Jun-09 Jun-10 Jun-11 Jun-12 Jun-13 Jun-14 Jun-15 Jun-16
Pric
e (R
s)
Price 7X 10X 15X 20X 25X
0
100
200
300
400
500
600
700
800
Jun-08 Jun-09 Jun-10 Jun-11 Jun-12 Jun-13 Jun-14 Jun-15 Jun-16
Pri
ce (
Rs)
Price 6X 12X 15X 18X 20X
Source: Bloomberg, JM Financial
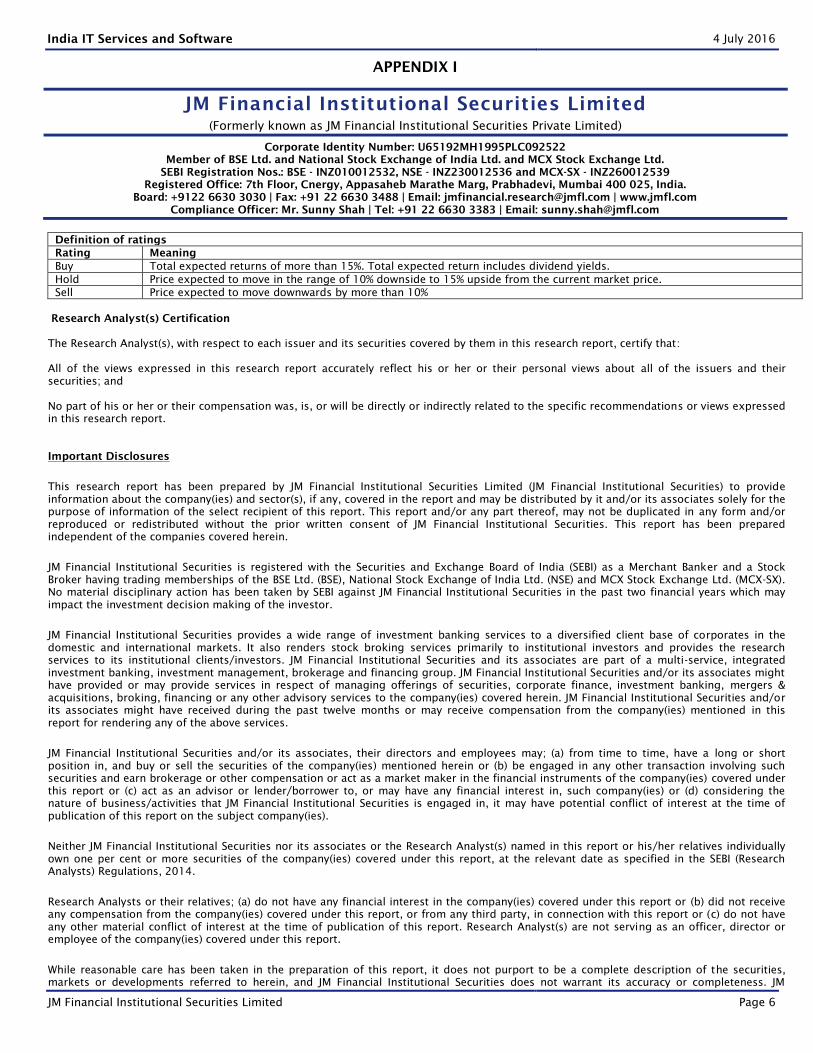
Exhibit 13. 12-month forward PER band
MTCL PSYS ECLX
0
300
600
900
Apr-09 Apr-10 Apr-11 Apr-12 Apr-13 Apr-14 Apr-15 Apr-16
Pric
e (R
s)
Price 10X 12X 14X 16X 18X
0
300
600
900
Jun-10 Jun-11 Jun-12 Jun-13 Jun-14 Jun-15 Jun-16
Pri
ce (
Rs)
Price 10X 12X 14X 16X 18X
0
300
600
900
1,200
1,500
1,800
Jun-09 Jun-10 Jun-11 Jun-12 Jun-13 Jun-14 Jun-15 Jun-16
Pri
ce (
Rs)
Price 8X 11X 14X 16X
Source: Bloomberg, JM Financial
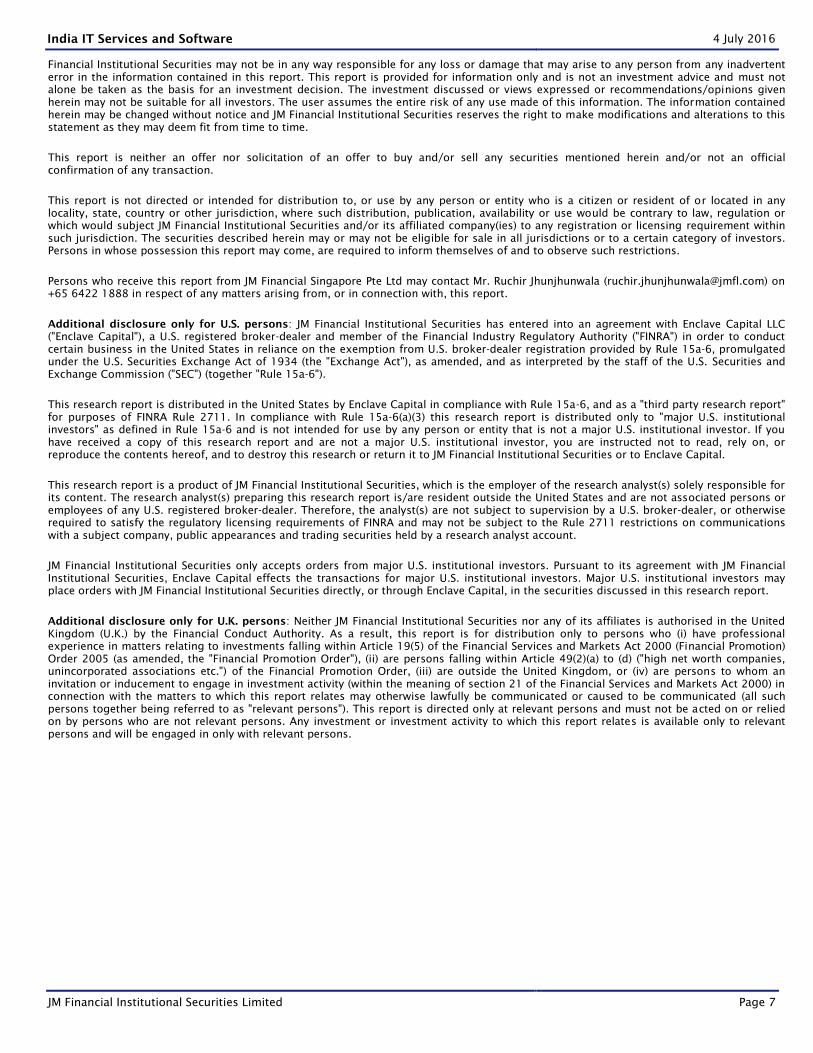
Exhibit 14. 12-month forward PER band
OFSS NITEC
0
500
1,000
1,500
2,000
2,500
3,000
3,500
4,000
4,500
5,000
Jun-08 Jun-09 Jun-10 Jun-11 Jun-12 Jun-13 Jun-14 Jun-15 Jun-16
Pric
e (R
s)
Price 6X 12X 18X 24X 30X
0
100
200
300
400
500
600
700
Jun-09 Jun-10 Jun-11 Jun-12 Jun-13 Jun-14 Jun-15 Jun-16
Pri
ce (
INR
)
Price 6X 8X 10X 12X
Source: Bloomberg, JM Financial
Page 6
India IT Services and Software 4 July 2016
JM Financial Institutional Securities Limited Page 6
APPENDIX I
JM Financial Institutional Securities Limited
(Formerly known as JM Financial Institutional Securities Private Limited)
Corporate Identity Number: U65192MH1995PLC092522
Member of BSE Ltd. and National Stock Exchange of India Ltd. and MCX Stock Exchange Ltd.
SEBI Registration Nos.: BSE - INZ010012532, NSE - INZ230012536 and MCX-SX - INZ260012539
Registered Office: 7th Floor, Cnergy, Appasaheb Marathe Marg, Prabhadevi, Mumbai 400 025, India.
Board: +9122 6630 3030 | Fax: +91 22 6630 3488 | Email: [email protected] | www.jmfl.com
Compliance Officer: Mr. Sunny Shah | Tel: +91 22 6630 3383 | Email: [email protected]
Definition of ratings
Rating Meaning
Buy Total expected returns of more than 15%. Total expected return includes dividend yields.
Hold Price expected to move in the range of 10% downside to 15% upside from the current market price.
Sell Price expected to move downwards by more than 10%
Research Analyst(s) Certification
The Research Analyst(s), with respect to each issuer and its securities covered by them in this research report, certify that:
All of the views expressed in this research report accurately reflect his or her or their personal views about all of the issuers and their
securities; and
No part of his or her or their compensation was, is, or will be directly or indirectly related to the specific recommendations or views expressed
in this research report.
Important Disclosures
This research report has been prepared by JM Financial Institutional Securities Limited (JM Financial Institutional Securities) to provide
information about the company(ies) and sector(s), if any, covered in the report and may be distributed by it and/or its associates solely for the
purpose of information of the select recipient of this report. This report and/or any part thereof, may not be duplicated in any form and/or
reproduced or redistributed without the prior written consent of JM Financial Institutional Securities. This report has been prepared
independent of the companies covered herein.
JM Financial Institutional Securities is registered with the Securities and Exchange Board of India (SEBI) as a Merchant Banker and a Stock
Broker having trading memberships of the BSE Ltd. (BSE), National Stock Exchange of India Ltd. (NSE) and MCX Stock Exchange Ltd. (MCX-SX).
No material disciplinary action has been taken by SEBI against JM Financial Institutional Securities in the past two financial years which may
impact the investment decision making of the investor.
JM Financial Institutional Securities provides a wide range of investment banking services to a diversified client base of corporates in the
domestic and international markets. It also renders stock broking services primarily to institutional investors and provides the research
services to its institutional clients/investors. JM Financial Institutional Securities and its associates are part of a multi-service, integrated
investment banking, investment management, brokerage and financing group. JM Financial Institutional Securities and/or its associates might
have provided or may provide services in respect of managing offerings of securities, corporate finance, investment banking, mergers &
acquisitions, broking, financing or any other advisory services to the company(ies) covered herein. JM Financial Institutional Securities and/or
its associates might have received during the past twelve months or may receive compensation from the company(ies) mentioned in this
report for rendering any of the above services.
JM Financial Institutional Securities and/or its associates, their directors and employees may; (a) from time to time, have a long or short
position in, and buy or sell the securities of the company(ies) mentioned herein or (b) be engaged in any other transaction involving such
securities and earn brokerage or other compensation or act as a market maker in the financial instruments of the company(ies) covered under
this report or (c) act as an advisor or lender/borrower to, or may have any financial interest in, such company(ies) or (d) considering the
nature of business/activities that JM Financial Institutional Securities is engaged in, it may have potential conflict of interest at the time of
publication of this report on the subject company(ies).
Neither JM Financial Institutional Securities nor its associates or the Research Analyst(s) named in this report or his/her relatives individually
own one per cent or more securities of the company(ies) covered under this report, at the relevant date as specified in the SEBI (Research
Analysts) Regulations, 2014.
Research Analysts or their relatives; (a) do not have any financial interest in the company(ies) covered under this report or (b) did not receive
any compensation from the company(ies) covered under this report, or from any third party, in connection with this report or (c) do not have
any other material conflict of interest at the time of publication of this report. Research Analyst(s) are not serving as an officer, director or
employee of the company(ies) covered under this report.
While reasonable care has been taken in the preparation of this report, it does not purport to be a complete description of the securities,
markets or developments referred to herein, and JM Financial Institutional Securities does not warrant its accuracy or completeness. JM
Page 7
India IT Services and Software 4 July 2016
JM Financial Institutional Securities Limited Page 7
Financial Institutional Securities may not be in any way responsible for any loss or damage that may arise to any person from any inadvertent
error in the information contained in this report. This report is provided for information only and is not an investment advice and must not
alone be taken as the basis for an investment decision. The investment discussed or views expressed or recommendations/opinions given
herein may not be suitable for all investors. The user assumes the entire risk of any use made of this information. The information contained
herein may be changed without notice and JM Financial Institutional Securities reserves the right to make modifications and alterations to this
statement as they may deem fit from time to time.
This report is neither an offer nor solicitation of an offer to buy and/or sell any securities mentioned herein and/or not an official
confirmation of any transaction.
This report is not directed or intended for distribution to, or use by any person or entity who is a citizen or resident of or located in any
locality, state, country or other jurisdiction, where such distribution, publication, availability or use would be contrary to law, regulation or
which would subject JM Financial Institutional Securities and/or its affiliated company(ies) to any registration or licensing requirement within
such jurisdiction. The securities described herein may or may not be eligible for sale in all jurisdictions or to a certain category of investors.
Persons in whose possession this report may come, are required to inform themselves of and to observe such restrictions.
Persons who receive this report from JM Financial Singapore Pte Ltd may contact Mr. Ruchir Jhunjhunwala ([email protected] ) on
+65 6422 1888 in respect of any matters arising from, or in connection with, this report.
Additional disclosure only for U.S. persons: JM Financial Institutional Securities has entered into an agreement with Enclave Capital LLC
("Enclave Capital"), a U.S. registered broker-dealer and member of the Financial Industry Regulatory Authority ("FINRA") in order to conduct
certain business in the United States in reliance on the exemption from U.S. broker-dealer registration provided by Rule 15a-6, promulgated
under the U.S. Securities Exchange Act of 1934 (the "Exchange Act"), as amended, and as interpreted by the staff of the U.S. Securities and
Exchange Commission ("SEC") (together "Rule 15a-6").
This research report is distributed in the United States by Enclave Capital in compliance with Rule 15a-6, and as a "third party research report"
for purposes of FINRA Rule 2711. In compliance with Rule 15a-6(a)(3) this research report is distributed only to "major U.S. institutional
investors" as defined in Rule 15a-6 and is not intended for use by any person or entity that is not a major U.S. institutional investor. If you
have received a copy of this research report and are not a major U.S. institutional investor, you are instructed not to read, rely on, or
reproduce the contents hereof, and to destroy this research or return it to JM Financial Institutional Securities or to Enclave Capital.
This research report is a product of JM Financial Institutional Securities, which is the employer of the research analyst(s) solely responsible for
its content. The research analyst(s) preparing this research report is/are resident outside the United States and are not associated persons or
employees of any U.S. registered broker-dealer. Therefore, the analyst(s) are not subject to supervision by a U.S. broker-dealer, or otherwise
required to satisfy the regulatory licensing requirements of FINRA and may not be subject to the Rule 2711 restrictions on communications
with a subject company, public appearances and trading securities held by a research analyst account.
JM Financial Institutional Securities only accepts orders from major U.S. institutional investors. Pursuant to its agreement with JM Financial
Institutional Securities, Enclave Capital effects the transactions for major U.S. institutional investors. Major U.S. institutional investors may
place orders with JM Financial Institutional Securities directly, or through Enclave Capital, in the securities discussed in this research report.
Additional disclosure only for U.K. persons: Neither JM Financial Institutional Securities nor any of its affiliates is authorised in the United
Kingdom (U.K.) by the Financial Conduct Authority. As a result, this report is for distribution only to persons who (i) have professional
experience in matters relating to investments falling within Article 19(5) of the Financial Services and Markets Act 2000 (Financial Promotion)
Order 2005 (as amended, the "Financial Promotion Order"), (ii) are persons falling within Article 49(2)(a) to (d) ("high net worth companies,
unincorporated associations etc.") of the Financial Promotion Order, (iii) are outside the United Kingdom, or (iv) are persons to whom an
invitation or inducement to engage in investment activity (within the meaning of section 21 of the Financial Services and Markets Act 2000) in
connection with the matters to which this report relates may otherwise lawfully be communicated or caused to be communicated (all such
persons together being referred to as "relevant persons"). This report is directed only at relevant persons and must not be acted on or relied
on by persons who are not relevant persons. Any investment or investment activity to which this report relates is available only to relevant
persons and will be engaged in only with relevant persons.