20
Office Property Market Overview INDIA April - 2015
| Date post: | 07-Aug-2015 |
| Category: |
Documents |
| Upload: | sachin-sharma |
| View: | 61 times |
| Download: | 4 times |

Office Property Market OverviewINDIAApril - 2015

2 Research & Forecast Report | April 2015 | Colliers International
ContentsMarco Economic Overview 3
Mumbai Office Market Overview 4
Delhi Office Market Overview 6
Gurgaon Office Market Overview 8
NOIDA Office Market Overview 10
Chennai Office Market Overview 12
Bengaluru Office Market Overview 14
Kolkata Office Market Overview 16
Pune Office Market Overview 18

3 Research & Forecast Report | April 2015 | Colliers International
Offi ce demand set to improveTh e Indian economy continued to see positive trends, with Business Confi dence Index marginally up by 20 basis points in January 2015. India’s GDP recorded a 7.5% growth in the October - December 2014; and the forecast is for the GDP to expand by 7.8% in January to March 2015 quarter. In addition, the WPI (Wholesale Price Index) infl ation reached its 10-year low at -2.06% in February 2015.
Both the economy and the offi ce market turned the corner in 2014 and are poised for further improvement in 2015. For the commercial real estate sector, 2015 witnessed a good start, with fi rst quarter offi ce absorption of 8.5 million sq ft in the eight major metro cities in India, headed by Bengaluru (3.82 million sq ft, including 1.74 million sq ft pre-committed), NCR-Delhi, Gurgaon and NOIDA (1.48 million sq ft), Mumbai (1.33 million sq ft), Pune (0.89 million sq ft), Chennai (0.81 million sq ft) and Kolkata (0.22 million sq ft).
Offi ce space absorption increased by 2.8% from last quarter. Tenants from IT / ITeS and BFSI were the primary sectors driving this demand. Within IT / ITeS, E-commerce companies took up 52% of the total space absorbed. Select micro markets in cities like Bengaluru, Mumbai and Noida witnessed marginal increase in rental values in the range of 1% – 3% QoQ.
Colliers View
With an expanding economy, improving business sentiment and increasing job creations, the momentum in demand for offi ce real estate is expected to stay. In response to tenant demand, the strongest markets (namely Bengaluru and Gurgaon) will witness development of new stock. However, developer sentiment towards speculative construction of offi ce buildings is expected to remain cautious, and this in turn will limit the risk of further overbuilding.
Return on Alternative Investments
Economic Barometer
Note: Estimates as per International Monetary Fund Wholesale Price Index (WPI) SBI interest rate < INR 1 crore Term Deposits for ≤ 1 Year
Research & Forecast Report
India | Offi ceApril 2015
Indicators 4Q 2014 1Q 2015Gross Domestic Product 7.50% 7.80%1
Business Confi dence Index 56.20% 56.40%
Repo Rate 8.00% 7.50%
Reverse Repo Rate 7.00% 6.50%
Cash Reserve Ratio 4.00% 4.00%
Infl ation (WPI)2 0.11% -2.06%
Prime Lending Rate 10.00% - 10.30% 10.00% - 10.25%
Deposit Rate3 8.00% - 9.05% 8.00% - 8.75%
Exchange Rates 4Q 2014 1Q 2015
INR - USD 63.33 62.36
INR - EURO 77.00 66.48
Parameters 4Q 2014 1Q 2015 QoQCHANGE
Gold 26,507 26,232 -1.04%
Silver 35,999 36,983 2.73%
Equity(BSE Sensex) 27,499 27,957 1.67%
Realty Index 1,555 1,692 8.77%

4 Research & Forecast Report | April 2015 | Colliers International
Increasing demand trend led by IT/ITeS occupiersOffice absorption in Mumbai increased by 9% QoQ, from 1.22 million sq ft in 4Q 2014 to 1.33 million sq ft in 1Q 2015. The IT/ITeS sector dominated the city’s office absorption with over 57% (0.75 million sq ft) of the total absorption, followed by BFSI with 0.38 million sq ft (28%) and pharma with 0.07 million sq ft (5%). The maximum number of office transactions were concluded in the western suburbs (0.54 million sq ft) including BKC, Andheri, Malad and Goregaon, followed byNavi Mumbai (0.39 million sq ft), and the central suburbs (0.25 million sq ft) including Vikhroli, Powai and Kanjurmarg. This rise in demand is largely attributed to an increase in the confidence of occupiers regarding overall business growth in India and abroad.
In major office transactions during the quarter, E-clerx took about 0.2 million sq ft in Mindspace SEZ by K Raheja Corp located in Navi Mumbai. “Other major deals included, Housing.com and Edelweiss, took up 0.13 and 0.10 million sq.ft. at Nomura by Hiranandani at Powai and Kohinoor City by Kohinoor Group at Kurla, respectively.”
1Q 2015 witnessed new supply of 0.6 million sq ft. The projects accounting for this new supply were 0.2 million sq ft of Lodha Supremus (located in I-Think Campus) by Lodha Group; and 0.4 million sq ft of Century Greenspan (located in Worli) developed by Century, an Aditya Birla Group company. No new project was launched during the quarter as developers were focusing to complete their existing ventures, about 7.7 million sq ft of Grade A office supply is available for fitout in Mumbai, among which majority of the supply is located in the western suburbs (47%) including BKC, Andheri (E), Malad and Goregaon/JVLR, followed by Central Mumbai (16%) including Worli, Prabhadevi and Lower Parel.
Rental Values
*Indicative Grade A rents in INR per SF per month**Nariman Point, Ballard Estate & Fort
Research & Forecast Report
Mumbai | OfficeApril 2015
MICRO MARKETS RENTALVALUE*
% CHANGEQoQ YoY
CBD** 200 - 230 5% -7%
Worli/Prabhadevi 185 - 225 0% 2%
Lower Parel 145 - 190 0% 4%
BKC 225 - 320 0% 0%
Kalina 150 - 200 0% -9%
Goregaon / JVLR 100 - 110 0% 10%
Andheri East 80 - 130 0% -3%
Malad 80 - 100 0% 5%
Powai 120 - 130 4% 13%
Navi Mumbai 60 - 100 0% 22%
Thane / LBS 60 - 110 0% 13%
City Office Barometer
INDICATORS 1Q 2015 2Q 2015 F
Vacancy
Absorption
Construction
Rental Value
Capital Value
5 Research & Forecast Report | April 2015 | Colliers International
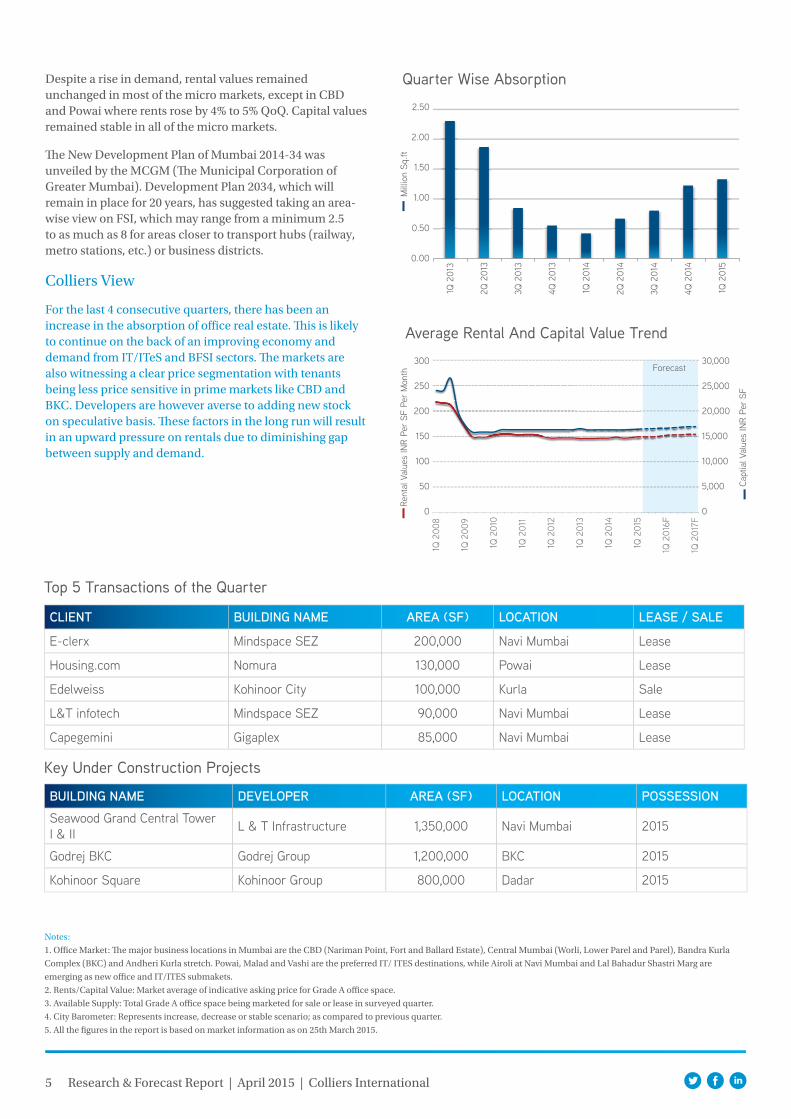
Despite a rise in demand, rental values remained unchanged in most of the micro markets, except in CBD and Powai where rents rose by 4% to 5% QoQ. Capital values remained stable in all of the micro markets.
Th e New Development Plan of Mumbai 2014-34 was unveiled by the MCGM (Th e Municipal Corporation of Greater Mumbai). Development Plan 2034, which will remain in place for 20 years, has suggested taking an area-wise view on FSI, which may range from a minimum 2.5 to as much as 8 for areas closer to transport hubs (railway, metro stations, etc.) or business districts.
Colliers View
For the last 4 consecutive quarters, there has been an increase in the absorption of offi ce real estate. Th is is likely to continue on the back of an improving economy and demand from IT/ITeS and BFSI sectors. Th e markets are also witnessing a clear price segmentation with tenants being less price sensitive in prime markets like CBD and BKC. Developers are however averse to adding new stock on speculative basis. Th ese factors in the long run will result in an upward pressure on rentals due to diminishing gap between supply and demand.
Notes:
1. Offi ce Market: Th e major business locations in Mumbai are the CBD (Nariman Point, Fort and Ballard Estate), Central Mumbai (Worli, Lower Parel and Parel), Bandra Kurla
Complex (BKC) and Andheri Kurla stretch. Powai, Malad and Vashi are the preferred IT/ ITES destinations, while Airoli at Navi Mumbai and Lal Bahadur Shastri Marg are
emerging as new offi ce and IT/ITES submakets.
2. Rents/Capital Value: Market average of indicative asking price for Grade A offi ce space.
3. Available Supply: Total Grade A offi ce space being marketed for sale or lease in surveyed quarter.
4. City Barometer: Represents increase, decrease or stable scenario; as compared to previous quarter.
5. All the fi gures in the report is based on market information as on 25th March 2015.
Top 5 Transactions of the Quarter
Key Under Construction Projects
CLIENT BUILDING NAME AREA (SF) LOCATION LEASE / SALE
E-clerx Mindspace SEZ 200,000 Navi Mumbai Lease
Housing.com Nomura 130,000 Powai Lease
Edelweiss Kohinoor City 100,000 Kurla Sale
L&T infotech Mindspace SEZ 90,000 Navi Mumbai Lease
Capegemini Gigaplex 85,000 Navi Mumbai Lease
BUILDING NAME DEVELOPER AREA (SF) LOCATION POSSESSIONSeawood Grand Central Tower I & II L & T Infrastructure 1,350,000 Navi Mumbai 2015
Godrej BKC Godrej Group 1,200,000 BKC 2015
Kohinoor Square Kohinoor Group 800,000 Dadar 2015
Quarter Wise Absorption
Average Rental And Capital Value Trend300
250
30,000
25,000
20,000
15,000
10,000
5,000
0
200
150
100
50
0
2.50
2.00
1.50
1.00
0.50
0.00
1Q 2
013
2Q 2
013
3Q 2
013
4Q 2
013
1Q 2
014
2Q 2
014
3Q 2
014
4Q 2
014
1Q 2
015
Mill
ion
Sq.ft
Rent
al V
alue
s IN
R Pe
r SF
Per
Mon
th
Capt
ial V
alue
s IN
R Pe
r SF
Forecast
1Q 2
008
1Q 2
009
1Q 2
010
1Q 2
011
1Q 2
012
1Q 2
013
1Q 2
014
1Q 2
015
1Q 2
016F
1Q 2
017F

6 Research & Forecast Report | April 2015 | Colliers International
Absorption declined due to shrink in transaction sizeDelhi grade A office leasing market in 1Q 2015 saw an absorption of only 0.11 million sq. ft. Manufacturing sector companies took about 34% (0.03 million sq ft) of this total absorption followed by BFSI 19% and IT/ITeS 18%. Majority of the transactions were concluded in CBD (Connaught Place) (0.03 million sq ft) followed by Saket (0.02 million sq ft) and Jasola (0.01 million sq ft).
There was also demand from Government and media sector for small office space primarily in Central Delhi micro markets. Major transactions during the quarter include the lease of 14,000 sq ft office space by Anchor in TDI Tower at Jasola, 13,000 sq ft by SMCC Construction in Salcon Rasvilas at Saket and the lease of 10,000 sq. ft. by Motilal Oswal in Tolstoy House located at Connaught Place.
The average transactions size in 1Q 2015 was around 6,000 sq ft which is lesser than the previous quarter average of over 35,000 sq ft. This is the primary reason for overall lower absorption numbers.
During the quarter approximately 0.14 million sq. ft. of office space was added to the office market in Delhi. Key projects contributing to this supply were commercial tower on plot 2B by HT Group and commercial tower on plot 32B by an Individual developer both located on Pusa Road and Business Tower by Nagpal Builders located at Okhla Phase II.
Rental Values
*Indicative Grade A rents in INR per SF per month**Connaught Place***Netaji Subhash Place
MICRO MARKETS RENTALVALUE*
% CHANGEQoQ YoY
CBD** 185 - 450 0% 2%
Nehru Place 180 - 225 1% 1%
Saket 140 - 190 0% -6%
Jasola 95 - 130 0% 0%
NSP*** 65 - 75 0% 0%
Research & Forecast Report
Delhi | OfficeApril 2015
City Office Barometer
INDICATORS 1Q 2014 2Q 2015 F
Vacancy
Absorption
Construction
Rental Value
Capital Value

7 Research & Forecast Report | April 2015 | Colliers International
No new commercial grade A offi ce space were launched this quarter. Rents in Delhi remain stable in 1Q 2015 across all the micro markets. Th ere was a marginal increase of 1% QoQ in Nehru Place. Similarly capital values were remained
stable across all the micro markets.
Colliers View
As the economy expands, we expect improvement in overall leasing in coming quarters. However, the demand will primarily come from the companies looking to locate near Government offi ces. Less supply addition due to limited land availability will keep the overall rents stable however select premium building will continue to command premium above market rates.
Top 5 Transactions of the Quarter
Key Under Construction Projects
CLIENT BUILDING NAME AREA (SF) LOCATION LEASE / SALE
Anchor TDI Tower 14,000 Jasola Lease
SMCC Construction Salcon Rasvilas 12,500 Saket Lease
Motilal Oswal Tolstoy House 10,000 Connaught Place Lease
JDSU Infotech Park 9,348 Dundahera Lease
Reliance Corporate IT Park Gopal Das Building 8,250 Connaught Place Lease
BUILDING NAME DEVELOPER AREA (SF) LOCATION POSSESSION
RPS Infi nia RPS Developer 1,000,000 Mathura Road 2015
NBCC Plaza NBCC Ltd. 350,000 Okhla 2015
Caddie Commercial Tower Caddie Hotel 100,000 Aerocity 2015
Quarter Wise Absorption
Average Rental And Capital Value Trend
250
300
30,000
35,000
40,000
25,000
20,000
15,000
10,000
5,000
0
200
150
100
50
0
0.10
0.20
0.30
0.80
0.50
0.60
0.70
0.40
0.00
1Q 2
013
2Q 2
013
3Q 2
013
4Q 2
013
1Q 2
014
2Q 2
014
3Q 2
014
4Q 2
015
1Q 2
015
Mill
ion
Sq.ft
Rent
al V
alue
s IN
R Pe
r SF
Per
Mon
th
Capt
ial V
alue
s IN
R Pe
r SF
Notes:
1. Offi ce Market: Th e commercial areas in New Delhi can be broadly classifi ed into the CBD (Connaught Place), SBD Nehru Place, Bhikaji Cama Place, Netaji Subhash Place, Jasola
and Saket .
2. Rents/Capital Value: Market average of indicative asking price for Grade A offi ce space.
3. Available Supply: Total Grade A offi ce space being marketed for sale or lease in surveyed quarter.
4. City Barometer: Represents increase, decrease or stable scenario; as compared to previous quarter.
5. All the fi gures in the report is based on market information as on 25th March 2015.
Forecast
1Q 2
008
1Q 2
009
1Q 2
010
1Q 2
011
1Q 2
012
1Q 2
013
1Q 2
014
1Q 2
015
1Q 2
016F
1Q 2
017F

8 Research & Forecast Report | April 2015 | Colliers International
Absorption dips marginally by 6% QoQ but solid pipeline for 2QGurgaon commercial real estate market remained active in the first quarter of 2015. The city’s office absorption was recorded at approximately 1.12 million sq ft, which is about 6% lower than that of the previous quarter. IT/ITeS and BFSI with 47% and 25% share, respectively were the prime contributors to this demand. Apart from this, media and entertainment, manufacturing, pharma, FMCG and engineering sectors also leased large office spaces during the quarter. A few notable transactions this quarter were the 0.12 million sq ft office lease by Ernst & Young in Unitech Cyber Park located at Sector 39, 0.10 million sq ft by Arvato in JMD Megapolis located at Sector 48 and 0.08 million sq ft by Boston Consulting in Bestech Business Park located on Sohna Road.
At the end of the quarter, the total available office supply stood at 16 million sq ft. Areas with the highest available supply were Golf Course Road Ext / Sohna Road (30%), Manesar (25%), National Highway 8 (15%), Udyog Vihar and Industrial Sectors (14%) and Golf Course Road (9%). The city witnessed the completion of three small projects this quarter, namely, Spaze Palazo (0.25 million sq ft) by Spaze Group at Sector 69, JMD Empire (0.18 million sq ft) by JMD Group at Golf Course Extension Road and Legends Heights (0.25 million sq ft) by ILD at National Highway 8. Given the large vacant stock, developers continued to refrain from adding speculative supply. Only Earth Group in collaboration with AMB Group launched Earth SKY GATE at Sector 88. It is a mixed-use development project of about 1.5 million sq ft, which will have retail, commercial, bank space and restaurant components.
Research & Forecast Report
Gurgaon | OfficeApril 2015
Rental Values
*Indicative Grade A rents in INR per SF per month
MICRO MARKETS RENTALVALUE*
% CHANGEQoQ YoY
MG Road 100 - 145 0% 7%
DLF Cyber City (IT) 90 - 100 0% 20%
Golf Course Road 55 - 80 0% 17%
Institutional Sectors (Sec 44, 32, 18) 55 - 95 0% 20%
Golf Course Road Ext./Sohna Road 55 - 80 0% 17%
National Highway 8 50 - 150 0% 14%
Udyog Vihar & Industrial Sectors 30 - 45 0% -12%
Manesar 40 - 45 0% 4%
City Office Barometer
INDICATORS 1Q 2015 2Q 2015 F
Vacancy
Absorption
Construction
Rental Value
Capital Value

9 Research & Forecast Report | April 2015 | Colliers International
Rents and capital values in Gurgaon remained stable in 1Q 2015 across all the micro markets due to the large available supply and low absorption witnessed during the quarter.
On the infrastructure front, the new state Government has scrapped the decision to terminate the Kundli-Manesar-Palwal (KMP) Expressway project, and instead has injected fresh funds to the tune of INR 1,200 crores for completion of the project. Th is project will be taken over by the Ministry of Transport from Haryana Industrial and Infrastructure Development Corporation (HSIIDC).
Colliers View
With the number of RFPs fl oating in the market, we anticipate an increase in offi ce absorption in the near future. Th e Udyog Vihar and Institutional sectors will continue to remain the most preferred offi ce locations due to location advantages and competitive rents. Rents are expected to remain on the same levels due to the high vacancy levels and robust under-construction developments in the pipeline, especially in micro markets, such as the Southern Peripheral Road and Golf Course Extension Road, in the coming quarters.
Top 5 Transactions of the Quarter
CLIENT BUILDING NAME AREA (SF) LOCATION LEASE / SALE
Ernst & Young Unitech Cyber Park 125,000 Sector 39 Lease
Boston Consulting Bestech Business Park 80,000 Sohna Road Lease
Nagarro Tower of Arc 70,000 Udyog Vihar Lease
HSBC Plot No. 80 67,000 Udyog Vihar Lease
TCS Vatika Business Park 62,000 Sohna Road Lease
Quarter Wise Absorption
Average Rental And Capital Value Trend
100
140
120
8,000
10,000
14,000
12,000
6,000
4,000
2,000
0
80
60
40
20
0
0.40
0.80
1.20
1.60
2.00
0.00
1Q 2
013
2Q 2
013
3Q 2
013
4Q 2
013
1Q 2
014
2Q 2
014
3Q 2
014
4Q 2
014
1Q 2
015
Mill
ion
Sq.ft
Rent
al V
alue
s IN
R Pe
r SF
Per
Mon
th
Capt
ial V
alue
s IN
R Pe
r SF
Key Under Construction Projects
BUILDING NAME DEVELOPER AREA (SF) LOCATION POSSESSION
Business Club AIPL 700,000 Golf Course Extension Road 2015
Parsvnath IT Park Technicia Parsvnath Developers 695,000 Sohna Road 2015
Unitech Infospace, Gurgaon Phase 2 Building 7 Unitech 450,000 NH-8 2015
Notes:
1. Offi ce Market: Th e prime business locations in Gurgaon are MG Road, Golf Course Road, Cyber City and Udyog Vihar. Manesar on the outskirts of Gurgaon is also emerging as
the city’s new offi ce destination.
2. Rents/Capital Value: Market average of indicative asking price for Grade A offi ce space.
3. Available Supply: Total Grade A offi ce space being marketed for sale or lease in surveyed quarter.
4. City Barometer: Represents increase, decrease or stable scenario; as compared to previous quarter.
5. All the fi gures in the report is based on market information as on 25th March 2015.
Forecast
1Q 2
008
1Q 2
009
1Q 2
010
1Q 2
011
1Q 2
012
1Q 2
013
1Q 2
014
1Q 2
015
1Q 2
016F
1Q 2
017F

10 Research & Forecast Report | April 2015 | Colliers International
Absorption declined in 1Q 2015, despite few large transactionsThe NOIDA office market witnessed a major downturn this quarter, in terms of absorption. The office market witnessed about 0.5 million sq ft of office absorption, which is almost half of 4Q 2014’s absorption figure of 1 million sq ft. Expansion and relocation were the primary demand drivers this quarter. IT / ITeS continued to be the dominant sector leasing office space in NOIDA. There was also some demand from manufacturing companies who leased smaller office spaces in locations like Sector 62 and 59. The most significant leasing transaction for 1Q 2015 took place in Institutional Sector 62, with Kronos leasing 70,000 sq ft in Okaya Blue. Jubilant Industries signed a 67,000-sq ft lease at Logix Technopark and Lava Mobile took 60,000 sq ft in a stand-alone building in Sector 58.
The construction scenario showed signs of improvement, and the city witnessed the completion of over 1.3 million sq ft of prime office space. The projects that were completed this quarter include World Trade Tower by Sapphire Group measuring over 1 million sq ft and located in Sector 16 and Stellar Business Park (0.24 million sq ft) by Stellar Group located in Sector 135 (Expressway).
At present, approximately, 13 million sq ft of Grade A office space is available for lease or sale in the NOIDA office market. Approximately 51% of this vacant stock is located in Institutional Sectors, including locations like Sector 16A, Sector 62 and Sectors 125 to 142. About 48% is available in the Commercial Sector (Sector 18). Overall rise in vacancy
Research & Forecast Report
NOIDA | OfficeApril 2015
Rental Values
*Indicative Grade A rents in INR per SF per month**Sector 18***Sector 16A, 62, 125-142****Sector 124, 57-60, 63-75
MICRO MARKETS RENTALVALUE*
% CHANGEQoQ YoY
Commercial Sectors** 90 - 110 -2% 3%
Institutional Sectors (Non IT)*** 55 - 110 3% 18%
Institutional Sectors (IT)*** 45 - 65 5% 5%
Industrial Sector (IT)**** 35 - 55 5% 15%
City Office Barometer
INDICATORS 1Q 2015 2Q 2015 F
Vacancy
Absorption
Construction
Rental Value
Capital Value

11 Research & Forecast Report | April 2015 | Colliers International
levels was noticed during the quarter due to less absorption and addition of new supply.
In a major offi ce sale transaction, Kotak Mahindra Group and private equity fund New Vernon Capital Llc. have jointly bought Green Boulevard, an information technology (IT) park at Noida in the National Capital Region for Rs 270 crore from 3C Company. Th e property is about 700,000 sq ft located in Sector 62.
Colliers View
We anticipate an increase in absorption in the coming quarters in sectors along NOIDA expressway and Sectors 62 to 65. In the Institutional Sectors, demand will be primarily from midscale IT / ITeS companies, whereas NOIDA expressway will see demand from large corporations. An upward pressure on rents is expected in the Institutional Sectors due to limited supply addition. Meanwhile, other markets will remain stable.
Top 5 Transactions of the Quarter
Key Under Construction Projects
CLIENT BUILDING NAME AREA (SF) LOCATION LEASE / SALE
Kronos Okaya Blue 70,000 Sector 62 Lease
Jubilant Industries Logix Techno Park 67,000 Expressway Lease
Lava Mobile Individual Building 60,000 Sector 58 Lease
Genpact Stellar 135 60,000 Expressway Lease
Oxford Stellar IT Park 20,000 Sector 62 Lease
BUILDING NAME DEVELOPER AREA (SF) LOCATION POSSESSION
Delhi One The 3C Company 2,000,000 DND Flyway 2015
Mist Avenue Bhasin Group 1,000,000 Sector 143 2015
Assotech Business Cresterra Assotech 500,000 Sector 135 2015
Quarter Wise Absorption
Average Rental And Capital Value Trend
70
90
80
8,000
10,000
14,000
12,000
6,000
4,000
2,000
0
60
50
40
30
10
20
0
0.40
0.20
0.60
0.80
1.00
1.20
0.00
1Q 2
013
2Q 2
013
3Q 2
013
4Q 2
013
1Q 2
014
2Q 2
014
3Q 2
014
4Q 2
014
1Q 2
015
Mill
ion
Sq.ft
.Re
ntal
Val
ues
INR
Per
SF P
er M
onth
Capt
ial V
alue
s IN
R Pe
r SF
Notes:
1. Offi ce Market: NOIDA market is comprised of sectors broadly classifi ed as institutional, industrial and commercial sectors. Institutional sectors include sec 16A, 62 and125-142,
industrial sectors include Sec 1-9, 57-60 and 63- 65 while sector 18 is the most developed commercial sector.
2. Rents/Capital Value: Market average of indicative asking price for Grade A offi ce space.
3. Available Supply: Total Grade A offi ce space being marketed for sale or lease in surveyed quarter.
4. City Barometer: Represents increase, decrease or stable scenario; as compared to previous quarter.
5. All the fi gures in the report is based on market information as on 25th March 2015.
Forecast
1Q 2
009
1Q 2
010
1Q 2
011
1Q 2
012
1Q 2
013
1Q 2
014
1Q 2
015
1Q 2
016F
1Q 2
017F

12 Research & Forecast Report | April 2015 | Colliers International
IT/ITeS remains the prime driver with 53% of total absorptionChennai 1Q 2015 absorption stood at 0.8 million sq ft as compared to the previous quarter’s 1.33 million sq ft. The IT/ITES sector accounted for 53% of the total absorption followed by manufacturing at 17% and pharma at 16%. The BFSI, engineering, FMCG, media & entertainment and logistics sectors were also represented in the deals closed during the period. Approximately 50% of total absorption was in the CBD followed by OMR (16%) and Ambattur (11%). Notable transactions include the Income Tax Department taking the entire BSNL Building of 0.19 million sq ft located in the CBD. Apart from this, Ford took 0.06 million sq ft in SP Infocity at OMR and Bank Bazaar took 0.05 million sq ft in India Bulls located at Ambattur.
Cautious market sentiments restricted the new supply to only 0.40 million sq ft. Projects contributing this supply were Lalah Tower (0.28 million sq ft) by Ramaniyam on Nelson Manickam Road; Sri Balaji Complex (0.06 million sq ft) by Shanthi Builders at Royapettah; and AGR Platina (0.05 million sq ft) by an independent developer at Ekkaduthangal. The total available supply for lease / fit-out stood at 10.7 million sq ft. By micro-market, OMR (IT corridor) accounted for 34% of this total available supply, followed by Ambattur 28% and the CBD 27%. No new projects / parts of projects were launched in Chennai during the quarter. Lack of new completed supply has led to a decline in vacancy rates especially on the OMR stretch.
Weak absorption continued to keep pressure on rents and capital values in 1Q 2015, resulting in a marginal decline by 1% in OMR I (Madhya Kailash - Perungudi - Toll Gate I). All
City Office Barometer
Research & Forecast Report
Chennai | OfficeApril 2015
Rental Values
*Indicative Grade A rents in INR per SF per month**OMR I (Madhya Kailash – Perungudi- Toll gate I) ***OMR II (Thoraipakkam – Sholinganallur) & OMR III (Semmencherry – Siruseri)
MICRO MARKETS RENTALVALUE*
% CHANGEQoQ YoY
CBD 60 - 80 0% 0%
Guindy 50 - 60 0% 4%
Ambattur 20 - 30 0% 0%
OMR I** 45 - 60 -1% 1%
OMR II & III*** 25 - 45 0% 0%
GST Road 35 - 40 0% 0%
INDICATORS 1Q 2015 2Q 2015 F
Vacancy
Absorption
Construction
Rental Value
Capital Value

13 Research & Forecast Report | April 2015 | Colliers International
other micro-markets remained stable; this is also attributed to the huge vacant stock, especially on the OMR stretch.
During this quarter, the Chennai Government has allocated INR500 and INR750 crore for the Chennai Mega City Development Mission and the Integrated Urban Development Mission, respectively for 2015 - 2016. Apart from this, the sum of INR420 crore has been allocated for the Tamil Nadu Urban Road Infrastructure Fund. Civic bodies are targeting the overall infrastructure development of the city through these funds.
Colliers View
Th e demand for offi ce space is expected to gain further momentum in line with the revival in economic growth projected for the medium term. However, the high vacancy level, coupled with upcoming supply is likely to restrain the rent growth particularly in micro-markets like Th oraipakkam, Sholinganallur and Semmenchery to Siruseri over the next few quarters.
Top 5 Transactions of the Quarter
Key Under Construction Projects
CLIENT BUILDING NAME AREA (SF) LOCATION LEASE / SALE
Income Tax Department BSNL Buidling 197,000 CBD Lease
Ford SP Infocity 69,000 Old Mahabalipuram Road Lease
Bank Bazaar India Bulls 50,000 Ambattur Lease
Citi Bank TRIL 44,000 Old Mahabalipuram Road Lease
Vasan Eye care Hospital Harini Towers 40,000 CBD Lease
BUILDING NAME DEVELOPER AREA (SF) LOCATION POSSESSION
SP InfoCity, OMR Phase 2 Shapoorji Pallonji Group 1,200,000 Old Mahabalipuram Road 2015
Chennai One (BPO Park) Phase 2 ETL Developers 1,100,000 Old Mahabalipuram Road 2015
Estancia Block B2 L&T & Arun Excello 469,000 GST Road 2015
Notes:
1. Offi ce Market: Prime offi ce properties in Chennai are located in four principal sub-markets: the CBD, SBD (Guindy, Manpakkam,Velachery) and the PBD (Old Mahaballipuram
Road (OMR).
2. Rents/Capital Value: Market average of indicative asking price for Grade A offi ce space.
3. Available Supply: Total Grade A offi ce space being marketed for sale or lease in surveyed quarter.
4. City Barometer: Represents increase, decrease or stable scenario; as compared to previous quarter.
5. All the fi gures in the report is based on market information as on 25th March 2015.
Quarter Wise Absorption
Average Rental And Capital Value Trend
105
9,000
10,500
7,500
6,000
4,500
3,000
1,500
0
90
75
60
45
15
30
0
0.4
0.8
1.2
1.6
2.0
2.4
0
1Q 2
013
2Q 2
013
3Q 2
013
4Q 2
013
1Q 2
014
2Q 2
014
3Q 2
014
4Q 2
014
1Q 2
015
Mill
ion
Sq.ft
Rent
al V
alue
s IN
R Pe
r Sq
Ft P
er M
onth
Capi
tal V
alue
s IN
R Pe
r Sq
.ft
1Q 2
008
1Q 2
009
1Q 2
010
1Q 2
011
1Q 2
012
1Q 2
013
1Q 2
014
1Q 2
015
1Q 2
016F
1Q 2
017F
Forecast

14 Research & Forecast Report | April 2015 | Colliers International
Momentum continues with over 2.3 million sq ft of office absorptionIt was another solid performance for the Bengaluru office market in 1Q 2015, with office absorption totalling 2.31 million sq ft. Apart from this, about 1.74 million sq ft of office space was pre-committed for build to suit by MNCs like Amazon, Wells Fargo, Arista Networks and WSP Consultants. IT / ITeS commanded the absorption with about 69% (1.6 million sq ft), followed by BFSI sector 14% and Retail 6%. SBD locations, such as Bannerghatta Road, Koramangala, Malleswaram, Yamalur, J P Nagar and Outer Ring Road - Marathahalli to KR Puram, saw maximum traction with about 1.4 million sq ft office absorption, trailed by PBD locations like Whitefield, Hosur Road and Outer Ring Road - KR Puram to Hebbal, where more than 0.45 million sq ft was leased during the quarter.
Bengaluru recorded new supply of over 2.1 million sq ft in 1Q 2015, 23% higher than that of the previous quarter. Projects constituting this supply were Purva Gainz by Purvankara Projects and Prestige Trinity Center by Prestige Group both located at Hosur Road, Divyasree Technopolis - Block by Divyasree at Yamalur, Global Village – SEZ by Tanglin Group at Mysore Road and Pritech - Block 14 by Primal Group at ORR – Marathahalli – Sarjapur Road. The total available stock for fit-outs was approximately 11 million sq ft. EPIP Zone / Whitefield accounted for 39% of the total stock, followed by Outer Ring Road (24%) and Electronic City (18%).
City Office Barometer
Research & Forecast Report
Bengaluru | OfficeApril 2015
Rental Values
*Indicative Grade A rents in INR per SF per month**Northern part of ORR - KR Puram till Hebbal
MICRO MARKETS RENTALVALUE*
% CHANGEQoQ YoY
CBD 90 - 130 0% 16%
Outer Ring Road (Marathalli - Sarjapur)
55 - 63 0% 7%
Outer Ring Road (North)** 53 - 60 0% 0%
Bannerghatta Road 50 - 60 0% 0%
EPIP Zone/ Whitefield 28 - 36 0% 0%
Hosur Road 25 - 40 0% 8%
Electronic City 26 - 33 0% 7%
INDICATORS 1Q 2015 2Q 2015 F
Vacancy
Absorption
Construction
Rental Value
Capital Value

15 Research & Forecast Report | April 2015 | Colliers International
Th e quarter witnessed many new project launches during the quarter, such as Embassy Tech Village, HVP Crest, Mantri Agara Project, Vaishnavi Project and Primal Park (RGA Tech Park) – Blocks 3 and 4. All these projects are expected to add more than 4 million sq ft of Grade A offi ce space between 2016–17 in the city’s inventory.
Rental values were remained stable across Bengaluru, however capital values posted an average rise of 2% QoQ across the city, except CBD, Hosur Road and Bannerghatta Road where capital values were remained stable.
In one of the major real estate transactions, Brigade Group and GIC Singapore jointly bought Hindustan Unilever Ltd. (HUL)’s prime 26 acres of land located in Whitefi eld to develop an IT Special Economic Zone. Th e property is located in a prime location with connectivity to two IT hubs, namely, Whitefi eld and Outer Ring Road.
Colliers View
Overall, the Bengaluru offi ce market is in the “sweet spot” in terms of supply-and-demand fundamentals. About 2 million sq ft of offi ce space is expected to witness completion next quarter, out of which about 0.2 million sq ft is already committed. Th is steady increase in development activity and greater domestic and foreign investor interest in offi ce market should result in additional occupancy and rent growth. Select micro markets located along Outer Ring Road (Marthalli - Sarjapur) and EPIP Zone / Whitefi eld will continue to remain preferred micro markets among occupiers due to their strategic locations.
Top 5 Transactions of the Quarter
Key Under Construction Projects
CLIENT BUILDING NAME AREA (SF) LOCATION LEASE / SALE
Amazon Constellation Business Park 500,000 Outer Ring Road Lease
Misys World Technology Centre 150,000 Outer Ring Road Lease
Nokia Karle Town Centre 131,640 Outer Ring Road Lease
Epsilon Karle Town Centre 131,640 Outer Ring Road Lease
GCC Services India Pvt Ltd World Technology Centre 131,211 Outer Ring Road Lease
BUILDING NAME DEVELOPER AREA (SF) LOCATION POSSESSION
Maple Tree - 1 Phase Adamas Builder 900,000 Outer Ring Road 2015
Bagmane Constellation Business Park - Virgo Block Bagmane Developers 800,000 Outer Ring Road 2015
RGA Tech Park Primal Realty 800,000 Sarjapur Road 2015
Quarter Wise Absorption
Average Rental And Capital Value Trend
8,000
10,000
12,000
6,000
4,000
2,000
0
70
60
50
40
30
10
20
0
2
1
3
4
5
6
7
0
1Q 2
013
2Q 2
013
3Q 2
013
4Q 2
013
1Q 2
014
2Q 2
014
3Q 2
014
4Q 2
014
1Q 2
015
Mill
ion
Sq.ft
Rent
al V
alue
s IN
R Pe
r Sq
Ft P
er M
onth
Capi
tal V
alue
s IN
R Pe
r Sq
.ft
Notes:
1. Offi ce Market: Prime offi ce properties in Bengaluru can be divided into three principal sub-market— CBD/Off CBD (MG Road, Millers Road, Vittal Mallya Road etc.) the SBD
(Banerghatta Road & Outer Ring Road (ORR)) and PBD (Hosur Road, EPIP Zone, Electronic City and Whitefi eld).
2. Rents/Capital Value: Market average of indicative asking price for Grade A offi ce space.
3. Available Supply: Total Grade A offi ce space being marketed for sale or lease in surveyed quarter.
4. City Barometer: Represents increase, decrease or stable scenario; as compared to previous quarter.
5. All the fi gures in the report is based on market information as on 25th March 2015.
Forecast
1Q 2
008
1Q 2
009
1Q 2
010
1Q 2
011
1Q 2
012
1Q 2
013
1Q 2
014
1Q 2
015
1Q 2
016F
1Q 2
017F
16 Research & Forecast Report | April 2015 | Colliers International
Transaction volumes picks up in 1Q 2015During 1Q 2015, Kolkata office market showed signs of improvement with over 0.22 million sq ft of absorption compared to the previous quarter’s absorption of only 0.15 million sq ft. IT / ITeS occupiers topped the chart with over 36% of the total, followed by manufacturing 29% and BFSI 13%. Major transactions during the quarter included the lease of 0.05 million sq ft office space by Siemens VAI in Godrej Water Side and the lease of 0.02 million sq ft by NIIT in Eco Space. Sector V / New Town remained the preferred micro market among occupiers, with 79% share in the total absorption. A few small deals were also concluded in the CBD and SBD micro markets. Developers continued to remain watchful in launching new projects because many of the large office spaces are currently struggling with leases / sales due to the limited new entrants and the absence of expansion plans of existing occupiers.
Similarly, the city did not witness any major completion during the quarter due to cautious approach from developers and low absorption levels seen in the past few quarters. Meanwhile, PS Group completed its Non-IT building, PS-Arcadia (0.1 million sq ft), located in Camac Street area, which is part of CBD.
Rents across Kolkata remained stable during the quarter, with a marginal decline recorded in Sector V / New Town micro market due to large availability of supply and limited demand pipeline. Similarly, capital values declined in Sector V / New Town and PBD micro markets in the range of 2–3% QoQ. The rest of the micro markets remained stable.
City Office Barometer
Research & Forecast Report
Kolkata | OfficeApril 2015
Rental Values
*Indicative Grade A rents in INR per SF per month**Park Street, Camac Street, Chowranghee Road, AJC Bose Road***EM Bypass, Topsia, Ruby****Salt Lake, New Town, Rajarhat
MICRO MARKETS RENTALVALUE*
% CHANGEQoQ YoY
CBD** 85 - 115 0% -7%
SBD*** 65 - 75 0% -7%
Sector V 40 - 45 -8% -11%
PBD**** 34 - 35 0% -3%
INDICATORS 1Q 2015 2Q 2015 F
Vacancy
Absorption
Construction
Rental Value
Capital Value

17 Research & Forecast Report | April 2015 | Colliers International
Colliers View
Th e overall market sentiment improved in the fi rst quarter. However, developers are not very optimistic about the continuation of this absorption trend. Th e city is expected to see very limited supply in the form of small- to medium-sized projects as developers are focusing on fi nishing projects with small- to medium-sized fl oor plates, which are relatively easy to lease. Rentals are expected to remain stable primarily because of existing vacancy and low absorption base.
Top 5 Transactions of the Quarter
Key Under Construction Projects
CLIENT BUILDING NAME AREA (SF) LOCATION LEASE / SALE
Siemens VAI Godrej Water Side 46,769 Sector V Lease
NIIT Eco Space 18,000 New Town Lease
PWC South City Pinacle 13,777 Sector V Lease
Religare PS Arcadia Central 10,000 Camac Street Lease
Honda Motors Eco Space 9,167 New Town Lease
BUILDING NAME DEVELOPER AREA (SF) LOCATION POSSESSION
Mani Twin Mani Group 1,800,000 Rajarhat 2015
Technopolis 2 Forum Projects 1,200,000 Bantala 2015
Magnacon Infi nity Group 740,000 Salt Lake 2015
Notes:
1. Offi ce Market: Th e major business locations in Kolkata are CBD (Park Street, Camac Street, Chowranghee Rd, AJC Bose Rd), East Kolkata (EM Bypass, Topsia, Ruby), Salt Lake/
Sector V and New Town / Rajarhat.
2. Rents/Capital Value: Market average of indicative asking price for Grade A offi ce space.
3. Available Supply: Total Grade A offi ce space being marketed for sale or lease in surveyed quarter.
4. City Barometer: Represents increase, decrease or stable scenario; as compared to previous quarter.
5. All the fi gures in the report is based on market information as on 25th March 2015.
Quarter Wise Absorption
Average Rental And Capital Value Trend
8,000
10,000
12,000
6,000
4,000
2,000
0
120
100
80
60
20
40
0
0.50
0.40
0.30
0.20
0.10
0.60
0.70
0.80
0.90
1.00
0.00
1Q 2
013
2Q 2
013
3Q 2
013
4Q 2
013
1Q 2
014
2Q 2
014
3Q 2
014
4Q 2
014
1Q 2
015
Mill
ion
Sq.ft
Rent
al V
alue
s IN
R Pe
r Sq
Ft P
er M
onth
Capi
tal V
alue
s IN
R Pe
r Sq
.ft.
1Q 2
008
Forecast
1Q 2
009
1Q 2
010
1Q 2
011
1Q 2
012
1Q 2
013
1Q 2
014
1Q 2
015
1Q 2
016F
1Q 2
017F

18 Research & Forecast Report | April 2015 | Colliers International
IT / ITeS driving the city office real estateRenewals and expansions by IT / ITeS companies continued to drive the Pune office market in 1Q 2015. However, the city’s office absorption was recorded at approximately 0.89 million sq ft, which is 40% lower than the previous quarter’s absorption. Nagar Road and Airport Road / Pune Station continued to remain as the most preferred locations by major occupants, each with about 24% of the total absorption, followed by Hinjewadi and Hadapsar / Fursungi, each with about 16%.
Occupiers from the IT / ITeS sector were the primary contributors to this demand, taking up more than 90% of the total absorption. This was followed by other sectors like Logistics, Pharma and Manufacturing, accounting for over 7% of the total absorption. A number of large-floor plate deals were concluded this quarter, like the 0.13 million sq ft lease by Vodafone India in Business @ Mantri located on Nagar Road. In addition, Amdocs took 0.08 million sq ft in Magarpatta Cybercity Tower 3, and more than 0.05 million sq ft each was taken by Rockwell Automation and Access Health Services in Embassy - Mississippi located at Hinjewadi.
About 4 million sq ft was available for lease in Pune market, of which 24% was located on the Airport Road / Pune Station, 18% Nagar Road and 16% in Hinjewadi. The city witnessed limited new supply, and only about 0.64 million sq ft of Grade A supply was added to the city’s Grade A inventory. Projects that contributed to this new supply were Marvel Alaina and Marvel Edge, both by Marvel Group, at Koregaon Park and Viman Nagar, respectively.
Despite low absorption, developers like Vascon launched
City Office Barometer
Research & Forecast Report
Pune | OfficeApril 2015
Rental Values
*Indicative Grade A rents in INR per SF per month
MICRO MARKETS RENTALVALUE*
% CHANGEQoQ YoY
Baner 45 - 55 0% 0%
Bund Garden 50 - 65 0% 0%
Airport road/pune station 45 - 75 0% 7%
Aundh 45 - 60 0% 0%
Senapati Bapat Road 55 - 85 0% 0%
Bavdhan 35 - 45 0% 0%
Kalyani Nagar 45 - 60 0% 0%
Nagar Road 40 - 60 0% 0%
Hinjewadi 34 - 45 3% 3%
Hadapsar/Fursungi 38 - 65 0% 7%
Kharadi 34 - 65 2% 2%
INDICATORS 1Q 2015 2Q 2015 F
Vacancy
Absorption
Construction
Rental Value
Capital Value

19 Research & Forecast Report | April 2015 | Colliers International
Platinum Square (0.04 million sq ft) at Viman Nagar, Nyati launched Nyati Emporius (0.03 million sq ft) at Baner and MSR Group launched a 0.07 million sq ft project at Sangamwadi. Th ese projects are currently under construction and are expected to be completed in 2016.
Th e rents for prime offi ce property remained stable across all major micro markets, except in Hinjewadi and Kharadi, where rents rose by 2–3% QoQ. Capital values remained on the same level compared to that of the previous quarter across Pune.
Colliers View
Th e offi ce market of Pune will continue to remain upbeat due to strong fundamentals. IT/ITeS will remain as the key occupier in the coming quarters of 2015. Vacancy is expected to decline due to lesser amount of new supply and increase in absorption. Rents are expected to inch up in medium term.
Top 5 Transactions of the Quarter
Key Under Construction Projects
CLIENT BUILDING NAME AREA (SF) LOCATION LEASE / SALE
Vodafone India Business @ Mantri 133,379 Nagar Road Lease
Amdocs Magarpatta Cybercity Tower-3 88,000 Hadapsar Lease
Rockwell Automation Embassy - Mississippi 51,516 Hinjewadi Lease
Access Health Services Embassy - Mississippi 51,116 Hinjewadi Lease
HCL Business Bay 46,000 Yerwada Lease
BUILDING NAME DEVELOPER AREA (SF) LOCATION POSSESSION
SP Infocity Building 5 Shapoorji Pallonji Group 800,000 Phursungi 2015
Commerzone Building 8 K Raheja Corp 420,000 Yerwada 2015
Acendas Phase II Acendas 615,000 Hinjewadi 2015
Notes:
1. Offi ce Market: Th e prime offi ce sub-markets of Pune include CBD (Deccan Gymkhana, Bund Garden Road, Senapati Bapat Road & Camp), Off CBD (Aundh, Airport Road and
Kalyani Nagar) and the eastern corridor, along with Nagar Road and Kharadi, which have emerged as a preferred location for fi nancial and IT/ITES companies.
2. Rents/Capital Value: Market average of indicative asking price for Grade A offi ce space.
3. Available Supply: Total Grade A offi ce space being marketed for sale or lease in surveyed quarter.
4. City Barometer: Represents increase, decrease or stable scenario; as compared to previous quarter.
5. All the fi gures in the report is based on market information as on 25th March 2015.
Quarter Wise Absorption
Average Rental And Capital Value Trend
6,000
7,000
8,000
5,000
4,000
3,000
2,000
1,000
0
80
70
60
50
20
10
40
30
0
0.30
0.60
0.90
1.20
1.50
1.80
0.00
1Q 2
013
2Q 2
013
3Q 2
013
4Q 2
013
1Q 2
014
2Q 2
014
4Q 2
014
1Q 2
015
3Q 2
014
Mill
ion
Sq.ft
Rent
al V
alue
s IN
R Pe
r Sq
Ft P
er M
onth
Capi
tal V
alue
s IN
R Pe
r Sq
.ft.
1Q 2
008
1Q 2
009
1Q 2
010
1Q 2
011
1Q 2
012
1Q 2
013
1Q 2
014
1Q 2
015
1Q 2
016F
1Q 2
017F
Forecast

About Colliers International
colliers.com
67 countries on 6 continentsUnited States: 140 Canada: 31 Latin America: 24
199 EMEA: 108
$2.3billion in annual revenue
1.7billion square feet under management
16,300professionals
Primary Authors:
Surabhi Arora Associate Director | Research +91 124 456 [email protected]
Sachin Sharma Manager | Research
Amit Oberoi I National DirectorValuation & Advisory Services & Research
For Office Services:
Mumbai: George Mckay I South Asia [email protected]
Delhi / NCR: Vikas Kalia | National [email protected]
Bengaluru: Goutam Chakraborty I [email protected]
Pune: Rishav Vij I Senior Associate [email protected]
Chennai: Kaushik Reddy I [email protected]
Kolkata: Swapan Dutta I Senior Associate [email protected]
Colliers InternationalTechnopolis Building, 1st Floor, DLF Golf Course Road, Sector 54, Gurgaon - 122 002TEL +91 124 456 7500
502
2015


