22
India Office: Trends to watch for in 2015
| Date post: | 16-Jul-2015 |
| Category: |
Real Estate |
| Upload: | colliers-international |
| View: | 514 times |
| Download: | 0 times |

India Office: Trends to watch for in 2015
3 Research & Forecast Report | January 2015 | Colliers International
Table of ContentsInfographIcs 2014 Actual & 2015 Forecast 4
Year In revIew 2014 6
MuMbaI Transaction volumes pick up towards the end of the year 8
DelhI Office demand doubled in 2014; Prospects looks bright 10
gurgaon Absorption dipped by 13% YoY in 2014 but good prospects for 2015 12
noIDa Recovery seems to be on cards with revived IT/ITeS demand 14
chennaI Developers remain cautious due to low absorption 16
bengaluru Steals the show with over 13.77 million sq ft of absorption 18
KolKata Market is likely to remain stagnant in 2015 20
pune Another Silicon Valley in the making 22

13.77
4.11
3.12
4.91
7.71
12.36
6.36
3.80
5.13
1.10
7.97
VACANCY TRENDS
34.92 MN SF was absorbed in 2014 in 6major metros
Bengaluru tops the chart with 40% sharefollowed by Delhi NCR with 22%
66% of the total absorption was contributed by IT/ITeS Sector followed by BFSI 13%
ABSORPTION
CHENNAI
PUNE
MUMBAI
DEHLINCR
BENGALURU
14.0%15.0%
19.0%20.0%
22.5%23.0%
20.5%
21.5%
19.0%19.5%
KOLKATA
INDIA OFFICE TRENDS 3 TO WATCH IN 2015
NEW SUPPLY - 2014 & PIPELINE 2015 MAJOR OFFICE SALE TRANSACTION *
MUM
BAI
DELH
I NCR
CHEN
NAI
KOLK
ATA
PUNE
BENG
ALUR
U
3.30 5.
23 7.16
3.47 5.
205.
12
1.14
1.00
3.00
12.9
8
10.2
5
8.00
2014 2015 Forecast (in MN SF)
GRADE - A AVERAGE RENTAL GROWTH
MUM
BAI
DELH
I NCR
CHEN
NAI
KOLK
ATA
PUNE
BENG
ALUR
U
3.8% 1.
9% 1.3%2.
7%
6.5%
10.2
%
1.5%3.
00%
2.7% 8
2014 2015 Forecast
2014 2015 Forecast
2014
2015 Forecast (In MN SF)
`625 Cr
Express Towers, Mumbai
Buyer: Blackstone & PanchshilSeller: Indian
Express Group
Hindustan Unilever Building,
MumbaiBuyer: HDFCSeller: HUL
`900 Cr`870 Cr
Galaxy IT Park, NOIDA & Blue Ridge SEZ,
Pune Buyer: Blackstone
Seller: IDFC Alternatives
`115 Cr
`300 Cr
-7.0
%
2.00
%
Mumbai, Delhi-NCR, BengaluruChennai, Kolkata & Pune
India O�ce
Strong economic growth will lead to better performing leasing markets and strong investment demand.
* Secondary sources like media publication
1
IT/ITes will continue to dominate tenant demand with increase share of E-com-merce companies.
2
O¤ce market will see more en-block sales due to great interest of o¥ shore groups entering Indian markets for REIT listing.
3
13.0%13.0%
1.30
Equinox Tech Park, BengaluruBuyer: Infosys Technologies
Seller: Equinox Realty
Oxygen SEZ, NOIDABuyer: Blackstone
Seller: 3C Developers
Chennai
Bengaluru
PuneMumbai
Delhi NCR
Kolkata
2014 ACTUAL I 2015 FORECAST
0.0%
4 5Research & Forecast Report | January 2015 | Colliers International Research & Forecast Report | January 2015 | Colliers International

6 Research & Forecast Report | January 2015 | Colliers International
Return on Alternative Investments
Economic Barometer
Note: 1 Estimates as per International Monetary Fund2 Wholesale Price Index (WPI) Till Nov 20143 SBI interest rate < INR 1 crore Term Deposits for≤ 1 Year
Research & Forecast Report
India | OfficeJanuary | 2015
Year in Review 2014The year 2014 was an eventful one for the commercial real estate market in India. Despondency was the overbearing mood in the first half, that changed overnight with the announcement of the general election results. With the outcome of the elections and a resulting stable government, the overall sentiment started improving in the second half of the year as reflected by the Business and Consumer confidence indices’s. Also, there was an improvement in other macro-economic indicators notably the GDP and the inflation. The improved economic sentiment led to companies revisiting their office space requirement and future expansion plans. Some of this was reflected in the total space absorbed in 2014. We anticipate more robust expansion plans in 2015.
About 35 million sq ft of office space was absorbed in 2014 in the top 6 cities of India. This is 11% more than the absorption in 2013.
Bengaluru had the lion’s share of the office space demand. Over 39% of the office space absorbed in the top 6 cities in 2014 was occupied in Bengaluru, followed by Delhi NCR (22%) and Pune (14%). The demand for Grade ‘A’ office space was driven by technology companies. Taking cues from the positive economic sentiments, most large occupiers are reviewing their long pending CRE decisions. Tenants in expansion mode relocated and locked in large office spaces at favourable lease terms in these cities. For instance, e-commerce giant Flipkart leased 3.5 million sq ft in Bengaluru, KPMG and Honeywell pre-committed to approximately 1.6 million sq ft in Bangalore, Accenture pre-committed around 0.9 million sq ft in Pune and Aricent took around 0.5 million sq ft in Gurgaon.
The real estate sentiments were further boosted due to some key announcements regarding real estate in the
Indicators 2013 2014Gross Domestic Product 4.70% 5.70%1
Business Confidence Index 45.70% 57.00%
Repo Rate 7.75% 8.00%
Reverse Repo Rate 6.75% 7.00%
Cash Reserve Ratio 4.00% 4.00%
Inflation (WPI)2 7.52% 0.00%
Prime Lending Rate 10.00% - 10.30% 10.00% - 10.25%
Deposit Rate3 8.00% - 9.05% 8.00% - 9.00%
Exchange Rates 2013 2014
INR - USD 60.56 61.85
INR - EURO 80.41 77.41
Parameters 2013 2014 YoYCHANGE
Gold 29,877 26,507 -11.28%
Silver 43,413 35,999 -17.08%
Equity(BSE Sensex) 21,171 27,506 29.92%
Realty Index 1,433 1,502 4.79%
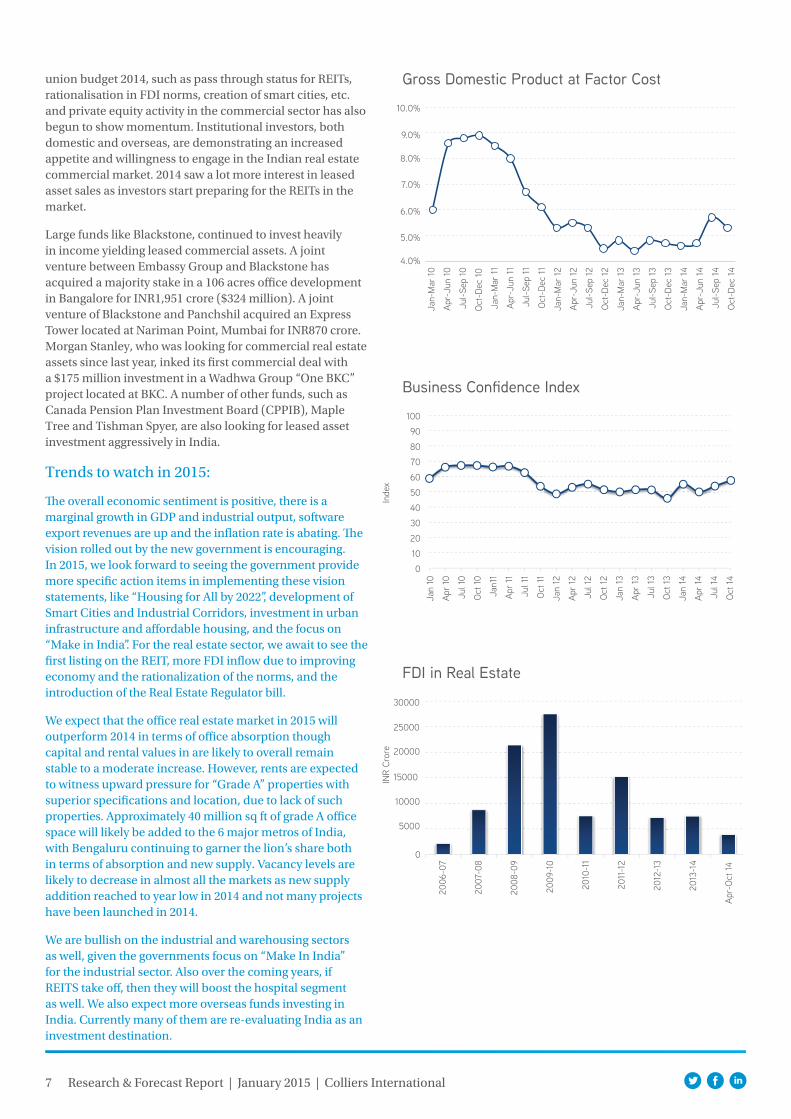
union budget 2014, such as pass through status for REITs, rationalisation in FDI norms, creation of smart cities, etc. and private equity activity in the commercial sector has also begun to show momentum. Institutional investors, both domestic and overseas, are demonstrating an increased appetite and willingness to engage in the Indian real estate commercial market. 2014 saw a lot more interest in leased asset sales as investors start preparing for the REITs in the market.
Large funds like Blackstone, continued to invest heavily in income yielding leased commercial assets. A joint venture between Embassy Group and Blackstone has acquired a majority stake in a 106 acres office development in Bangalore for INR1,951 crore ($324 million). A joint venture of Blackstone and Panchshil acquired an Express Tower located at Nariman Point, Mumbai for INR870 crore. Morgan Stanley, who was looking for commercial real estate assets since last year, inked its first commercial deal with a $175 million investment in a Wadhwa Group “One BKC” project located at BKC. A number of other funds, such as Canada Pension Plan Investment Board (CPPIB), Maple Tree and Tishman Spyer, are also looking for leased asset investment aggressively in India.
Trends to watch in 2015:
The overall economic sentiment is positive, there is a marginal growth in GDP and industrial output, software export revenues are up and the inflation rate is abating. The vision rolled out by the new government is encouraging. In 2015, we look forward to seeing the government provide more specific action items in implementing these vision statements, like “Housing for All by 2022”, development of Smart Cities and Industrial Corridors, investment in urban infrastructure and affordable housing, and the focus on “Make in India”. For the real estate sector, we await to see the first listing on the REIT, more FDI inflow due to improving economy and the rationalization of the norms, and the introduction of the Real Estate Regulator bill.
We expect that the office real estate market in 2015 will outperform 2014 in terms of office absorption though capital and rental values in are likely to overall remain stable to a moderate increase. However, rents are expected to witness upward pressure for “Grade A” properties with superior specifications and location, due to lack of such properties. Approximately 40 million sq ft of grade A office space will likely be added to the 6 major metros of India, with Bengaluru continuing to garner the lion’s share both in terms of absorption and new supply. Vacancy levels are likely to decrease in almost all the markets as new supply addition reached to year low in 2014 and not many projects have been launched in 2014.
We are bullish on the industrial and warehousing sectors as well, given the governments focus on “Make In India” for the industrial sector. Also over the coming years, if REITS take off, then they will boost the hospital segment as well. We also expect more overseas funds investing in India. Currently many of them are re-evaluating India as an investment destination.
7 Research & Forecast Report | January 2015 | Colliers International
FDI in Real Estate
5000
10000
15000
20000
25000
30000
0
2006
-07
2010
-11
2007
-08
2011
-12
2012
-13
2008
-09
2013
-14
2009
-10
Apr-
Oct
14
Gross Domestic Product at Factor Cost
4.0%
5.0%
6.0%
7.0%
8.0%
9.0%
10.0%
Jan-
Mar
10
Apr-
Jun
10
Jul-S
ep 1
0
Oct
-Dec
10
Jan-
Mar
11
Jan-
Mar
12
Jan-
Mar
13
Jan-
Mar
14
Apr-
Jun
11
Apr-
Jun
12
Apr-
Jun
13
Apr-
Jun
14
Jul-S
ep 1
1
Jul-S
ep 1
2
Jul-S
ep 1
3
Jul-S
ep 1
4
Oct
-Dec
11
Oct
-Dec
12
Oct
-Dec
13
Oct
-Dec
14
Business Confidence Index
0
10
20
30
40
50
60
70
80
90
100Ja
n 10
Jan
12
Jan1
1
Jan
13
Jan
14
Apr
10
Apr
12
Apr
11
Apr
13
Apr
14
Jul 1
0
Jul 1
2
Jul 1
1
Jul 1
3
Jul 1
4
Oct
10
Oct
12
Oct
11
Oct
13
Oct
14
Inde
xIN
R Cr
ore
8 Research & Forecast Report | January 2015 | Colliers International
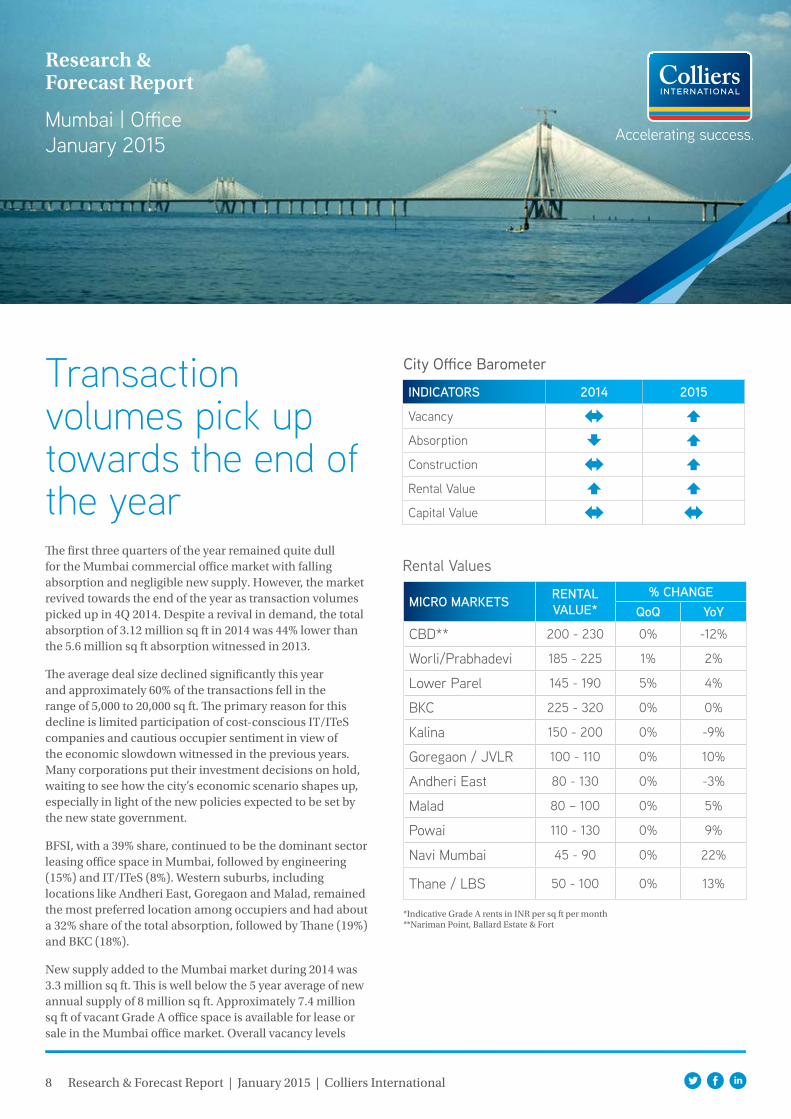
Transaction volumes pick up towards the end of the yearThe first three quarters of the year remained quite dull for the Mumbai commercial office market with falling absorption and negligible new supply. However, the market revived towards the end of the year as transaction volumes picked up in 4Q 2014. Despite a revival in demand, the total absorption of 3.12 million sq ft in 2014 was 44% lower than the 5.6 million sq ft absorption witnessed in 2013.
The average deal size declined significantly this year and approximately 60% of the transactions fell in the range of 5,000 to 20,000 sq ft. The primary reason for this decline is limited participation of cost-conscious IT/ITeS companies and cautious occupier sentiment in view of the economic slowdown witnessed in the previous years. Many corporations put their investment decisions on hold, waiting to see how the city’s economic scenario shapes up, especially in light of the new policies expected to be set by the new state government.
BFSI, with a 39% share, continued to be the dominant sector leasing office space in Mumbai, followed by engineering (15%) and IT/ITeS (8%). Western suburbs, including locations like Andheri East, Goregaon and Malad, remained the most preferred location among occupiers and had about a 32% share of the total absorption, followed by Thane (19%) and BKC (18%).
New supply added to the Mumbai market during 2014 was 3.3 million sq ft. This is well below the 5 year average of new annual supply of 8 million sq ft. Approximately 7.4 million sq ft of vacant Grade A office space is available for lease or sale in the Mumbai office market. Overall vacancy levels
Rental Values
*Indicative Grade A rents in INR per sq ft per month**Nariman Point, Ballard Estate & Fort
Research & Forecast Report
Mumbai | OfficeJanuary 2015
MICRO MARKETS RENTALVALUE*
% CHANGEQoQ YoY
CBD** 200 - 230 0% -12%
Worli/Prabhadevi 185 - 225 1% 2%
Lower Parel 145 - 190 5% 4%
BKC 225 - 320 0% 0%
Kalina 150 - 200 0% -9%
Goregaon / JVLR 100 - 110 0% 10%
Andheri East 80 - 130 0% -3%
Malad 80 – 100 0% 5%
Powai 110 - 130 0% 9%
Navi Mumbai 45 - 90 0% 22%
Thane / LBS 50 - 100 0% 13%
City Office Barometer
INDICATORS 2014 2015
Vacancy
Absorption
Construction
Rental Value
Capital Value
9 Research & Forecast Report | January 2015 | Colliers International
Source: Colliers International
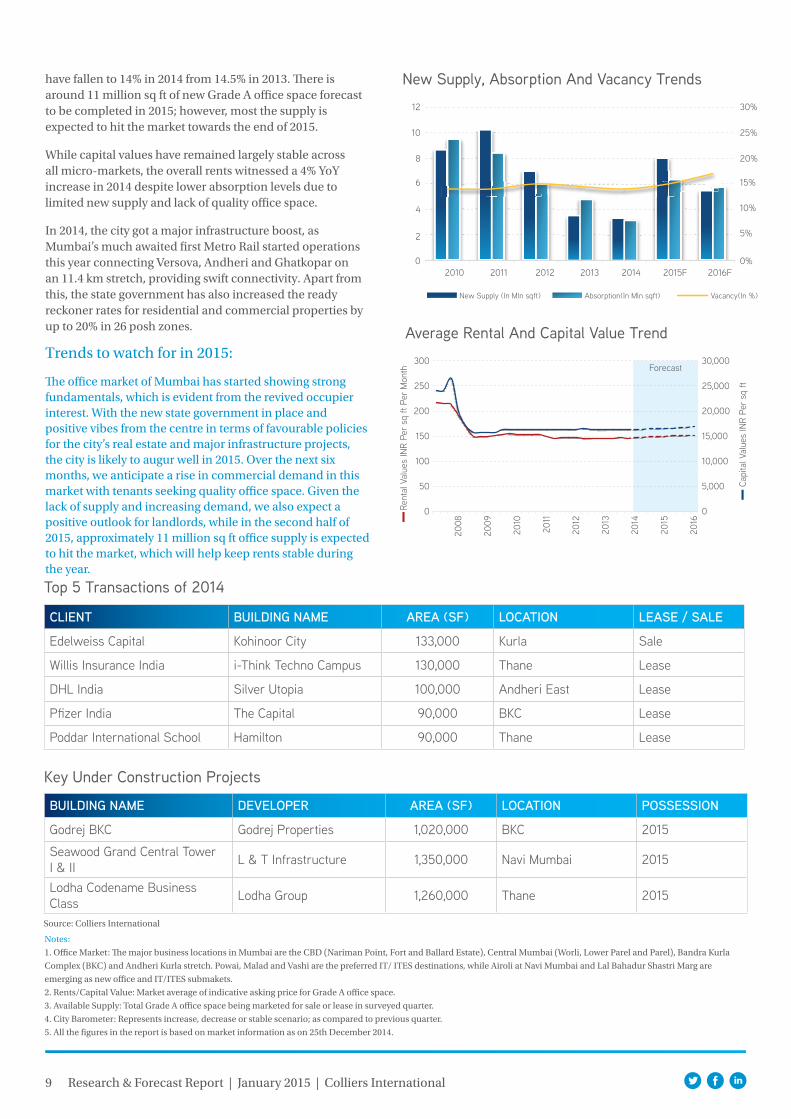
have fallen to 14% in 2014 from 14.5% in 2013. There is around 11 million sq ft of new Grade A office space forecast to be completed in 2015; however, most the supply is expected to hit the market towards the end of 2015.
While capital values have remained largely stable across all micro-markets, the overall rents witnessed a 4% YoY increase in 2014 despite lower absorption levels due to limited new supply and lack of quality office space.
In 2014, the city got a major infrastructure boost, as Mumbai’s much awaited first Metro Rail started operations this year connecting Versova, Andheri and Ghatkopar on an 11.4 km stretch, providing swift connectivity. Apart from this, the state government has also increased the ready reckoner rates for residential and commercial properties by up to 20% in 26 posh zones.
Trends to watch for in 2015:
The office market of Mumbai has started showing strong fundamentals, which is evident from the revived occupier interest. With the new state government in place and positive vibes from the centre in terms of favourable policies for the city’s real estate and major infrastructure projects, the city is likely to augur well in 2015. Over the next six months, we anticipate a rise in commercial demand in this market with tenants seeking quality office space. Given the lack of supply and increasing demand, we also expect a positive outlook for landlords, while in the second half of 2015, approximately 11 million sq ft office supply is expected to hit the market, which will help keep rents stable during the year.
Notes:
1. Office Market: The major business locations in Mumbai are the CBD (Nariman Point, Fort and Ballard Estate), Central Mumbai (Worli, Lower Parel and Parel), Bandra Kurla
Complex (BKC) and Andheri Kurla stretch. Powai, Malad and Vashi are the preferred IT/ ITES destinations, while Airoli at Navi Mumbai and Lal Bahadur Shastri Marg are
emerging as new office and IT/ITES submakets.
2. Rents/Capital Value: Market average of indicative asking price for Grade A office space.
3. Available Supply: Total Grade A office space being marketed for sale or lease in surveyed quarter.
4. City Barometer: Represents increase, decrease or stable scenario; as compared to previous quarter.
5. All the figures in the report is based on market information as on 25th December 2014.
Top 5 Transactions of 2014
Key Under Construction Projects
CLIENT BUILDING NAME AREA (SF) LOCATION LEASE / SALE
Edelweiss Capital Kohinoor City 133,000 Kurla Sale
Willis Insurance India i-Think Techno Campus 130,000 Thane Lease
DHL India Silver Utopia 100,000 Andheri East Lease
Pfizer India The Capital 90,000 BKC Lease
Poddar International School Hamilton 90,000 Thane Lease
BUILDING NAME DEVELOPER AREA (SF) LOCATION POSSESSION
Godrej BKC Godrej Properties 1,020,000 BKC 2015
Seawood Grand Central Tower I & II L & T Infrastructure 1,350,000 Navi Mumbai 2015
Lodha Codename Business Class Lodha Group 1,260,000 Thane 2015
New Supply, Absorption And Vacancy Trends
Average Rental And Capital Value Trend300
250
30,000
25,000
20,000
15,000
10,000
5,000
0
200
150
100
50
0
12 30%
25%
20%
15%
10%
5%
0%
10
8
6
4
2
02010 2011 2012 2013 2014 2015F 2016F
2008
2009
2010
2011
2012
2013
2014
2015
2016
Forecast
New Supply (In Mln sqft) Absorption(In Mln sqft) Vacancy(In %)
Rent
al V
alue
s IN
R Pe
r sq
ft P
er M
onth
Capi
tal V
alue
s IN
R Pe
r sq
ft
10 Research & Forecast Report | January 2015 | Colliers International
Office demand doubled in 2014; Prospects look brightDelhi witnessed approximately 1.18 million sq ft of lease transactions during 2014, which is almost double the 2013 leasing of 0.6 million sq ft. The absorption was concentrated in the submarkets of Okhla (24%), CBD (19%), Jasola (17%), Saket (7%) and other locations such as Aero City, Vasant Kunj, Mohan Corporative.
The IT/ITeS sector continued to have the highest share in demand (44%), followed by BFSI (19%) and manufacturing (11%).
This year, about 1.0 million sq ft of new supply was added to the city’s Grade A commercial office space. Due to limited additional supply and improved absorption levels, the city vacancy has decreased marginally. The overall available stock was reduced marginally to the tune of 2.2 million sq ft from 2.7 million sq ft in 2013. The city will continue to have restrained new supply in the next three years as only a few projects are under construction in the city like Parsvnath’s The Parsvnath 27 KG Marg, Infinia by RPS Developers and NBCC Plaza; they are likely to add about 3.38 million sq ft by the end of 2017. Another project that was launched in 2014, Vegas by Pratham Group at Dwarka Sector 14, will add another 1.2 million sq ft to the city; however, the expected completion of this project is 2019.
Despite improved absorption, rents in Delhi remained stable on average, except Jasola, where rents rose by 2% YoY; Connaught Place witnessed a 1% fall in rents YoY. Capital values declined on average by 2% YoY across the micro-markets due to restricted sales transactions in the city.
Rental Values
*Indicative Grade A rents in INR per sq ft per month**Connaught Place***Netaji Subhash Place
MICRO MARKETS RENTALVALUE*
% CHANGEQoQ YoY
CBD** 185 - 450 4% -1%
Nehru Place 175 - 225 0% 0%
Saket 140 - 190 8% 0%
Jasola 95 - 130 7% 2%
NSP*** 65 - 75 0% 0%
Research & Forecast Report
Delhi | OfficeJanuary 2015
City Office Barometer
INDICATORS 2014 2015
Vacancy
Absorption
Construction
Rental Value
Capital Value

11 Research & Forecast Report | January 2015 | Colliers International
In 2014, the city did not witness any major infrastructure project completion; however, the state government has announced Phase III of the Barapullah Bridge, which will be built between the DND Flyway and Nizamuddin Bridge and will connect the INA market with Mayur Vihar. Apart from this, the government has also raised circle rates by 20% uniformly across the entire category A to H. These rates were last revised in November 2012, when they were hiked by more than 200%. The rationale for increasing circle rates is to reduce the gap between the “going market rate” at which transactions are occurring and the government prescribed minimum value for registration of properties. However, the rate increase cause few location having circle rates more than the market rates as the location categories formulated by the government cover large areas that do not account for the substantial variance in prices within each of the area categories. Sales transactions were reduced in the period after the last rate hike.
Trends to watch for in 2015:
The Delhi office market is now in recovery mode after the general elections. Improved tenant demand from the IT/ITeS and BFSI sectors has mitigated much of the vacancy risk. The expected completion of about 1.5 million sq ft of new Grade A office space in 2015 will help to maintain the supply and demand equilibrium in the market. As a result, we do not expect much change in current vacancy levels. Overall rents will remain stable; however, due to limited supply, quality buildings will continue to fetch premium above-market rates.
Source: Colliers International
Top 5 Transactions of 2014
Key Under Construction Projects
CLIENT BUILDING NAME AREA (SF) LOCATION LEASE / SALE
Snapdeal Independent Building - A-28 115,000 Mohan Co-operative Lease
GodFrey Philips Omaxe Square 77,610 Jasola Lease
VFS Global Bharti World Mark 70,000 Aero City Lease
Moser Baer Okhla Phase 3 70,000 Okhla Lease
Mankind Pharmaceuticals DLF Prime Tower 54,000 Okhla Lease
BUILDING NAME DEVELOPER AREA (SF) LOCATION POSSESSION
NBCC Plaza NBCC 1,300,000 Kidwai Nagar 2016
RPS Infinia RPS Developer 1,000,000 Mathura Road 2015
NBCC Plaza NBCC 350,000 Okhla 2015
Average Rental And Capital Value Trend
250
300
30,000
35,000
40,000
25,000
20,000
15,000
10,000
5,000
0
200
150
100
50
0
Notes:
1. Office Market: The commercial areas in New Delhi can be broadly classified into the CBD (Connaught Place), SBD Nehru Place, Bhikaji Cama Place, Netaji Subhash Place, Jasola
and Saket .
2. Rents/Capital Value: Market average of indicative asking price for Grade A office space.
3. Available Supply: Total Grade A office space being marketed for sale or lease in surveyed quarter.
4. City Barometer: Represents increase, decrease or stable scenario; as compared to previous quarter.
5. All the figures in the report is based on market information as on 25th December 2014.
Forecast
New Supply (In Mln sqft) Absorption(In Mln sqft)
New Supply And Absorption Trends2
2
1
1
02010 2011 2012 2013 2014 2015F 2016F
2008
2009
2010
2011
2012
2013
2014
2015
2016
Rent
al V
alue
s IN
R Pe
r sq
ft P
er M
onth
Capi
tal V
alue
s IN
R Pe
r sq
ft

12 Research & Forecast Report | January 2015 | Colliers International
Absorption dipped by 13% YoY in 2014 but good prospects for 2015 Gurgaon remained the most active and preferred market in 2014 among corporate occupiers in the NCR region. The satellite city shared about 67% of overall absorption in NCR. Gurgaon recorded leasing volumes of 4.73 million sq ft in 2014, which is approximately 13% less than the previous year’s absorption of 5.47 million sq ft. IT/ITeS was the primary contributor of this demand, followed by the BFSI and logistics sectors. The share of the IT/ITeS sector has further increased to 62% of the total absorption this year. Last year, IT/ITeS accounted for only 53% of the total absorption.
Due to its connectivity advantages and affordable rents, NH8 remained the most preferred location and accounted for 31% of the total absorption followed by Institutional Sectors (16%) and Udyog Vihar (14%).
With the overall cautious market sentiments during the year, developers had deferred constructing new office space. As a result, new supply in 2014 was 3.2 million sq ft, down from 4.53 million sq ft in 2013. The city is expected to see completion of about 3.5 million sq ft of new office space in 2015 as developers are expected to focus on completing their existing projects, especially those with ready structures.
More than 16.8 million sq ft of office space is available for lease in the Gurgaon market, of which about 37% is located in the Golf Course Road Extension and Sohna Road, followed by NH8 (19%), Udyog Vihar (18%) and Golf Course Road (12%). Vacancy is expected to remain stable in 2015 as developers will remain cautious in adding more speculative
Research & Forecast Report
Gurgaon | OfficeJanuary 2015
Rental Values
*Indicative Grade A rents in INR per sq ft per month
MICRO MARKETS RENTALVALUE*
% CHANGEQoQ YoY
MG Road 90 - 140 2% -2%
DLF Cyber City (IT) 85 - 90 4% 11%
Golf Course Road 85 - 140 0% 0%
Institutional Sectors (Sec 44, 32, 18) 55 - 95 0% 0%
Golf Course Road Ext./Sohna Road 55 - 75 4% 15%
National Highway 8 50 - 150 5% 14%
Udyog Vihar & Industrial Sectors 35 - 50 0% -11%
Manesar 40 - 42 9% 0%
City Office Barometer
INDICATORS 2014 2015
Vacancy
Absorption
Construction
Rental Value
Capital Value
13 Research & Forecast Report | January 2015 | Colliers International
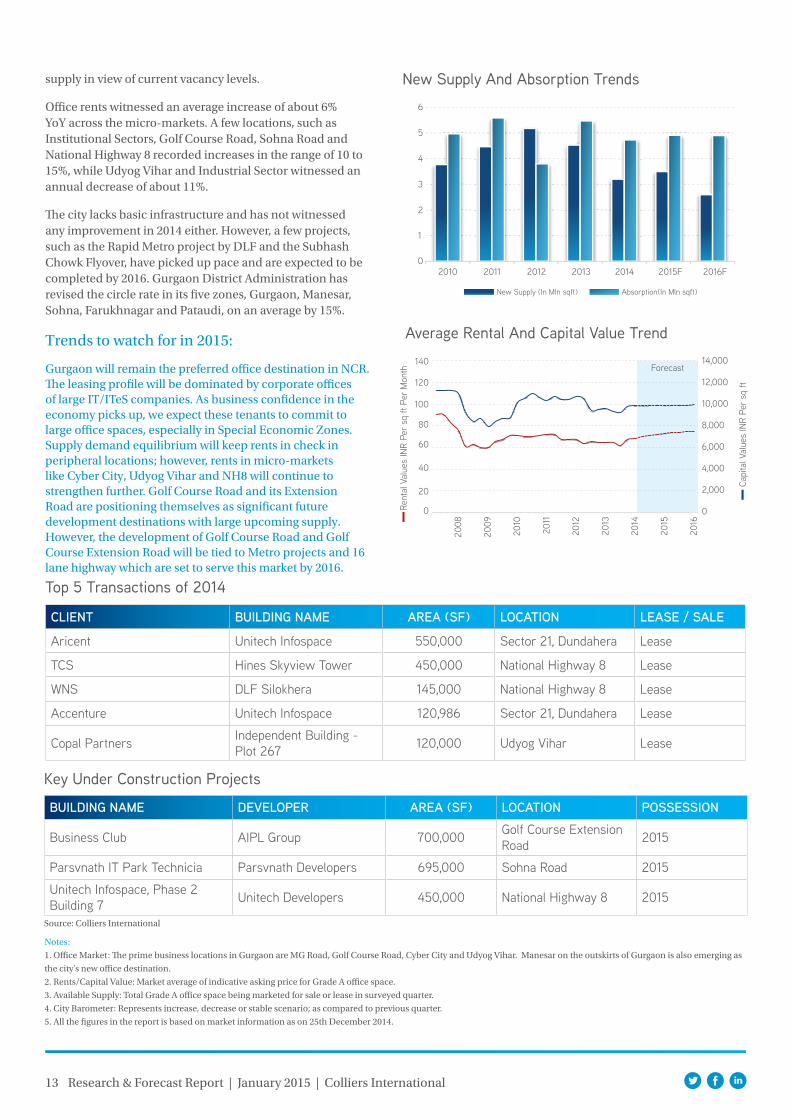
supply in view of current vacancy levels.
Office rents witnessed an average increase of about 6% YoY across the micro-markets. A few locations, such as Institutional Sectors, Golf Course Road, Sohna Road and National Highway 8 recorded increases in the range of 10 to 15%, while Udyog Vihar and Industrial Sector witnessed an annual decrease of about 11%.
The city lacks basic infrastructure and has not witnessed any improvement in 2014 either. However, a few projects, such as the Rapid Metro project by DLF and the Subhash Chowk Flyover, have picked up pace and are expected to be completed by 2016. Gurgaon District Administration has revised the circle rate in its five zones, Gurgaon, Manesar, Sohna, Farukhnagar and Pataudi, on an average by 15%.
Trends to watch for in 2015:
Gurgaon will remain the preferred office destination in NCR. The leasing profile will be dominated by corporate offices of large IT/ITeS companies. As business confidence in the economy picks up, we expect these tenants to commit to large office spaces, especially in Special Economic Zones. Supply demand equilibrium will keep rents in check in peripheral locations; however, rents in micro-markets like Cyber City, Udyog Vihar and NH8 will continue to strengthen further. Golf Course Road and its Extension Road are positioning themselves as significant future development destinations with large upcoming supply. However, the development of Golf Course Road and Golf Course Extension Road will be tied to Metro projects and 16 lane highway which are set to serve this market by 2016.
Top 5 Transactions of 2014
Key Under Construction Projects
CLIENT BUILDING NAME AREA (SF) LOCATION LEASE / SALE
Aricent Unitech Infospace 550,000 Sector 21, Dundahera Lease
TCS Hines Skyview Tower 450,000 National Highway 8 Lease
WNS DLF Silokhera 145,000 National Highway 8 Lease
Accenture Unitech Infospace 120,986 Sector 21, Dundahera Lease
Copal Partners Independent Building - Plot 267 120,000 Udyog Vihar Lease
BUILDING NAME DEVELOPER AREA (SF) LOCATION POSSESSION
Business Club AIPL Group 700,000 Golf Course Extension Road 2015
Parsvnath IT Park Technicia Parsvnath Developers 695,000 Sohna Road 2015
Unitech Infospace, Phase 2 Building 7 Unitech Developers 450,000 National Highway 8 2015
Average Rental And Capital Value Trend
100
120
140
8,000
10,000
14,000
12,000
6,000
4,000
2,000
0
80
60
40
20
0
Source: Colliers International
Notes:
1. Office Market: The prime business locations in Gurgaon are MG Road, Golf Course Road, Cyber City and Udyog Vihar. Manesar on the outskirts of Gurgaon is also emerging as
the city’s new office destination.
2. Rents/Capital Value: Market average of indicative asking price for Grade A office space.
3. Available Supply: Total Grade A office space being marketed for sale or lease in surveyed quarter.
4. City Barometer: Represents increase, decrease or stable scenario; as compared to previous quarter.
5. All the figures in the report is based on market information as on 25th December 2014.
Forecast
New Supply (In Mln sqft) Absorption(In Mln sqft)
New Supply And Absorption Trends6
5
4
3
2
1
02010 2011 2012 2013 2014 2015F 2016F
2008
2009
2010
2011
2012
2013
2014
2015
2016
Rent
al V
alue
s IN
R Pe
r sq
ft P
er M
onth
Capi
tal V
alue
s IN
R Pe
r sq
ft

14 Research & Forecast Report | January 2015 | Colliers International
Recovery seems to be on cards with revived IT/ITeS demand The NOIDA office market seems to have entered recovery mode in the second half of 2014. Revived tenant demand from the IT/ITeS sector and other associated industries has resulted in an increase in office absorption towards the end of the year. In 2014, NOIDA recorded total office absorption of around 1.8 million sq ft compared to last year’s 2.28 million sq ft.
The city continues to be driven by back offices of medium-sized IT/ITeS companies that contributed 59% of the total office absorption, followed by BFSI 21% and engineering, media and entertainment 19%. Among the landmark deals concluded during the year, Samsung leased 0.15 million sq ft of Grade A office space in Okaya Building located at Sector 62. NEC HCL took 0.12 million sq ft in Logix Techno Park at Sector 127 and RDB Insurance took 0.10 million sq ft in building A-31 located at Sector 64. Private equity fund Blackstone’s acquisition of two commercial properties, 3C’s Ozone IT SEZ comprising of 1.5 million sq ft of built-up-area and IDFC owned Galaxy IT Park comprising of 1.3 million sq ft is viewed as a ratification of NOIDA as an important current and future IT destination.
This year, not many projects witnessed completion in NOIDA, and only 1.07 million sq ft of Grade A office space was added to the city’s total inventory. With approximately 19 million sq ft of office space at different levels of construction, developers refrained from launching more speculative supply.
The market witnessed 2% average increase YoY in rental
Research & Forecast Report
NOIDA | OfficeJanuary 2015
Rental Values
*Indicative Grade A rents in INR per sq ft per month**Sector 18***Sector 16A, 62, 125-142****Sector 124, 57-60, 63-75
MICRO MARKETS RENTALVALUE*
% CHANGEQoQ YoY
Commercial Sectors** 95 - 110 0% 0%
Institutional Sectors (Non IT)*** 50 - 100 -7% 0%
Institutional Sectors (IT)*** 30 - 75 5% 0%
Industrial Sector (IT)**** 18 - 50 5% 8%
City Office Barometer
INDICATORS 2014 2015
Vacancy
Absorption
Construction
Rental Value
Capital Value

15 Research & Forecast Report | January 2015 | Colliers International
values for Grade A office space across all the micro-markets. Capital values also increased by 3% YoY, indicating market revival.
In 3Q 2014, the local governing body approved the hike in circle rates by 2% for commercial properties, except for sectors 18 and 38A, where a 17% hike was approved. For institutional properties, the circle rates increased by 10%. On the contrary, the development authority gave a nod to the much needed mixed land-use policy that allows commercial activities in residential sectors. These commercial activities are allowed in residential areas having roads with width of 24 m or more. This is likely to stimulate further other real estate activities like construction of hospitals, banks, schools, ATM kiosks, guest houses and other business premises.
Trends to watch for in 2015:
In 2015, occupiers, especially from IT/ITeS, will remain as the prime drivers, similar to 2014. Approximately 10 million sq ft of grade A office space is at various stages of construction in NOIDA, which is expected to complete in next 3 years. However market is likely to see limited new supply in 2015 as developers will refrain completing project and adding more speculative supply until substantial leasing volumes return. The rents expected to increase marginally in medium term due to restricted new supply.
Source: Colliers International
Top 5 Transactions of 2014
Key Under Construction Projects
CLIENT BUILDING NAME AREA (SF) LOCATION LEASE / SALE
Samsung Okaya Building 150,000 Sector 62 Lease
NEC HCL Logix Techno Park 120,000 Sector 127 Lease
RDB Insurance Independent Building - A-31 108,000 Sector 64 Lease
Harris Broadcasting Correnthum 80,000 Sector 62 Sale
Mediatek SB Tower 68,000 Sector 16A Lease
BUILDING NAME DEVELOPER AREA (SF) LOCATION POSSESSION
Delhi One The 3C Company 2,000,000 DND Flyway 2015
Mist Avenue Bhasin Group 1,000,000 Sector 143 2015
I Thum Beaver International 500,000 Sector 62 2015
Average Rental And Capital Value Trend
70
90
80
8,000
10,000
16,000
14,000
12,000
6,000
4,000
2,000
0
60
50
40
30
10
20
0
Notes:
1. Office Market: NOIDA market is comprised of sectors broadly classified as institutional, industrial and commercial sectors. Institutional sectors include sec 16A, 62 and125-142,
industrial sectors include Sec 1-9, 57-60 and 63- 65 while sector 18 is the most developed commercial sector.
2. Rents/Capital Value: Market average of indicative asking price for Grade A office space.
3. Available Supply: Total Grade A office space being marketed for sale or lease in surveyed quarter.
4. City Barometer: Represents increase, decrease or stable scenario; as compared to previous quarter.
5. All the figures in the report is based on market information as on 25th December 2014.
Forecast
New Supply (In Mln sqft) Absorption(In Mln sqft)
New Supply And Absorption Trends6
5
4
3
2
1
02010 2011 2012 2013 2014 2015F 2016F
2009
2010
2011
2012
2013
2014
2015
2016
Rent
al V
alue
s IN
R Pe
r sq
ft P
er M
onth
Capi
tal V
alue
s IN
R Pe
r sq
ft

16 Research & Forecast Report | January 2015 | Colliers International
Developers remain cautious due to low absorptionChennai witnessed improved occupier sentiment as leasing activities gained momentum during the end of the year. Overall, transaction volumes decreased and the office market witnessed about 4.11 million sq ft of office absorption which is about 24% less than the last year absorption of 5.43 million sq ft. Occupiers from the IT/ITeS sectors were the primary contributors to this demand followed by BFSI and Pharma. Guindy, despite being the most preferred sub-urban micro market, did not see much new lease transactions due to very limited vacant stock available and most of this demand is shifted to OMR which is emerging as the second most preferred suburb. A number of large floor plate deals were concluded on this stretch. For instance, around 0.1 million sq ft was leased by Tata Consultancy Services and Scope International in Ramanujam IT SEZ and Futura Tech Park respectively. Another big ticket deal was concluded by Capegemini admeasuring 0.07 million sq ft in Prestige Cyber Towers.
Construction continues to remain stagnant and the city witnessed completion of only 0.8 million sq ft of office space which is significantly less than the last 5 year average of about 4 million sq ft. A number of developers deferred delivery timelines of their under construction projects in 2014 in view of lower demand. Limited new supply addition led overall Grade A vacancy levels to decline to below 20% this year. The available supply of Chennai Grade A office property market remained at approximately 12.5 million sq ft By submarket, OMR accounted for 47% of the available supply, followed by Ambattur 24% and CBD 16%. Approximately 15 million sq ft of grade A office space is under various stages of construction however, the city will see limited supply addition as developers continue to defer
City Office Barometer
Research & Forecast Report
Chennai | OfficeJanuary 2015
Rental Values
*Indicative Grade A rents in INR per sq ft per month**OMR I (Madhya Kailash – Perungudi-Toll gate I) ***OMR II (Thoraipakkam – Sholinganallur) & OMR III (Semmencherry – Siruseri)
MICRO MARKETS RENTALVALUE*
% CHANGEQoQ YoY
CBD 60 - 80 0% 0%
Guindy 50 - 60 0% 4%
Ambattur 20 - 30 0% 0%
OMR I** 45 - 60 0% 4%
OMR II & III*** 25 - 45 0% 0%
GST Road 35 - 40 0% 0%
INDICATORS 2014 2015
Vacancy
Absorption
Construction
Rental Value
Capital Value
17 Research & Forecast Report | January 2015 | Colliers International
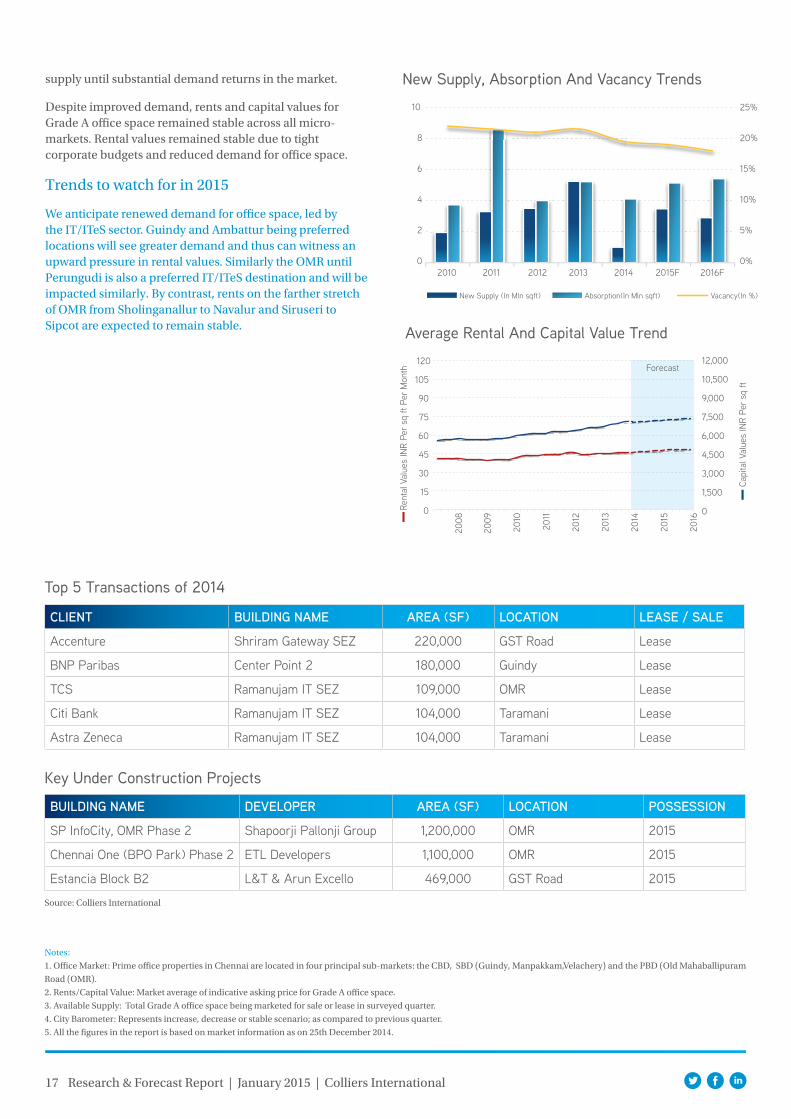
supply until substantial demand returns in the market.
Despite improved demand, rents and capital values for Grade A office space remained stable across all micro-markets. Rental values remained stable due to tight corporate budgets and reduced demand for office space.
Trends to watch for in 2015
We anticipate renewed demand for office space, led by the IT/ITeS sector. Guindy and Ambattur being preferred locations will see greater demand and thus can witness an upward pressure in rental values. Similarly the OMR until Perungudi is also a preferred IT/ITeS destination and will be impacted similarly. By contrast, rents on the farther stretch of OMR from Sholinganallur to Navalur and Siruseri to Sipcot are expected to remain stable.
Source: Colliers International
Top 5 Transactions of 2014
Key Under Construction Projects
CLIENT BUILDING NAME AREA (SF) LOCATION LEASE / SALE
Accenture Shriram Gateway SEZ 220,000 GST Road Lease
BNP Paribas Center Point 2 180,000 Guindy Lease
TCS Ramanujam IT SEZ 109,000 OMR Lease
Citi Bank Ramanujam IT SEZ 104,000 Taramani Lease
Astra Zeneca Ramanujam IT SEZ 104,000 Taramani Lease
BUILDING NAME DEVELOPER AREA (SF) LOCATION POSSESSION
SP InfoCity, OMR Phase 2 Shapoorji Pallonji Group 1,200,000 OMR 2015
Chennai One (BPO Park) Phase 2 ETL Developers 1,100,000 OMR 2015
Estancia Block B2 L&T & Arun Excello 469,000 GST Road 2015
Notes:
1. Office Market: Prime office properties in Chennai are located in four principal sub-markets: the CBD, SBD (Guindy, Manpakkam,Velachery) and the PBD (Old Mahaballipuram
Road (OMR).
2. Rents/Capital Value: Market average of indicative asking price for Grade A office space.
3. Available Supply: Total Grade A office space being marketed for sale or lease in surveyed quarter.
4. City Barometer: Represents increase, decrease or stable scenario; as compared to previous quarter.
5. All the figures in the report is based on market information as on 25th December 2014.
Average Rental And Capital Value Trend120
9,000
10,500
12,000
7,500
6,000
4,500
3,000
1,500
0
105
90
75
60
30
15
45
0
Forecast
New Supply, Absorption And Vacancy Trends10 25%
20%
15%
10%
5%
0%
8
6
4
2
02010 2011 2012 2013 2014 2015F 2016F
New Supply (In Mln sqft) Absorption(In Mln sqft) Vacancy(In %)
2008
2009
2010
2011
2012
2013
2014
2015
2016
Rent
al V
alue
s IN
R Pe
r sq
ft P
er M
onth
Capi
tal V
alue
s IN
R Pe
r sq
ft

18 Research & Forecast Report | January 2015 | Colliers International
Bengaluru steals the show with over 13.77 million sq ft of absorptionThe city tops the chart with about 49% share in the pan India absorption in 2014. Robust leasing activities, especially from the IT / ITeS sector with about 73% of the city’s total absorption, backed up the overall absorption, resulting in an enormous growth from 8.65 million sq ft in 2013 to 13.77 million sq ft in 2014. Over and above this, approximately, 4.38 million sq ft of office space has been pre-committed in various IT parks that are under construction. Outer Ring Road outshined other micro-markets as the most preferred micromarket with more than 51% of the total absorption, followed by Whitefield 20% and the CBD 6%.
The market has benefitted from both the increased demand from the IT/ITeS sector and the booming Indian e-commerce sector. The most significant deals in 2014 include the 3.8 million sq ft office space taken by e-commerce giant Flipkart, which alone contributed about 25% in the city’s total absorption. Moreover, existing tenants such as KPMG, IBM, L&T and Cap Gemini leased large office spaces to accommodate their growing operations. Private equity players also showed equal interest in this market. The market witnessed one of the largest JV deals between Black Stone Group and Embassy Group amounting to INR 1,951 crores for Vrindavan Tech Village spread over 106 acres.
Strong absorption was complemented by robust new supply of approximately 7.17 million sq ft. About 9.1 million sq ft of supply was available for lease in the market in 4Q 2014, of which about 70% was equally distributed in EPIP Zone Whitefield and ORR. The remaining 30% of the supply
City Office Barometer
Research & Forecast Report
Bengaluru | OfficeJanuary 2015
Rental Values
*Indicative Grade A rents in INR per sq ft per month**Northern part of ORR - KR Puram till Hebbal
MICRO MARKETS RENTALVALUE*
% CHANGEQoQ YoY
CBD 90 - 130 16% 22%
Outer Ring Road (Marathalli - Sarjapur)
55 - 63 4% 7%
Outer Ring Road (North)** 53 - 60 8% 28%
Bannerghatta Road 50 - 60 0% 0%
EPIP Zone/ Whitefield 28 - 36 0% 0%
Hosur Road 25 - 40 0% 8%
Electronic City 26 - 33 0% 5%
INDICATORS 2014 2015
Vacancy
Absorption
Construction
Rental Value
Capital Value
19 Research & Forecast Report | January 2015 | Colliers International
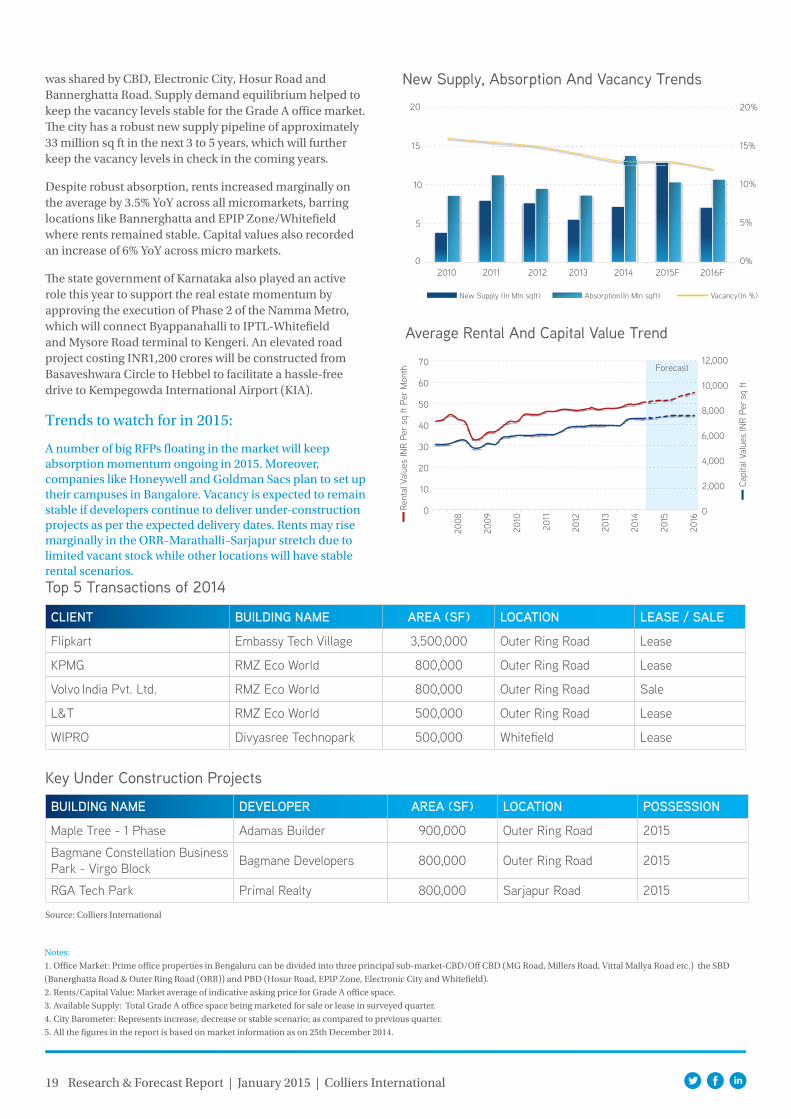
was shared by CBD, Electronic City, Hosur Road and Bannerghatta Road. Supply demand equilibrium helped to keep the vacancy levels stable for the Grade A office market. The city has a robust new supply pipeline of approximately 33 million sq ft in the next 3 to 5 years, which will further keep the vacancy levels in check in the coming years.
Despite robust absorption, rents increased marginally on the average by 3.5% YoY across all micromarkets, barring locations like Bannerghatta and EPIP Zone/Whitefield where rents remained stable. Capital values also recorded an increase of 6% YoY across micro markets.
The state government of Karnataka also played an active role this year to support the real estate momentum by approving the execution of Phase 2 of the Namma Metro, which will connect Byappanahalli to IPTL-Whitefield and Mysore Road terminal to Kengeri. An elevated road project costing INR1,200 crores will be constructed from Basaveshwara Circle to Hebbel to facilitate a hassle-free drive to Kempegowda International Airport (KIA).
Trends to watch for in 2015:
A number of big RFPs floating in the market will keep absorption momentum ongoing in 2015. Moreover, companies like Honeywell and Goldman Sacs plan to set up their campuses in Bangalore. Vacancy is expected to remain stable if developers continue to deliver under-construction projects as per the expected delivery dates. Rents may rise marginally in the ORR–Marathalli–Sarjapur stretch due to limited vacant stock while other locations will have stable rental scenarios.
Source: Colliers International
Top 5 Transactions of 2014
Key Under Construction Projects
CLIENT BUILDING NAME AREA (SF) LOCATION LEASE / SALE
Flipkart Embassy Tech Village 3,500,000 Outer Ring Road Lease
KPMG RMZ Eco World 800,000 Outer Ring Road Lease
Volvo India Pvt. Ltd. RMZ Eco World 800,000 Outer Ring Road Sale
L&T RMZ Eco World 500,000 Outer Ring Road Lease
WIPRO Divyasree Technopark 500,000 Whitefield Lease
BUILDING NAME DEVELOPER AREA (SF) LOCATION POSSESSION
Maple Tree - 1 Phase Adamas Builder 900,000 Outer Ring Road 2015
Bagmane Constellation Business Park - Virgo Block Bagmane Developers 800,000 Outer Ring Road 2015
RGA Tech Park Primal Realty 800,000 Sarjapur Road 2015
Average Rental And Capital Value Trend
8,000
10,000
12,000
6,000
4,000
2,000
0
70
60
50
40
30
10
20
0
Notes:
1. Office Market: Prime office properties in Bengaluru can be divided into three principal sub-market-CBD/Off CBD (MG Road, Millers Road, Vittal Mallya Road etc.) the SBD
(Banerghatta Road & Outer Ring Road (ORR)) and PBD (Hosur Road, EPIP Zone, Electronic City and Whitefield).
2. Rents/Capital Value: Market average of indicative asking price for Grade A office space.
3. Available Supply: Total Grade A office space being marketed for sale or lease in surveyed quarter.
4. City Barometer: Represents increase, decrease or stable scenario; as compared to previous quarter.
5. All the figures in the report is based on market information as on 25th December 2014.
Forecast
New Supply, Absorption And Vacancy Trends20 20%
15%
10%
5%
0%
15
10
5
02010 2011 2012 2013 2014 2015F 2016F
New Supply (In Mln sqft) Absorption(In Mln sqft) Vacancy(In %)
2008
2009
2010
2011
2012
2013
2014
2015
2016
Rent
al V
alue
s IN
R Pe
r sq
ft P
er M
onth
Capi
tal V
alue
s IN
R Pe
r sq
ft
20 Research & Forecast Report | January 2015 | Colliers International
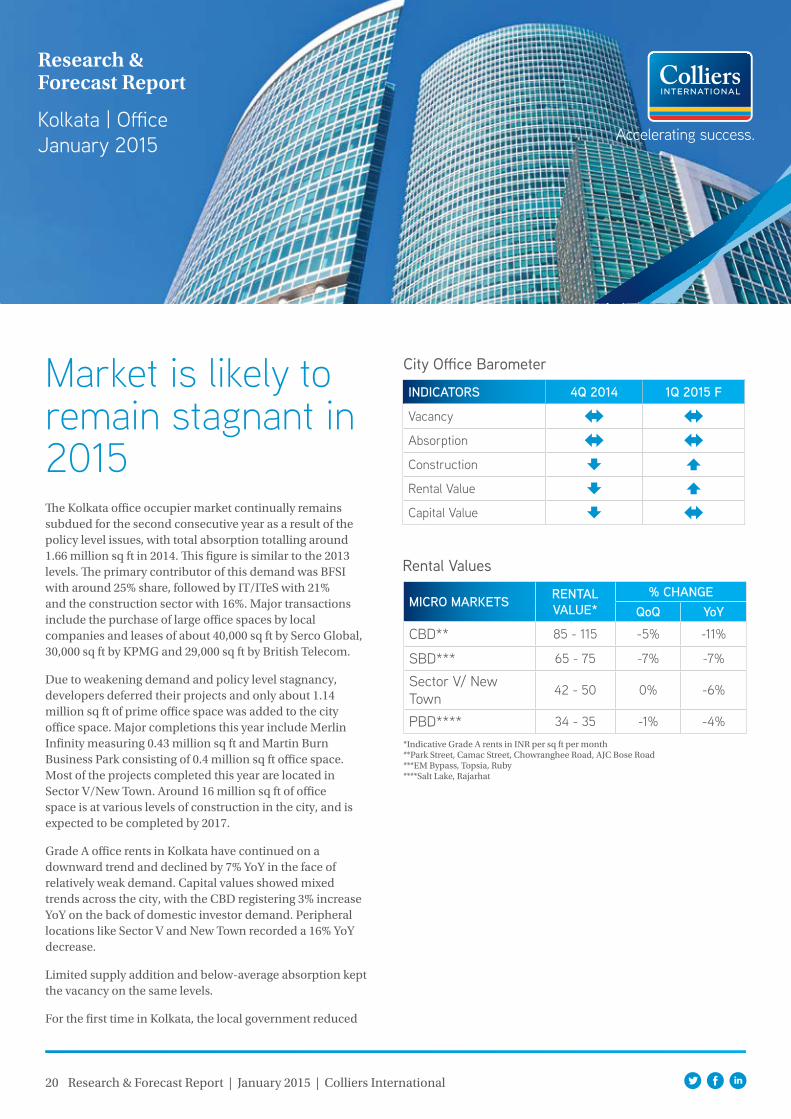
Market is likely to remain stagnant in 2015The Kolkata office occupier market continually remains subdued for the second consecutive year as a result of the policy level issues, with total absorption totalling around 1.66 million sq ft in 2014. This figure is similar to the 2013 levels. The primary contributor of this demand was BFSI with around 25% share, followed by IT/ITeS with 21% and the construction sector with 16%. Major transactions include the purchase of large office spaces by local companies and leases of about 40,000 sq ft by Serco Global, 30,000 sq ft by KPMG and 29,000 sq ft by British Telecom.
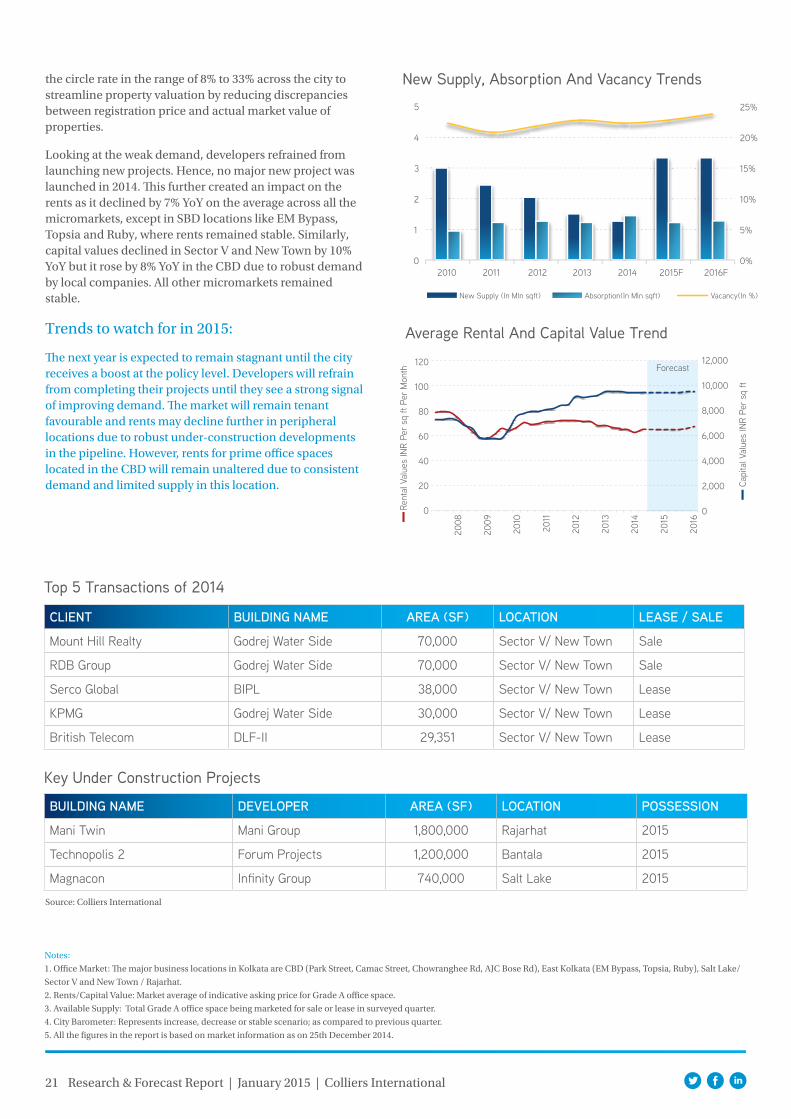
Due to weakening demand and policy level stagnancy, developers deferred their projects and only about 1.14 million sq ft of prime office space was added to the city office space. Major completions this year include Merlin Infinity measuring 0.43 million sq ft and Martin Burn Business Park consisting of 0.4 million sq ft office space. Most of the projects completed this year are located in Sector V/New Town. Around 16 million sq ft of office space is at various levels of construction in the city, and is expected to be completed by 2017.
Grade A office rents in Kolkata have continued on a downward trend and declined by 7% YoY in the face of relatively weak demand. Capital values showed mixed trends across the city, with the CBD registering 3% increase YoY on the back of domestic investor demand. Peripheral locations like Sector V and New Town recorded a 16% YoY decrease.
Limited supply addition and below-average absorption kept the vacancy on the same levels.
For the first time in Kolkata, the local government reduced
City Office Barometer
Research & Forecast Report
Kolkata | OfficeJanuary 2015
Rental Values
*Indicative Grade A rents in INR per sq ft per month**Park Street, Camac Street, Chowranghee Road, AJC Bose Road***EM Bypass, Topsia, Ruby****Salt Lake, Rajarhat
MICRO MARKETS RENTALVALUE*
% CHANGEQoQ YoY
CBD** 85 - 115 -5% -11%
SBD*** 65 - 75 -7% -7%
Sector V/ New Town 42 - 50 0% -6%
PBD**** 34 - 35 -1% -4%
INDICATORS 4Q 2014 1Q 2015 F
Vacancy
Absorption
Construction
Rental Value
Capital Value
21 Research & Forecast Report | January 2015 | Colliers International
the circle rate in the range of 8% to 33% across the city to streamline property valuation by reducing discrepancies between registration price and actual market value of properties.
Looking at the weak demand, developers refrained from launching new projects. Hence, no major new project was launched in 2014. This further created an impact on the rents as it declined by 7% YoY on the average across all the micromarkets, except in SBD locations like EM Bypass, Topsia and Ruby, where rents remained stable. Similarly, capital values declined in Sector V and New Town by 10% YoY but it rose by 8% YoY in the CBD due to robust demand by local companies. All other micromarkets remained stable.
Trends to watch for in 2015:
The next year is expected to remain stagnant until the city receives a boost at the policy level. Developers will refrain from completing their projects until they see a strong signal of improving demand. The market will remain tenant favourable and rents may decline further in peripheral locations due to robust under-construction developments in the pipeline. However, rents for prime office spaces located in the CBD will remain unaltered due to consistent demand and limited supply in this location.
Source: Colliers International
Top 5 Transactions of 2014
Key Under Construction Projects
CLIENT BUILDING NAME AREA (SF) LOCATION LEASE / SALE
Mount Hill Realty Godrej Water Side 70,000 Sector V/ New Town Sale
RDB Group Godrej Water Side 70,000 Sector V/ New Town Sale
Serco Global BIPL 38,000 Sector V/ New Town Lease
KPMG Godrej Water Side 30,000 Sector V/ New Town Lease
British Telecom DLF-II 29,351 Sector V/ New Town Lease
BUILDING NAME DEVELOPER AREA (SF) LOCATION POSSESSION
Mani Twin Mani Group 1,800,000 Rajarhat 2015
Technopolis 2 Forum Projects 1,200,000 Bantala 2015
Magnacon Infinity Group 740,000 Salt Lake 2015
Notes:
1. Office Market: The major business locations in Kolkata are CBD (Park Street, Camac Street, Chowranghee Rd, AJC Bose Rd), East Kolkata (EM Bypass, Topsia, Ruby), Salt Lake/
Sector V and New Town / Rajarhat.
2. Rents/Capital Value: Market average of indicative asking price for Grade A office space.
3. Available Supply: Total Grade A office space being marketed for sale or lease in surveyed quarter.
4. City Barometer: Represents increase, decrease or stable scenario; as compared to previous quarter.
5. All the figures in the report is based on market information as on 25th December 2014.
Average Rental And Capital Value Trend
8,000
10,000
12,000
6,000
4,000
2,000
0
120
100
80
60
20
40
0
Forecast
New Supply, Absorption And Vacancy Trends5 25%
20%
15%
10%
5%
0%
4
3
2
1
02010 2011 2012 2013 2014 2015F 2016F
New Supply (In Mln sqft) Absorption(In Mln sqft) Vacancy(In %)
2008
2009
2010
2011
2012
2013
2014
2015
2016
Rent
al V
alue
s IN
R Pe
r sq
ft P
er M
onth
Capi
tal V
alue
s IN
R Pe
r sq
ft
22 Research & Forecast Report | January 2015 | Colliers International
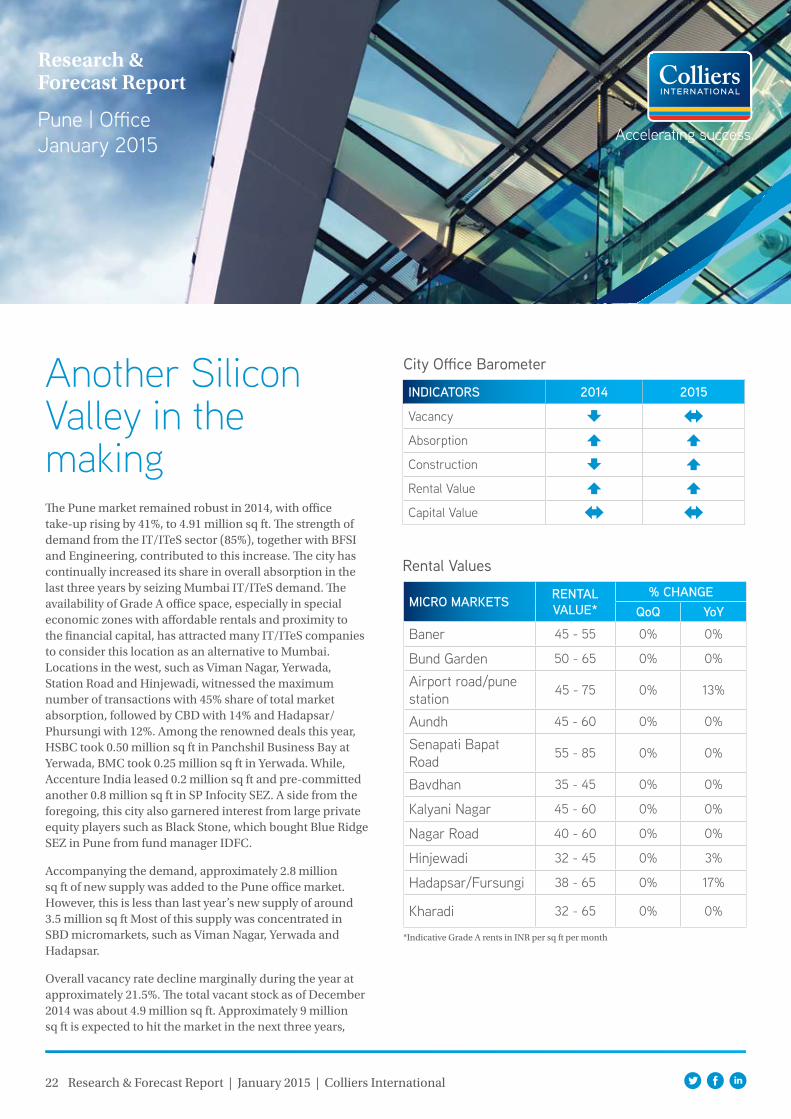
Another Silicon Valley in the makingThe Pune market remained robust in 2014, with office take-up rising by 41%, to 4.91 million sq ft. The strength of demand from the IT/ITeS sector (85%), together with BFSI and Engineering, contributed to this increase. The city has continually increased its share in overall absorption in the last three years by seizing Mumbai IT/ITeS demand. The availability of Grade A office space, especially in special economic zones with affordable rentals and proximity to the financial capital, has attracted many IT/ITeS companies to consider this location as an alternative to Mumbai. Locations in the west, such as Viman Nagar, Yerwada, Station Road and Hinjewadi, witnessed the maximum number of transactions with 45% share of total market absorption, followed by CBD with 14% and Hadapsar/ Phursungi with 12%. Among the renowned deals this year, HSBC took 0.50 million sq ft in Panchshil Business Bay at Yerwada, BMC took 0.25 million sq ft in Yerwada. While, Accenture India leased 0.2 million sq ft and pre-committed another 0.8 million sq ft in SP Infocity SEZ. A side from the foregoing, this city also garnered interest from large private equity players such as Black Stone, which bought Blue Ridge SEZ in Pune from fund manager IDFC.
Accompanying the demand, approximately 2.8 million sq ft of new supply was added to the Pune office market. However, this is less than last year’s new supply of around 3.5 million sq ft Most of this supply was concentrated in SBD micromarkets, such as Viman Nagar, Yerwada and Hadapsar.
Overall vacancy rate decline marginally during the year at approximately 21.5%. The total vacant stock as of December 2014 was about 4.9 million sq ft. Approximately 9 million sq ft is expected to hit the market in the next three years,
City Office Barometer
Research & Forecast Report
Pune | OfficeJanuary 2015
Rental Values
*Indicative Grade A rents in INR per sq ft per month
MICRO MARKETS RENTALVALUE*
% CHANGEQoQ YoY
Baner 45 - 55 0% 0%
Bund Garden 50 - 65 0% 0%
Airport road/pune station 45 - 75 0% 13%
Aundh 45 - 60 0% 0%
Senapati Bapat Road 55 - 85 0% 0%
Bavdhan 35 - 45 0% 0%
Kalyani Nagar 45 - 60 0% 0%
Nagar Road 40 - 60 0% 0%
Hinjewadi 32 - 45 0% 3%
Hadapsar/Fursungi 38 - 65 0% 17%
Kharadi 32 - 65 0% 0%
INDICATORS 2014 2015
Vacancy
Absorption
Construction
Rental Value
Capital Value

23 Research & Forecast Report | January 2015 | Colliers International
CLIENT BUILDING NAME AREA (SF) LOCATION LEASE / SALE
BMC Business Bay 252,000 Yerwada Lease
HSBC Business Bay 505,000 Yerwada Lease
Cognizant Wadhawa IT Park 150,000 Hinjewadi Lease
Flextronics Embassy Tech Zone 138,000 Hinjewadi Lease
HDFC Bank MIT Marathon 124,217 Bund Garden Road Lease
Source: Colliers International
Top 5 Transactions of 2014
Key Under Construction Projects
BUILDING NAME DEVELOPER AREA (SF) LOCATION POSSESSION
SP Infocity Building 5 Shapoorji Pallonji Group 800,000 Phursungi 2015
Commerzone Building 8 K Raheja Corp 420,000 Yerwada 2015
Acendas Phase II Acendas 615,000 Hinjewadi 2015
Notes:
1. Office Market: The prime office sub-markets of Pune include CBD (Deccan Gymkhana, Bund Garden Road, Senapati Bapat Road & Camp), Off CBD (Aundh, Airport Road and
Kalyani Nagar) and the eastern corridor, along with Nagar Road and Kharadi, which have emerged as a preferred location for financial and IT/ITES companies.
2. Rents/Capital Value: Market average of indicative asking price for Grade A office space.
3. Available Supply: Total Grade A office space being marketed for sale or lease in surveyed quarter.
4. City Barometer: Represents increase, decrease or stable scenario; as compared to previous quarter.
5. All the figures in the report is based on market information as on 25th December 2014.
Average Rental And Capital Value Trend
6,000
7,000
8,000
5,000
4,000
3,000
2,000
1,000
0
80
70
60
50
20
10
40
30
0Rent
al V
alue
s IN
R Pe
r Sq
Ft P
er M
onth
Capi
tal V
alue
s IN
R Pe
r Sq
ft
Forecast
New Supply, Absorption And Vacancy Trends6
5
25%
20%
15%
10%
5%
0%
4
3
2
1
02010 2011 2012 2013 2014 2015F 2016F
New Supply (In Mln sqft) Absorption(In Mln sqft) Vacancy(In %)
which seems to be in tandem with the expected absorption. Most of this supply will be located in suburban and peripheral micromarkets. East and west Pune micromarkets will continue to interest occupiers due to availability of large floor plates, better infrastructure and proximity to residential pockets of the city.
During the year, average rental values registered an increase of 3% YoY, which was contributed by micromarkets like Airport Road/Pune station, Hinjewadi, Hadpsar and Phursungi. Other micromarkets witnessed a stable rent scenario during the year. Capital values this year remained stable YoY across all micromarkets.
Trends to watch for in 2015:
The office market outlook for 2015 looks promising for Pune. IT/ITeS will continue to play an important role in the city’s overall commercial office space absorption, primarily attributed to projects that have already seen pre-commitments or long-established interest from various IT/ITeS companies.
Overall rents and vacancy levels are unlikely to change in view of the supply in tandem with absorption. However, rents in SEZ are expected to increase due to the very limited space available and the thin supply pipeline.
2008
2009
2010
2011
2012
2013
2014
2015
2016
About Colliers International
colliers.com
63 countries on 6 continentsUnited States: 146 Canada: 44 Latin America: 25
186 EMEA: 84
$2.1billion in annual revenue
1.46billion square feet under management
15,800professionals
Primary Authors:
Surabhi Arora Associate Director | Research +91 124 456 [email protected]
Sachin Sharma Assistant Manager | Research
Amit Oberoi I National DirectorValuation & Advisory Services & Research
For O�ce Services:
Mumbai: George Mckay I South Asia [email protected]
Delhi / NCR: Vikas Kalia | National [email protected]
Bengaluru: Goutam Chakraborty I [email protected]
Pune: Rishav Vij I Associate [email protected]
Chennai: Kaushik Reddy I [email protected]
Kolkata: Swapan Dutta I Senior Associate [email protected]
Colliers InternationalTechnopolis Building, 1st Floor, DLF Golf Course Road, Sector 54, Gurgaon - 122 002TEL +91 124 456 7500
485


