Page 1
1
INDIA
Preparatory Survey on BOP business on
nutritional supplement (Vitamin A) products
【Summary】
December, 2015
Incorporated Administrative Agency
Japan International Cooperation Agency (JICA)
Kagome Co., Ltd.
Hakuhodo Inc.
OS
JR
15-098
INDIA
Page 2
Index
Executive Summary ...................................................................................................................... 1
1 Survey Background............................................................................................................ 1
2 Survey Objective ............................................................................................................... 4
3 Survey Regions .................................................................................................................. 6
4 Steps, Targets and Duration of the Survey ........................................................................ 9
5 Survey Summary ............................................................................................................. 12
6 Sales plan, Profit plan ...................................................................................................... 25
7 Reasoning and basis for non-commercialization ............................................................. 28
8 Challenges and solutions about poplularizing a nutrition appeal product in BOP segment
................................................................................................................................................. 30
Page 3
List of Diagrams
Diagram 1 Change in Poverty Rate (Poverty Head Count Ratio-PCHR)
Diagram 2 Value Chain and Effect of Development of Carrot Jam Business for BOP Level
Diagram 3 Role of local partners and Kagome in vertically integrated value chain for carrot
jam business
Diagram 4 Basic Data of Republic of India, Karnataka State and Bangalore
Diagram 5 Survey Area (India) Map
Diagram 6 Overall Link-map of the Survey
Diagram 7 Revenue percentage for various crops produced by farmers
Diagram 8 Surveyed carrot producing area
Diagram 9 Market Purchase Price of carrot for every month
Diagram 10 Distribution structure of carrot and the Margin
Diagram 11 Number of retail outlet (Kirana, Bakery, Drug store)
Diagram 12 A,B,C,D categorization of Kirana, Bakery
Diagram 13 Sales situation of mini pack jam in each category of the outlet
Diagram 14 Distribution channel and merging composition
Diagram 15 Bangalore (Urban) sales outlet number
Diagram 16 Bangalore (Devanahalli) sales outlet number
Diagram 17 Hyderabad (Urban) sales outlet number
Diagram 18 Bangalore (Urban) sales outlet number
Diagram 19 Weekly sales volume per outlet
Diagram 20 Sales plan
Diagram 21 Sales plan (Amount)
Diagram 22 Sales ratio through NGO
Diagram 23 Operating profit (profit / loss) trend
Diagram 24 Accumulated operating profit (profit / loss) trend
Diagram 25 Cash flow
Diagram 26 Comparison of the sales planning and payout period before and after of the survey
Diagram 27 Scheme for increased value appeal of product
Page 4
Glossary
(1) Anganwadi (Anganwadi Workers)
Anganwadi means "courtyard shelter" in Hindi and are childcare facilities started in 1975 by the
Indian government to look after children in the 0-6 age group.
Anganwadi Workers are caretakers of the children and are also responsible for preparing the
food for children in Anganwadi.
(2) APMC
Agricultural Produce Market Committee
It provides a marketplace where fruits and vegetables are aggregated and sold.
(3) BOP
Base Of the Pyramid
The greatest number of people in the world are in the low income bracket. The World Resource
Institute and International Finance Corporation in the year 2007 defined BOP as people having
an annual household income of less than USD 3,000, MOP (Middle Of the Pyramid) as people
having an annual household income of USD 3,000–20,000, and TOP (Top Of the Pyramid) as
people having an annual household income of more than USD 20,000, based on purchasing
power parity. However in this survey, in view of price levels in India, BOP has been considered
as an annual household income of 75,000–150,000 Indian Rupees, excluding the very poor.
Further, MOP has been considered as an annual household income of 150,000–500,000 Indian
Rupees.
(4) Bx
Brix
The unit for quantifying sugar content. It is a measurement of the physical quantity of sugar
content used, including sugars such as sucrose, fructose, invert sugar, glucose, etc., particularly
in food-industry products such as wine, refined sugar, farmed fruit, etc.
(5) C&FA
Carry & Forward Agent
A fee-based transport agent who keeps a manufacturer’s product in its own warehouse and
transports it to distributors as instructed by the manufacturer.
(6) CA
Consignment Agent
An agent who keeps a manufacturer’s product and pays the manufacturer the price minus the
agent fee, only after the goods are sold.
Page 5
Glossary
(7) CBO
Community Based Organization
An NGO type civic group which engages in local activities domestically (see NGO below).
(8) CSR
Corporate Social Responsibility
The social responsibility that a corporation must shoulder, not only by following the law but
also in terms of employment and labor conditions in line with human rights, appropriate
response to consumers, consideration of environmental issues, local social contribution, etc.
(9) JETRO
Japan External Trade Organization
(10) KHPT
Karnataka Health Promotion Trust
An NGO based in Karnataka, with the objective of improving and ensuring good health.
(11) Kirana
Small-scale retail shops typically family-managed, which are either small outlets, houses
modified to have an outlet, or an outlet built up against a wall. These shops handle food, toiletry
products, cold beverages, snacks, tobacco, etc.
(12) MDG
Millennium Development Goals
The Millennium Development Goals are a United Nations initiative adopted in the Millennium
Summit in September 2000 in New York, including the international development goals
adopted at the International Summit in 1990.
(13) MOP
Middle Of the Pyramid (refer to BOP)
(14) MRP
Maximum Retail Price
(15) NGO
Non-Governmental Organizations
A non-government organization engaged in social cause related activities such as famine relief,
environmental protection, occupational training, and prevention and treatment of diseases. It is
Page 6
Glossary
also called a private aid group if the objectives are improving the welfare of the local
community and engaging in relief activities in case of emergency situations.
(16) RDA
Recommended Dietary Allowance
The recommended daily level of nutrients needed by 97–98% individuals in a particular age and
gender group.
(17) SHG
Self Help Group
A Self Help Group in the local community. In each region, a SHG is composed of at least 10
members, who engage in helping the poor or diseased to address social problems through
occupational training, manufacturing of goods or selling of products. It is typically organized
under the guidance of a Non-Governmental Organization (NGO).
(18) SS
Super Stockist
A distribution agent who buys goods from a manufacturer and distributes them to distributors.
(19) TOP
Top Of the Pyramid (refer to BOP)
(20) WHO
World Health Organization
Page 7
Executive Summary
1
Executive Summary
1 Survey Background
In spite of the fact that the Indian economy has displayed a remarkable development, to reduce
extreme starvation rate by 50% and maternal mortality rate by 25% by 2015, as part of the goals
set under Millennium Development Goals (MDG) of the United Nations, seems like a distant
dream. Though improvements have taken place regarding the reduction in infant mortality rate
(* reduction in the mortality rate (infant mortality rate) of children under 5 years of age by
two-thirds), it would be difficult to achieve the goal and thereby the necessity to promptly
resolve the related issues still remains.
India has not yet been successful to achieve the objective of reducing the starvation rate by
50%. Regarding the alleviation of overall poverty rate, the country has been somewhat
successful in reducing the percentage. In 1990, the Poverty Head Count Ratio (PHCR) was
47.8% and on that basis the goal of reducing the PCHR to 23.9% by 2015. In 2012, ahead of
2015 deadline set by the MDG, the PCHR was reduced to 21.9%. Hence, statistically it can be
said that India has achieved its target of reducing the poverty rate.
Owing to uneven progress in the efforts of poverty reduction, it is a fact that there still are
many people suffering from poverty in India. According to a survey done in 2012, more than
270 million people in India live in extreme poverty.
By 2030 India has set a new target to eradicate extreme poverty. The task is not simple, but
fulfillment is feasible.
Diagram1 Change in Poverty Rate (Poverty Head Count Ratio-PCHR)
(Source: UNITED NATIONS DEVELOPMENT PROGRAMME; 2015 Millennium
Development Goals: India Country Report 、Ministry of Statistics and Implementation,
Government of India;2015 India and MDGs: Towards a Sustainable Future for All、United
Nations)
http://www.undp.org/content/india/en/home/mdgoverview.html)
In addition to poverty, malnutrition is also a long-standing social issue in India. Vitamin A is
one of the vital nutrients for the body and a necessity for vision and fighting infectious diseases
Page 8
Executive Summary
2
for children. So far the percentage of population with Vitamin A deficiency is as high as 20%,
out of that 62% are children below 5 years of age and the total number of such children with the
deficiency is 78 million.
(*Source:WHO『Global prevalence of vitamin A deficiency in populations at risk 1995-2005』)
However, due to the Vitamin A dosage administration program (administration of Vitamin A
dosage to children between 9-36 months after birth) promoted by the Indian government,
Vitamin A deficiency has been reduced to a large extent. In spite of that the retinol (Vitamin A)
concentration in the blood of children still remains low.
One reason which can be thought for the above mentioned deficiency is the low consumption
of Vitamin A (In rural areas 80% of children do not even get half of the recommended amount).
Even if it does not appear as a deficiency, it may hinder the healthy growth and/or result in
immune deficiencies. For normal growth, it is therefore necessary to create the habit wherein
food containing Vitamin A and other nutrients can be consumed daily.
Based on its philosophy – ‘using the bounties of nature, create deep-rooted value that is ahead
of time and thereby contribute to the healthy life of customers’, Kagome possesses specialized
knowledge on research of nutrition (Including Vitamin A) in vegetables, agricultural research
and cultivation technology development. Moreover, with such a base the company also has
abundant experience in project development for the development, production and sales of
products.
The raw materials procurement method of Kagome in its 100 years of history is through
‘contract farming’ in which not only support with agricultural land management and technology
are provided to the farmers with whom contract is made, but the company also engages itself in
the empowerment of the farmers and the improvement of their income. (*contract farming: a
cultivation order is placed by Kagome after taking decision on the type of crop which is to be
cultivated, cultivation land area and shipping standards, provides guidance on the cultivation
method which is suitable for the particular land and purchases the entire quantity of the
harvested crop .)
Regarding carrot cultivation in India, on the basis of the past performances and experiences of
Kagome in Japan and overseas, the company can provide guidance on cultivation and
technology and thereby contribute to uplifting the people living in BOP level.
Moreover, besides the target of the BOP level project, by using the carrot as raw materials,
Kagome can study more about the vegetable beverages business, targeting TOP level (wealthy
Page 9
Executive Summary
3
class) and MOP level (middle class) and thus check the feasibility of a synergetic effect with the
BOP business as well.
Page 10
Executive Summary
4
2 Survey Objective
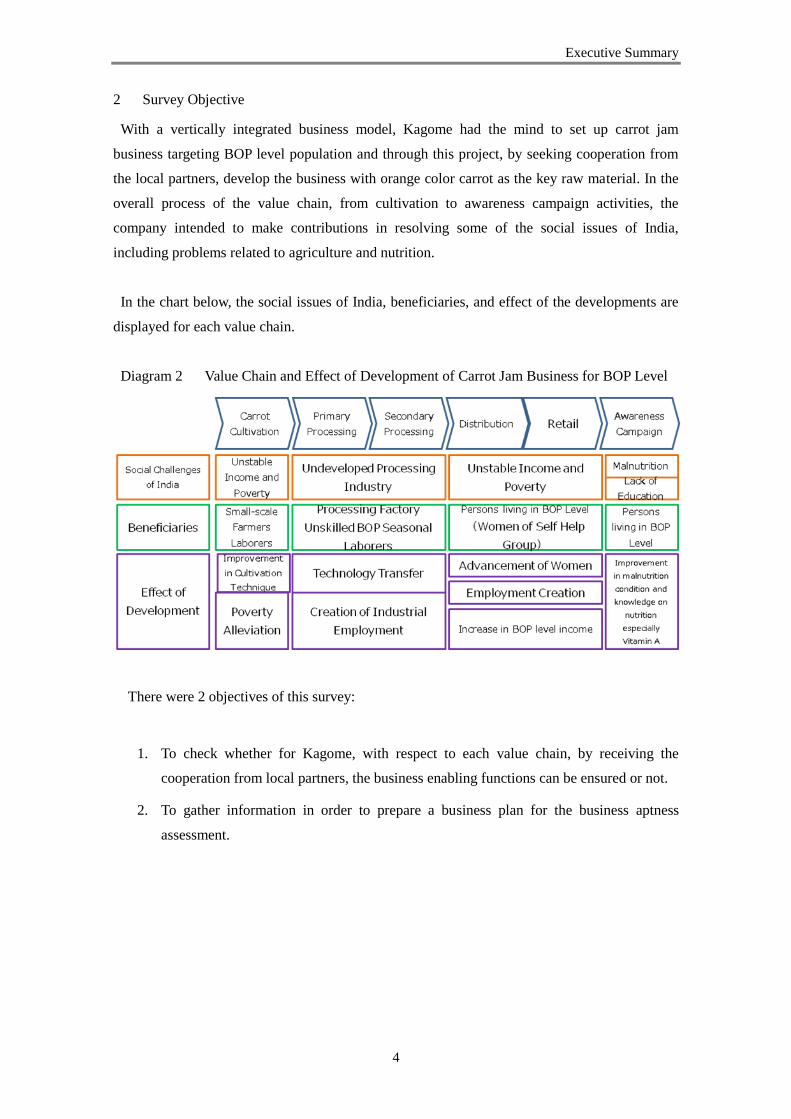
With a vertically integrated business model, Kagome had the mind to set up carrot jam
business targeting BOP level population and through this project, by seeking cooperation from
the local partners, develop the business with orange color carrot as the key raw material. In the
overall process of the value chain, from cultivation to awareness campaign activities, the
company intended to make contributions in resolving some of the social issues of India,
including problems related to agriculture and nutrition.
In the chart below, the social issues of India, beneficiaries, and effect of the developments are
displayed for each value chain.
Diagram 2 Value Chain and Effect of Development of Carrot Jam Business for BOP Level
There were 2 objectives of this survey:
1. To check whether for Kagome, with respect to each value chain, by receiving the
cooperation from local partners, the business enabling functions can be ensured or not.
2. To gather information in order to prepare a business plan for the business aptness
assessment.
Page 11
Executive Summary
5
Diagram 3 Role of local partners and Kagome in vertically integrated value chain for carrot
jam business
Page 12
Executive Summary
6
3 Survey Regions
This survey was conducted in Bangalore, the capital of Karnataka State located in the southern
part of India and its surrounding regions. Initially, it was planned to hold the business survey for
BOP level population in the vicinity of Hyderabad of Andhra Pradesh State. However, to ensure
BOP business feasibility, from the perspective of ensuring marketing investment efficiency and
profitability, it was considered that it is first essential to ensure in advance the brand penetration
and distribution infrastructure by achieving success in business targeting MOP and TOP
population.
Thereby as target area for TOP and MOP business, Bangalore, the third most populous city of
India after Delhi and Mumbai, which can also be called as ‘Mall City’ where modern retail
stores frequented by TOP and MOP population are flourishing, was selected for survey for BOP
business.
General information about Republic of India, Karnataka State and Bangalore is given below.
Diagram 4 Basic Data of Republic of India, Karnataka State and Bangalore
Information on
Republic of
India
Karnataka
State Bangalore
Area (Km2) 3,287,469 191,791 2,196
Population 1,210,570,000 61,090,000 9,620,000
Capital/State Capital New Delhi Bangalore -
Literacy Rate 73.0% 75.6% 87.7%
Language
Hindi and
other 21
official
languages Kannada and Urdu
Religion
Hinduism 79.8% 83.9%
Islam 14.2% 12.9%
Christianity 2.3% 1.8%
Sikhism 1.7% 0.04%
Buddhism 0.7% 0.1%
Jainism 0.4% 0.7%
Race of People Indian, Aryan, Dravidian, Mongoloid, etc.
*Followers of Jainism do not eat any root vegetable which is cultivated underground
(including carrot) therefore such people have not been taken into consideration for this survey.
Page 13
Executive Summary
7
(source : Reference of India Census 2011 and other governmental documents,
http://www.mofa.go.jp/mofaj/area/india/data.html etc.)
*On 2nd
June 2014, Telangana State became an independent state separating from Andhra
Pradesh State, that is Andhra Pradesh State was divided into two separate independent states viz.
Telangana State and Andhra Pradesh State.
Page 14
Executive Summary
8
Diagram 5 Survey Area (India) Map
Page 15
Executive Summary
9
4 Steps, Targets and Duration of the Survey
Diagram 6 Overall Link-map of the Survey
1) Survey to understand the overall market and people
■Survey 1 Survey of Market and Business Environment (March-April 2013)
Comprehended market condition related to Vitamin supplement food, etc. and analyzed the
business environment in India
(Survey method: desk research and interview survey)
■Survey 2 Survey of Needs of BOP Level People (April-May 2013) (Hyderabad)
With the aim to explore as to where are the possibilities for consumption of vitamin
supplemented food in the life of BOP level people or the potential selling methods if the product
is purchased, ethnographic survey of 20 BOP households was conducted. In this survey detail
study of actual life style of BOP people was done and moreover a workshop was held at the
survey site to discuss the survey results.
| | | |
April January January December
Year2013 Year2014 Year2015
From March 2014
Page 16
Executive Summary
10
(Survey method: ethnographic survey and on-site workshop)
■Survey 6 Survey of Needs of BOP Level People (February 2015) (Bangalore)
Since the survey area was changed to Bangalore, same scale of ethnographic survey as was
held in Survey 2 (Needs of BOP level people (ethnographic survey) in Hyderabad) was
conducted in Bangalore too (for 20 BOP households). Differences and similarities of people of
BOP people living in Hyderabad and Bangalore were found from the survey outcome and
information was gathered to make a business strategy.
(Survey method: ethnographic survey)
2) Survey for Carrot Cultivation and Raw Material Procurement
■Survey 4-1 Survey on Carrots as Raw Material
(March-May 2014) (Southern regions of India including Bangalore)
To validate whether it would be possible to procure carrots locally for use as raw materials,
visited the farmers and markets in the southern regions of India, including Bangalore, and
interviewed people related to agriculture.
(Survey method: field survey and interview survey)
3) Survey for Product Development
■Survey 3 Hypothesis Validation Survey of Product Concept, Sales and Awareness Plan
(September 2013) (Hyderabad)
Hypothesis validation was done by doing survey of 60 BOP people samples for hypothesis on
product concept, sales methodologies and awareness promotion measures and information was
gathered for product concept, sales and awareness activities planning.
(Survey method: people assembled at a designated venue and survey was conducted)
■Survey 5 Survey of Prototype Product (June 2014) (Bangalore)
Since the project expansion area was changed from Hyderabad to Bangalore, the survey area
became Bangalore and survey was held for 100 BOP people samples with the objective of
validating and reviewing the product’s concept, product design, promotion and awareness plan.
(Survey method: people assembled at a designated venue and survey was conducted)
4) Survey for Production planning
■Survey 4-2 Production Site Survey (April - May 2015) (Bangalore)
In order to find local partners who can undertake the production process, primary processing
and secondary processing plants were listed. Their equipment was checked as well as their
hygienic conditions of each plant, and production tests were carried out at primary processing
plants.
(Survey method: interview survey and test production)
5) Survey for Distribution and Sales plan
■Survey 9 Survey of Distribution and Retail Stores (August 2015) (Bangalore)
Page 17
Executive Summary
11
In Bangalore, interviewed prospective distributors who could take up the sales activities,
presumed the intention of handling of the product planned for this project, distribution margin,
etc. and thereby used the information for making a business model.
(Survey method: Interview survey)
6) Survey for Planning Awareness and Communication
■Survey 7 NGO Survey (May 2015) (Bangalore)
Besides pursuing the business perspective conduct awareness campaign activities for BOP
level people on the necessity of nutrition and vitamin intake. Probable NGO groups who could
be the partners necessary to implement the activities were listed. Conducted interview survey
and comprehended the interest level of the NGOs to render cooperation in this project and
gathered information about the necessary condition, etc. to pursue the project.
(Survey method: interview survey)
■Survey 8 Survey on Validation of Stores Communication (August 2015) (Bangalore)
300 sample BOP people were made to do dummy purchase in a dummy shop in order to
validate the impact of in-store promotion which is important mode of communication with the
BOP people and arrive at the sales forecast.
(Survey method: people assembled at a designated venue and survey was conducted)
Page 18
Executive Summary
12
5 Survey Summary
Survey to understand overall market and people
(1)Vitamin A intake in India and Karnataka State (Survey 1)
The project was initiated on the basis of a report by the WHO stating that the percentage of
people in India with Vitamin A deficiency is as high as 20% and among children under 5 years
of age it is 62%. Thereby, about 78 million children have Vitamin A deficiency in India.
*Source:WHO『Global prevalence of vitamin A deficiency in populations at risk 1995-2005』
Following are the findings based on re-survey of literature, interview of government
organizations and doctors connected with NGOs done in 2014:
■ Literature Survey
Source :<Laxmaiah A et al., Public Health Nutrition, 2011> (as data of 2002 – 2005)
Although it varies from region to region, however in most of the regions among the preschool
age children or younger the percentage of Vitamin A deficiency (night blindness, Bitot’s Spot,
etc.) is less than 3%. However they do not have the necessary 61.8 % (20μg/dl) concentration
of retinol in blood.
<National Nutrition Monitoring Bureau Technical Report No. 26 (2012)>
The nutrition intake condition in India (rural areas) is as follows:
→ Vitamin A: More than 80% people consume less than 50% of RDA
(Recommended Dietary Allowance)
→ Calcium, Riboflavin (Vitamin B2) : More than 40% people consume less than 50% of
RDA
(Recommended Dietary Allowance)
→ Vitamin C, Folic Acid : More than 30% people consume less than 50% of RDA
(Recommended Dietary Allowance)
→Iron : More than 20% people consume less than 50% of RDA
(Recommended Dietary Allowance)
Source :<Kapil U et al., Indian J. Med. Res., 2013>
Following is the development scenario regarding the measures taken to improve the condition
of Vitamin A deficiency
Before 1970: Disorders such as loss of sight, etc. due to Vitamin A deficiency were frequent and
measures to improve the situation was awaited.
Page 19
Executive Summary
13
Year 1970: Start of the Vitamin A dosage administration Program (administer Vitamin A syrup
to children between 9 months to 36 months)
Year 1994: Change of Vitamin A administration program (WHO standard)
6- 11 months administration of 100,000IU of Vitamin A (only once)
12-36 months administration of 200,000IU of Vitamin A (once in 6 months)
*IU is abbreviation of International Unit. For Vitamin A intake 1IU=0.33μg (retinol
equivalent)
Year 2006: Extension of administration period (children of 6-59 months)
Due to the Vitamin A administration program, the infant mortality rate was reduced by 23%.
Regarding the vaccination for Vitamin A, whereas the vaccination rate in the first half of 1970
was only 5%-7% now it has improved to 60% - 90%. About Bitot’s Spot (the WHO standard of
keratomalacia : white spots on the eyes which occur due to Vitamin A deficiency is less than
0.5%), in entire India during 1975-1979 the percentage was 1.8%, during 1996-1997 the
percentage was 0.7% and in 2001 out of 16 regions the number of regions which had crossed
0.5% occurrence of Bitot’s Spot got remarkably reduced to 3 only (northern India: in Bikaner
1.10%, eastern India: in Patna 3.11% and in Gaya : 4.71%)
■Result of the interview held at Health and Family Welfare Department in Bangalore on July
15th 2014
In Karnataka State through malnutrition persists, case of Vitamin A deficiency is not there.
■Interview of NGO (KHPT) in May 2015
Owing to the Vitamin A administration program of the government, issues regarding Vitamin A
inadequacy have been solved up to a large extent however room for improvement still remains.
In Bangalore city, 5-6% of the population has Vitamin A deficiency and among them 70-80%
belong to BOP level.
■Kagome’s View
Although the Vitamin A deficiency condition has improved and symptoms of the deficiency
are not observed, there is the possibility that the deficiency can impact immunological
deterioration, etc. which can hamper healthy growth. For normal development it is essential to
grow the food habit so that Vitamin A and other nutritional requirements are met through daily
intake of food.
(2) Understanding the needs of BOP people (food habits, buying behavior, source of
information, health awareness) (Survey 2, Survey 6) <content of the survey>
Page 20
Executive Summary
14
Since at first the suburbs around Hyderabad city center was considered for the project,
ethnographic survey was conducted for 60 BOP households in those areas.
Surveying the food habit, buying behavior, source of information, health awareness, etc. of the
people living in BOP level, and afterwards holding a workshop at the survey site with all the
participants of the survey where the survey result was summarized and a focus group discussion
was made. On the basis of the possibilities as to where the Vitamin supplement product can be
introduced in the life of BOP people and how the product can be sold to the BOP buyers, the
business concept was created. (Survey 2)
After that, since the survey area was changed from Hyderabad to Bangalore, same scale of
ethnographic survey that was held in Hyderabad was conducted in Bangalore too (for 20 BOP
households). The survey comprehended the needs of BOP level people in Bangalore, as well as
the differences and similarities of people of BOP level living in Hyderabad and Bangalore.
(Survey 6)
<Survey Result>
The staple food of Hyderabad is mainly rice and the consumption of bread or other vegetables
is infrequent and quantity is minimal. Rice is mainly eaten in Bangalore too, but bread is also
eaten frequently and consumption of vegetables as additional food is also more. However, in
both the areas, in BOP households the necessary minimum amount of vegetables is not
consumed, carbohydrates are mainly eaten and meat is eaten only during weekends, therefore
the vegetables and meat which can provide vitamins are not adequately taken. Thereby as a
consequence the vitamins consumption is not enough.
Compared to Hyderabad it is easier to purchase carrots in Bangalore therefore daily intake of
carrots and familiarity with this vegetable is more in Bangalore. BOP level people have the
basic knowledge that carrot is good for eyes, blood and good for health but they hardly know
about Vitamin A. Therefore it was understood that nutritional awareness activities related to
Vitamin A should be conducted in Bangalore.
Children in both Hyderabad and Bangalore eat jam often as snacks, but bread is eaten more in
Bangalore as compared to Hyderabad and thus consumption of jam is more frequent in
Bangalore. With this it was assessed that there is potential in selling carrot jam in Bangalore.
In both Hyderabad and Bangalore, BOP level people do their daily shopping mainly in
traditional retail stores like Kirana or road side shops and mostly do not visit modern retail
stores like supermarkets, hyper stores, etc. However, in Bangalore frequency of bread
consumption is more therefore, unlike Hyderabad, bakery shops in Bangalore are more
Page 21
Executive Summary
15
frequented. Considering this kind of shopping pattern of BOP people it was assessed that carrot
jam can be sold mainly in Kirana or bakery stores.
In Hyderabad, the Anganwadi workers visit the households and impart knowledge regarding
health and nutrition to the mothers. For BOP people this is an important source of information
regarding health. In Bangalore there is a trend that the doctors of neighboring hospitals give
advices regarding health and nutrition and Anganwadi influence is relatively low therefore it is
all the more important to hold awareness activities there by the support of NGO, etc.
It was learned that in Bangalore as well as Hyderabad, BOP level people know that carrot is
good for their health and it improves blood, but they lack the knowledge about Vitamin A and its
nutritional values and they do not have adequate awareness.
Survey for Carrot Cultivation and Raw Materials Procurement
Survey on carrot as raw material (Survey 4-1)
■Survey objective: To understand the cultivation and distribution in the main producing
regions of orange carrots viz. Karnataka State, Tamil Nadu State and
Andhra Pradesh State.
■Survey area: One of the main carrot producing areas situated within 550km radius of
Chittoor where primary processing factory is located
■ Survey Result
Except Chittoor, in all other carrot cultivating areas visited for this survey, for the carrot
farmers the revenue from carrot is highest among all other crops. Moreover, in all the carrot
producing areas the carrot production quantity is increasing every year.
Ranga Reddy Ooty Hosur Malur Kolar Chikkaballapur
Carrot 40% Carrot 80% Carrot 75% Carrot 30% Tomato 40% Carrot 30%
Tomato 30% Potato 15% Onion 10% Capsicum 20% Carrot 25% Cucumber 25%
Beetroot 20% Cabbage 5% Potato 10% Cucumber 10% Capsicum 25% Tomato 20%
Bean 5% Bean 5% Tomato 10% Others 10% Cabbage 15%
Bitter
gourd
5% Beetroot 5% Others 30% Beetroot 10% Within 550km radius of
Chittoor
Within 200km radius of
Chittoor
Diagram 7 Revenue percentage for
various crops produced by farmers
Diagram 8 Surveyed carrot producing
area crops produced by farmers
Page 22
Executive Summary
16
It was verified that carrot can be procured in targeted price in Malur, Kolar, Hosur and
Chikkaballarpur situated within 200km from Chittoor during December to February.
Diagram 9 Market Purchase Price of carrot for every month
In southern India, the Aggregator system is there. An Aggregator is a business operator who
procures vegetables or fruits from the famers and sells in the APMC (Agricultural Produce
Market Committee-basically it is the market). However, the Aggregator does not deal with small
– scale farmers therefore small-scale farmers directly visit the APMC to sell their crops.
Diagram 10 Distribution structure of carrot and the Margin
■Summary
It was verified that it is possible to procure a large amount of carrot for raw materials in
targeted price in the areas near (within 200km) Chittoor. However, at first, while starting the
project, in order to ensure quality and effect of the raw material procurement, realistic approach
is being considered by using large scale farmers through the utilization of Aggregators.
Survey for product development
Verification of developed product’s acceptability and product development information
collection (Survey 3 and Survey 5)
Page 23
Executive Summary
17
<Survey Content>
In Hyderabad, hypothesis validation related to product concept, sales and awareness
methodologies were conducted through questionnaires to BOP people. Based on the result of the
questionnaire, product concept, sales and awareness methodologies were further elaborated on.
(Survey 3)
Moreover, since the project expansion area was changed from Hyderabad to Bangalore, the
survey area was also changed to Bangalore. For 100 BOP people samples survey was conducted
to validate the improved product concept, product design, sales and promotion and awareness
plan and review of proposals of name of the product and packaging which can appeal the BOP
people most was also done.
< Survey Result>
In Survey 3, regarding product concept it was understood that BOP people are attracted to the
term “health” that is they want the children and family to lead a healthy life. From the
perspective of children they are fond of “candy”, “juice”, etc. and those are popular too but from
the perspective of good health of children, “jam” or “juice” are more preferred. As for “jam”,
children like “jam”, those are easily available and can be taken at breakfast so ‘jam’ is attractive.
Also, for intention to purchase, “jam” acquired the highest purchase intention rate among BOP
people.
Regarding taste, sweet taste is preferred and if the specialty of the taste is easily understood
then it would appeal to them more. For color, red carrot is popular and dark color carries
positive images like high nutritional value, appears to be delicious, etc.
As above, as “jam” proved to acquire highest purchase intention in product idea evaluation,
also prototype “jam” being accepted favorably in tasting test, decision is made to proceed with
the development of “jam” in this project.
In Survey 5 too, multiple proposals on the basis of the elaborated product concept of Survey 3
were given and “health concept” was rated as the best. From this survey result it was learned
that mothers of BOP families make their purchase decision depending on the fact whether a
product is good for the health for the family members, therefore the display on the product
should clearly convey the benefits of health, for example it is beneficial for eyes, heart, skin, etc.
and that the product is natural (made out of natural materials) is also important.
Page 24
Executive Summary
18
Regarding naming it was understood that it is important that the name should be easy to
pronounce or remember; conveys a feeling of fresh and hand-made, and can be attractive for
children. The name should not sound very serious.
About packaging it was learned that the design of carrot or fruits portrayed on the packet
should convey a real feeling and in addition to that the interest to purchase the product by
mothers increases as they get impressed by the visual image of carrot. Image of smiling, healthy
children is effective and to convey that the product as a whole is nature-based is also important.
Regarding taste of jam, color and flavor are the attraction factors. The ‘mixed fruit’ with added
mix berries taste had high appreciation.
Survey for production plan
(1) Process Testing Result at the Primary Processing Plant (carrot juice concentrate
manufacturing plant) (Survey 4-2)
■ Information on Primary Processing Plant
The plant is located in Chittoor in the Andhra Pradesh State and produces mango puree. It
holds No.1 rank in the world in mango puree production. Mango puree is produced from April
to July and 80% of its business revenue comes from mango puree. During December to
February which is the peak season for carrot harvesting the operation is low in this plant.
■Purpose of process testing
Utilize the plant which has mango puree production line, but no carrot concentrate juice
experience and thereby it is possible to continually produce carrot concentrate juice.
■ Result of process testing
Process testing was done twice, once in February and again in April. The result was that,
although there is a lot of scope for improvements, without any manufacturing line obstruction,
carrot concentrate juice (Bx15) could be manufactured successfully.
(2) Selection of Secondary Processing Plant (jam packaging plant) (Survey 4-2)
■ Preparation of list of the secondary processing plants on contract basis
By receiving the cooperation of JETRO, we prepared a list of plants of southern India which
manufacture mini pack of jams.
Packer A Company (in Bangalore city, small scale company)
Packer B Company (in Mysore: 150km southwest from Bangalore)
Packer C Company (in Bangalore city, subsidiary company of a large food product
company)
Page 25
Executive Summary
19
Packer D Company (in Hassan area: 200km west from Bangalore)
■Contract possibility regarding each company
The Packer C Company has good performance regarding jam manufacturing and quality
control level is also high however it was found out that they do not have mini pack in their
production line. Moreover, they do not have any experience in contract manufacturing. The
quality control level of the other 3 companies was found to be low, and thus it was assessed that
contract for manufacturing cannot be given to them at ease.
As a consequence, no company was found in southern India where mini pack jam could be
made on contract basis.
Survey for sales and distribution planning
Distribution and retail sales survey (Survey 9)
<Objective of the survey>
Survey was conducted to understand the sales route, sales potential, distribution route, and
margin structure related to Kagome product of carrot jam (15gm sachet). The objective of the
survey was to create sales and profit plan based on the results of the survey.
<Survey result>
Diagram 11 Number of retail outlet (Kirana, Bakery, Drug store)
The total numbers of Kirana, Bakery, and Drug store
outlets in Bangalore are 31,400. Half of these are
Kirana which deal with food and other grocery items
followed by bakery and drug store respectively.
Other than that there are around 300 super market
types wholesale shops to which smaller Kirana go to
purchase.
Based on the hypothesis that the high sales value outlets in urban area are not the right channel
to sell low unit price jam mini pack, we classified the outlets based on their approximate sales
volume, as described below (Diagram 12).
Diagram 12 A,B,C,D categorization of Kirana, Bakery
Outlet Category Sales per day (Indian Rupee)
Kirana
A ≥ 40,000
B ≥ 25,000 to < 40,000
C ≥ 10,000 to < 25,000
D < 10,000
Bakery
A ≥ 20,000
B ≥ 10,000 to < 20,000
C ≥ 5,000 to < 10,000
D ≥ 2,000 to < 5,000
Retail outlet Number
Kirana 18,000
Bakery 9,900
Drug store 3,500
Total 31,400
Page 26
Executive Summary
20
Diagram 13 represents the results of the survey.
Diagram 13 Sales situation of mini pack jam in each category of the outlet
Urban Suburbs
Kirana Bakery Kirana Bakery
A B C D A B C D A B C D A B C D
Mini pack × ○ ○ ○ - ○ ○ ○ ○ ○ ○ ○ - ○ ○ ○
Selling ratio ○:≥ 50% ×:< 50% -:Not available
In urban area Kirana A outlets which have high sales volumes, less than 50% of such shops
were dealing with mini pack jam. Large scale bakeries of A category were not available.
However, even in case of Kirana B in urban area, though the mini pack jams were available but
the visibility was not given importance indicating low sales.
Kirana A and B in urban area are rarely keeping low unit price mini pack jams, though they
keep larger pack higher unit price jam products. In contrast to this Kirana C and D deal with
mini pack Jam. In case of Bakery B,C,D deal with jam larger pack and mini pack. Further in the
drug stores other health and nutrition products are sold but they do not deal with jam.
From these findings it became evident that the possibility of selling mini pack of jam in urban
Kirana A, B is very low. On the other hand Kirana C, which is located near residential area and
bus stops, deal with a higher volume and rotation of product, is also fast. It was also found that
the usage of mini pack jam for lunch box or snack for kids is high. Thus Kirana C and D were
found to be higher sales potential shops.
In terms of the competition for mini pack jam, majority of the market share is held by Kissan
jam which is a product of Hindustan Unilever Limited. In July 2015 the unit price of Kissan jam
mini pack was revised from Rs. 2 to Rs. 3, while increasing the volume by 33% from the
existing 15g and changing the package design. However this resulted in around 30% decrease in
sales and the company again rolled back the price to Rs. 2. This indicates that the price revision
was not accepted in the price sensitive market. Product price for Kagome is very tough as our
unit pricing for 15g mini pack jam is Rs. 5. The following diagram indicates the distribution
channel and margin at each level for the mini pack jam in Indian market.
Distributors play a vital role in getting the manufacturer’s product up to to the retail outlet.
Large companies typically have their own transport and logistics facility (or depend on C&FA)
and create their own distributor network. In other cases the product reaches the company’s
associated distributor network through Super Stockist (SS) or a Consignment Agent (CA).
Page 27
Executive Summary
21
In terms of margin, the SS or CA retain around 8% margin, distributors retain around 10% and
retailers around 15%. However in case of C&FA which has its own distribution channel, it
retains around 3% margin. Among these various patterns, SS model is a risk free model as the
SS buys the products from the manufacturer ensuring the manufacturer the value and relieving
from the risk of nonpayment.
In most of the cases the mini pack jam reaches the retail outlet using these distribution
channels. However through the survey it was found that Kirana D and Bakery D which are low
sales volume outlets, are are not covered by the distributors. Approximately 40% of small retail
outlets go to wholesale shops to procure their products for sales.
Diagram 14 Distribution channel and merging composition
Kagome sales strategy
Based on the sales and distribution survey results, Kagome’s strategy would be to target Kirana
C and Kirana D as a priority. Keeping in view the usage of mini pack jam in children lunch box
and people using it as a snack, among such outlets also priority will be given to outlets which
are in close proximity to residential areas, schools, bus stands and railway stations. Also super
market style wholesale shops also will be given priority as close to 40% of Kirana D outlets go
to wholesales to buy their items. Further Bakery C will also be targeted, though the volume is
small.
Page 28
Executive Summary
22
Super Stockist model will be adopted as the managing burden on company in each region will
be less and money collection risk can be reduced.
Considering the market potential and the cost effectiveness of advertisement, it would be
difficult to invest largely in advertisement; and therefore we would keep in mind not only
awareness activity but also sales to be carried out utilizing the SHGs which have a close link to
NGOs working with BOP people.
In the 1st and 2nd year the focus would be on selling in Bangalore and its suburbs in Karnataka,
by selling through Kirana and SHG; and in the 3rd year and 4th year the sales will be expanded
to Hyderabad in Telengana and Chennai in Tamil Nadu respectively.
Survey for awareness and communication plan
(1)NGO survey (Survey 7)
<Survey objective>
In survey 7 the possibility of popularizing the product in BOP people using NGOs, schools,
Anganwadi, and hospitals was surveyed. Specifically, 1) Awareness activity related to dietary
education, 2) Selling through the school meal program, 3) Selling through SHGs under NGO;
these three things were surveyed. It is imperative to increase the profitability in order to
continue this business. Thus it is very important to increase the awareness about the product by
giving the product and simultaneously impart knowledge about nutrition (dietary education).
Though it is difficult for a private company to approach directly to anganwadis, government
school and hospitals, as NGOs have a good network not only with the state governments but
also with these institutions, we surveyed the NGOs. Therefore while promoting new products
and taste it can be expected that the NGOs have a trust based relationship with BOP people and
can communicate with them better in local language and dispel the traditional
stereotypes/thought. Thus, we consider it would be effective to do awareness activity and sales
activity through NGO.
<Survey results>
2 points were found as a result of the survey.
It would be possible to carry out awareness activity in anganwadis, government school and
hospitals through NGO.
Currently given the legal system and rules it is not possible for a private company to provide
processed food in anganwadis, nor mid-day-meal in government schools.
Page 29
Executive Summary
23
The interest level for awareness activity was high in the organizations such as SHG, CBO and
Anganwadi. They were also motivated to popularize the product through word of mouth if the
product is tasty, good for health and the price is attractive, while they also gave concrete ideas
about PR methods. Since these organizations can impact the local community, good results can
be anticipated if these organizations can be utilized.
On the other hand it was found that legally it is prohibited for a private company to provide
processed food in Anganwadi and school meal program (mid-day-meal). As CSR products such
as stationery or uniform etc. can be given free of cost by processed food product is prohibited.
Only products can be given to SHGs but it is difficult form business based on that as they do
not have large network unlike NGOs. NGOs expect donations from corporate and though they
have shown interest in Kagome’s carrot based jam product, given the aforesaid background, it
would not be feasible to distribute or sell products in schools, anganwadis and distribute in
hospitals using an NGO.
Therefore in view of the above, going forward, only small volume sales through SHGs and
limited awareness program would be possible. Thus only with SHG the profitability cannot
increase resulting in difficulty in continuing this as a business.
Carrot jam of Kagome is a value appeal product. Awareness of its value can be promoted by
dietary education and providing product in school meals. Once the children like and convey it to
mothers, such aware mother will buy the product and it will get popularized. Therefore to
materialize this it is imperative that private companies participate in school meal program
similar to the practice in Japan. However that possibility in India is zero currently.
For BOP business it is necessary to provide product in school, Anganwadi and hospitals. It
would be realistic to start with giving free samples in such places with the help of NGO.
(2)Survey related to validate in store communication (Survey 8)
<Survey content>
Multiple patterns of in-store promotion methods were adopted and 300 sample BOP people
were made to do dummy purchase in a dummy shop in order to validate the impact of in-store
promotion, which is important mode of communication with the BOP people and arrive at the
sales forecast.
<Survey result>
In order to validate the effectiveness of promotion inside shop and outside shop, P0 to P3 four
patterns of promotion materials were arranged. Changing these materials respectively in the
Page 30
Executive Summary
24
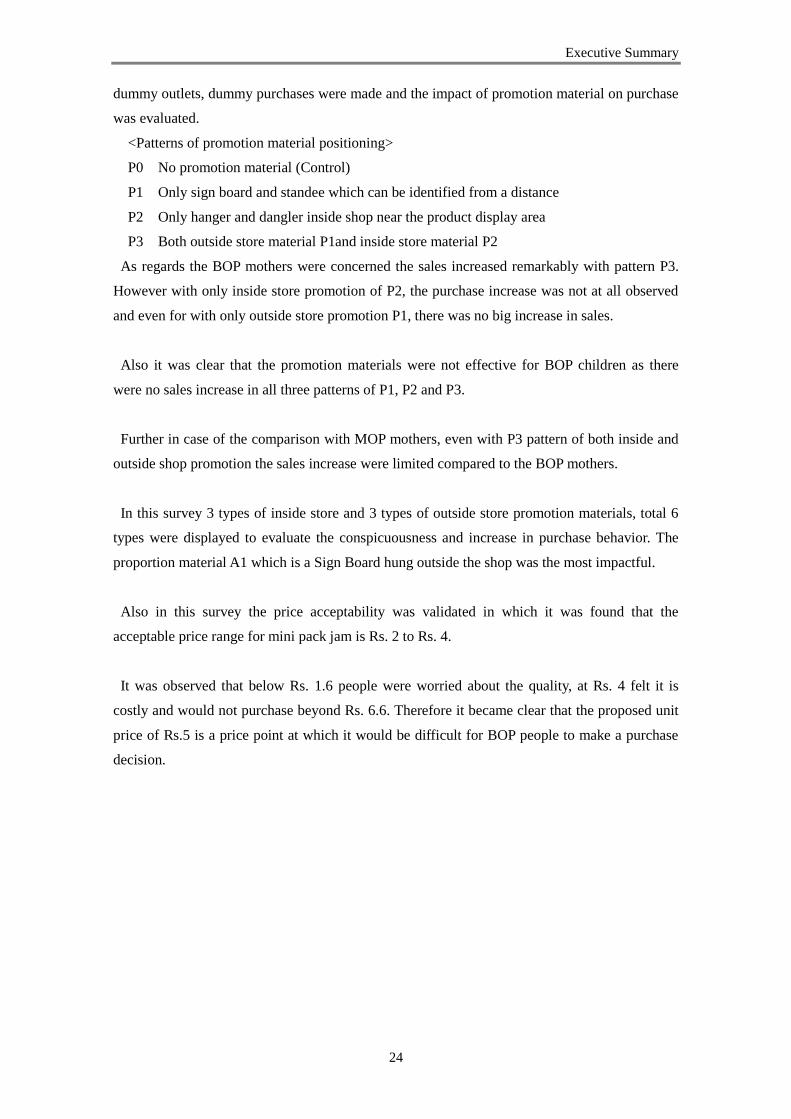
dummy outlets, dummy purchases were made and the impact of promotion material on purchase
was evaluated.
<Patterns of promotion material positioning>
P0 No promotion material (Control)
P1 Only sign board and standee which can be identified from a distance
P2 Only hanger and dangler inside shop near the product display area
P3 Both outside store material P1and inside store material P2
As regards the BOP mothers were concerned the sales increased remarkably with pattern P3.
However with only inside store promotion of P2, the purchase increase was not at all observed
and even for with only outside store promotion P1, there was no big increase in sales.
Also it was clear that the promotion materials were not effective for BOP children as there
were no sales increase in all three patterns of P1, P2 and P3.
Further in case of the comparison with MOP mothers, even with P3 pattern of both inside and
outside shop promotion the sales increase were limited compared to the BOP mothers.
In this survey 3 types of inside store and 3 types of outside store promotion materials, total 6
types were displayed to evaluate the conspicuousness and increase in purchase behavior. The
proportion material A1 which is a Sign Board hung outside the shop was the most impactful.
Also in this survey the price acceptability was validated in which it was found that the
acceptable price range for mini pack jam is Rs. 2 to Rs. 4.
It was observed that below Rs. 1.6 people were worried about the quality, at Rs. 4 felt it is
costly and would not purchase beyond Rs. 6.6. Therefore it became clear that the proposed unit
price of Rs.5 is a price point at which it would be difficult for BOP people to make a purchase
decision.
Page 31
Executive Summary
25
6 Sales plan, Profit plan
Following assumptions of area wise number of outlets, weekly sales for those outlets were
made to prepare the sales plan.
■Area wise number of outlets
Following are the area wise and channel wise number of outlets. Prioritizing the outlets in the
proximity of school, railway station, bus stand wherein more mini pack jam sales can be
anticipated.
Diagram 15 Bangalore (Urban) sales outlet number
Diagram 16 Bangalore (Devanahalli) sales outlet number
Diagram 17 Hyderabad (Urban) sales outlet number
Diagram 18 Bangalore (Urban) sales outlet number
Chn/Cat A A Priority B B Priority C C Priority D D Priority Total
Kirana 540 360 1800 1800 2160 3240 2835 5265 18000
Bakery 1080 720 900 900 1440 2160 945 1755 9900
Drug store 105 70 350 350 420 630 551 1024 3500
NGO/SHG 6 4 0 0 0 0 0 0 10
B2B&Ws 296 6 0 0 0 0 0 0 302
Total 1725 1150 3050 3050 4020 6030 4331 8044 31400
Chn/Cat A A Priority B B Priority C C Priority D D Priority Total
Kirana 15 10 50 50 60 90 79 146 500
Bakery 12 8 10 10 16 24 11 20 110
Drug store 3 2 10 10 12 18 16 29 100
NGO/SHG 1 1 0 0 0 0 0 0 2
B2B&Ws 5 0 0 0 0 0 0 0 5
Total 30 20 70 70 88 132 105 195 710
Chn/Cat A A Priority B B Priority C C Priority D D Priority Total
Kirana 600 400 2000 2000 2400 3600 3150 5850 20000
Bakery 528 352 1100 1100 1760 2640 1232 2288 11000
Drug store 150 100 500 500 600 900 788 1463 5000
NGO/SHG 3 2 0 0 0 0 0 0 5
B2B&Ws 397 8 0 0 0 0 0 0 405
Total 1278 852 3600 3600 4760 7140 5170 9601 36000
Chn/Cat A A Priority B B Priority C C Priority D D Priority Total
Kirana 750 500 2500 2500 3000 4500 3938 7313 25000
Bakery 960 640 800 800 1280 1920 840 1560 8800
Drug store 150 100 500 500 600 900 788 1463 5000
NGO/SHG 3 2 0 0 0 0 0 0 5
B2B&Ws 295 6 0 0 0 0 0 0 301
Total 1860 1240 3800 3800 4880 7320 5565 10335 38800
Page 32
Executive Summary
26
■Outlet wise weekly sales
From the results of Kissan jam sales quantity found through the Sales and distribution survey
(Survey 9) and results of pseudo-purchase results in the in-store communication validation
survey (Survey 8) weekly sales volume of Kagome carrot mini pack jam was estimated and can
be seen in the diagram below.
Diagram 19 Weekly sales volume per outlet Unit: Pcs/Week
■Sales plan (10 years)
The sales number for Bangalore suburbs has been taken as Devanahalli sales numbers
multiplied by the suburbs population ratio (Literate population), based on the above
assumptions. Further for the urban vs suburbs ratio for Hyderabad and Chennai has been
assumed to be same as that of Bangalore.
Diagram 20 Sales plan Unit: Million Pieces
■Sales plan
The selling price of the product from manufacturer has been calculated as 69.6% of the MRP
Rs.5 (i.e. Rs. 3.48). Thus the sales revenue has been estimated to be Rs. 191 million (i.e. 360
million JPY @ Rs.1=JPY 1.87, 23.10.2015 exchange rate) after 5 years and Rs.559 million (JPY
1.05 Billion) after 10 years.
Kirana Pcs/Outlet
/week
A 6
A Priority 8
B 6
B Priority 8
C 10
C Priority 12
D 6
D Priority 8
Bakery Pcs/Outlet
/week
A 4
A Priority 6
B 4
B Priority 6
C 6
C Priority 8
D 6
D Priority 8
Drug store,
Others
Pcs/Outlet
/week
A 6
B 8
C 6
D 8
NGO/SHG 10
B2B &
Wholesale 12
Page 33
Executive Summary
27
Diagram 21 Sales plan (Amount) Unit : Million Rs.
Following is the ratio of sales though SHG with cooperation from NGO, compared to the total
sales.
Diagram 22 Sales ratio through NGO
■Profit plan
According to the plan the operating profit can reach the breakeven point in 10th year from the
introduction of the product. The accumulated loss till such period would be Rs. 257 million
(JPY 480 million).
Diagram 23 Operating profit (profit / loss) trend Unit:Million Rs.
Diagram 24 Accumulated operating profit (profit / loss) trend Unit: Million Rs.
■Cash flow
The assumption of investments are, Rs. 30 million into plant and machinery and Rs. 100
million as capital before the start of the business, and further Rs.150 million in 4th year.
Diagram 25 Cash flow Unit: Million Rs.
Page 34
Executive Summary
28
7 Reasoning and basis for non-commercialization
Tough business environment around, such as shrinking domestic market due to decrease in
population, low birth rate and longevity; increase in import raw material, energy and logistic
cost, are continuing for Japanese food manufacturers including Kagome. Given this background,
in September Kagome decided to close the Liaison Office in Mumbai, India. With this the
vegetable juice business for TOP, and MOP segment which was also being explored along with
BOP business will be stopped for now.
As per the initial plan we intended to establish corporate brand by creating “Carrot = Kagome”
and then expand the business into Jam for BOP segment. Though this feasibility study was
carried out with an intention to do commercialization, this is being shelved in view of the
findings that the sales numbers are smaller than planned and investment payout period will take
more time than planned as given in the following diagram 26.
Diagram 26 Comparison of the sales planning and payout period before and after of the
survey
Following are the 3 points for the basis of decision.
【1】Difficulty in ensuring the scale of sales due to inability to set unit price that is acceptable to
local consumers.
The unit price of Rs. 3 panned earlier has to be made to Rs. 5, given the increase in planned
cost due to high cost of manufacturing, logistics, marketing. The acceptable price in market is
less than Rs. 4 and if ithe unit price is set as Rs. 5, purchase by the targeted segment cannot be
expected.
In terms of the competitor product Kissan jam which has No. 1 market share also faced
significant decrease in sales as a result of increasing the price from Rs. 2 to Rs. 3 and the
company again had to roll back the price to Rs. 2. Given such price sensitive consumer market
even if the feasible unit price of Rs. 5 is set, we concluded that it would not result in ensuring
the sales scale.
Before feasibility study After feasibility study
Sales plan
(5 years after launch)
JPY 800 million JPY 360 million
Investment
payout period
7 to10 years Impossible to get payout
within 10 years
Page 35
Executive Summary
29
【2】Ensuring sales scale is difficult in the absence of effective marketing method.
In the survey it became clear that the people in the BOP segment do not decide the product at
the outlet but mostly come with a decided mind to buy a particular product which they have
known through TV advertisements. However Kagome cannot do TV advertisements due to the
mismatch in the scale of the sales and the cost benefit.
As a measure, we explored the possibility of penetrating the product to children who are the
target customer by giving sample product in government school, anganwadi, government
hospital etc, but we had to give up the sales activity through these channels as the government
prohibits the distribution of food items in such places.
As a result, prospects of ensuring the desired scale of sales could not be set.
【3】Secondary processing factory (contractual packer) not be found.
To keep the manufacturing and logistics cost low we searched for a contract packing factory in
south India for secondary processing. However as a result of the survey we could not find such a
partner which could meet our company’s quality standards.
As the cost would go up further if produced in other region in India or overseas, it was not
considered. Also as the scale of sales was not sufficient to justify our own factory set up and
investment in plant and machinery, as a result we could not ensure a secondary processing
factory.
Page 36
Executive Summary
30
8 Challenges and solutions about poplularizing a nutrition appeal product in BOP segment
As given in above【2】during in-store communication survey (Survey 8) it was found that it is
extremely difficult for food manufacturer in India to sell nutrition value products to BOP people
(especially children) as the in store promotion is not effective. The reason is that the people in
the BOP segment do not decide the product at the outlet but mostly come with a decided mind
to buy a particular product which they know through TV advertisements.
Even by utilizing the self help group under NGOs which can paly an important role to convey
the value of the product and sell it, the contribution by such sales can only be less than 10%
which is not encouraging. (Refer diagram 27)
Thus, following 2 ideas can be considered as an approach to effectively communicate the
nutritional value of the product to children who are the target customer.
One is to sell not only products for BOP but also for TOP / MOP segment in the same area and
thereby doing marketing activity including product’s value appeal. Not only to target BOP
segment but first sell product to TOP / MOP segment to create branding and then expand it to
BOP segment. For example other companies have followed similar strategy in Kissan jam and
shampoo.
The second idea is to provide the product free of cost to anganwadi, mid-day-meal through a
foundation and there by communicate the value and taste of the product (awareness activity) to
children. In the past the Britannia Company set up the Britannia Foundation and collaborated
with international NGOs such as Nandi Foundation and GAIN to provide product free of cost
through the foundation. With reference to this example, following method can be considered.
First to set up a foundation by the companies forayed into India, keeping Nutrition, Awareness
building and advancement of women and farmer in accordance with this project objective. This
foundation provides free product in anganwadi etc, in collaboration with NGOs such as KHPT,
which has geographical reach to multiple regions and also has stong network with state
government. In order to provide product to anaganwadi and mid-day-meal program, it is
necessary to have government approval but many NGOs have good relationship with
government and by routing through NGO the products can reach the children.
The reason for suggesting formation of a foundation is due to the law which prohibits private
companies from providing processed food in mid-day-meal and anganwadi. There are many
foundations such as Britannia Foundation and Pepsico Foundation. (*However there is a risk
that this also may be criticized assuming that the free product providing by the foundation may
Page 37
Executive Summary
31
be looked as having vested interest of profit. In fact litigations were filed against Britannia
Foundation and the foundation could not expand their activities all over India.)
Further this foundation can be designed so that not only nutritional development of people can
be achieved, but various sector companies can participate, such as an agriculture tool making
company can participate for improving and stabilizing farmer’s income; a publishing company
can participate for publishing awareness promotion material; a sanitary goods company can
participate for improving the hygene awareness of women etc. By doing so, a large mass of
BOP people can become beneficiaries. This would be the merit of a foundation formed by
multiple companies. Thereby not only from the nutritional improvement but also from multiple
aspects support can be extended. This will not only lead to social contribution but contribution
by multi-facet upliftment of BOP people.
The following diagram represents the scheme described.
Diagram 27 Scheme for increased value appeal of product