53
India’ s Index of Eight Core Industries from June to December 2014
| Date post: | 15-Jul-2015 |
| Category: |
Economy & Finance |
| Upload: | jhunjhunwalas |
| View: | 47 times |
| Download: | 0 times |

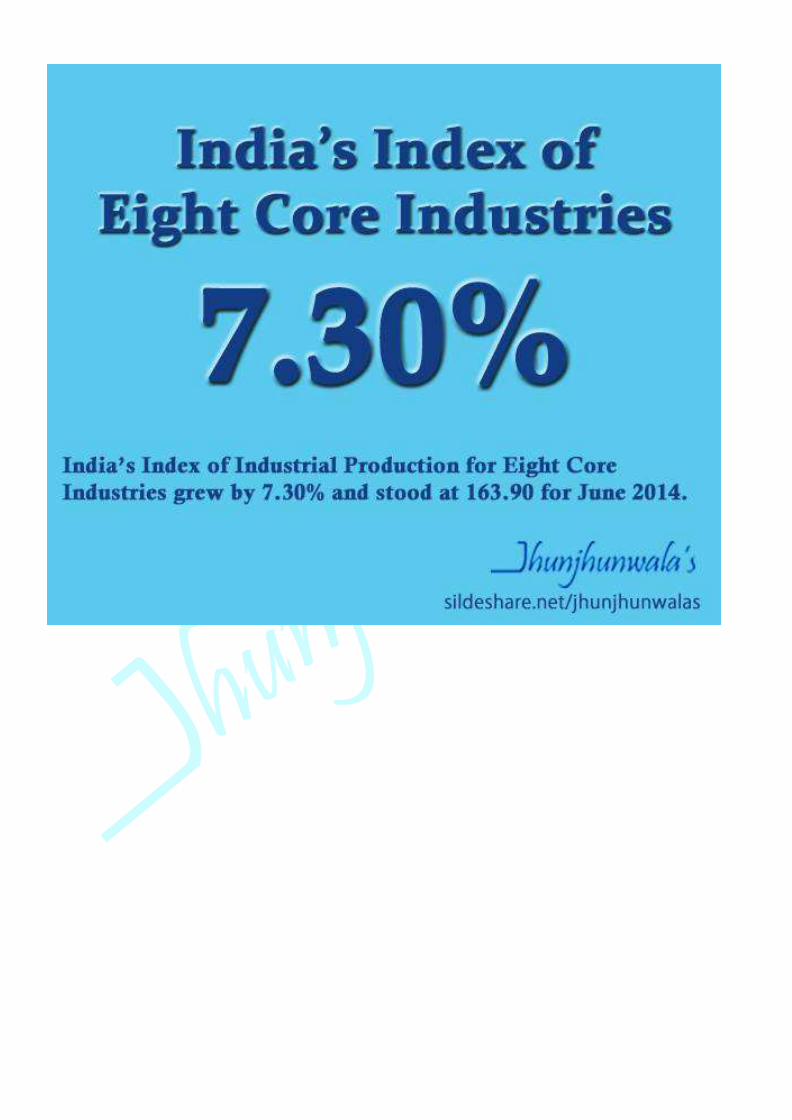
India’s Index of Eight Core Industries
from June to December 2014


India’s Index of Eight Core Industries from June to December 2014
#India’s Index of #EightCoreIndustries for the month of December 2014 stands at 172.70 which is at +2.40% compared to the same period last year.
Data Released on 2nd February 2015
The Eight Core Industries comprise nearly 38 % of the weight of items included in the Index of Industrial Production (IIP).
#IndustrialIndex #IndiaIndustrialData #IndiaEconomicData #Coal#CoalProduction #CrudeOil #CrudeOilProduction #NaturalGas#NaturalGasProduction #PetroleumRefinery#PetroleumRefineryProduction #Fertilizers #FertilizersProduction#IndiaFertilizers #ChemicalFertilizers #IndiaSteelProduction #Steel#Cement #CementProduction #IndiaCement #IndiaEletricityGeneration#EnergyProduction #IndiaIndustrialProduction #IndustrialOutput#JhunjhunwalasFinance
For more Informative post click: https://www.linkedin.com/company/jhunjhunwalas

Press Release dated 2nd February 2015
The Eight Core Industries comprise nearly 38 % of the weight of items included in the Index of Industrial Production (IIP). The combined Index of Eight Core Industries stands at 172.7 in December, 2014, which was 2.4 % higher compared to the index of December, 2013. Its cumulative growth during April to December, 2014-15 was 4.4 %.
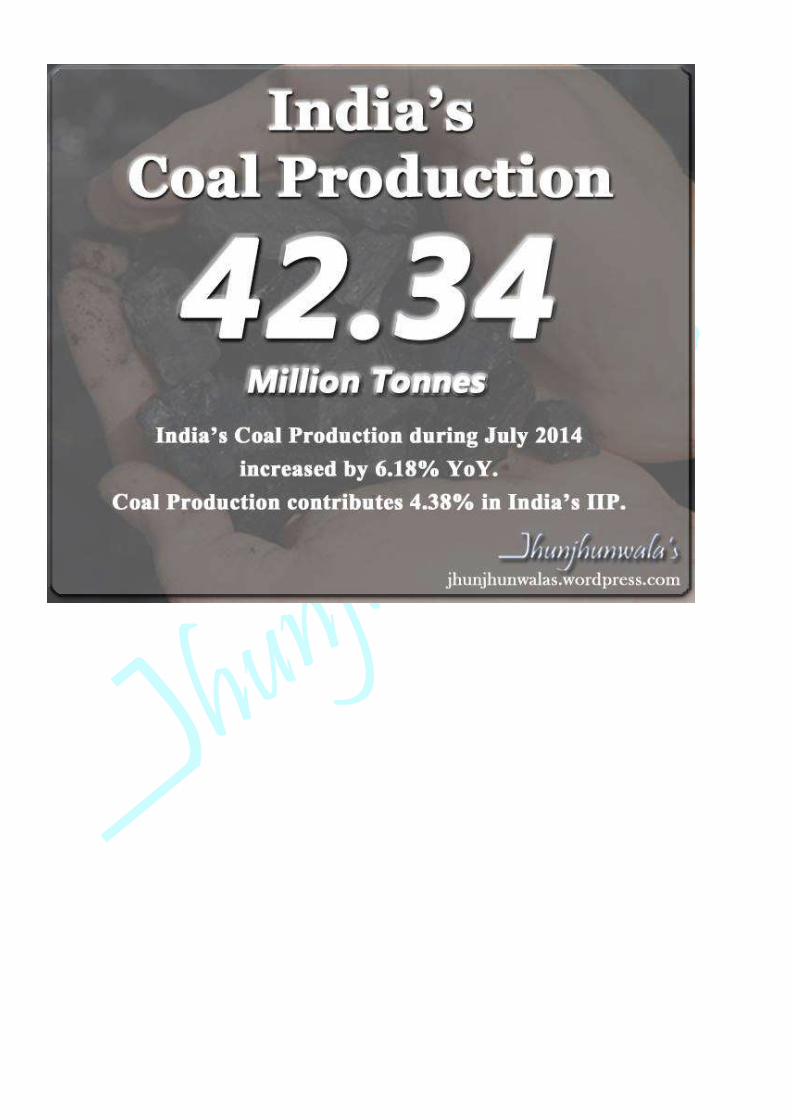
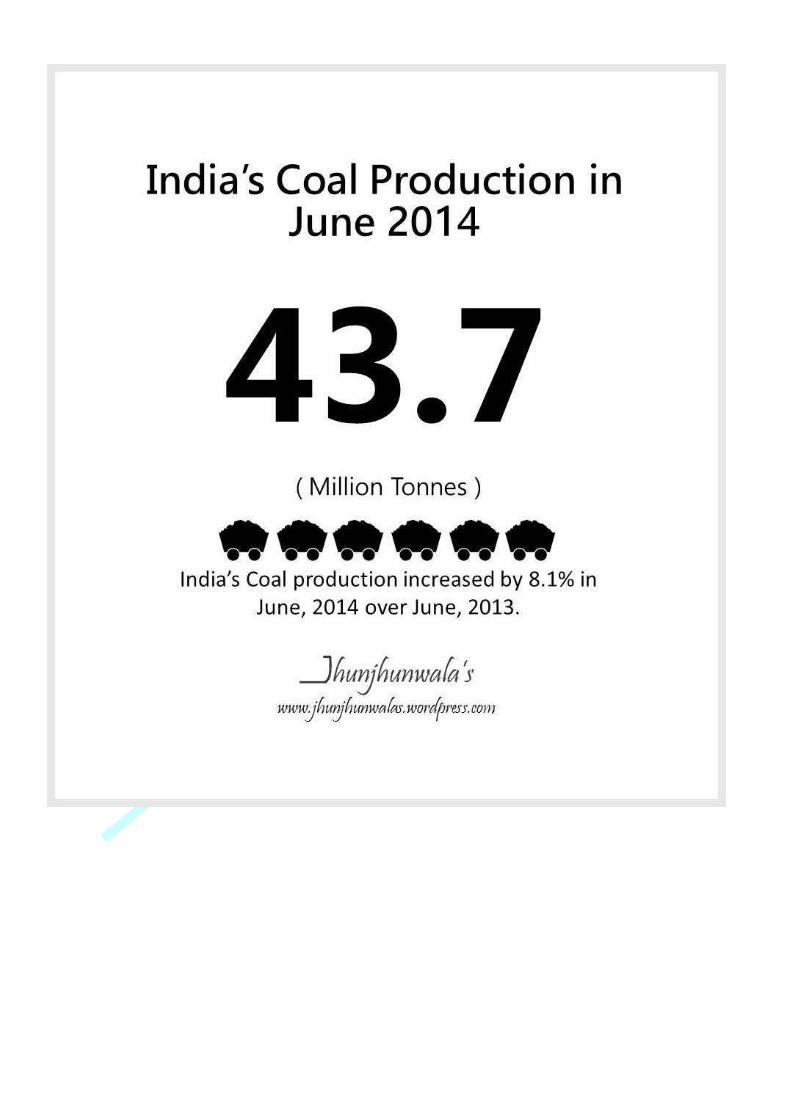
Coal
Coal production (weight: 4.38 %) increased by 7.5 % in December, 2014 over December, 2013. Its cumulative index during April to December, 2014-15 increased by 9.1 % over corresponding period of
previous year.
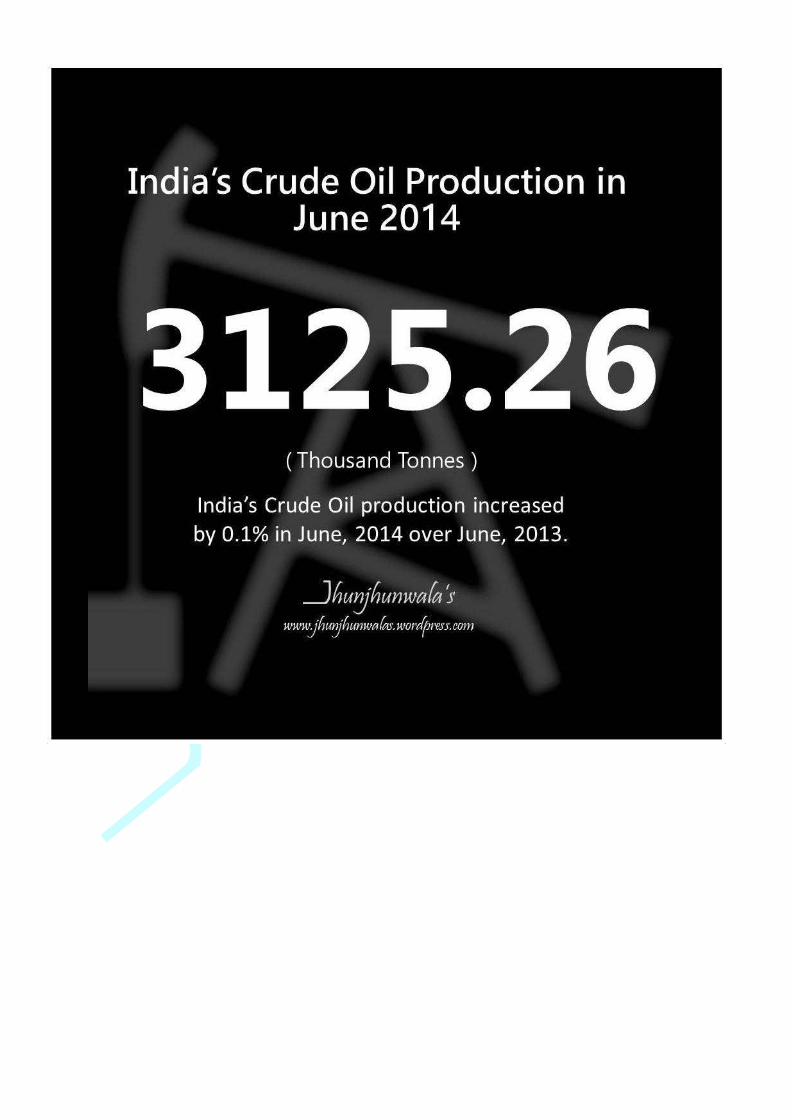
Crude Oil
Crude Oil production (weight: 5.22 %) declined by 1.4 % in December, 2014 over December, 2013. The cumulative index of Crude Oil during April to December, 2014-15 declined by 0.9 % over the corresponding period of previous year.
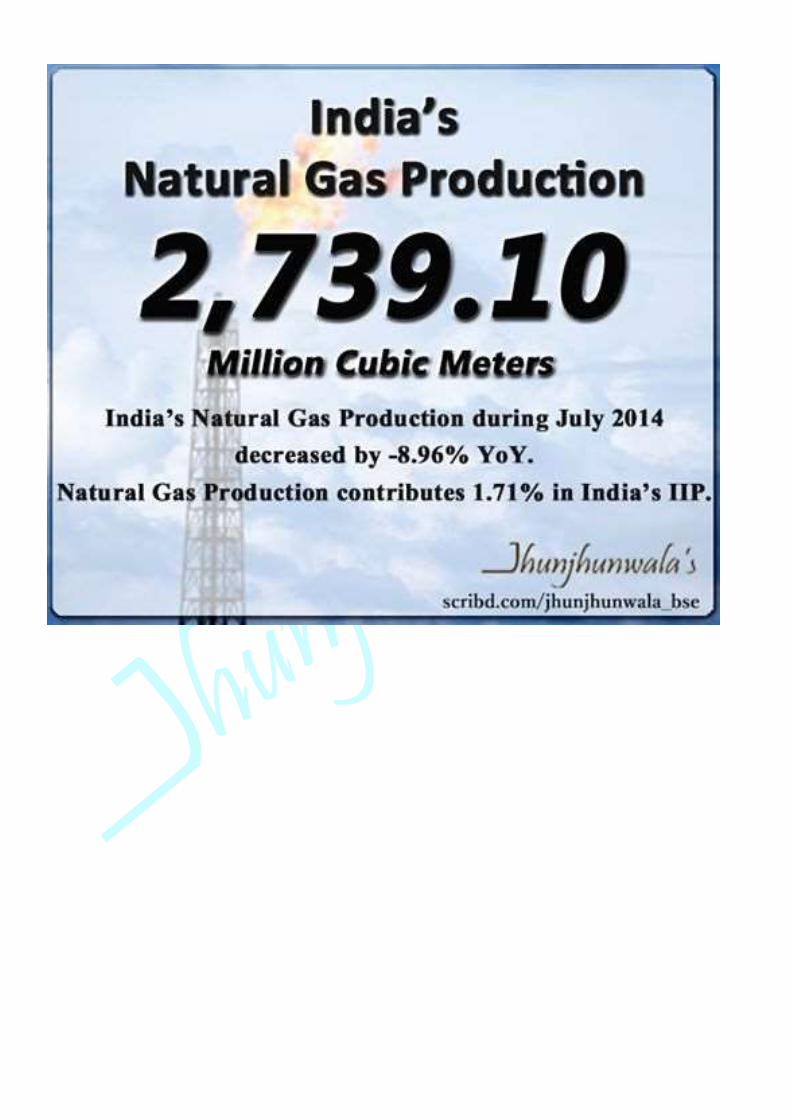
Natural Gas
The Natural Gas production (weight: 1.71 %) declined by 3.5 % in December, 2014. Its cumulative index during April to December, 2014-15 declined by 5.1 % over the corresponding period of previous
year.
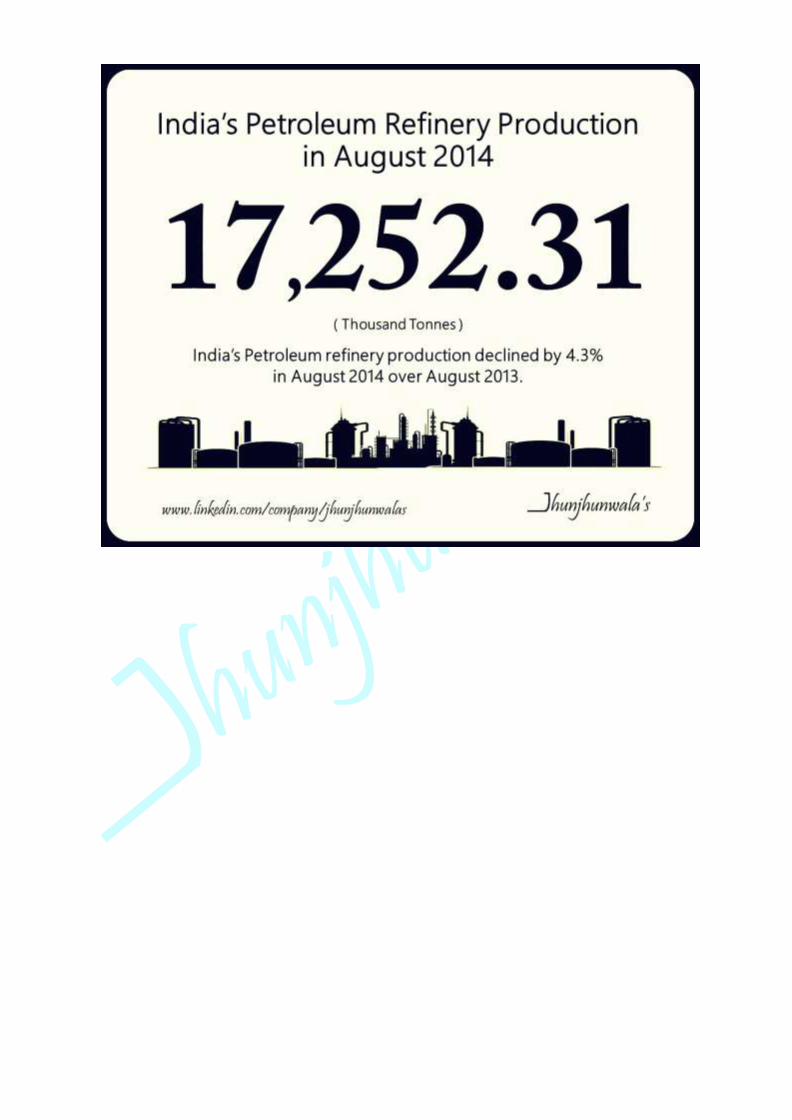
Refinery Products (0.93% of Crude Throughput)
Petroleum Refinery production (weight: 5.94%) increased by 6.1 % in December, 2014. Its cumulative index during April to December, 2014-15 increased by 0.2 % over the corresponding period of previous
year.
Fertilizers
Fertilizer production (weight: 1.25%) declined by 1.6 % in December, 2014. Its cumulative index during April to December, 2014-15 declined by 1.4 % over the corresponding period of previous year.
Steel (Alloy + Non-Alloy)
Steel production (weight: 6.68%) declined by 2.4 % in December, 2014. Its cumulative index during
April to December, 2014-15 increased by 1.6 % over the corresponding period of previous year.
Cement
Cement production (weight: 2.41%) increased by 3.8 % in December, 2014. Its cumulative growth
during April to December, 2014-15 was 7.9 % over the corresponding period of previous year.
Electricity
Electricity generation (weight: 10.32%) increased by 3.7 % in December, 2014 and it registered a cumulative growth of 9.7 % during April to December, 2014-15 over the corresponding period of previous year.
Press Release: 1st December 2014
Index of Eight Core Industries (Base: 2004-05=100), October, 2014
The summary of the Index of Eight Core Industries (base: 2004-05) is given at the Annexure.
The Eight Core Industries comprise nearly 38 % of the weight of items included in the Index of Industrial
Production (IIP). The combined Index of Eight Core Industries stands at 165.9 in October, 2014, which was
6.3 % higher compared to the index of October, 2013. Its cumulative growth during April to October, 2014-
15 was 4.3 %.
Coal
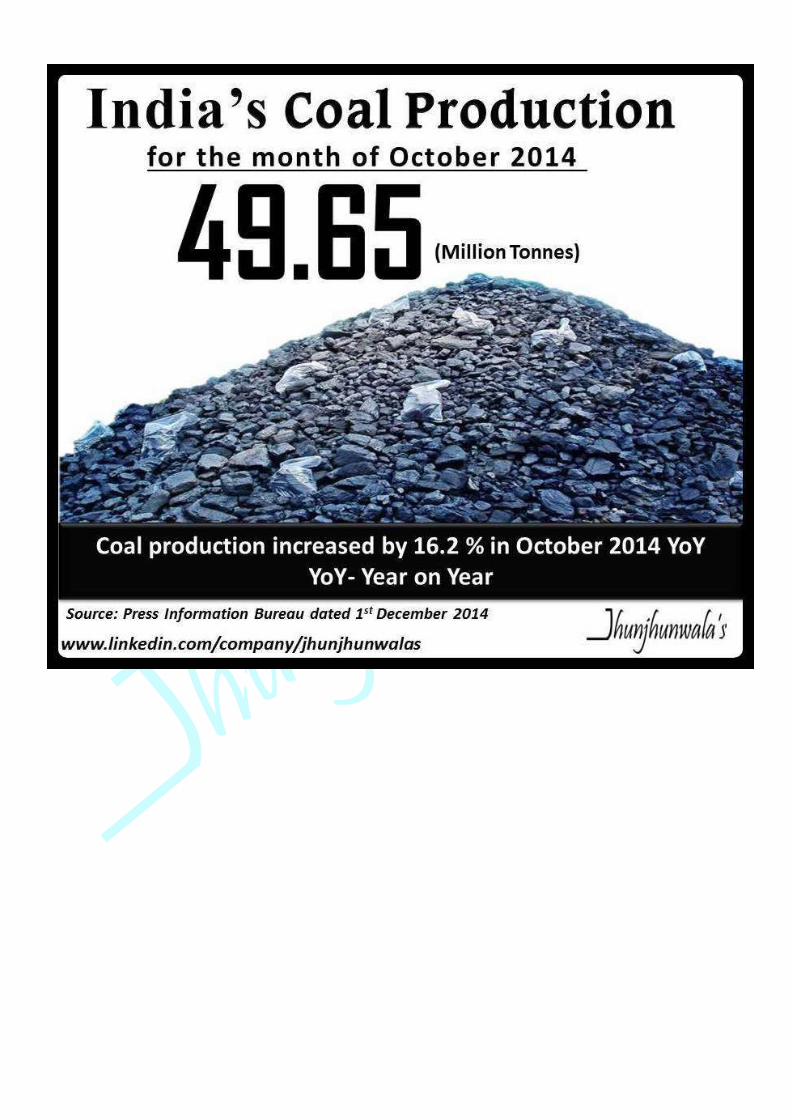
Coal production (weight: 4.38 %) increased by 16.2 % in October, 2014 over October, 2013. Its cumulative
index during April to October, 2014-15 increased by 8.5 % over corresponding period of previous year.
Crude Oil
Crude Oil production (weight: 5.22 %) increased by 1.0 % in October, 2014 over October, 2013. The
cumulative index of Crude Oil during April to October, 2014-15 declined by 0.9 % over the corresponding
period of previous year.
Natural Gas
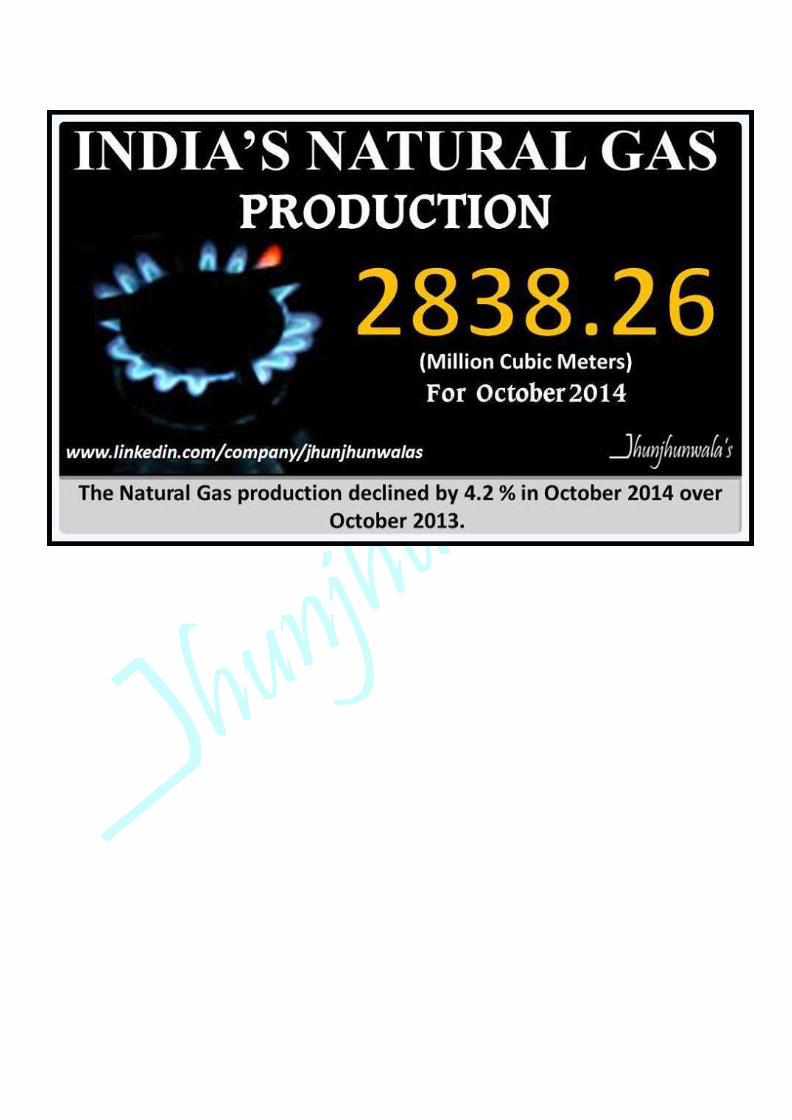
The Natural Gas production (weight: 1.71 %) declined by 4.2 % in October, 2014 over October, 2013. Its
cumulative index during April to October, 2014-15 declined by 5.6 % over the corresponding period of previous year.
Petroleum Refinery Products (0.93% of Crude Throughput)[1]
Petroleum refinery production (weight: 5.94%) increased by 4.2 % in October, 2014 over October, 2013. Its
cumulative index during April to October, 2014-15 declined by 1.7 % over the corresponding period of
previous year.
Fertilizers
Fertilizer production (weight: 1.25%) declined by 7.0 % in October, 2014 over October, 2013. Its cumulative
index during April to October, 2014-15 declined by 1.1 % over the corresponding period of previous year.
Steel (Alloy + Non-Alloy)
Steel production (weight: 6.68%) increased by 2.3 % in October, 2014 over October, 2013. Its cumulative
index during April to October, 2014-15 also increased by 2.3 % over the corresponding period of previous year.
Cement
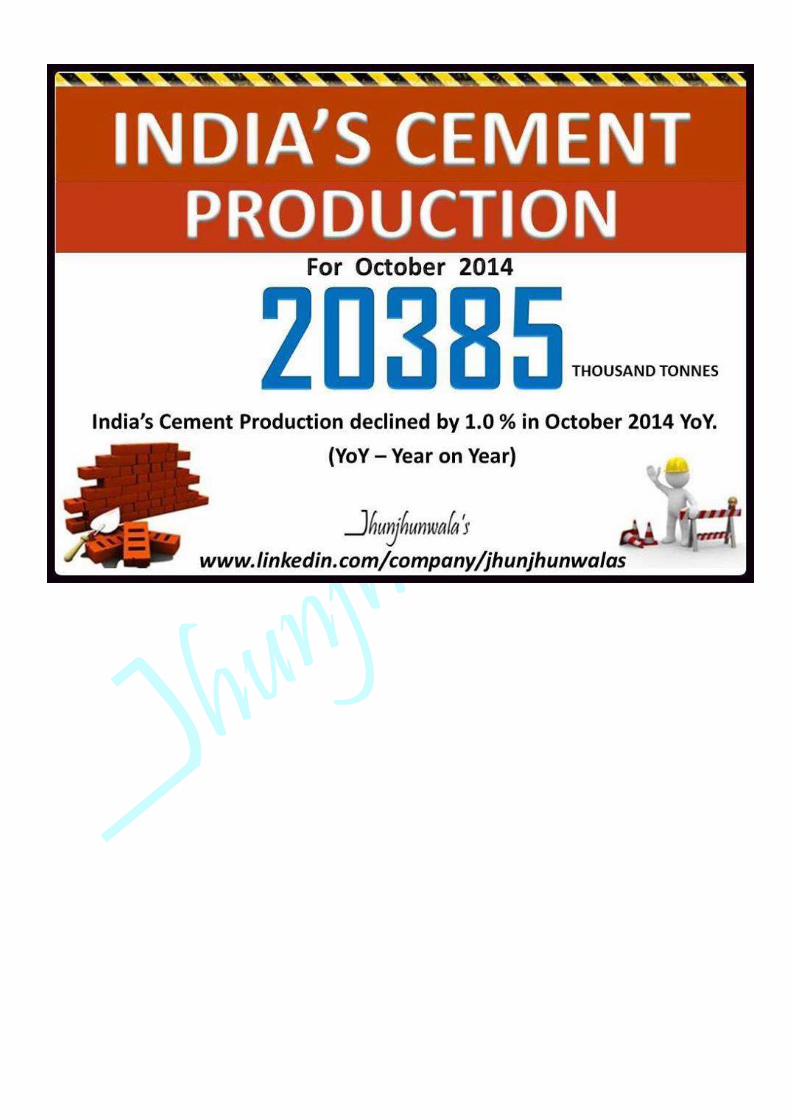
Cement production (weight: 2.41%) declined by 1.0 % in October, 2014 over October, 2013. Its cumulative growth during April to October, 2014-15 was 8.1 % over the corresponding period of previous year.
Electricity
Electricity generation (weight: 10.32%) increased by 13.2 % in October, 2014 over the period of October,
2013 and it registered a cumulative growth of 10.5 % during April to October, 2014-15 over the corresponding period of previous year.

Performance of Eight Core Industries
Yearly Index & Growth Rate
Base Year: 2004-05=100
(Weight in IIP: 37.90 %)
INDEX
Sector Weight 2009-10 2010-11 2011-12 2012-13 2013-14 Apr-Oct
13-14
Apr-Oct
14-15
Coal 4.379 140.0 139.7 141.5 148.1 149.3 131.2 142.4
Crude Oil 5.216 99.1 111.0 112.1 111.4 111.2 111.1 110.1 Natural Gas 1.708 149.5 164.4 149.7 128.1 111.5 112.3 106.0
Refinery Products
5.939 125.9 129.7 133.7 172.5 175.1 175.3 172.4
Fertilizers 1.254 103.4 103.4 103.8 100.2 101.8 101.4 100.3 Steel 6.684 139.3 157.7 174.0 181.1 196.5 195.5 200.0
Cement 2.406 157.1 164.2 175.2 188.7 194.3 187.9 203.1 Electricity 10.31
6
130.8 138.1 149.3 155.3 164.3 163.9 181.1
Overall Index 37.903
129.9 138.4 145.3 154.7 160.1 157.3 164.2
GROWTH RATE (in %)
Sector Weight 2009-10 2010-11 2011-12 2012-13 2013-14 Apr-Oct 13-14
Apr-Oct 14-15
Coal 4.379 8.1 -0.2 1.3 4.6 0.8 1.3 8.5 Crude Oil 5.216 0.5 11.9 1.0 -0.6 -0.2 -1.2 -0.9
Natural Gas 1.708 44.6 10.0 -8.9 -14.5 -13.0 -16.1 -5.6 Refinery
Products 5.939 -0.4 3.0 3.1 29.0# 1.6 3.5 -1.7
Fertilizers 1.254 12.7 0.0 0.4 -3.4 1.5 2.7 -1.1
Steel 6.684 6.0 13.2 10.3 4.1 8.5 11.9 2.3 Cement 2.406 10.5 4.5 6.7 7.7 3.0 4.0 8.1
Electricity 10.316
6.2 5.6 8.1 4.0 5.8 5.1 10.5
Overall Index 37.903
6.6 6.6 5.0 6.5 3.5 4.2 4.3
#Refinery Products’ yearly growth rates of 2012-13 are not comparable with other years on account of
inclusion of RIL (SEZ) production data since April, 2012.

Performance of Eight Core Industries
Monthly Index & Growth Rate
Base Year: 2004-05=100
(Weight in IIP: 37.90 %)
Sector Coal Crude
Oil
Natural
Gas
Refinery
Products
Fertilizers Steel Cement Electricity Overall
Index Weight 4.379 5.216 1.708 5.939 1.254 6.684 2.406 10.316 37.903
Oct-13 -3.5 -0.6 -13.5 -5 4.1 5.8 0.9 1.3 -0.1
Nov-13 2.3 1.1 -11.3 -5 0.6 3.9 4.2 5.9 1.7
Dec-13 -0.6 1.6 -9.9 -1.7 4.1 3.1 1.1 6.7 2.1
Jan-14 -0.7 3 -5.2 -4.5 1.2 3.4 1.5 5.7 1.6
Feb-14 0.1 1.9 -4.4 3.2 -0.7 4.8 2.3 10.4 4.5
Mar-14 0.7 -1.6 -9.3 2.8 -6.1 5.4 0 5.4 2.5
Apr-14 3.3 -0.1 -7.7 -2.2 11.1 3.1 6.7 11.2 4.2
May-14
5.5 -0.3 -2.2 -2.3 17.6 -2 8.7 6.3 2.3
Jun-14 8.1 0.1 -1.7 1.2 -1 4.2 13.6 15.7 7.3
Jul-14 6.2 -1 -9 -5.5 -4.2 -3.4 16.5 11.2 2.7
Aug-14 13.4 -4.9 -8.3 -4.3 -4.3 9.1 10.3 12.6 5.8 Sep-14 7.2 -1.1 -6.2 -2.5 -11.6 4 3.2 3.8 1.9
Oct-14 16.2 1 -4.2 4.2 -7 2.3 -1 13.2 6.3
Sector Coal Crude Oil
Natural Gas
Refinery Products
Fertilizers Steel Cement Electricity Overall Index
Weight 4.379 5.216 1.708 5.939 1.254 6.684 2.406 10.316 37.903
Oct-13 136.1 112.5 112 173.1 113 185.6 187.9 162.5 156
Nov-13 150.5 110.9 109.3 168.1 107.4 182.5 172 157.8 153.5
Dec-13 170.1 115 113.4 175.9 110.2 199 203.3 168.1 165.6
Jan-14 178.7 115.1 116.1 176.9 104.2 201.2 215 169.8 168.2
Feb-14 165.1 103.5 104.2 169.6 97.9 192.5 200.2 155.1 156.7 Mar-14 208.3 112.1 108.8 183.8 92.1 214.2 226.2 172.9 175.4
Apr-14 140.5 109.6 104.7 165.8 87.4 192.8 217.5 176.9 160.9
May-14
145.2 111.6 111.2 171.6 100.5 214.3 216.4 183.2 168.7
Jun-14 139.2 110.4 109.4 173.3 99.5 196.1 209.7 181.5 163.9
Jul-14 134.9 111.1 103.5 170.8 102.5 200.4 206.9 182.8 163.9
Aug-14 138.6 106.8 103.1 175.1 105.7 209.3 187.7 183.6 165.1 Sep-14 140.1 107.5 102.6 169.7 101.1 197.4 198 175.3 160.6
Oct-14 158.2 113.6 107.2 180.5 105.1 189.8 185.9 184.1 165.9

Index of Eight Core Industries (Base: 2004-05=100), September, 2014
The summary of the Index of Eight Core Industries (base: 2004-05) is given at the Annexure. Dated : 31-
October, 2014 17:00 IST
The Eight Core Industries comprise nearly 38% of the weight of items included in the Index of Industrial
Production (IIP). The combined Index of Eight Core Industries stands at 160.6 in September, 2014, which
was 1.9 % higher compared to the index of September, 2013. Its cumulative growth during April to
September, 2014-15 was 4.0 %.
Coal
Coal production (weight: 4.38 %) increased by 7.2 % in September, 2014 over September, 2013. Its
cumulative index during April to September, 2014-15 increased by 7.2 % over corresponding period of
previous year.
Crude Oil
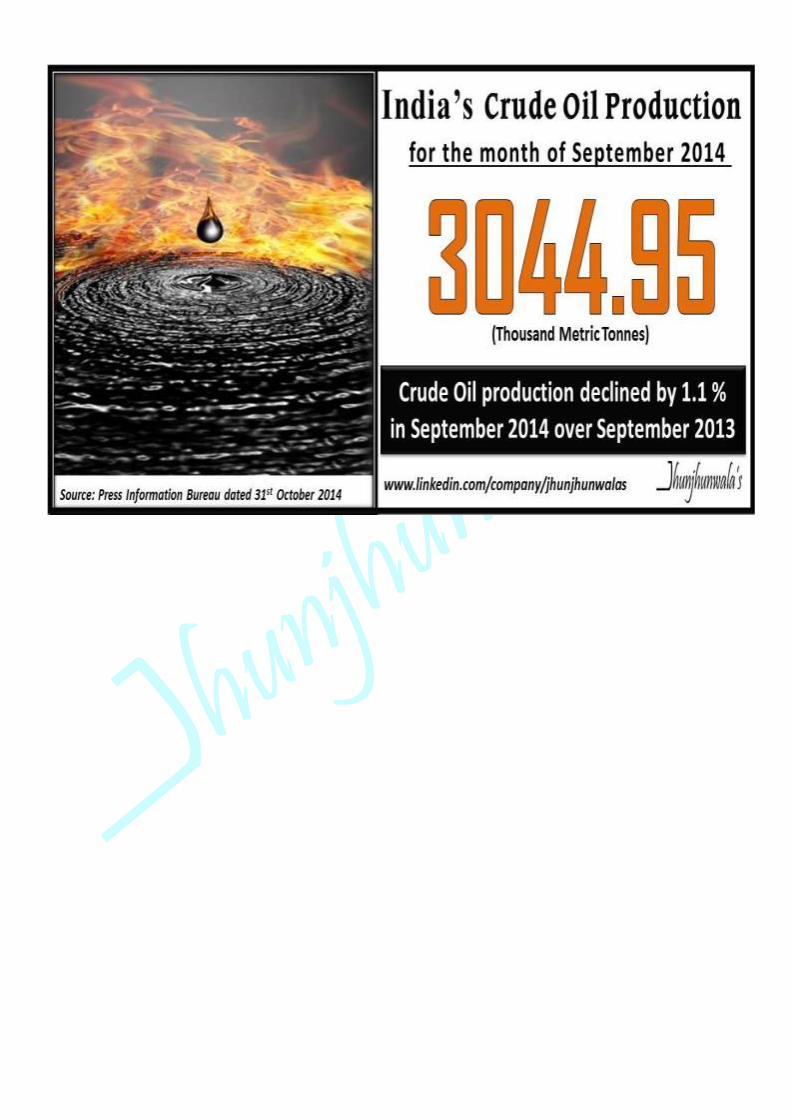
Crude Oil production (weight: 5.22 %) declined by 1.1 % in September, 2014 over September, 2013. The
cumulative index of Crude Oil during April to September, 2014-15 declined by 1.2 % over the corresponding
period of previous year.
Natural Gas
The Natural Gas production (weight: 1.71 %) declined by 6.2 % in September, 2014 over September, 2013. Its
cumulative index during April to September, 2014-15 declined by 5.9 % over the corresponding period of
previous year.
Petroleum Refinery Products (0.93% of Crude Throughput)[1]
Petroleum refinery production (weight: 5.94%) declined by 2.5 % in September, 2014 over September, 2013.
Its cumulative index during April to September, 2014-15 declined by 2.6 % over the corresponding period of previous year.
Fertilizers
Fertilizer production (weight: 1.25%) declined by 11.6 % in September, 2014 over September, 2013. While, it
registered no growth during April to September, 2014-15 over the corresponding period of previous year.
Steel (Alloy + Non-Alloy)
Steel production (weight: 6.68%) increased by 4.0 % in September, 2014 over September, 2013. Its
cumulative index during April to September, 2014-15 increased by 2.3 % over the corresponding period of
previous year.
Cement
Cement production (weight: 2.41%) increased by 3.2 % in September, 2014 over September, 2013. Its
cumulative growth during April to September, 2014-15 was 9.7 % over the corresponding period of previous year.

Electricity
Electricity generation (weight: 10.32%) increased by 3.8 % in September, 2014 over the period of September,
2013 and it registered a cumulative growth of 10.0 % during April to September, 2014-15 over the corresponding period of previous year.
Note: Data are provisional. Revision has been made based on revised data obtained for corresponding month of previous year in respect of Coal, Crude Oil, Natural Gas, Refinery Product, Steel and Electricity.
The summary of the Index of Eight Core Industries (base: 2004-05) is given at the Annexure. Date : 30th
August 2014
The Eight Core Industries comprise nearly 38% of the weight of items included in the Index of Industrial
Production (IIP). The combined Index of Eight Core Industries stands at 165.1 in August, 2014, which was 5.8
% higher compared to the index of August, 2013. Its cumulative growth during April to August, 2014-15 was 4.4 %.
1. Coal
Coal production (weight: 4.38 %) increased by 13.4 % in August, 2014 over August, 2013. Its cumulative index during April to August, 2014-15 increased by 7.2 % over corresponding period of previous year.
2. Crude Oil
Crude Oil production (weight: 5.22 %) declined by 4.9 % in August, 2014 over August, 2013. The cumulative
index of Crude Oil during April to August, 2014-15 declined by 1.2 % over the corresponding period of previous year.
3. Natural Gas
The Natural Gas production (weight: 1.71 %) declined by 8.3 % in August, 2014 over August, 2013. Its
cumulative index during April to August, 2014-15 declined by 5.8 % over the corresponding period of
previous year.
4. Petroleum Refinery Products (0.93% of Crude Throughput)
Petroleum refinery production (weight: 5.94%) declined by 4.3 % in August, 2014 over August, 2013. Its
cumulative index during April to August, 2014-15 declined by 2.7 % over the corresponding period of
previous year.
5. Fertilizers
Fertilizer production (weight: 1.25%) declined by 4.3 % in August, 2014 over August, 2013. While, it
registered a cumulative growth of 2.8 % during April to August, 2014-15 over the corresponding period of
previous year.
6. Steel (Alloy + Non-Alloy)
Steel production (weight: 6.68%) increased by 9.1 % in August, 2014 over August, 2013. Its cumulative index
during April to August, 2014-15 increased by 2.0 % over the corresponding period of previous year.
7. Cement
Cement production (weight: 2.41%) increased by 10.3 % in August, 2014 over August, 2013. Its cumulative
growth during April to August, 2014-15 was 11.0 % over the corresponding period of previous year.
8. Electricity
Electricity generation (weight: 10.32%) increased by 12.6 % in August, 2014 over the period of August, 2013
and it registered a cumulative growth of 11.3 % during April to August, 2014-15 over the corresponding
period of previous year.


