68
Moving the debate forward The Policy Paper Series • Number 9 • January 2009 India: The Impact of Mobile Phones
Moving the debate forward The Policy Paper Series • Number 9 • January 2009
India: The Impact
of Mobile Phones
b
India: The Impact of Mobile Phones Moving the debate forward • The Policy Paper Series • Number 9 • January 2009
This study on India is part of the Vodafone Public Policy series launched in 2004. Our aim is to provide a platform for leading experts to write on issues that are important to us at Vodafone and which may help policy makers as they strive to provide a regulatory environment which stimulates growth and economic development.
We hope you find this report informative.
Vittorio Colao, Chief Executive, Vodafone Group
ForewordIn this report, we have returned to the important subject of the economic impact of telecommunications on emerging markets by undertaking research looking in detail at India. As in the other reports in the Vodafone Public Policy Series, we have asked leading researchers to conduct the analysis. We are delighted that a team led by Dr. Rajat Kathuria of the Indian Council for Research on International Economic Relations (ICRIER), one of India’s foremost independent research institutes, was able to direct and conduct this work.
The opinions expressed in this document are not ours but those of independent experts whose views we respect even if we do not always agree with them. We believe that they have important things to say that should be of interest to anyone concerned with good public policy, and the policies towards economic and social development of India and other emerging markets.
Neil Gough, Director, Public Policy-Emerging Markets, Vodafone Group Diane Coyle, OBE, Enlightenment Economics and chair of Vodafone SIM Panel
Welcome
This paper can be seen online at www.vodafone.com/publicpolicyseries
Published by Vodafone Group Plc Copyright © 2009 Vodafone Group Plc ISBN 978-0-9552578-5-8
Contents Page
Welcome 00 – Vittorio Colao, Chief Executive, Vodafone Group
Foreword 00 – Neil Gough and Diane Coyle
A policy overview 01 – Dr. Rajiv Kumar
An econometric analysis of the impact of mobile 05 – Professor Rajat Kathuria, Dr. Mahesh Uppal and Mamta
The impact of mobiles on agricultural productivity 21 – Sanjay Gandhi, Dr. Surabhi Mittal and Gaurav Tripathi
A survey of usage of mobile in poor urban areas 34 – Professor Ankur Sarin and Professor Rekha Jain
The impact of mobiles in the SME sector 51 – Dr. Mahesh Uppal and Professor Rajat Kathuria
1
India: The Impact of Mobile PhonesMoving the debate forward • The Policy Paper Series • Number 9 • January 2009
A policy overviewAmidst the spreading gloom of the economic downturn following the global financial meltdown, the Indian telecom sector provides the proverbial silver lining. The growth in mobile connections has continued at around 10 million a month and investment prospects remain bullish. It is important at this stage to ensure that investor confidence is maintained by further improving the regulatory environment and ensuring that the policy regime promotes growth. In this context, I am delighted that a team of eminent researchers led by Professor Rajat Kathuria of ICRIER undertook to examine the social and economic impacts of mobile telephony in India, with a view to improving the knowledge content for policy-making in this important sector. The project team has analysed what we consider to be an extremely important and relevant topic today. This project is a good example of ICRIER’s strategy of carrying out research which generates analytical and empirical results relevant for generating analytical and empirical inputs pushing forward the reform agenda and for contributing to policy formulation in the country.
We believe the analysis and results reported here to be very important for the Indian economy. There is a growing body of careful empirical economic research which provides a compelling picture of the positive impact of mobile telecommunications on economic growth in developing economies. During the past few years this research has built a detailed understanding of the importance of telecommunications infrastructure to economic development. The unique contribution of this report, which makes it of special interest to policy makers, is that it looks at impacts within a single country, potentially delivering much more robust conclusions.
India has more diversity within its borders than any other country – it comprises 1.1 billion people, living and working in very different circumstances and geographies. Yet it has a national government and policy environment that sets critical economic policies (including telecommunications)
across the whole country. We have taken advantage of that diversity and the availability of state level data to investigate economic impacts within India across states, economic sectors and population segments. Furthermore, because even state level data can mask great differences, we have looked at specific economic sectors (agriculture and small and medium enterprises) and segments of the population (urban slum dwellers) to extend our understanding.
Encouragingly, the econometric analysis reported here extends the conclusion that there is a causal relationship within the same country between higher mobile penetration (mobile subscriptions/population) in a region and higher economic growth. Indian states with high mobile penetration can be expected to grow faster than those states with lower mobile penetration rates, by 1.2% points a year more on average for every 10% increase in the penetration rate. This is an important result. The paper in this report by Kathuria and Uppal suggests, furthermore, that there are important network effects which magnify the economic impact of mobiles on development when the level of mobile penetration exceeds a critical mass of around 25%. This finding underlines the urgency of increasing teledensity across all states and especially in those numerous areas of India that are yet to reach this threshold level.
The extraordinary recent macro-economic performance of the Indian economy has also raised the question of how the benefits of the 8–10% annual GDP growth rate can ‘trickle down’ to poorer socio-economic groups in the country. In that context, the ICRIER researchers have also looked at three segments of the population – the agriculture sector, the Small and Medium Enterprise (SME) sector and urban slum dwellers. In each case, the research demonstrates that access to telecommunications is an important catalyst to realizing productivity and efficiency improvements and thereby making it possible for the benefits of economic growth to be shared. Mobiles currently provide more than 300 million
Rajiv Kumar is the Director and Chief Executive of the Indian Council for Research on International Economic Relations (ICRIER), and a member of the Telecom Regulatory Authority of India since January 2007.
Director and Chief Executive ICRIERDr. Rajiv Kumar

2
India: The Impact of Mobile Phones Moving the debate forward • The Policy Paper Series • Number 9 • January 2009
points of connectivity in India, through which information and opportunity flows. Citizens with access to telecommunications can tap into the benefits of broad economic and social growth much more easily than those who are unconnected.
This result is all the more important for two reasons, one internal and one external. The first is that India is at a stage in its development when there is a large-scale movement of the population from the countryside to the towns, posing new challenges for both rural and urban economies. The second is that the global economic environment has become harsher, and it will be essential to take advantages of all possible opportunities to sustain growth.
Of course, access to mobile telecommunications is certainly not the only thing that matters to economic growth. In this regard, the research also highlights the vital importance of complementary skills and other infrastructure. Unless these are in place, the full potential of better access to telecommunications will not be realised. There is no benefit in farmers knowing the prices that their produce could be sold for in different markets if the roads are too poor for them to be able to transport the goods to those other markets. The research in this report on the uses and impacts of mobiles in agriculture by Gandhi, Mittal and Tripathi show that improving productivity and rural incomes requires an array of enablers in the production cycle, which runs from planting to the final sale of produce; access to information is an important enabler.
Equally, the value in mobiles offering SMEs the potential to introduce different business models which would deliver greater efficiency is only fully realised when the entrepreneurs and their workforce have the basic literacy skills to use the technology appropriately. The case studies of entrepreneurs using mobiles presented in the paper here by Uppal and Kathuria demonstrate not only the potential for improved productivity, incomes and employment (especially for sole traders and very small businesses seeking to improve their livelihoods), but also the barriers to the realisation of that potential – importantly, education and also (in rural areas) teledensity. Telecommunications cannot be seen in isolation from other parts of the development process.
In the urban slums mobile use is associated with relatively high earning households and educational levels. The survey work of Sarin and Jain reported here also reveals that higher household incomes are associated with those families who have enjoyed the benefits of access to mobile communications for the longest period. Importantly, the research shows that those urban slum dwellers who have access to mobiles inhabit an economic and social environment where connectivity is the norm. The research reveals the importance of these network effects, that is the increased value of mobiles if many others in the social and economic milieu are also users of mobiles.
While some parts of India are clearly enjoying the benefits of new-found access to telecommunications, other parts are still lagging behind. The recent extraordinary growth in telecommunication connections in India, which has topped 10 million per month in 2008, has understandably grabbed the headlines. However, other realities are being obscured such as:
• Teledensity in India lags well behind most other countries at similar stages of development (for example, China, Pakistan and Sri Lanka have achieved significantly superior penetration rates of 77%, 60% and 61% respectively).
• There is enormous variation within India, and many of the less developed states have average penetration rates of well below 20%, including Bihar, UP, Orissa, Madhya Pradesh and Assam.
• The level of access to the internet remains persistently low across the whole country (at about 5%) and in less-developed states is virtually non-existent – only 0.1% in Bihar and 0.2% in Assam, for example.
In a world where other countries are increasingly taking advantage of the opportunities being created by telecommunications and other technologies, this is not a comfortable position for India. India needs to catch up with its major trading competitors such as China, Korea and Indonesia if it is truly to join the ranks of emerging economies that have made or are making the transactions to middle income level economies. Other countries enjoying higher penetration telephony and internet access are driving innovation and more sustainable economic growth. India cannot challenge or match the innovation capability of its competitors or meet its indigenous demand for skills and knowledge content if only 5% of the population regularly uses the internet.
What then are the implications for Indian policy makers and telecommunications operators? What are the key elements of a forward looking telecommunications policy agenda that will keep India moving forward at the rate required?
The report clearly shows how putting a mobile in the hands of an individual is unlikely by itself to improve that person’s livelihood. But when it is associated with education on agricultural techniques and tools, as well as with better roads and storage, easier access to information through telephony can become very valuable.
Perhaps it is obvious that there also needs to be investment in other, complementary, infrastructure, but the impact of this interaction between telecommunications and other infrastructure in a developing country may have previously been underestimated. Poverty ultimately needs to be alleviated by improved labour productivity. Mobile telephony has an important role to play because it provides a means for the exchange of information and learning, but it is only one element in the process of productivity growth. For example, 60% of the working population in India is engaged in agriculture and the barriers to raising agricultural productivity gains go far beyond communications access.
Therefore, access to telecommunications needs to be seen as a foundation on which other initiatives can be built. The debate on telecommunications needs to be expanded from a debate only about access, to a broader vision of how individuals can leverage the capabilities of telecommunications to grasp fully the opportunities of economic development.
The current Indian regulatory environment has stimulated investment in the mobile sector to an unprecedented level. However, India is now sprinting at a time when other countries

3
India: The Impact of Mobile PhonesMoving the debate forward • The Policy Paper Series • Number 9 • January 2009
are already well ahead. Those other countries, such as China and South Korea are shifting their attention from simple tele-density targets to the priorities of ensuring access to high-speed data networks and broadband. It is likely that India’s greatest policy challenges still lay ahead – increasing access to telecommunications for underserved citizens and then also extending that access to the internet.
In this context, what are the implications for Indian policy makers and telecommunications operators? The research points to three areas which seem to be of particular importance. The first is spectrum policy, the second area concerns fees and universal service and the third is about the general investment environment.
Spectrum policy
Spectrum policy is the most obvious. India is burdened with severe spectrum constraints. Minutes per subscriber are higher in India than in almost any other country and cities in India have some of the most densely populated areas. Both these factors increase the need for spectrum, yet Indian operators are struggling with average spectrum allocations only a third of those available to most operators in other countries.
Spectrum is a fundamental driver of cost in mobile networks – the less spectrum, the more sites are needed, and the cost of deployment rises accordingly. This scarcity situation in 2G (GSM) is likely to be replicated in 3G. It causes Indian operators to have to invest more capital building capacity in urban areas in order to overcome spectrum constraints and preserve service quality, but thereby limiting capital available for the expansion of coverage into rural areas or to lower income urban agglomerations.
The civilian spectrum shortage is created by two factors: the occupation of critical frequencies by the military and other government departments; and a policy bias towards a large number of operators. Many commentators argue that fewer operators would achieve greater economies of scale, while still preserving the benefits of vigorous competition.
All over the world and across industries, it is amply demonstrated that a market structure with relatively few players but robust regulatory oversight can be more competitive than one populated by a large number of small players. In fact market fragmentation has the disadvantage of none of the players having enough capacity and resources for innovation and delivering greater value to the customer. There is also the danger of a single large firm emerging as a virtual monopoly in such markets, and drawing monopoly rents. The government would have to weigh these factors against its apparent objectives of maximising resources.
A government initiative whereby additional spectrum is made available to the industry has yet to deliver results. As a consequence, the Indian telecommunications industry is being starved of spectrum and the private sector is being drained of capital.
The losers from this spectrum constraint are the people who are consequently being denied access to
telecommunications services. They are losing out because licensees are diverting investments to maintain quality of service in urban areas. A comprehensive review of the overall national benefit of current policy on spectrum allocation is urgently required. Are there more efficient alternatives for the military and public sector which would free spectrum for private use while not adversely affecting the military’s ability to protect India’s national interests? This should include an estimate of the cost to the nation of the spectrum that is currently being used by the military. Greater transparency in this regard would be most desirable.
The most serious problem facing India surrounds data services. India’s current position, by international standards, is lagging, and we cannot afford any complacency. The rest of the world is increasingly concerned about increasing access to high speed data rather than voice connectivity. High-speed data services and the internet are seen as a critical capability that will drive future global competitiveness in technology and services.
For India, and the rest of the developing world, data services will be delivered by wireless broadband access rather than fixed line copper or fibre networks. But the vision in India is likely to be limited by the reality of insufficient spectrum availability. The first 3G spectrum auction scheduled for January 2009 is to be welcomed but the incremental capacity for each operator is most likely to be consumed by voice capacity as a result of the deficiencies of 2G spectrum allocation. The delivery of world-class data services requires very large blocks of spectrum. A major strategic plan for data services is urgently required to plan the availability of sufficient spectrum.
Licence, spectrum fees and USO
Policy-makers must address the access deficit of the disadvantaged segments of the population. This does not simply equate to the rural population. The paper in this study by Sarin and Jain reminds us how marginalized the urban poor are but also demonstrates how access to telecommunications can offer a route to increased incomes. Tackling the access gap must include the urban poor as well as those living in rural communities. There has been a natural focus in the past on the rural poor given the proportion of India’s population which lives in rural areas, but India is becoming increasingly and dramatically urbanized. At present over 320 million people live in urban areas, and the number is expected to increase to a staggering 575 million by 2020.
The private sector has done much to invest in telecommunications provision for both the urban and rural poor, and private operators continue to invest at ever-increasing levels. However, in the context of the economic dividend from the sector, some aspects of policy must be re-evaluated.
The industry labours under ongoing heavy spectrum charges and licence fees that are likely to be counter-productive to the broader national interests. Yet the prevailing policy mood seems to be to increase them, not reduce them. Even the most minor operator in a less economically developed state will pay a

4
India: The Impact of Mobile Phones Moving the debate forward • The Policy Paper Series • Number 9 • January 2009
minimum of 8% of revenue (before any cost deductions) in respect of combined licence and spectrum fees. How can any licence fee or spectrum fee be justified in areas like these? India needs to find ways to accelerate investment in areas which have low teledensity; licence and spectrum fees levied from users drain resources from operators in those areas and inhibit investment. The recent policy towards reductions in licence fees when a licensee attains coverage targets is a welcome move in the right direction. However, the overall policy towards fees should be re-evaluated in the context of these economic results.
There are significant questions too about the nature of the universal service policy. The coffers of India’s USO fund continue to grow. The funds are being collected, but they are not being spent for their intended purpose of increasing teledensity. This problem is not unique to India but at the moment the USO is effectively an additional tax on the sector, driving up prices of services and effectively dis-enfranchising those the policy is targeted towards. The hard question has to be asked about the most effective means of increasing access – is it though the intensification of competition and the reduction of prices through the removal of government imposed levies and taxes, or through the (unspent) universal service fund?
In the absence of plans for productive use of the accumulated fund, the USO charges should be reviewed. A reduction would improve investment incentives and increase the resources the sector has available for investment, at a time when funding for investment is difficult.
Overall investment environment
At the highest strategic level, Indian policy makers also need to assess whether their approach is consistent with the potential economic value of the sector.
India has chosen a policy of creating a highly competitive, fragmented industry, which has delivered extraordinarily low prices and high minutes of use per subscriber. However, these low prices are only currently enjoyed by about 25–30% of the Indian population – the rest do not have a mobile phone. The real question is to whether the same model will eventually deliver universal access to telecommunications and most importantly access to high-quality data services.
India needs to set out a stable policy framework to attract long-term investment in telecommunications. That requires a stable licensing structure, consistent policy decisions and a predictable framework for regulatory intervention. The history of Indian telecommunications has been one of frequent shifts in policies, regulations and taxation that create uncertainty for investors.
A stable and attractive policy approach is especially important in the context of the current global credit crunch and with capital so scarce. Policies are needed which will attract long-term investors who will make the commitments and investments required to create world-class telecommunications networks and services that will deliver global competitiveness for all the citizens of India.
Therefore this is the time for the government to be assessing fundamental policy issues that impact sector investment, such as foreign direct investment caps, licence extension terms, spectrum availability and allocations, and criteria for mergers and acquisitions. All these issues affect the economics of additional capital investment. There is a need to determine what sort of industry India needs and set the policy framework accordingly.
Conclusion
We believe that these findings from a detailed study of one country carry lessons not only for India but also for other countries facing similar challenges in terms of agricultural productivity, small business growth, and rural and urban poverty. Weaknesses in education and other physical infrastructure need to be tackled to maximise the potential productivity and growth benefits of access to mobile communications in many other countries apart from India. A systematic, integrated set of development policies is required to address this.
We hope that this report will provide some impetus to a policy debate about the priorities and the needs of the telecommunications sector. Its recent track record in India is sufficiently promising that there might not seem to be a pressing need to refresh the policy environment for telecommunications, or to develop a wider vision for the sector. But we believe that such a policy shift will be required to sustain the progress towards the truly world-class telecommunications services that India and its citizens deserve. This will underpin India’s competitiveness in the volatile global marketplace, and ensure that the benefits of growth are more widely shared as the economy develops. The debate needs to start today.
We hope that the following papers will not only stimulate that debate but that they will also be of interest to you.

5
India: The Impact of Mobile PhonesMoving the debate forward • The Policy Paper Series • Number 9 • January 2009
Director, Com First (India) Private Ltd
Dr. Mahesh Uppal
Professor of Economics, ICRIER Professor, IMI
Prof. Rajat Kathuria
Rajat Kathuria is Professor of Economics at ICRIER, and is also a professor at the International Management Institute (IMI), New Delhi.
Researcher, ICRIER
Mamta
An econometric analysis of the impact of mobile
Dr. Mahesh Uppal is the Director of Com First (India) Private Ltd, a consultancy specializing in policy, regulation, and strategy.
Mamta is a researcher at the Indian Council for Research on International Economic Relations (ICRIER).
1. Summary
During the past two decades, India has moved away from its former ‘command and control’ policies to become a market-based economy. This process started in the mid-1980s and gathered substantial momentum at the beginning of the 1990s. The process of reform has continued in this decade with a further opening of the economy and the creation of regulatory institutions to oversee the march towards fully competitive markets. As a result of the liberalisation, GDP per capita has been rising by 7% annually, a rate that leads to its doubling in a decade. This contrasts with annual growth of GDP per capita of just 1% in the three decades from 1950 to 1980. Rapid growth turned India into the third largest
economy in the world in 2006 (after the United States and China and just ahead of Japan when measured at purchasing power parities), accounting for nearly 7% of world GDP.1
Although India’s growth rate has been among the highest in the world, it remains a low income country. With a per capita income of US$950 in 2007, India ranks 122nd.2 As well as a low average income, there are substantial disparities in economic performance between states. The average per capita Gross State Domestic Product (GSDP) of Delhi, the richest state, is five times that of Bihar, the poorest. There is a broad consensus amongst policy makers that growth needs to become more inclusive by increasing the prosperity of poorer states, whose economies have expanded at a slower pace than those of the richer states in the past decade.

6
India: The Impact of Mobile Phones Moving the debate forward • The Policy Paper Series • Number 9 • January 2009
Previous research suggests that the differences in economic performance across states are associated with the extent to which they have introduced market-oriented reforms, alongside measures to improve infrastructure, education and basic services.3
The physical infrastructure (or lack thereof) is widely acknowledged to be one of the crucial impediments to achieving higher and more inclusive economic growth in India. The lack of adequate infrastructure is particularly acute in rural areas, home to 70% of India’s population and the 52% of the work force that is primarily engaged in agriculture and related activities.4 Agriculture in India accounts for 18% of national income, implying extremely low agricultural productivity. The resulting migration of excess farm labour to urban areas in search of jobs is straining urban infrastructure and increasing the population living in city slums. India’s urban population is expected to double over the next two decades, to 575 million.
Any strategy that seeks to address the problem of inclusive growth will therefore have to contend with these harsh realities of low productivity in the countryside, a massive movement of people to the cities, and extensive poverty in both rural and urban areas. Past policies have not had much success, often being defeated by the magnitude of the problem as well as weaknesses in implementation. But the message is clear. Rural productivity needs to increase both as part of the development process and to raise incomes for millions of Indians who live below the poverty line, in the countryside and the cities.
A sustainably faster rate of growth can only be achieved by improving productivity, but underinvestment in infrastructure is an important barrier. India plans roughly to double investment in infrastructure, to $500 billion over the next five years, or about 8% of GDP each year. The Planning Commission maintains that the growth target of the Eleventh Plan (2007–12) is achievable only if the ‘infrastructure deficit can be overcome and adequate investment takes place to support higher growth’.5 The government expects private investors to contribute two-fifths of the total investment in infrastructure, not only to expand capacity but also to improve the quality of service.
The telecommunications sector has had the most success in attracting private investment and is often held up as an example for other infrastructure sectors.6 Two familiar reasons for this status are worth repeating. First, India’s teledensity has shown extraordinary growth since private participation in the sector was introduced, rising from less than 1% in 1998 to over 30% today. Secondly, several research studies have found that the telecommunications infrastructure is one of the significant factors in economic growth, alongside others such as overall investment, education, energy and transportation networks.7
The change in India’s telecoms landscape has been dramatic. In 1994, the year the National Telecom Policy was drafted, fewer than 1 in 100 Indians owned a phone. Public sector executives working for the incumbent monopoly were highly popular, given their ability to short circuit the endless waiting time for the privilege of owning a telephone. Less than 15
years on, teledensity has increased to more than 32% and subscriber numbers are growing at a rate of about 10 million per month. Ownership of a phone is no longer a function of who you know, but rather conforms to the conventional forces of demand and supply. Waiting lists are down and voice calls in India are amongst the cheapest in the world. The Government’s target of 250 million phones by the end of 2007 was reached, quite unexpectedly, ahead of schedule.8
One of our research aims was to extend earlier studies by analysing the growth impact of telecoms in India. While the telecoms-growth link has been explored across different countries and within a particular country over time, few studies have assessed the relationship at the sub-national level. India’s Federal structure, with some states such as Uttar Pradesh, Maharashtra, and Madhya Pradesh larger in geographical area and population than most European countries, readily lends itself to such analysis.9 Moreover, balanced regional development has always been an objective in India’s plans and therefore studying the impact of telecoms liberalisation across states will provide valuable insights for this policy aim.
The rapid spread of mobile telephony in India is the most obvious manifestation of the benefits of telecom sector liberalisation. Fixed line penetration is in fact showing signs of decline, and future growth will come from mobile. Given that about 10 million wireless subscribers are being added every month, the impact of telecoms on state-level growth rates can be explored through the impact of mobile telephony. This chapter accordingly attempts to answer three questions:
• What is the impact of mobile penetration on state growth rates;
• Do less-developed states show a greater impact of mobile penetration; and
• What are the links through which mobile telephony affects growth and what are the constraints, if any, which limit its impact?
The first two questions are addressed by employing ‘top-down’ econometric analysis using state level economic indicators, while the third question is addressed using ‘bottom-up’ evidence from surveys and other information.
The next section briefly reviews the existing literature on the impact of telecoms on growth. Section 3 assesses India’s regulatory and competitive landscape for telecoms and compares Indian mobile telephony indicators with those of some other countries. The descriptive statistics presented in this section underscore the phenomenal progress made by mobile in India, both when judged against past performance and when compared with other countries, but also show that India still lags other countries in important ways. Disparities in mobile penetration across states and between urban and rural areas are also examined. Section 4 presents and analyses the results of the econometric model and also draws upon survey based evidence to demonstrate the positive impact of mobiles on growth, the first such estimates to confirm the growth dividend of mobile for Indian states. A final section offers some conclusions.
7
India: The Impact of Mobile PhonesMoving the debate forward • The Policy Paper Series • Number 9 • January 2009
Our key conclusions are:
• Indian states with higher mobile penetration can be expected to grow faster, with a growth rate 1.2% points higher for every 10% increase in the mobile penetration rate. If Bihar were to enjoy the same mobile penetration rate as Punjab then, according to our results, it would enjoy a growth rate that is about 4% higher.
• There is evidence of a critical mass, around a penetration rate of 25%, beyond which the impact of mobile on growth is amplified by network effects. This means there is an important threshold for policy makers.
• As is borne out in many other studies, including this one, it is the level of telecoms penetration (not the growth) which contributes to economic growth. Past policy reforms have achieved rapid growth in mobile but India lags well behind most other countries at similar stages of development. There is enormous variation between states, between urban and rural areas, and between poor and rich households in the cities. Further reforms are needed to bridge these gaps. Effective competition, efficient spectrum management, and a market-based policy framework are the key regulatory levers.
2. The impact of telecommunications on economic growth
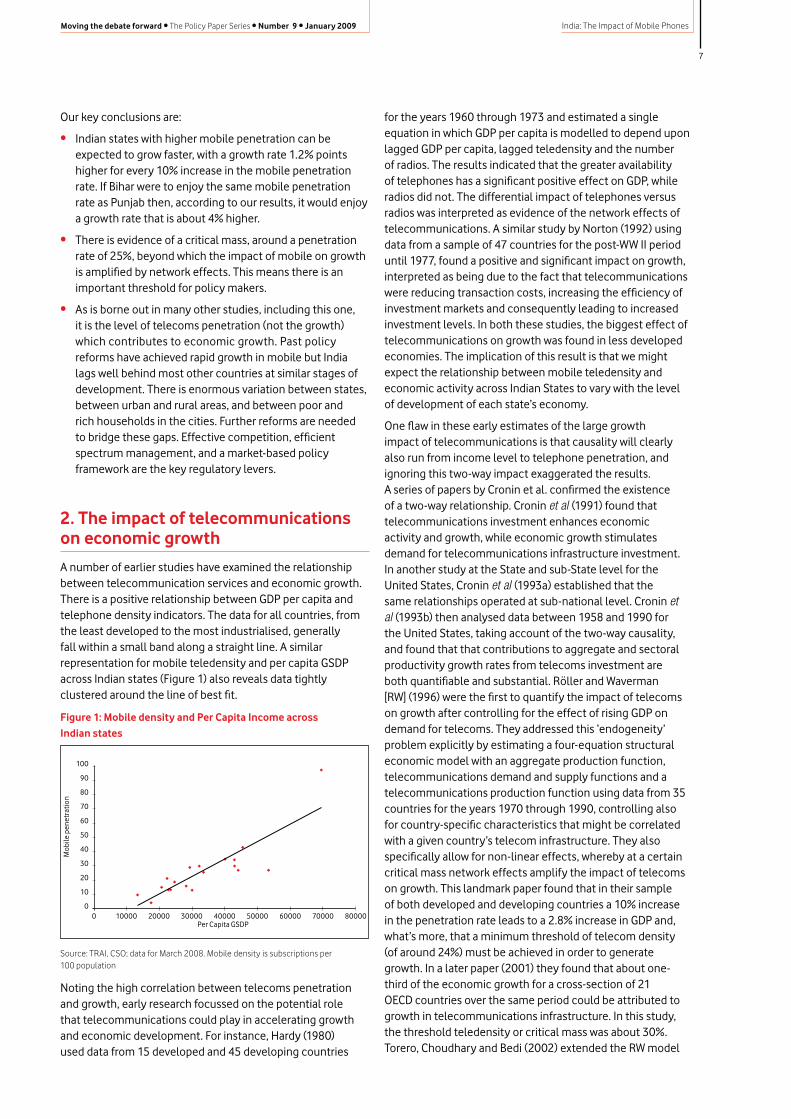
A number of earlier studies have examined the relationship between telecommunication services and economic growth. There is a positive relationship between GDP per capita and telephone density indicators. The data for all countries, from the least developed to the most industrialised, generally fall within a small band along a straight line. A similar representation for mobile teledensity and per capita GSDP across Indian states (Figure 1) also reveals data tightly clustered around the line of best fit.
Figure 1: Mobile density and Per Capita Income across Indian states
0
10
20
30
40
50
60
70
80
100
90
0 10000 20000 30000 40000 50000 60000 70000 80000Per Capita GSDP
Mob
ile p
enet
ratio
n
Source: TRAI, CSO; data for March 2008. Mobile density is subscriptions per 100 population
Noting the high correlation between telecoms penetration and growth, early research focussed on the potential role that telecommunications could play in accelerating growth and economic development. For instance, Hardy (1980) used data from 15 developed and 45 developing countries
for the years 1960 through 1973 and estimated a single equation in which GDP per capita is modelled to depend upon lagged GDP per capita, lagged teledensity and the number of radios. The results indicated that the greater availability of telephones has a significant positive effect on GDP, while radios did not. The differential impact of telephones versus radios was interpreted as evidence of the network effects of telecommunications. A similar study by Norton (1992) using data from a sample of 47 countries for the post-WW II period until 1977, found a positive and significant impact on growth, interpreted as being due to the fact that telecommunications were reducing transaction costs, increasing the efficiency of investment markets and consequently leading to increased investment levels. In both these studies, the biggest effect of telecommunications on growth was found in less developed economies. The implication of this result is that we might expect the relationship between mobile teledensity and economic activity across Indian States to vary with the level of development of each state’s economy.
One flaw in these early estimates of the large growth impact of telecommunications is that causality will clearly also run from income level to telephone penetration, and ignoring this two-way impact exaggerated the results. A series of papers by Cronin et al. confirmed the existence of a two-way relationship. Cronin et al (1991) found that telecommunications investment enhances economic activity and growth, while economic growth stimulates demand for telecommunications infrastructure investment. In another study at the State and sub-State level for the United States, Cronin et al (1993a) established that the same relationships operated at sub-national level. Cronin et al (1993b) then analysed data between 1958 and 1990 for the United States, taking account of the two-way causality, and found that that contributions to aggregate and sectoral productivity growth rates from telecoms investment are both quantifiable and substantial. Röller and Waverman [RW] (1996) were the first to quantify the impact of telecoms on growth after controlling for the effect of rising GDP on demand for telecoms. They addressed this ‘endogeneity’ problem explicitly by estimating a four-equation structural economic model with an aggregate production function, telecommunications demand and supply functions and a telecommunications production function using data from 35 countries for the years 1970 through 1990, controlling also for country-specific characteristics that might be correlated with a given country’s telecom infrastructure. They also specifically allow for non-linear effects, whereby at a certain critical mass network effects amplify the impact of telecoms on growth. This landmark paper found that in their sample of both developed and developing countries a 10% increase in the penetration rate leads to a 2.8% increase in GDP and, what’s more, that a minimum threshold of telecom density (of around 24%) must be achieved in order to generate growth. In a later paper (2001) they found that about one-third of the economic growth for a cross-section of 21 OECD countries over the same period could be attributed to growth in telecommunications infrastructure. In this study, the threshold teledensity or critical mass was about 30%. Torero, Choudhary and Bedi (2002) extended the RW model
8
India: The Impact of Mobile Phones Moving the debate forward • The Policy Paper Series • Number 9 • January 2009
to include mobile phones. They used data from 113 countries over a 20-year period and also found a positive causal link from telecommunications to GDP. The effect in their work appears to be non-linear and is particularly pronounced for countries with a telecom penetration rate in the range 5–15%.
The threshold at which the growth dividend of telecom begins to take effect varies across these studies. It does suggest, however, that increases in teledensity might not immediately generate higher growth effects in states with a particularly poorly developed telecoms infrastructure. The telecoms density in certain states is so low that marginal improvements might not generate the desired growth effects – not until the critical threshold for network effects is reached. Thus, laggard states may require substantial investments in telecommunications infrastructure before they can benefit from the growth-generating effects of these technologies. This is supported by our results, as described below.
It has recently become quite fashionable to adapt the RW framework for developing countries and particularly for estimating the growth dividend of mobile phones. Torero, Choudhary and Bedi (2002), Sridhar and Sridhar (2004) and Waverman, Meschi and Fuss (2005) are some examples. The growth dividend of investment in (fixed) telecommunications infrastructure in developed economies is now fairly well established. Since the growth of mobile phones in developing economies such as India, China, Brazil and others has been sensational; it raises the obvious question whether mobile phones in developing economies are playing the same role that fixed telephony played in the richer economies in the 1970s and 1980s. Mobile phones are often the only means of communication for a large number of people. For example, the most recent numbers available for India reveal that while fixed line penetration is roughly 3.5 per hundred and declining, the corresponding number for mobile stands at 28 per hundred, and growing. Because mobiles substitute for fixed lines in developing economies, their growth impact should be stronger in these than in developed economies, where mobiles complement the extensive fixed service. Waverman, Meschi and Fuss (2005) used data on 92 high and low income countries from 1980 to 2003, and found that mobile telephony has a positive and significant impact on economic growth, and indeed this impact could be twice as large in developing as compared to developed countries.
Mobile phones can perform in underserved areas and regions what fixed lines did in many other regions and countries over two decades ago: widen markets, create better information flows, lower transactions costs and substitute for costly (in time and money) physical transport. The value of a mobile phone can be particularly high because other forms of communication such as postal systems, roads and fixed line networks are often poor in developing countries. At the same time, in many developing countries growth has been low due to a host of other reasons – poor governance, lack of capital, low skill levels and many others. It is unlikely that increased mobile penetration by itself will be able to alleviate these other constraints on growth. This caution is supported by case studies. For instance Jensen (2007) states that ‘improvements in roads have lowered the cost of land transport, leading
to more arbitrage by wholesalers on land... In other cases, poor quality roads may limit the ability of improvements in information (i.e. mobile penetration) to enhance market performance since arbitrage remains prohibitively expensive’. The economic impact of mobile is likely to be strongest when the absence or inadequacy of existing telecommunications facilities acts as a barrier or bottleneck to private economic activities, but also when enough other infrastructure exists to permit the effective use of telecommunications.
There is no study that systematically investigates the growth impact of mobile phones at the sub-national level. India is ideally placed for such an analysis. First, there is wide variation in economic performance across Indian states. Secondly, mobile licences in India have been awarded for geographic areas which are, to a large extent, contiguous with state boundaries.10 The correspondence between a mobile telecom licence and a state boundary allows us to adapt the RW (2001) framework for Indian states. And finally, the explosive growth of mobile in India, especially in the last five years, should allow us to identify any impact on economic performance across states. We attempt to quantify that impact and explain differences, if any, across states.
Three caveats must be mentioned, however. First, mobile in India is relatively young (the first licensee rolled out services in 1995, and it was not until 2003 that the service became available in all Indian states) so there is little real trend as yet. Secondly, since mobiles are so new, there has been extremely rapid growth in mobile penetration starting from zero. There could thus be a tendency to overestimate the impact of mobile on growth, despite controlling for other growth-generating variables such as capital, labour and education. Thirdly, data at the state level for investment comparable to data at the national level obtainable from national accounts are simply not available. Likewise, employment data at the state level are not available. These data have been compiled from different sources described in the Annex. The data problems lead us to be cautious in our interpretation of the estimates reported here. Nevertheless, the results show that the growth dividend of mobile is substantial and policy makers will be well advised to harness its full potential.
3. Indian telecommunications across states
The critical element in the development of the Indian telecommunications infrastructure has been the explosive growth of mobile, which has benefited from a compelling technology and an increasingly liberal policy environment. It is a common sight to observe street vendors, rickshaw pullers and newspaper hawkers routinely talking on their mobile phones in cities. From being viewed as a luxury when it was first introduced, the mobile service is now used everyday by millions of Indians.
9
India: The Impact of Mobile PhonesMoving the debate forward • The Policy Paper Series • Number 9 • January 2009
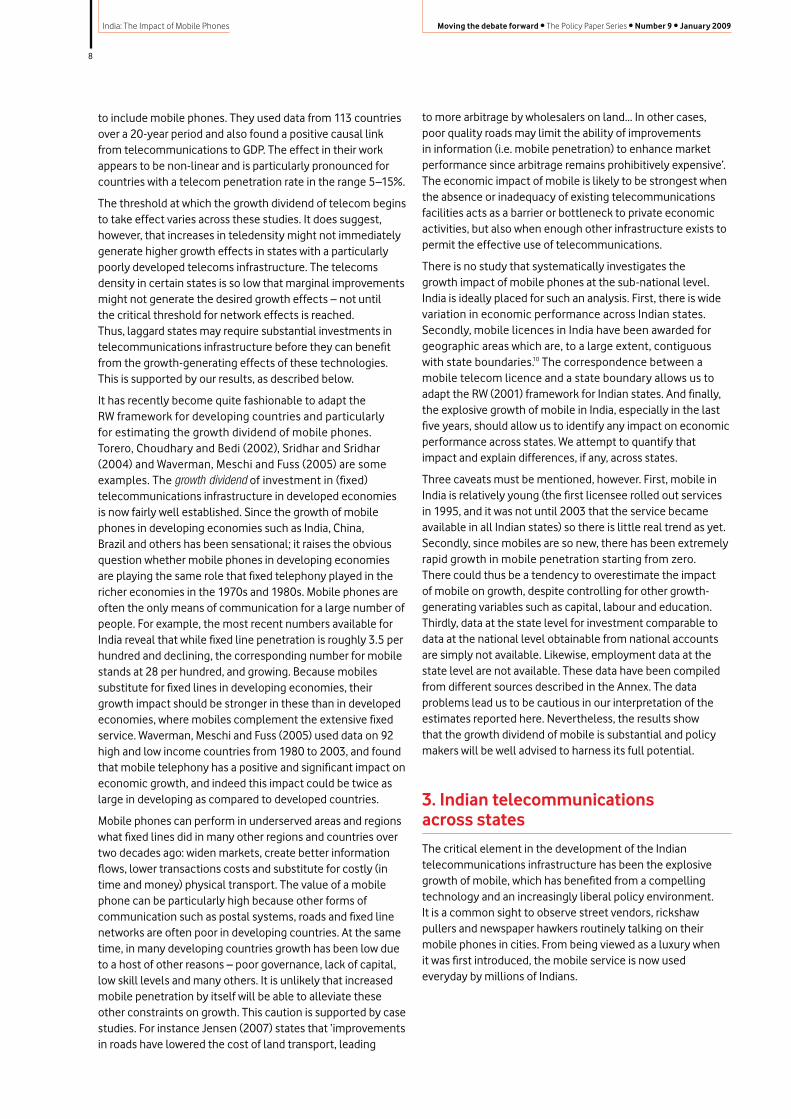
Figure 2: Growth of fixed and mobile subscriptions
Source: TRAI (NB a log growth rate which is constant implies an actual growth rate which is accelerating.)
Table 2: Internet and broadband targets in millions of subscribers (actual numbers in parentheses)
Year Internet Subscribers Broadband Subscribers
2005 6 (5.55) 3 (0.18)
2007 18 (42.5, including 32 9 (3.1) mobile internet users)
2010 40 20
Source: TRAI broadband recommendations
Two notable implications follow from these developments. One, hitherto unserved or under-served people will for the most part gain access through wireless technologies, whether the services are described as fixed, mobile, voice, or data. And secondly, given the importance of wireless to modern ICT infrastructures, it thus becomes crucial for the government to play a more effective role in managing scarce frequencies for optimal use. This is a point to which we return in the concluding section.
The triggers for the massive increase in mobile penetration have been many. Factors such as price, income and tastes have all been important determinants (this is explored more formally in the economic model set out below). There has been an enormous decline in prices. The effective price per minute for an outgoing mobile call has dropped from Rs. 15.30 in 1998 to Rs. 0.68 today. This 98% decline would be much higher in real terms. Another measure, the Average Revenue per User (ARPU), is around Rs. 250 per month, compared to about Rs. 1550 in 1998.14 At the current exchange rate that is roughly US$5 per month, representing about 5% of an average Indian’s monthly income. The launch of micro pre-paid and handsets priced at less than Rs.1,000 (US$20) have further reduced entry cost to the subscriber and extended demand. In addition, consumer financing of handsets, facilitated by declining interest rates, allows spreading the cost over manageable monthly instalments. Micro pre-paid allows recharge options for as low as Rs. 10 (US$0.20). Other features of pre-paid reducing subscribers’ entry costs include ‘lifetime validity’, full value recharge and special ‘on-net’ or ‘within network’ tariffs.15 Not surprisingly therefore, 95% of new subscriptions are pre-paid, lifting the total number of subscribers on pre-paid from 76% in 2007 to about 85% at the end of 2008. Income (measured by GDP per capita) has doubled since 1998, also contributing to demand.
The compound annual growth rate (CAGR) for mobile between 1999 and 2008 in India has been 83% while that of fixed lines has been just 7.5%, and the growth of mobile is accelerating, while the growth in the number of fixed lines is trending down. In fact, in the last three years, the number of fixed lines has decreased. In March 2008, mobiles accounted for 86% of all telephones in India, and by October 2008 this number had increased to 90%. Contrast this with the situation in 1999 when mobile constituted just 5% of all telephones. There are now over 325 million mobile users compared to about 38 million fixed users. Figure 2 shows the dramatic rise in the monthly addition to the mobile subscriber base. If the current trend continues, there will be over 540 million subscribers by the year 2010. This is truly remarkable, since no other ICT indicator comes close to mobile in penetration level or rate of growth. Fixed line, Internet and broadband penetration in India remain very low at 3%, 1% and 0.4%, respectively.
Table 1: All-India fixed, mobile, internet and broadband penetration rates
Mobile Fixed Internet Broadband Density Density Density Density
27 3 1 0.4
Author’s calculation based on TRAI data; number per 100 population for March 2008
Particularly striking is the paltry broadband penetration rate despite a low threshold speed for the figures: any download speed above 256 kilobits per second (kbps) in India is classified as broadband, a level of service that would be seen as inadequate in most countries.11 The number of subscriptions to broadband is woefully short of the target set by DoT (See Table 2).12 The number of internet subscribers too would be significantly below the policy target, were it not for the rapid penetration of mobile internet. There are about 32 million mobile subscribers accessing the internet through wireless networks today, compared to about 11 million who access it through the fixed network. India seriously lags behind on broadband. Even TRAI has conceded that its future targets are unlikely to be achieved, unless critical issues inhibiting broadband expansion in urban as well as rural areas are addressed. These include both policy and regulatory constraints.13
Fixed line subscribersMobile subscribersLog. (Rate of growth of fixed lines)Log. (Rate of growth of mobiles)
0
5022
1
27
2
32
4
38
6
41
13
4333
47 5746
150
41
165
39
261
39
315
100
150
200
250
300
350
Mar 99
Mar 00
Mar 01
Mar 02
Mar 03
Mar 04
Mar 05
Mar 06
Mar 07
Mar 08
Sep 08
Subs
crib
ers
(mill
ion)
-40
-20
0
20
60
100
140
180
40
80
120
160
Rat
e of
gro
wth
(%)
10
India: The Impact of Mobile Phones Moving the debate forward • The Policy Paper Series • Number 9 • January 2009
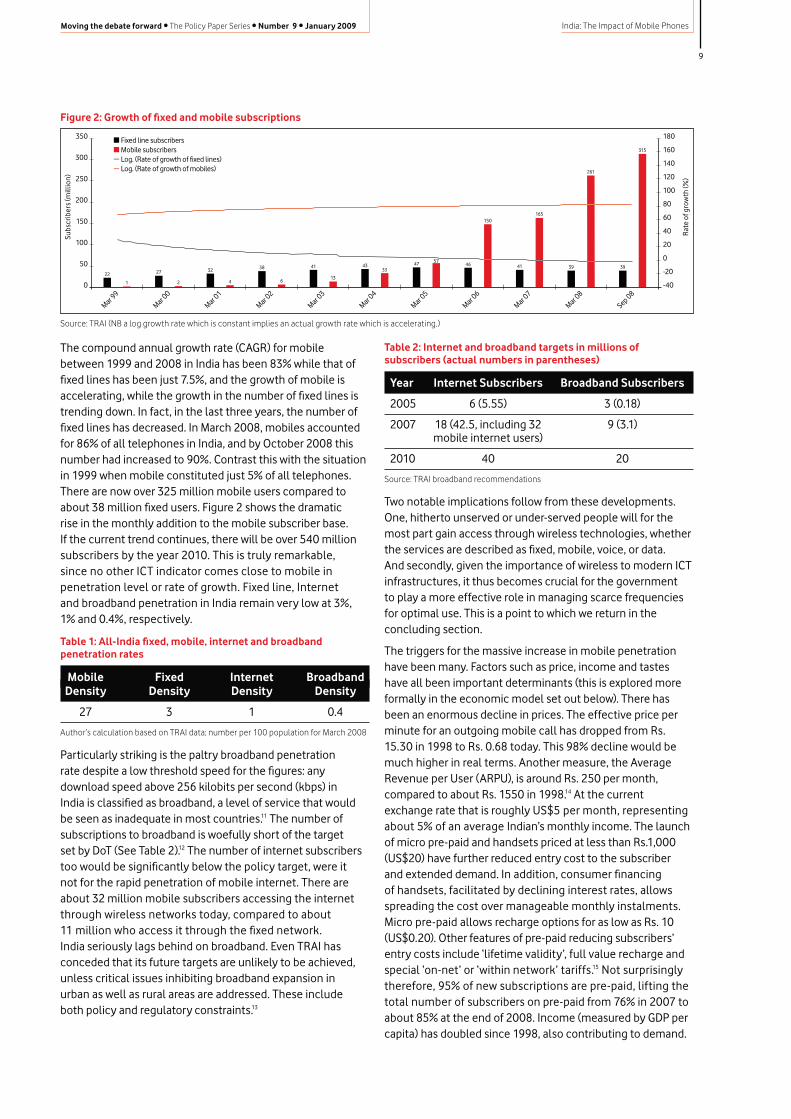
Figure 3: Number of new subscribers
Source: TRAI press releases, increase in telecoms subscriptions monthly from September 2005 to October 2008 and BDA
and more reliable network and far higher penetration than the public sector would have been able to do on its own.
Table 3: Mobile market shares
Service provider Market share, March 2008
Bharti Airtel 24.34%
Reliance 17.74%
Vodafone 17.21%
BSNL 14.37%
IDEA 9.54%
Tata Teleservices 9.23%
Aircel 4.21%
Spice 1.42%
MTNL 1.29%
BPL 0.49%
HFCL Infotel 0.12%
Shyam Telelink 0.04%
Source: COAI. Figures are all-India shares, March 2008
The Indian experience shows that, although it took several years for deregulatory measures to have an impact, in the end competition-driven network expansion resulted in services being provided to those who had been denied access in the public monopoly model. However, even after the monopoly of the government-owned incumbent is broken and the growth trajectory increased, more is required if India wishes to close the gap with other comparable countries, as Figure 4 illustrates.
India was not unique in its earlier embrace of a telephone monopoly but deregulation started relatively late, in 1994, with drafting of the National Telecom Policy (NTP 94). This saw the abandonment of the government-owned, vertically integrated structure of service provision which had led to low supply, high prices for certain services and a large segment of the population without access to services. Market entry by mobile operators was allowed, starting in 1995, but was at first limited to two operators per service area.16 The third mobile licence was reserved for public sector operators, MTNL and BSNL and the fourth mobile licence was auctioned in 2001. Subsequently in 2003 unlimited competition was introduced through a Universal Access Service Licence (UASL) that recognised the convergence of fixed and mobile technologies in providing access.17 It was at this point that the number of mobile connections took off. The introduction of the “Calling Party Pays” (CPP) regime also contributed.
Of total telecom sector revenue of US $27.5 billion in March 2008, mobile telephony accounted for more than 50%. Average growth in revenue during the past three years has been 20%, making India the fastest growing telecoms market in the world. The more than 10 million mobile phones being added each month are distributed among the major operators. Airtel, Vodafone and Reliance added the highest numbers of subscribers, with 2.03, 1.57 & 1.51 million new additions respectively in March 2008. Wireless service providers in India along with their respective market shares for March 2008 are shown in Table 3. The top six players in the mobile market have an all-India presence, while the others are regional.18 The top three firms are private sector, while the public sector BSNL ranks fourth. Strong competition has ensured a larger
Figure 4: Mobile penetration in India and comparator countries
Source: Individual regulator websites and TPR submissions to WTO
0
2
4
6
8
10
12
New
sub
scrib
ers
(mill
ion)
Sep
05
Oct
05
Nov
05
Dec
05
Jan
06
Feb
06
Mar
06
Apr 0
6
May
06
Jun
06
Jul 0
6
Aug
06
Sep
06
Oct
06
Nov
06
Dec
06
Jan
07
Feb
07
Mar
07
Apr 0
7
May
07
Jun
07
Jul 0
7
Aug
07
Sep
07
Oct
07
Nov
07
Dec
07
Feb
08
Mar
08
Apr 0
8
May
08
Jun
08
Jul 0
8
Aug
08
Sep
08
Oct
08
Jan
08
Launch of 999schemes
Micro Prepaid takes off
Verificationof Subscribers
Launch of INR777handsets/lifetime
prepaid below INR500
India 2nd largestwireless networkin the world
Highest everaddition inthe monthtill date
10.42
Subscriber base cross 300 mn &tele-density 25% mark
Penetration in B & C circles
0
20
40
60
80
100
per c
ent
2000 2001 2002 2003 2004 2005 2006 2007
PakistanChinaSri Lanka
South Africa
BrazilPhilippines
India
PakistanChinaSri Lanka
South Africa
BrazilPhilippines
11
India: The Impact of Mobile PhonesMoving the debate forward • The Policy Paper Series • Number 9 • January 2009
The low teledensity is mirrored in the low mobile coverage in India. Developing countries that are larger than India in geographical area such as Brazil and China have achieved greater mobile coverage while countries with lower per capita income such as Pakistan have realised higher mobile teledensity.
Table 4: Mobile coverage in selected countries (% of population covered by mobile network, 2007)
% of population
Pakistan 90
Philippines 99
S Africa 99.79
Sri Lanka 95
China 97
Brazil 91
India 60.9
Source ITU, World Telecom Indicators 2008
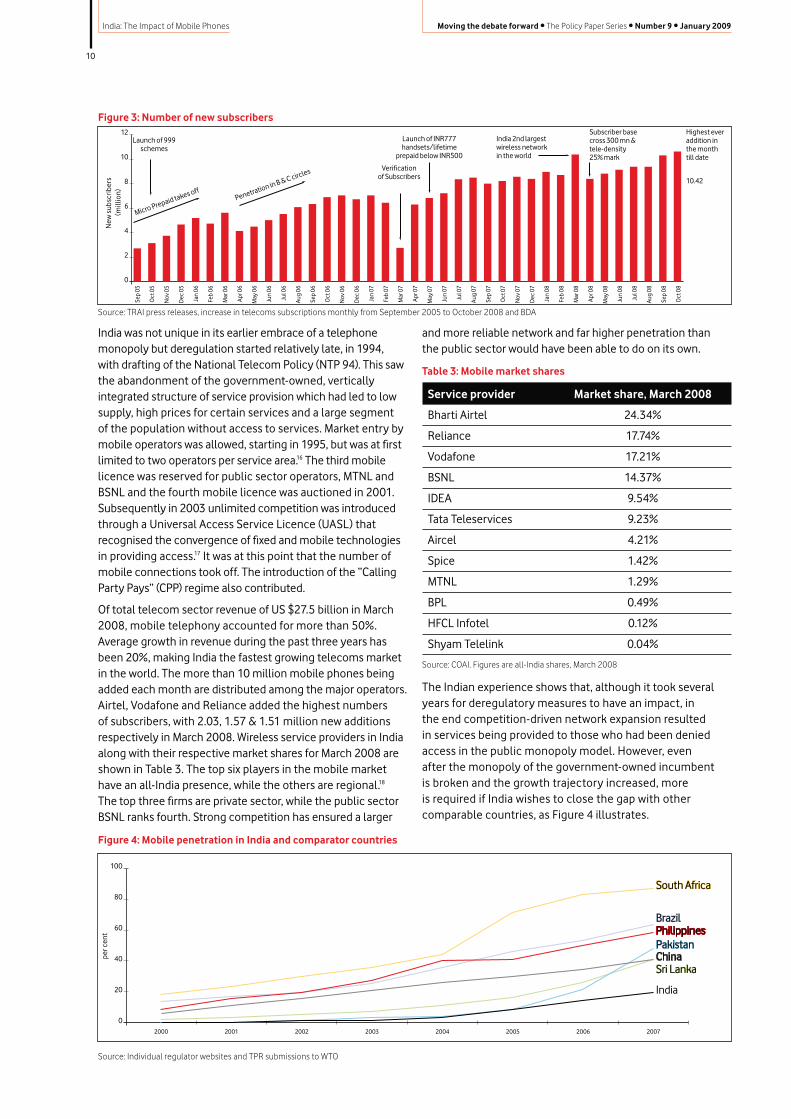
On the other hand, mobile airtime rates in India have dropped to a level unmatched anywhere else in the world (see figure 5). At roughly 1 US cent a minute, the price is half of that prevailing in China and Pakistan. It is, therefore difficult to isolate a single factor responsible for India’s low relative teledensity. One possibility is that it is due to India’s late start. By the time India launched mobile in 1995, China had 3.6 million subscribers and Brazil 1.26 million. But this cannot be the only reason as the gap continued to expand until very recently.
Figure 5: Airtime rate per minute in selected countries
0
0.02
0.04
0.06
0.08
0.10
0.12
0.14
0.16
0.18
Brazil
0.17
South Africa Philippines China Pakistan India
0.140.13
0.02 0.020.01
Source: Merrill Lynch 2Q08
Although net monthly additions in India are the highest in the world today, the challenge is to ensure that growth does not slow, so that the gap between India and other countries is bridged sooner rather than later. This is all the more important given the results of our econometric work reported below, which show a positive and significant relationship between mobile density and income at the state level.
Mobile access differs between states and between urban and rural areas, but the gap is less than for other technologiesIt is often claimed that competition between the states to attract investment, especially since the 1991 economic reforms, has widened the already huge disparities between them. The richer, better-administered and more literate states have proved more attractive than the poorer ones to investors. Between 1999 and 2008, when the Indian economy grew at
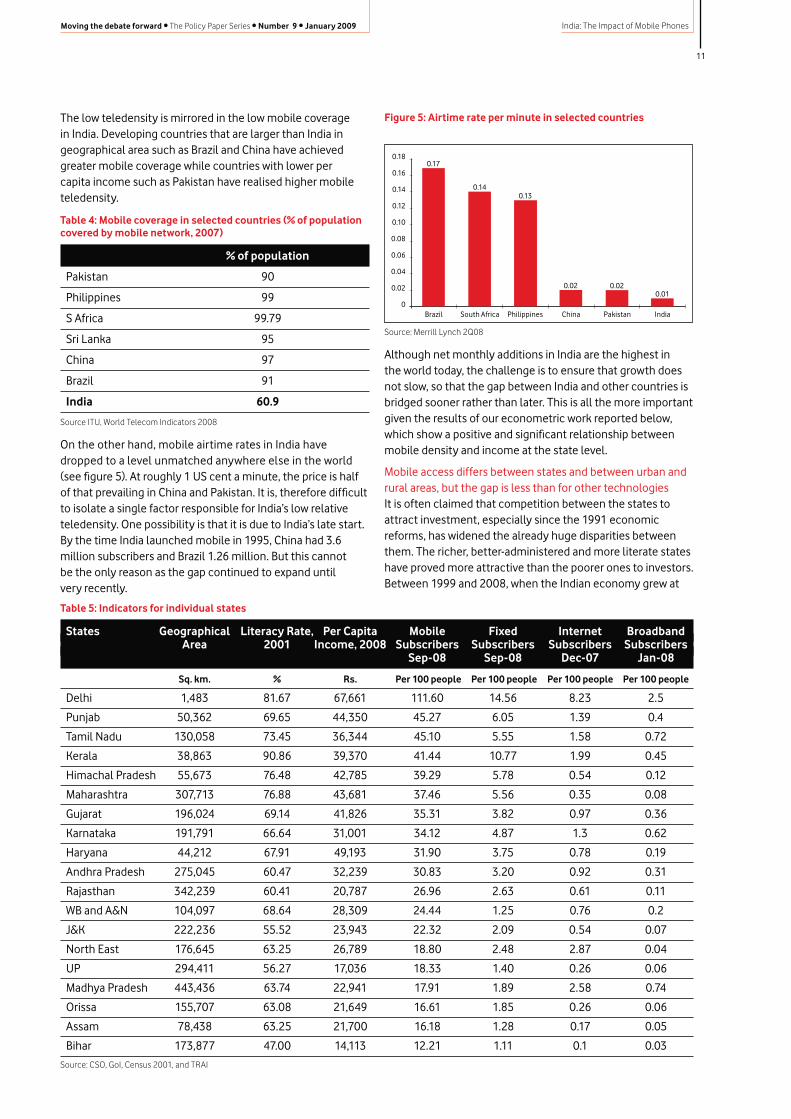
Table 5: Indicators for individual states
States Geographical Literacy Rate, Per Capita Mobile Fixed Internet Broadband Area 2001 Income, 2008 Subscribers Subscribers Subscribers Subscribers Sep-08 Sep-08 Dec-07 Jan-08
Sq. km. % Rs. Per 100 people Per 100 people Per 100 people Per 100 people
Delhi 1,483 81.67 67,661 111.60 14.56 8.23 2.5
Punjab 50,362 69.65 44,350 45.27 6.05 1.39 0.4
Tamil Nadu 130,058 73.45 36,344 45.10 5.55 1.58 0.72
Kerala 38,863 90.86 39,370 41.44 10.77 1.99 0.45
Himachal Pradesh 55,673 76.48 42,785 39.29 5.78 0.54 0.12
Maharashtra 307,713 76.88 43,681 37.46 5.56 0.35 0.08
Gujarat 196,024 69.14 41,826 35.31 3.82 0.97 0.36
Karnataka 191,791 66.64 31,001 34.12 4.87 1.3 0.62
Haryana 44,212 67.91 49,193 31.90 3.75 0.78 0.19
Andhra Pradesh 275,045 60.47 32,239 30.83 3.20 0.92 0.31
Rajasthan 342,239 60.41 20,787 26.96 2.63 0.61 0.11
WB and A&N 104,097 68.64 28,309 24.44 1.25 0.76 0.2
J&K 222,236 55.52 23,943 22.32 2.09 0.54 0.07
North East 176,645 63.25 26,789 18.80 2.48 2.87 0.04
UP 294,411 56.27 17,036 18.33 1.40 0.26 0.06
Madhya Pradesh 443,436 63.74 22,941 17.91 1.89 2.58 0.74
Orissa 155,707 63.08 21,649 16.61 1.85 0.26 0.06
Assam 78,438 63.25 21,700 16.18 1.28 0.17 0.05
Bihar 173,877 47.00 14,113 12.21 1.11 0.1 0.03
Source: CSO, GoI, Census 2001, and TRAI

12
India: The Impact of Mobile Phones Moving the debate forward • The Policy Paper Series • Number 9 • January 2009
an average annual rate of 7.3%, many richer states grew even faster: Gujarat at 8.8%, Haryana at 8.7% and Delhi at 7.4%. Among the poorest and most populous states, Bihar grew at 5.1%, Uttar Pradesh at 4.4% and Madhya Pradesh at 3.5%.19
Mobile density to a large degree reflects the differences in per capita income across states. The simple correlation coefficient between per capita income and mobile density for 2008 is 0.87 (where 1 would indicate perfect correlation). The corresponding correlation coefficients between per capita income and other ICT indicators across states are also positive but not as large; between fixed and per capita income it is 0.8, for internet and per capita income it is 0.66 while for broadband and per capita income it is 0.62.
Table 6: Coefficient of variation across states
Mobile Fixed Internet Broadband Density Density Density Density
0.66 0.77 1.04 1.16
Source: Author’s estimates
Per capita income is however not the only determinant of penetration rate. A study published by Vodafone in 2005 reported that certain African countries that started early down the path of telecom liberalisation – such as Gabon and Mauritius – had achieved mobile penetration rates that were surprisingly high given their social and economic indicators; and the converse is true for countries where there were no early private licences issued, such as Algeria or Nigeria.20 Such variations also exist across Indian States. For example Haryana is the second richest state in India after Delhi, but ranks ninth in overall mobile density, while Punjab and Tamil Nadu have similar penetration rates, although Punjab is 25% more prosperous. On the other hand, Kerala has a relatively lower per capita income, but a very high mobile penetration rate. One explanation might be a large migrant population from Kerala working in the Middle East wishing to stay in touch with family and friends. Metros, like Delhi and Mumbai, that had a distinct first mover advantage, have achieved much higher mobile penetration rates. While the correlation of mobile density with share of service sector GSDP and literacy rate is positive, (0.72 and 0.46 respectively), and with geographical size it is negative (-0.46), the phenomenon of the diffusion of mobile, however, cuts across many of these obvious characteristics.
There are too many differences across and within Indian states to identify robust explanations for differences in penetration and usage. However competition-driven network expansion has certainly driven airtime charges and ARPUs to extremely low levels. By September 2008, the median number of wireless operators in each state was 6, with only one state having as few as 4 and the rest 5 or more operators. The situation today is extraordinarily different compared to the late nineties, when only a few states had access to mobile services and the service itself was limited to the creamy layer.
As India’s economy grows rapidly, what will happen to the regional disparities? Mobile penetration is growing faster in states with the lowest current levels, showing a trend towards convergence. Internet and broadband penetration are even lower than fixed line penetration. The coefficient of variation across states for the four ICT indicators – mobile, fixed, internet and broadband – is the lowest for mobile, indicating greater uniformity between states than other ICT indicators. This evidence from Indian states is consistent with evidence of convergence in mobile contrasting to divergence in access to other technologies elsewhere in the world.
Interestingly, both internet and broadband availability in India have until now been associated with Public Switched Telephone Network (PSTN) infrastructure consisting of copper loops to subscriber premises. The cost of providing access through this platform is greater than for wireless and is influenced by the distance between the subscriber and the local exchange, the gauge of the phone wire, and the type of technology. Providing high speed broadband access through wireless is cheaper, but depends on the availability and price of spectrum and the extent of backhaul network essential to provide services. Sufficient spectrum has not been made available to provide high-speed internet access. Further, given India’s landmass, the cost of creating backhaul infrastructure in rural areas is substantial and has been a significant barrier. Consequently, the growth of internet access and data services has been severely sluggish. Broadband penetration is negligible and far short of the policy target. At a policy level, therefore, there is need to recognise the significance of wireless in not only delivery of voice, but also data services. Growth in mobile telephony for voice services is important but not sufficient to be competitive on a global stage.
Figure 6: measures of mobile usage across states
Source: Authors calculation based on TRAI.data. Figures for March 2008.
ARPUMOU
0
100
200
300
400
500
600
700
MO
U, A
RPU
STATES
Assam
Chennai
Gujarat
Haryana
Karnatka
Kolkata
Maharashtra N.E.
Punjab
T.N.
U.P. (W)
A.P.
Bihar
Delhi
H.P.
J & K
Kerala
M.P.
Mumbai
Orissa
Rajasthan
U.P. (E)
W.B. & A &
N
13
India: The Impact of Mobile PhonesMoving the debate forward • The Policy Paper Series • Number 9 • January 2009
At a policy level, there is a need to recognise the significance of wireless in not only delivery of voice, but also data services, and to stimulate the installation of backhaul infrastructure in rural areas through the use of appropriate incentives.
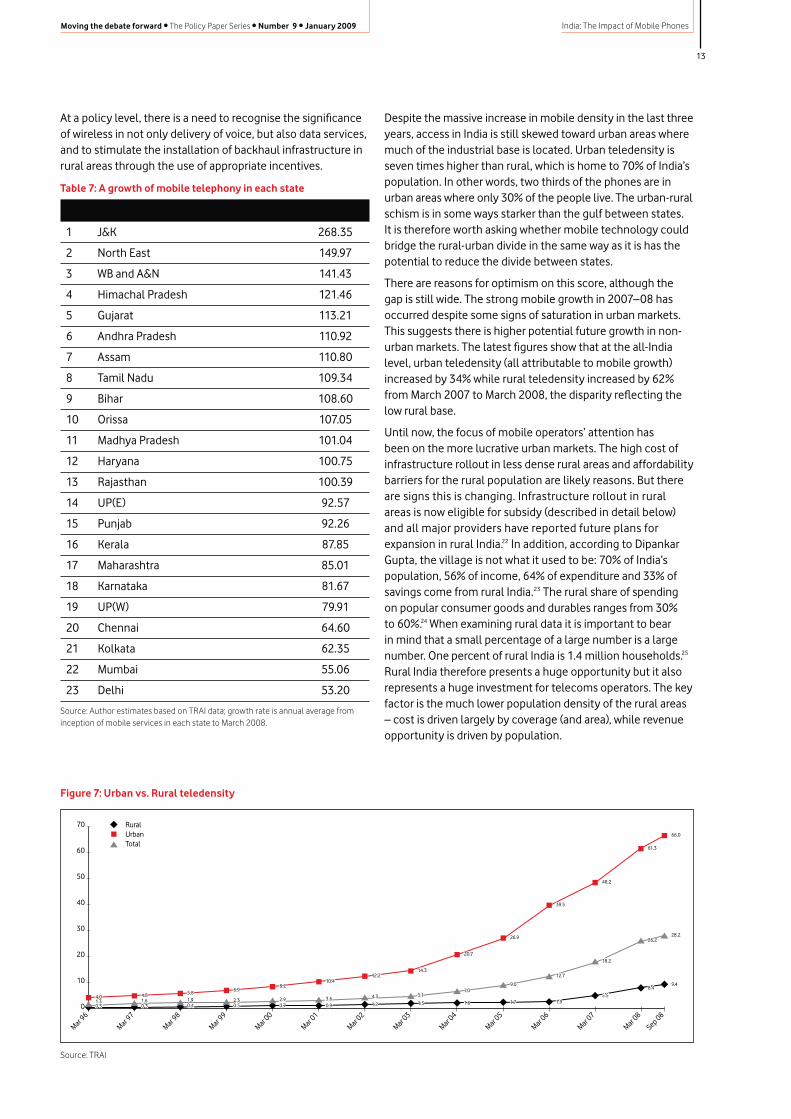
Table 7: A growth of mobile telephony in each state
1 J&K 268.35
2 North East 149.97
3 WB and A&N 141.43
4 Himachal Pradesh 121.46
5 Gujarat 113.21
6 Andhra Pradesh 110.92
7 Assam 110.80
8 Tamil Nadu 109.34
9 Bihar 108.60
10 Orissa 107.05
11 Madhya Pradesh 101.04
12 Haryana 100.75
13 Rajasthan 100.39
14 UP(E) 92.57
15 Punjab 92.26
16 Kerala 87.85
17 Maharashtra 85.01
18 Karnataka 81.67
19 UP(W) 79.91
20 Chennai 64.60
21 Kolkata 62.35
22 Mumbai 55.06
23 Delhi 53.20
Source: Author estimates based on TRAI data; growth rate is annual average from inception of mobile services in each state to March 2008.
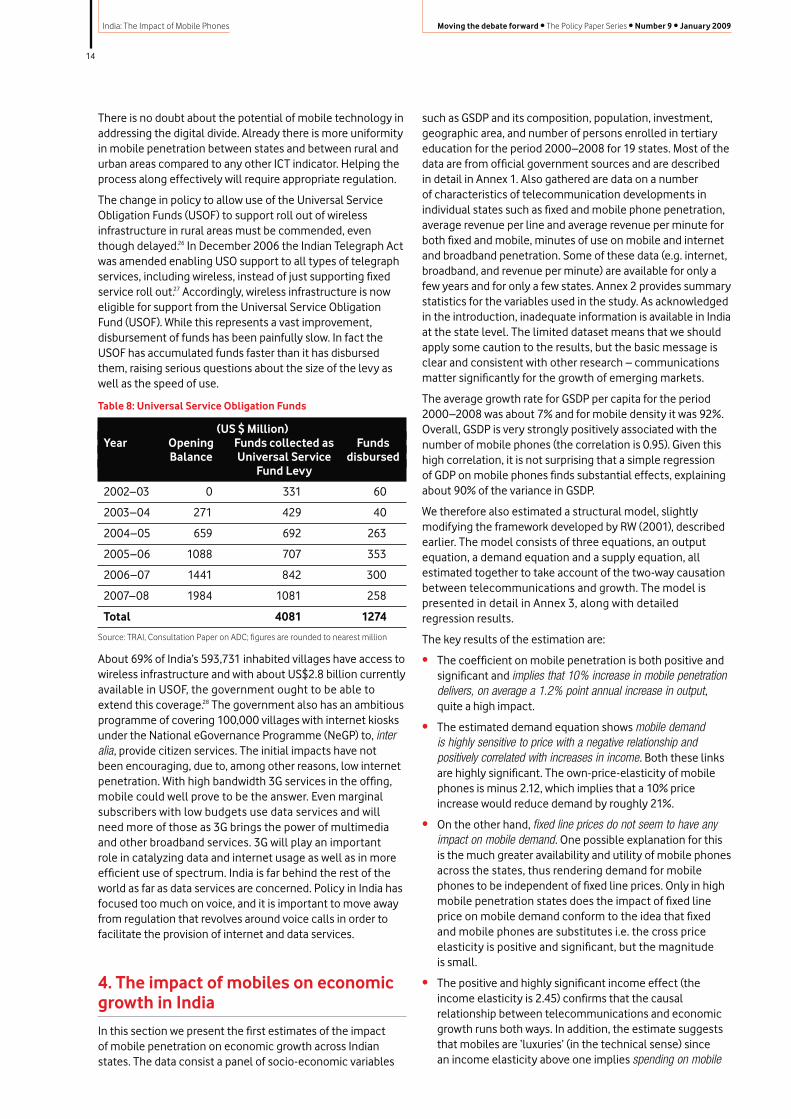
Despite the massive increase in mobile density in the last three years, access in India is still skewed toward urban areas where much of the industrial base is located. Urban teledensity is seven times higher than rural, which is home to 70% of India’s population. In other words, two thirds of the phones are in urban areas where only 30% of the people live. The urban-rural schism is in some ways starker than the gulf between states. It is therefore worth asking whether mobile technology could bridge the rural-urban divide in the same way as it is has the potential to reduce the divide between states.
There are reasons for optimism on this score, although the gap is still wide. The strong mobile growth in 2007–08 has occurred despite some signs of saturation in urban markets. This suggests there is higher potential future growth in non-urban markets. The latest figures show that at the all-India level, urban teledensity (all attributable to mobile growth) increased by 34% while rural teledensity increased by 62% from March 2007 to March 2008, the disparity reflecting the low rural base.
Until now, the focus of mobile operators’ attention has been on the more lucrative urban markets. The high cost of infrastructure rollout in less dense rural areas and affordability barriers for the rural population are likely reasons. But there are signs this is changing. Infrastructure rollout in rural areas is now eligible for subsidy (described in detail below) and all major providers have reported future plans for expansion in rural India.22 In addition, according to Dipankar Gupta, the village is not what it used to be: 70% of India’s population, 56% of income, 64% of expenditure and 33% of savings come from rural India.23 The rural share of spending on popular consumer goods and durables ranges from 30% to 60%.24 When examining rural data it is important to bear in mind that a small percentage of a large number is a large number. One percent of rural India is 1.4 million households.25 Rural India therefore presents a huge opportunity but it also represents a huge investment for telecoms operators. The key factor is the much lower population density of the rural areas – cost is driven largely by coverage (and area), while revenue opportunity is driven by population.
RuralUrbanTotal
0
10
20
30
40
50
60
70
Mar 97
Mar 96
Mar 98
Mar 99
Mar 00
Mar 01
Mar 02
Mar 03
Mar 04
Mar 05
Mar 06
Mar 07
Mar 08
Sep 08
0.31.34.0
0.31.64.8
0.41.95.8
0.52.3
6.9
0.72.9
8.2
0.93.6
10.4
1.2
4.3
12.2
1.5
5.1
14.3
1.6
7.0
20.7
1.7
9.0
26.9
1.9
12.7
39.5
5.5
18.2
48.2
8.4
26.2
61.3
9.4
28.2
66.0
0.31.34.0
0.31.64.8
0.41.95.8
0.52.3
6.9
0.72.9
8.2
0.93.6
10.4
1.2
4.3
12.2
1.5
5.1
14.3
1.6
7.0
20.7
1.7
9.0
26.9
1.9
12.7
39.5
5.5
18.2
48.2
8.4
26.2
61.3
9.4
28.2
66.0
Figure 7: Urban vs. Rural teledensity
Source: TRAI
14
India: The Impact of Mobile Phones Moving the debate forward • The Policy Paper Series • Number 9 • January 2009
There is no doubt about the potential of mobile technology in addressing the digital divide. Already there is more uniformity in mobile penetration between states and between rural and urban areas compared to any other ICT indicator. Helping the process along effectively will require appropriate regulation.
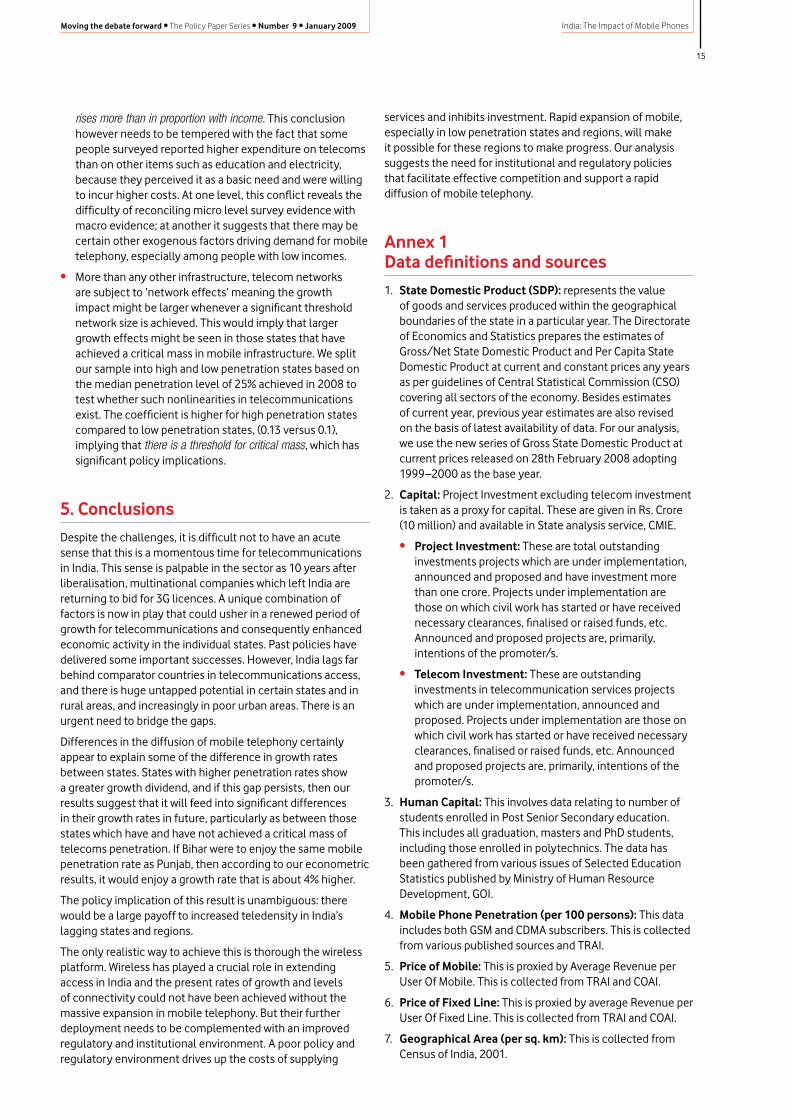
The change in policy to allow use of the Universal Service Obligation Funds (USOF) to support roll out of wireless infrastructure in rural areas must be commended, even though delayed.26 In December 2006 the Indian Telegraph Act was amended enabling USO support to all types of telegraph services, including wireless, instead of just supporting fixed service roll out.27 Accordingly, wireless infrastructure is now eligible for support from the Universal Service Obligation Fund (USOF). While this represents a vast improvement, disbursement of funds has been painfully slow. In fact the USOF has accumulated funds faster than it has disbursed them, raising serious questions about the size of the levy as well as the speed of use.
Table 8: Universal Service Obligation Funds
(US $ Million) Year Opening Funds collected as Funds Balance Universal Service disbursed Fund Levy
2002–03 0 331 60
2003–04 271 429 40
2004–05 659 692 263
2005–06 1088 707 353
2006–07 1441 842 300
2007–08 1984 1081 258
Total 4081 1274
Source: TRAI, Consultation Paper on ADC; figures are rounded to nearest million
About 69% of India’s 593,731 inhabited villages have access to wireless infrastructure and with about US$2.8 billion currently available in USOF, the government ought to be able to extend this coverage.28 The government also has an ambitious programme of covering 100,000 villages with internet kiosks under the National eGovernance Programme (NeGP) to, inter alia, provide citizen services. The initial impacts have not been encouraging, due to, among other reasons, low internet penetration. With high bandwidth 3G services in the offing, mobile could well prove to be the answer. Even marginal subscribers with low budgets use data services and will need more of those as 3G brings the power of multimedia and other broadband services. 3G will play an important role in catalyzing data and internet usage as well as in more efficient use of spectrum. India is far behind the rest of the world as far as data services are concerned. Policy in India has focused too much on voice, and it is important to move away from regulation that revolves around voice calls in order to facilitate the provision of internet and data services.
4. The impact of mobiles on economic growth in India
In this section we present the first estimates of the impact of mobile penetration on economic growth across Indian states. The data consist a panel of socio-economic variables
such as GSDP and its composition, population, investment, geographic area, and number of persons enrolled in tertiary education for the period 2000–2008 for 19 states. Most of the data are from official government sources and are described in detail in Annex 1. Also gathered are data on a number of characteristics of telecommunication developments in individual states such as fixed and mobile phone penetration, average revenue per line and average revenue per minute for both fixed and mobile, minutes of use on mobile and internet and broadband penetration. Some of these data (e.g. internet, broadband, and revenue per minute) are available for only a few years and for only a few states. Annex 2 provides summary statistics for the variables used in the study. As acknowledged in the introduction, inadequate information is available in India at the state level. The limited dataset means that we should apply some caution to the results, but the basic message is clear and consistent with other research – communications matter significantly for the growth of emerging markets.
The average growth rate for GSDP per capita for the period 2000–2008 was about 7% and for mobile density it was 92%. Overall, GSDP is very strongly positively associated with the number of mobile phones (the correlation is 0.95). Given this high correlation, it is not surprising that a simple regression of GDP on mobile phones finds substantial effects, explaining about 90% of the variance in GSDP.
We therefore also estimated a structural model, slightly modifying the framework developed by RW (2001), described earlier. The model consists of three equations, an output equation, a demand equation and a supply equation, all estimated together to take account of the two-way causation between telecommunications and growth. The model is presented in detail in Annex 3, along with detailed regression results.
The key results of the estimation are:
• The coefficient on mobile penetration is both positive and significant and implies that 10% increase in mobile penetration delivers, on average a 1.2% point annual increase in output, quite a high impact.
• The estimated demand equation shows mobile demand is highly sensitive to price with a negative relationship and positively correlated with increases in income. Both these links are highly significant. The own-price-elasticity of mobile phones is minus 2.12, which implies that a 10% price increase would reduce demand by roughly 21%.
• On the other hand, fixed line prices do not seem to have any impact on mobile demand. One possible explanation for this is the much greater availability and utility of mobile phones across the states, thus rendering demand for mobile phones to be independent of fixed line prices. Only in high mobile penetration states does the impact of fixed line price on mobile demand conform to the idea that fixed and mobile phones are substitutes i.e. the cross price elasticity is positive and significant, but the magnitude is small.
• The positive and highly significant income effect (the income elasticity is 2.45) confirms that the causal relationship between telecommunications and economic growth runs both ways. In addition, the estimate suggests that mobiles are ‘luxuries’ (in the technical sense) since an income elasticity above one implies spending on mobile
15
India: The Impact of Mobile PhonesMoving the debate forward • The Policy Paper Series • Number 9 • January 2009
rises more than in proportion with income. This conclusion however needs to be tempered with the fact that some people surveyed reported higher expenditure on telecoms than on other items such as education and electricity, because they perceived it as a basic need and were willing to incur higher costs. At one level, this conflict reveals the difficulty of reconciling micro level survey evidence with macro evidence; at another it suggests that there may be certain other exogenous factors driving demand for mobile telephony, especially among people with low incomes.
• More than any other infrastructure, telecom networks are subject to ‘network effects’ meaning the growth impact might be larger whenever a significant threshold network size is achieved. This would imply that larger growth effects might be seen in those states that have achieved a critical mass in mobile infrastructure. We split our sample into high and low penetration states based on the median penetration level of 25% achieved in 2008 to test whether such nonlinearities in telecommunications exist. The coefficient is higher for high penetration states compared to low penetration states, (0.13 versus 0.1), implying that there is a threshold for critical mass, which has significant policy implications.
5. Conclusions
Despite the challenges, it is difficult not to have an acute sense that this is a momentous time for telecommunications in India. This sense is palpable in the sector as 10 years after liberalisation, multinational companies which left India are returning to bid for 3G licences. A unique combination of factors is now in play that could usher in a renewed period of growth for telecommunications and consequently enhanced economic activity in the individual states. Past policies have delivered some important successes. However, India lags far behind comparator countries in telecommunications access, and there is huge untapped potential in certain states and in rural areas, and increasingly in poor urban areas. There is an urgent need to bridge the gaps.
Differences in the diffusion of mobile telephony certainly appear to explain some of the difference in growth rates between states. States with higher penetration rates show a greater growth dividend, and if this gap persists, then our results suggest that it will feed into significant differences in their growth rates in future, particularly as between those states which have and have not achieved a critical mass of telecoms penetration. If Bihar were to enjoy the same mobile penetration rate as Punjab, then according to our econometric results, it would enjoy a growth rate that is about 4% higher.
The policy implication of this result is unambiguous: there would be a large payoff to increased teledensity in India’s lagging states and regions.
The only realistic way to achieve this is thorough the wireless platform. Wireless has played a crucial role in extending access in India and the present rates of growth and levels of connectivity could not have been achieved without the massive expansion in mobile telephony. But their further deployment needs to be complemented with an improved regulatory and institutional environment. A poor policy and regulatory environment drives up the costs of supplying
services and inhibits investment. Rapid expansion of mobile, especially in low penetration states and regions, will make it possible for these regions to make progress. Our analysis suggests the need for institutional and regulatory policies that facilitate effective competition and support a rapid diffusion of mobile telephony.
Annex 1 Data definitions and sources
1. State Domestic Product (SDP): represents the value of goods and services produced within the geographical boundaries of the state in a particular year. The Directorate of Economics and Statistics prepares the estimates of Gross/Net State Domestic Product and Per Capita State Domestic Product at current and constant prices any years as per guidelines of Central Statistical Commission (CSO) covering all sectors of the economy. Besides estimates of current year, previous year estimates are also revised on the basis of latest availability of data. For our analysis, we use the new series of Gross State Domestic Product at current prices released on 28th February 2008 adopting 1999–2000 as the base year.
2. Capital: Project Investment excluding telecom investment is taken as a proxy for capital. These are given in Rs. Crore (10 million) and available in State analysis service, CMIE.
• Project Investment: These are total outstanding investments projects which are under implementation, announced and proposed and have investment more than one crore. Projects under implementation are those on which civil work has started or have received necessary clearances, finalised or raised funds, etc. Announced and proposed projects are, primarily, intentions of the promoter/s.
• Telecom Investment: These are outstanding investments in telecommunication services projects which are under implementation, announced and proposed. Projects under implementation are those on which civil work has started or have received necessary clearances, finalised or raised funds, etc. Announced and proposed projects are, primarily, intentions of the promoter/s.
3. Human Capital: This involves data relating to number of students enrolled in Post Senior Secondary education. This includes all graduation, masters and PhD students, including those enrolled in polytechnics. The data has been gathered from various issues of Selected Education Statistics published by Ministry of Human Resource Development, GOI.
4. Mobile Phone Penetration (per 100 persons): This data includes both GSM and CDMA subscribers. This is collected from various published sources and TRAI.
5. Price of Mobile: This is proxied by Average Revenue per User Of Mobile. This is collected from TRAI and COAI.
6. Price of Fixed Line: This is proxied by average Revenue per User Of Fixed Line. This is collected from TRAI and COAI.
7. Geographical Area (per sq. km): This is collected from Census of India, 2001.

16
India: The Impact of Mobile Phones Moving the debate forward • The Policy Paper Series • Number 9 • January 2009
Annex 2 Descriptive statistics Variable No. of Mean Std. Dev Min Max Observation
SDP( in billion) 171 1260000 892000 141000 4730000
Per Capita SDP 171 26000 11870.47 7972 69517
Mobile Penetration (in %) 171 7.48 12.92 0 96.95
Human Capital 171 609456 53414.32 47359 3949106
Price of Mobile 166 562.79 322.56 198 1483
Price of Fixed line 170 521.94 140.31 192 888
Geographical area 171 172753 116652 1483 443436
Investment (in billion) 171 4140000 4080000 4260000 20400000
product in manufacturing and services as instruments for the endogenous variables (output, the level of mobile and fixed penetration, and the mobile and fixed prices).
(MPENit - MPENit-1)/MPENit = 0 + 1 GA + 2 PriceMit + ΄́ (3)
It is important to note that equations (2) and (3) endogenize telecommunications investment since these equations involve the demand for and supply of telecommunication.
We estimate three specifications of the model (1)-(3). One specification includes all the states, while the other two, classify states as High or Low penetration states according to mobile density. High density states are assumed to be those that have achieved above median penetration of 25% in 2008. The first specification of model (1)-(3) uses observations from all states to arrive at the estimates. The parameter estimates of the output equation indicate that capital is positive and significantly associated with economic growth. Human capital also picks up a positive coefficient, but is significant only at the 10% level of significance. The coefficient on mobile penetration is both positive and significant and is estimated at 0.12. This implies that 10% increase in mobile penetration delivers, on average 1.2 % increase in output, thus attributing a fairly high impact to mobile. The magnitude of this impact is similar to the one found by Bedi et al in their cross country regression of 95 countries.29
For the demand equation, the estimates show mobile demand is inversely related to price and positively correlated with increases in income. Both these estimates are highly significant. The equation is in double-log form so the coefficients can be interpreted as elasticities of demand. The own-price-elasticity of mobile phones is minus 2.12, which implies that demand is elastic: a 10% price increase would reduce demand by roughly 21%. On the other hand fixed line prices do not seem to have any impact on mobile demand, given that the coefficient is not only of the wrong sign but it is also not significant. One possible explanation for this is the much greater availability and utility of mobile phones across the states, thus rendering demand for mobile phones to be independent of fixed line prices. The positive and highly significant income effect (income elasticity is 2.45) confirms that the causal relationship between
Data for telecom services are available as per licensed area i.e. for 23 service areas (19 circles and 4 metros). Redefining a few service areas is necessary to match with data for socio-economic variables which are only available at the state level. This exercise reduces availability to 19 cross-section units. For the matching see Annex 5.
Annex 3 The econometric model and detailed results
The Output equation models the level of output (GSDP) as a function of the total investment net of telecom investment, a measure of human capital and the mobile penetration rate. We use a dummy variable for each state, the so called fixed effects approach which controls for unobservable characteristics that are specific to each state. The aggregate production function equation is then as follows:
SGDPit = 0 + 1 Kit + 2 Lit + 3 MPENit + 4Di + (1)
where SGDP is state gross domestic product, K is investment, L is human capital, MPEN is mobile penetration per 100 persons, and D captures the state specific effect. Subscript i=1,2,3,…19 represents the 19 states and subscript t corresponds to the 9 periods for which data is available.
Equation (2) models the level of mobile penetration (MPEN) as a function of the level of GSDP per capita (SGDP_PC), mobile price which is proxied by average revenue per user (PriceM), and the fixed-line price which is revenue per fixed-line subscriber (PriceF).
MPENit = 0 + 1 SGDP_PCit + 2 PriceMit + 2 PriceFit + ΄ (2)
The supply equation (3) assumes that the growth rate of mobile penetration depends on the price of mobile and the geographic area (GA). We estimate the system of equations described above using the three stage least squares procedure using exogenous variables in the system of equations such as population, state domestic
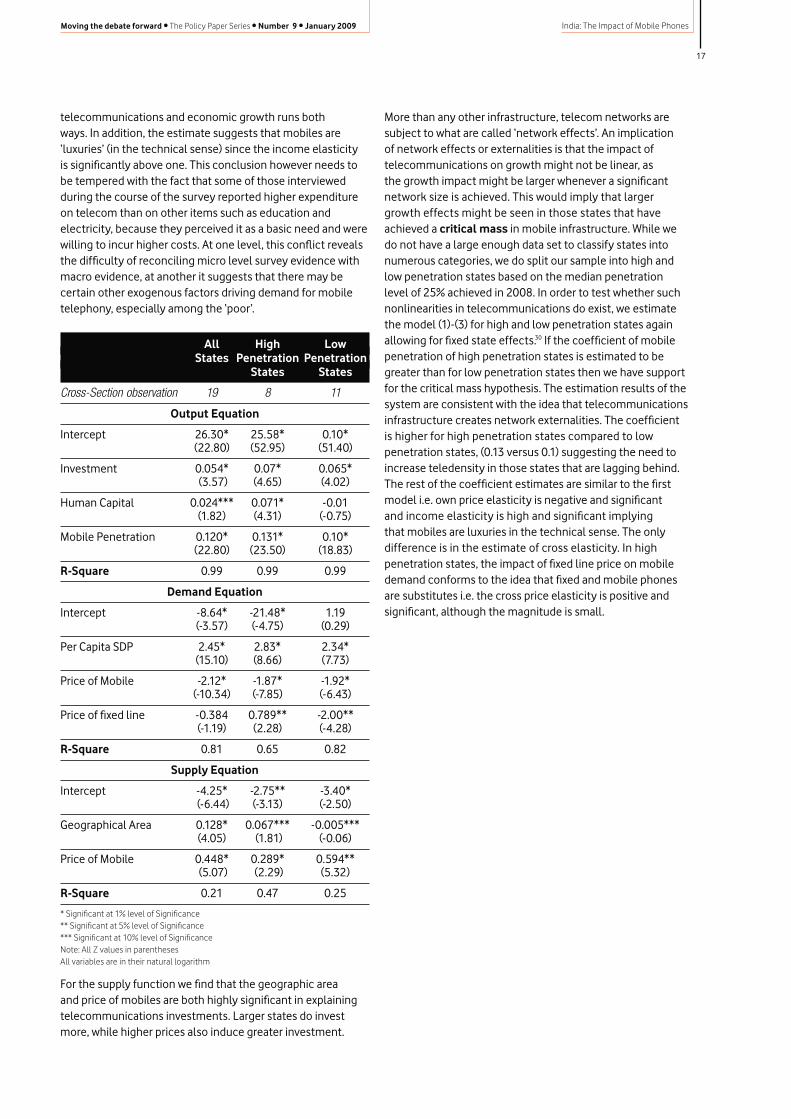
17
India: The Impact of Mobile PhonesMoving the debate forward • The Policy Paper Series • Number 9 • January 2009
telecommunications and economic growth runs both ways. In addition, the estimate suggests that mobiles are ‘luxuries’ (in the technical sense) since the income elasticity is significantly above one. This conclusion however needs to be tempered with the fact that some of those interviewed during the course of the survey reported higher expenditure on telecom than on other items such as education and electricity, because they perceived it as a basic need and were willing to incur higher costs. At one level, this conflict reveals the difficulty of reconciling micro level survey evidence with macro evidence, at another it suggests that there may be certain other exogenous factors driving demand for mobile telephony, especially among the ‘poor’.
All High Low States Penetration Penetration States States
Cross-Section observation 19 8 11
Output Equation
Intercept 26.30* 25.58* 0.10* (22.80) (52.95) (51.40)
Investment 0.054* 0.07* 0.065* (3.57) (4.65) (4.02)
Human Capital 0.024*** 0.071* -0.01 (1.82) (4.31) (-0.75)
Mobile Penetration 0.120* 0.131* 0.10* (22.80) (23.50) (18.83)
R-Square 0.99 0.99 0.99
Demand Equation
Intercept -8.64* -21.48* 1.19 (-3.57) (-4.75) (0.29)
Per Capita SDP 2.45* 2.83* 2.34* (15.10) (8.66) (7.73)
Price of Mobile -2.12* -1.87* -1.92* (-10.34) (-7.85) (-6.43)
Price of fixed line -0.384 0.789** -2.00** (-1.19) (2.28) (-4.28)
R-Square 0.81 0.65 0.82
Supply Equation
Intercept -4.25* -2.75** -3.40* (-6.44) (-3.13) (-2.50)
Geographical Area 0.128* 0.067*** -0.005*** (4.05) (1.81) (-0.06)
Price of Mobile 0.448* 0.289* 0.594** (5.07) (2.29) (5.32)
R-Square 0.21 0.47 0.25
* Significant at 1% level of Significance ** Significant at 5% level of Significance *** Significant at 10% level of Significance Note: All Z values in parentheses All variables are in their natural logarithm
For the supply function we find that the geographic area and price of mobiles are both highly significant in explaining telecommunications investments. Larger states do invest more, while higher prices also induce greater investment.
More than any other infrastructure, telecom networks are subject to what are called ‘network effects’. An implication of network effects or externalities is that the impact of telecommunications on growth might not be linear, as the growth impact might be larger whenever a significant network size is achieved. This would imply that larger growth effects might be seen in those states that have achieved a critical mass in mobile infrastructure. While we do not have a large enough data set to classify states into numerous categories, we do split our sample into high and low penetration states based on the median penetration level of 25% achieved in 2008. In order to test whether such nonlinearities in telecommunications do exist, we estimate the model (1)-(3) for high and low penetration states again allowing for fixed state effects.30 If the coefficient of mobile penetration of high penetration states is estimated to be greater than for low penetration states then we have support for the critical mass hypothesis. The estimation results of the system are consistent with the idea that telecommunications infrastructure creates network externalities. The coefficient is higher for high penetration states compared to low penetration states, (0.13 versus 0.1) suggesting the need to increase teledensity in those states that are lagging behind. The rest of the coefficient estimates are similar to the first model i.e. own price elasticity is negative and significant and income elasticity is high and significant implying that mobiles are luxuries in the technical sense. The only difference is in the estimate of cross elasticity. In high penetration states, the impact of fixed line price on mobile demand conforms to the idea that fixed and mobile phones are substitutes i.e. the cross price elasticity is positive and significant, although the magnitude is small.
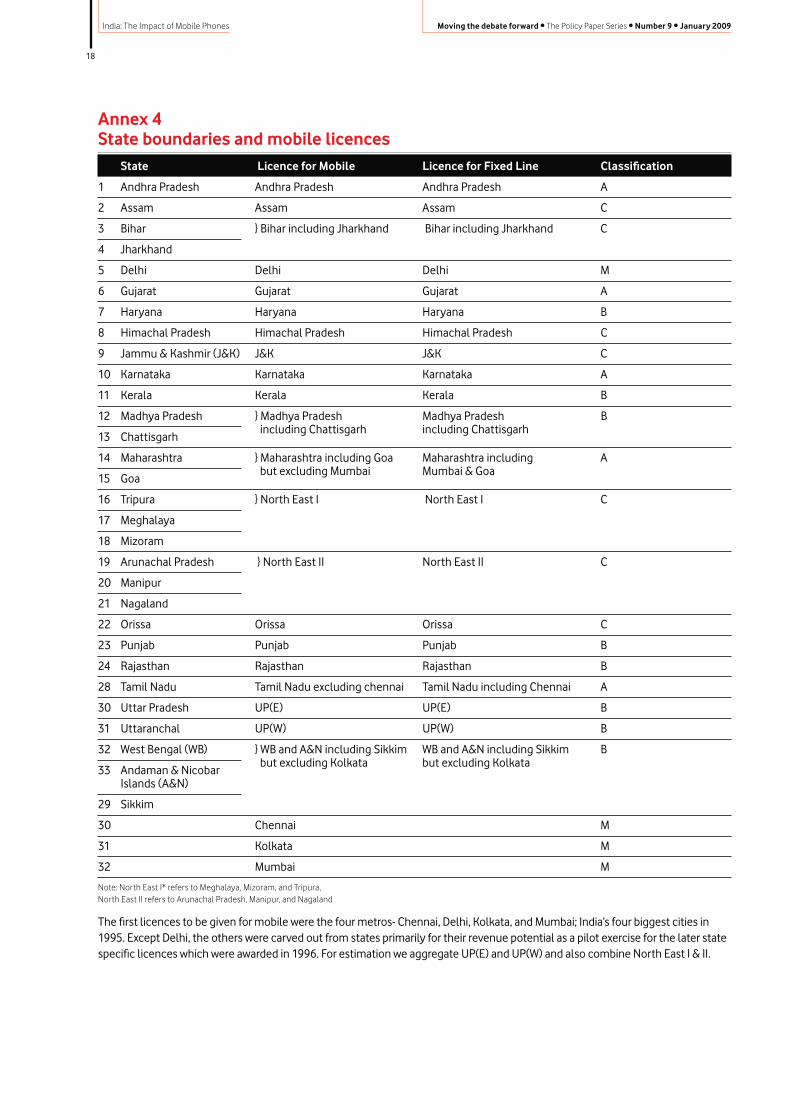
18
India: The Impact of Mobile Phones Moving the debate forward • The Policy Paper Series • Number 9 • January 2009
Annex 4 State boundaries and mobile licences State Licence for Mobile Licence for Fixed Line Classification
1 Andhra Pradesh Andhra Pradesh Andhra Pradesh A
2 Assam Assam Assam C
3 Bihar } Bihar including Jharkhand Bihar including Jharkhand C
4 Jharkhand
5 Delhi Delhi Delhi M
6 Gujarat Gujarat Gujarat A
7 Haryana Haryana Haryana B
8 Himachal Pradesh Himachal Pradesh Himachal Pradesh C
9 Jammu & Kashmir (J&K) J&K J&K C
10 Karnataka Karnataka Karnataka A
11 Kerala Kerala Kerala B
12 Madhya Pradesh } Madhya Pradesh Madhya Pradesh B including Chattisgarh including Chattisgarh13 Chattisgarh
14 Maharashtra } Maharashtra including Goa Maharashtra including A but excluding Mumbai Mumbai & Goa15 Goa
16 Tripura } North East I North East I C
17 Meghalaya
18 Mizoram
19 Arunachal Pradesh } North East II North East II C
20 Manipur
21 Nagaland
22 Orissa Orissa Orissa C
23 Punjab Punjab Punjab B
24 Rajasthan Rajasthan Rajasthan B
28 Tamil Nadu Tamil Nadu excluding chennai Tamil Nadu including Chennai A
30 Uttar Pradesh UP(E) UP(E) B
31 Uttaranchal UP(W) UP(W) B
32 West Bengal (WB) } WB and A&N including Sikkim WB and A&N including Sikkim B but excluding Kolkata but excluding Kolkata33 Andaman & Nicobar Islands (A&N)
29 Sikkim
30 Chennai M
31 Kolkata M
32 Mumbai M
Note: North East I* refers to Meghalaya, Mizoram, and Tripura, North East II refers to Arunachal Pradesh, Manipur, and Nagaland
The first licences to be given for mobile were the four metros- Chennai, Delhi, Kolkata, and Mumbai; India’s four biggest cities in 1995. Except Delhi, the others were carved out from states primarily for their revenue potential as a pilot exercise for the later state specific licences which were awarded in 1996. For estimation we aggregate UP(E) and UP(W) and also combine North East I & II.
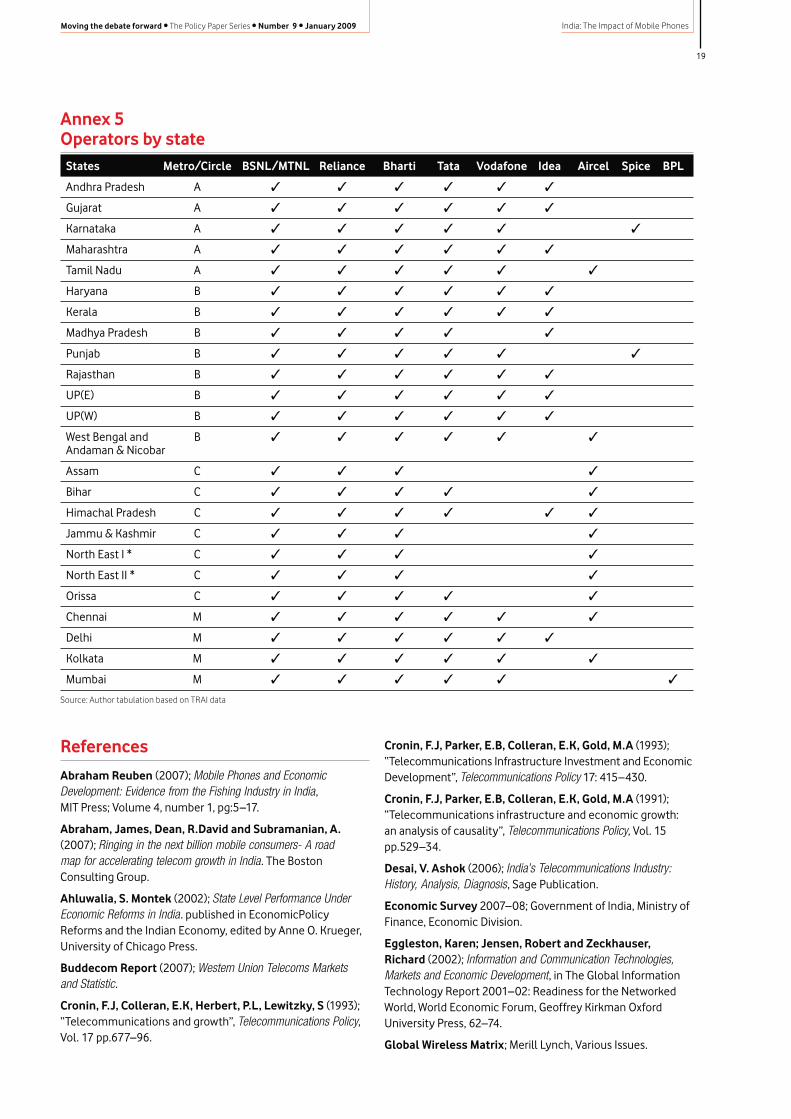
19
India: The Impact of Mobile PhonesMoving the debate forward • The Policy Paper Series • Number 9 • January 2009
Annex 5 Operators by state States Metro/Circle BSNL/MTNL Reliance Bharti Tata Vodafone Idea Aircel Spice BPL
Andhra Pradesh A
Gujarat A
Karnataka A
Maharashtra A
Tamil Nadu A
Haryana B
Kerala B
Madhya Pradesh B
Punjab B
Rajasthan B
UP(E) B
UP(W) B
West Bengal and B Andaman & Nicobar
Assam C
Bihar C
Himachal Pradesh C
Jammu & Kashmir C
North East I * C
North East II * C
Orissa C
Chennai M
Delhi M
Kolkata M
Mumbai M
Source: Author tabulation based on TRAI data
References
Abraham Reuben (2007); Mobile Phones and Economic Development: Evidence from the Fishing Industry in India, MIT Press; Volume 4, number 1, pg:5–17.
Abraham, James, Dean, R.David and Subramanian, A. (2007); Ringing in the next billion mobile consumers- A road map for accelerating telecom growth in India. The Boston Consulting Group.
Ahluwalia, S. Montek (2002); State Level Performance Under Economic Reforms in India. published in EconomicPolicy Reforms and the Indian Economy, edited by Anne O. Krueger, University of Chicago Press.
Buddecom Report (2007); Western Union Telecoms Markets and Statistic.
Cronin, F.J, Colleran, E.K, Herbert, P.L, Lewitzky, S (1993); “Telecommunications and growth”, Telecommunications Policy, Vol. 17 pp.677–96.
Cronin, F.J, Parker, E.B, Colleran, E.K, Gold, M.A (1993); “Telecommunications Infrastructure Investment and Economic Development”, Telecommunications Policy 17: 415–430.
Cronin, F.J, Parker, E.B, Colleran, E.K, Gold, M.A (1991); “Telecommunications infrastructure and economic growth: an analysis of causality”, Telecommunications Policy, Vol. 15 pp.529–34.
Desai, V. Ashok (2006); India’s Telecommunications Industry: History, Analysis, Diagnosis, Sage Publication.
Economic Survey 2007–08; Government of India, Ministry of Finance, Economic Division.
Eggleston, Karen; Jensen, Robert and Zeckhauser, Richard (2002); Information and Communication Technologies, Markets and Economic Development, in The Global Information Technology Report 2001–02: Readiness for the Networked World, World Economic Forum, Geoffrey Kirkman Oxford University Press, 62–74.
Global Wireless Matrix; Merill Lynch, Various Issues.
20
India: The Impact of Mobile Phones Moving the debate forward • The Policy Paper Series • Number 9 • January 2009
International Telecommunication Union (2008); World Telecommunication/ICT Indicators, 12th Edition.
Kathuria, R. (2007); Telecom Liberalisation: A case study of India’s Experience with Regulation, in, Regulation, Institutions and the Law by Jaivir Singh(ed), Social Science Press.
Kathuria, R. (2004); Trade in Telecommunications Services – Opportunities and Constraint, Working Paper 149, ICRIER, New Delhi.
Madden, G, Savage, S.J (1998); CEE telecommunications investment and economic growth, Information Economics and Policy, Vol. 10 pp.173–95.
OECD (2007), OECD Economic Surveys, India.
PricewaterhouseCoopers (PwC) (2007); India GSM Cellular Benchmarking Study.
Roller, Lars-Hendrik and Waverman, Leonard (2001); Telecommunications Infrastructure and Economic Development: A Simultaneous Approach; The American Economic Review, Volume 91, 4th Issue, Pg; 909–923.
Roller, Lars-Hendrik and Waverman, Leonard (1996); Telecommunications Infrastructure and Economic Development: A Simultaneous Approach; Social Science Research Centre Berlin, Discussion paper.
Telecom Regulatory Authority of India (TRAI) (2007); Draft Recommendations on Growth of Broadband, 17th September.
Telecom Regulatory Authority of India (TRAI)(2004); Consultation Paper on Access Deficit Review, 23rd June.
Torero, Maximo; Chowdhury Shyamal and Bedi, S. Arjun (2002); Telecommunications Infrastructure and Economic Growth: A Cross-Country Anaysis; Information and Communication Technology for Development and Poverty Reduction. Baltimore: Johns Hopkins University Press, 21–63.
The Vodafone Policy Paper Series (2005); Africa: The Impact of Mobile Phones; Volume no 2.
Wellenius, B (1997); Telecommunications Reform–How To Succeed, Public Policy Journal, Private Infrastructure, Number 130, The World Bank Group. Website: http://rru.worldbank.org/PublicPolicyJournal/Infrastructure-Telecom/.
World Bank, World Development Report 2008.
Notes1 OECD Economic Surveys INDIA, 2007
2 World Development Report, 2008
3 Montek Ahluwalia , State Level Performance Under Economic Reforms in India May 2000
4 Economic Survey, Government of India 2007–08
5 Planning Commission report on Infrastructure Development. The Eleventh Five Year Plan period runs from 2007–08 to 2011–12 and envisages an average rate of growth of 8%.
6 Ibid
7 Madden and Savage, 1998 Datta and Agarwal 2004
8 See NTP 1999, unexpected because targets are usually optimistic and shortfalls are acceptable
9 The Federal structure is made up of 28 states and 7 union territories*; Andaman and Nicobar Islands*, Andhra Pradesh, Arunachal Pradesh, Assam, Bihar, Chandigarh*, Chhattisgarh, Dadra and Nagar Haveli*, Daman and Diu*, Delhi*, Goa, Gujarat, Haryana, Himachal Pradesh, Jammu and Kashmir, Jharkhand, Karnataka, Kerala, Lakshadweep*, Madhya Pradesh, Maharashtra, Manipur, Meghalaya, Mizoram, Nagaland, Orissa, Puducherry*, Punjab, Rajasthan, Sikkim, Tamil Nadu, Tripura, Uttar Pradesh, Uttarakhand, West Bengal
10 For a summary on the classification of mobile licences and why these are slightly different than fixed, see Annex 4
11 Telecom Regulatory Authority of India,Draft Recommendations On Growth of Broadband 17th September, 2007
12 Internet and Broadband targets set by DoT in Broadband Policy 2004, Ibid
13 Ibid
14 Merrill Lynch 2Q04, Global Wireless Matrix
15 Lifetime has been clarified by TRAI to be synonymous with the duration of the service provider’s licence, which is valid for 20 years and renewable thereafter for 10 years at a time.
16 Service Areas for mobile licensees are by and large contiguous with States, except the four metros. See Annex I for details.
17 Recall that access networks for both these services are effectively wireless, with even fixed services now deploying WLL using CDMA technology. Describe UASL
18 See Annex for area of operation for wireless services
19 The Economist 11th December 2008
20 Africa: The Impact of Mobile Phones Number 2 March 2005
21 Western Union Telecoms Markets and Statistics, 2007, Buddecom Report
22 See for example Business India November 16, 2008, Sunil Mittal Interview to Economic Times etc.
23 Dipankar Gupta “The Changing Villager” Seminar : 2008
24 Market Information Survey of Households, (Mish), National Council for Applied Economic Research (NCAER) 2007
25 For example, Airtel has tied up with IFFCO, a fertiliser company, Tata Indicom has tied up with Quallcom to provide real time information to the fishing community in South India, Reuters is providing relevant content to farmers in Maharashtra and Punjab etc. The impact of these case studies is reported in the next chapter.
26 The government’s primary method of promoting universal access is through USOF, funded by a 5% levy on service providers’ gross revenue
27 Universal Service was one of the main objectives of the New Telecom Policy 1999 which envisaged the provision of fixed services to all at a reasonable price. The USOF is financed by a 5% levy on the adjusted gross revenue (AGR) of service providers. It became operational in April 2002. The Fund is to be utilized exclusively for meeting the Universal Service Obligation by providing access to telegraph services to people in the rural and remote areas at affordable and reasonable prices (www.dot.gov.in)
28 Measures to Improve Telecom Penetration in Rural India – The next 100 million subscribers, TRAI December 2008
29 Torero, Choudhary and Bedi (2002). Op cit
30 This is also the method followed in Ibid

21
India: The Impact of Mobile PhonesMoving the debate forward • The Policy Paper Series • Number 9 • January 2009
Senior Fellow, ICRIER
Dr. Surabhi Mittal
Consultant
Sanjay Gandhi
Dr. Surabhi Mittal is a Senior Fellow at ICRIER specialising in Agricultural Economics.
Researcher, ICRIER
Gaurav Tripathi
The impact of mobiles on agricultural productivity
Sanjay Gandhi is a consultant with expertise in private sector development, and technology and business strategy in emerging markets.
Gaurav Tripathi is a researcher at ICRIER
Introduction
The agricultural sector is critically important in any developing economy and no less so in India, where it contributes close to 20% of GDP and where 60% of the population depends on agriculture either directly or indirectly. As India urbanizes, the urgent need to alleviate poverty amongst both rural and urban populations makes it essential to catalyse agricultural productivity. The Indian agricultural sector, however, despite periods of strong growth in the past, has more recently experienced low productivity growth. Serious challenges must be addressed in order to achieve faster productivity growth, including infrastructure constraints, supply chain inefficiencies and also significant
problems in the diffusion of and access to information. Small-scale producers, who make up the vast majority of Indian farmers, are often unable to access information that could increase yields and lead to better prices for their crops.
The increasing penetration of mobile networks and handsets in India therefore presents an opportunity to make useful information more widely available. This could help agricultural markets operate more efficiently, and overcome some of the other challenges faced by the sector. A key backdrop to our investigation is the recent research by Robert Jensen examining the impact of mobile phone use by Kerala fishermen.1 Jensen found that the introduction of mobile phones decreased price dispersion and wastage by spreading information which made the markets more
22
India: The Impact of Mobile Phones Moving the debate forward • The Policy Paper Series • Number 9 • January 2009
efficient. Mobiles allow fishermen, particularly the somewhat more prosperous ones, to get timely price information and decide the best place to land and sell their daily catch. A more recent paper by Reuben Abraham also looking at Kerala fishermen found that widespread use of mobile phones increased the efficiency of markets by decreasing risk and uncertainty, although it noted that realizing the potential efficiencies depends on easy access to capital, especially at the production end of the supply chain.2
It is timely to take a fresh look at the impact of mobiles on agriculture in India because of the recent introduction of a number of mobile-enabled information services. These services deliver a wide range of information to farmers and fishermen.
This paper is the first to look at the impact of mobile phones across Indian agriculture, particularly for small farmers. The results are based on information collected through focus groups and interviews carried out in Uttar Pradesh, Rajasthan, Tamil Nadu, Maharashtra and the National Capital Region of New Delhi.
The questions we sought to address include:
• Which types of agricultural information have the most value for farmers and fishermen?
• Are mobile phones in practice being used much for agricultural purposes, and if so how?
• Have mobile phones helped drive agricultural productivity improvements for farmers and fishermen, and if so how?
• What constraints are there on the potential for mobile phones to improve agricultural productivity?
The answers to these questions have important implications for mobile operators, for information service providers, and for policy-makers. We found evidence that mobiles are being used in ways which contribute to productivity. However, the key message of our research is that leveraging the full potential of the greater access to information enabled by mobile – particularly for small producers – will require significant improvements in the supporting infrastructure and also in capacity-building amongst farmers to enable them to use the information they access more effectively.
Background
There are an estimated 127.3 million ‘cultivators’ in India.3 The majority of them are farmers subsisting on small plots of land less than 5 acres in size.4 Improving the livelihoods of small farmers has been a cornerstone of Indian government policy targets for many years and is imperative for social and economic development.
After experiencing strong growth for several decades until the 1980s, the agriculture sector has recently been growing more slowly. Its growth over the past two years has averaged just 2.5% compared with more than 8% for the economy as a whole. Agriculture’s share of GDP has declined from 48.7%
in 1950 to 18.7% in 2007. Indian states that experienced accelerating total factor productivity growth in crop sectors during the 1970s and 1980s have seen these growth rates decelerate since the early 1990s.5 Productivity growth has been hampered by major challenges including deficits in physical infrastructure, in the availability of agricultural inputs such as seed, fertiliser and services in rural areas, and in access to information. As Figure 1 indicates, all of these combine to create a communications and logistics environment for farming, of which access to information is just one part. Weaknesses at any point in the chain will limit potential gains elsewhere.
The weaknesses in the physical infrastructure include poor road and other transportation infrastructure, limited storage facilities, limited irrigation and inadequate wholesale marketplaces. A lack of refrigerated transport and cold storage causes post-harvest losses and inadequate market access for perishable commodities like fruits and vegetables. Only 40% of farms in India are irrigated.6 Tube wells, which have become the principal source of irrigation, are often ineffective due to frequent power shortages and unpredictable availability. Wholesale markets for agricultural produce often lack infrastructure for packing, grading and sorting, while middlemen dominate the supply chains and are the major price setters. Small farmers are often unaware of how prices are set and end up taking whatever price they are offered.7 When market price information is available to them, they are often unable to exploit the price disparities that exist between major and minor markets due to their inability to transport their produce to different markets.
The availability of necessary products and services is variable in rural India. Small farmers often struggle to access high-quality inputs such as advanced seed varieties, or services such as soil testing or credit. The lack of efficient distribution networks and easy road access means rural marketplaces are typically fragmented and geographically isolated. There are therefore significant hurdles to organisations seeking to supply these markets cost-effectively. The lack of availability of key inputs such as fertiliser has also given rise to concerns about the distribution and sale of counterfeit products.8 Poor farmers lacking in collateral and credit history find it difficult to obtain loans from formal financial institutions, and many of them depend on informal channels such as moneylenders or agricultural traders.9 This often results in farmers paying exorbitant interest rates and facing restrictions on where they can sell their crop.
Finally, there is very uneven access to information. A national survey of farmers found that only 40% of farmer households accessed information about modern agricultural techniques and inputs.10 The most common information source used by households accessing information was “other progressive farmers” followed by input dealers. (See Table 1).
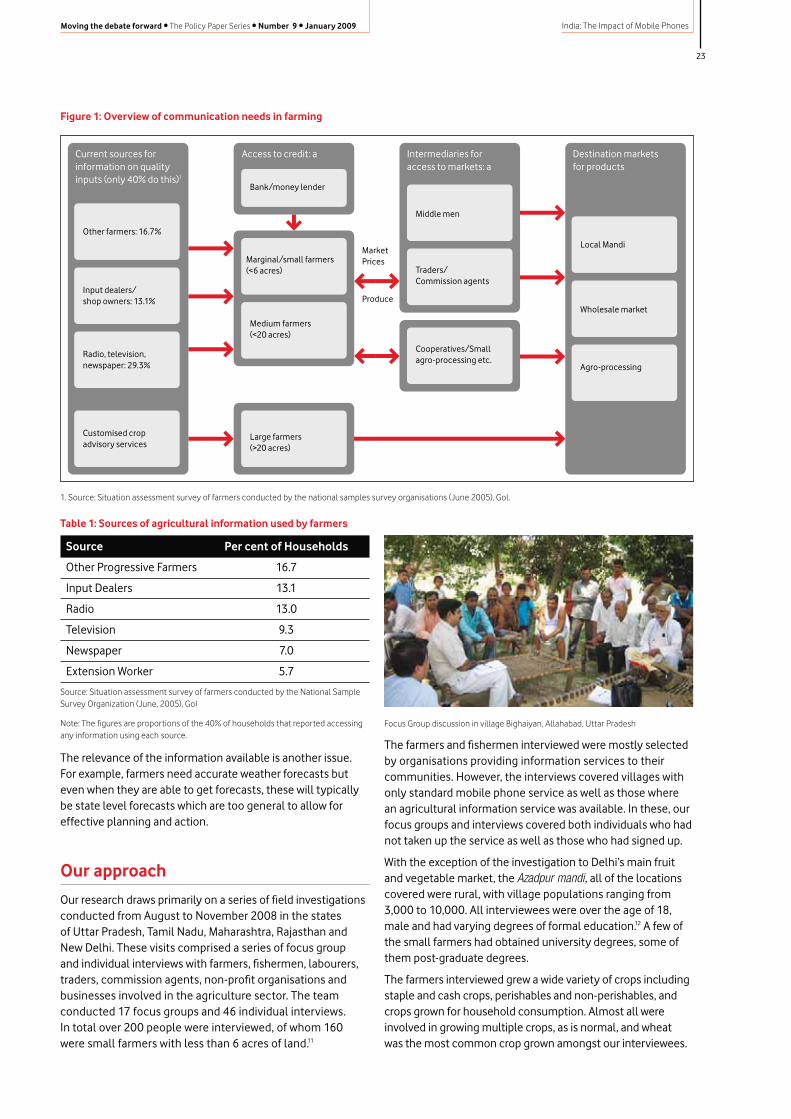
23
India: The Impact of Mobile PhonesMoving the debate forward • The Policy Paper Series • Number 9 • January 2009
Table 1: Sources of agricultural information used by farmers
Source Per cent of Households
Other Progressive Farmers 16.7
Input Dealers 13.1
Radio 13.0
Television 9.3
Newspaper 7.0
Extension Worker 5.7
Source: Situation assessment survey of farmers conducted by the National Sample Survey Organization (June, 2005), GoI
Note: The figures are proportions of the 40% of households that reported accessing any information using each source.
The relevance of the information available is another issue. For example, farmers need accurate weather forecasts but even when they are able to get forecasts, these will typically be state level forecasts which are too general to allow for effective planning and action.
Our approach
Our research draws primarily on a series of field investigations conducted from August to November 2008 in the states of Uttar Pradesh, Tamil Nadu, Maharashtra, Rajasthan and New Delhi. These visits comprised a series of focus group and individual interviews with farmers, fishermen, labourers, traders, commission agents, non-profit organisations and businesses involved in the agriculture sector. The team conducted 17 focus groups and 46 individual interviews. In total over 200 people were interviewed, of whom 160 were small farmers with less than 6 acres of land.11
The farmers and fishermen interviewed were mostly selected by organisations providing information services to their communities. However, the interviews covered villages with only standard mobile phone service as well as those where an agricultural information service was available. In these, our focus groups and interviews covered both individuals who had not taken up the service as well as those who had signed up.
With the exception of the investigation to Delhi’s main fruit and vegetable market, the Azadpur mandi, all of the locations covered were rural, with village populations ranging from 3,000 to 10,000. All interviewees were over the age of 18, male and had varying degrees of formal education.12 A few of the small farmers had obtained university degrees, some of them post-graduate degrees.
The farmers interviewed grew a wide variety of crops including staple and cash crops, perishables and non-perishables, and crops grown for household consumption. Almost all were involved in growing multiple crops, as is normal, and wheat was the most common crop grown amongst our interviewees.
Figure 1: Overview of communication needs in farming
1. Source: Situation assessment survey of farmers conducted by the national samples survey organisations (June 2005), Gol.
Middle men
Traders/Commission agents
Intermediaries for access to markets: a
Cooperatives/Smallagro-processing etc.
Current sources for information on quality inputs (only 40% do this)1
Other farmers: 16.7%
Radio, television, newspaper: 29.3%
Customised crop advisory services
Input dealers/shop owners: 13.1%
Destination marketsfor products
Local Mandi
Agro-processing
Wholesale market
Access to credit: a
Marginal/small farmers(<6 acres)
Bank/money lender
Medium farmers(<20 acres)
Large farmers(>20 acres)
MarketPrices
Produce
Focus Group discussion in village Bighaiyan, Allahabad, Uttar Pradesh

24
India: The Impact of Mobile Phones Moving the debate forward • The Policy Paper Series • Number 9 • January 2009
In Uttar Pradesh, farmers were often living in joint, multiple family households that ranged from 12 to 15 people. Family incomes typically varied from Rs. 2,000 month to Rs. 6,000 per month (US$40 to $120). At the low end, this represents roughly $1.30 US per day. In Maharashtra by contrast, the average household income of farmers interviewed ranged from Rs. 12,000 to 17,000 per month (US$240 to $34 – about US$8 to $11 per day) and average household size was fewer than 6 people. The interviewees in this region also had greater access to irrigation, storage facilities and credit, thus being both wealthier and much better connected to essential infrastructure.
The aim of the fieldwork was to look at the ways in which mobile can affect agricultural productivity, with a focus on smaller farmers. It was not intended to cover all regions of India or to be fully representative of rural Indian villages.
Table 2: Basic facts about regions covered
Region Population Percent Per Fixed Mobile Urban Capita Lines Lines GDP per 100 per 100 (Rs.) people people
Maharashtra 104.2 42.4 41,514 5.8 27.3
New Delhi – 15.9 93.2 66,431 14.4 96.9 NCR
Rajasthan 61.8 23.4 20,095 2.7 21.0
Tamil Nadu 64.9 44.0 34,424 5.8 12.8
Uttar Pradesh 181.9 20.8 15,383 1.4 3.7
India 1,106.0 27.8 29,617 3.4 22.8
Sources:
1. Population, per capita GDP (current and constant prices) Central Statistical Organization, Ministry of Statistics and Programme Implementation, GoI. Population and per capita GDP are for 2005–06.
2. Percent Urban is based on Census of India 2001 data
3. Mobile and Fixed Line data: Telecom Regulatory Authority of India (TRAI) for March 2008.
Partner organisations
These organisations were involved in selecting interviewees.
IFFCO (Indian Farmers Fertilisers Cooperatives Limited). A national organisation of rural co-operatives, which runs a mobile-enabled farmers’ information, service in partnership with Bharti Airtel, an Indian mobile operator. This service is called IKSL (IFFCO Kisan Sanchar Limited). It requires the farmers to purchase a special SIM card.13 They receive free voice-mails containing agricultural information as well as access to a paid helpline service costing Rs. 1 per minute.
Reuters. The global information services company operates an Indian-based mobile-enabled information business for farmers, Reuters Market Light (RML). Farmers purchase a 3 month, 6 month or 12 month subscription for which they receive daily agricultural information through text messages. Our field interviews were supplemented by interviews with Reuters’ staff in London and Maharashtra.
ITC. The Indian agribusiness company operates several models of a rural internet kiosk program, the “e-choupal”, serving farmers across rural India. The version investigated for this report was anchored upon an internet kiosk manned by a local farmer who acts as an agent for ITC (a “Sanchalak”). Through this agent, farmers can access agricultural information, buy inputs (seed, fertiliser, pesticide) and other retail products, and can sell selected crops directly to ITC. They are also exposed to demonstration plots and training sessions. There is no charge for the information and training sessions. Our field investigations were supplemented by interviews with staff in Gurgaon and Hyderabad.
MS Swaminathan Research Foundation (MSSRF). This non-governmental organisation is piloting a mobile-information services model for fishermen in partnership with Qualcomm, a global technology company, and Tata Teleservices, an Indian mobile phone operator. This program, Fisher friend, provides free mobile handsets to fishermen which they must share on a rotating basis, along with free access to the information service.
Figure 2: Interview and research locations
The following sections turn to the findings from the fieldwork, beginning with an overview of the types of information needs which were common to all the farmers in the different locations covered by our research. We then report how our interviewees perceived the specific mobile-based services before going on to consider the productivity impacts of mobile which emerged from the research.
Information needs in agriculture
The interviews and focus groups in the different areas described above indicated that producers need a wide range of information which varies through the growing season.
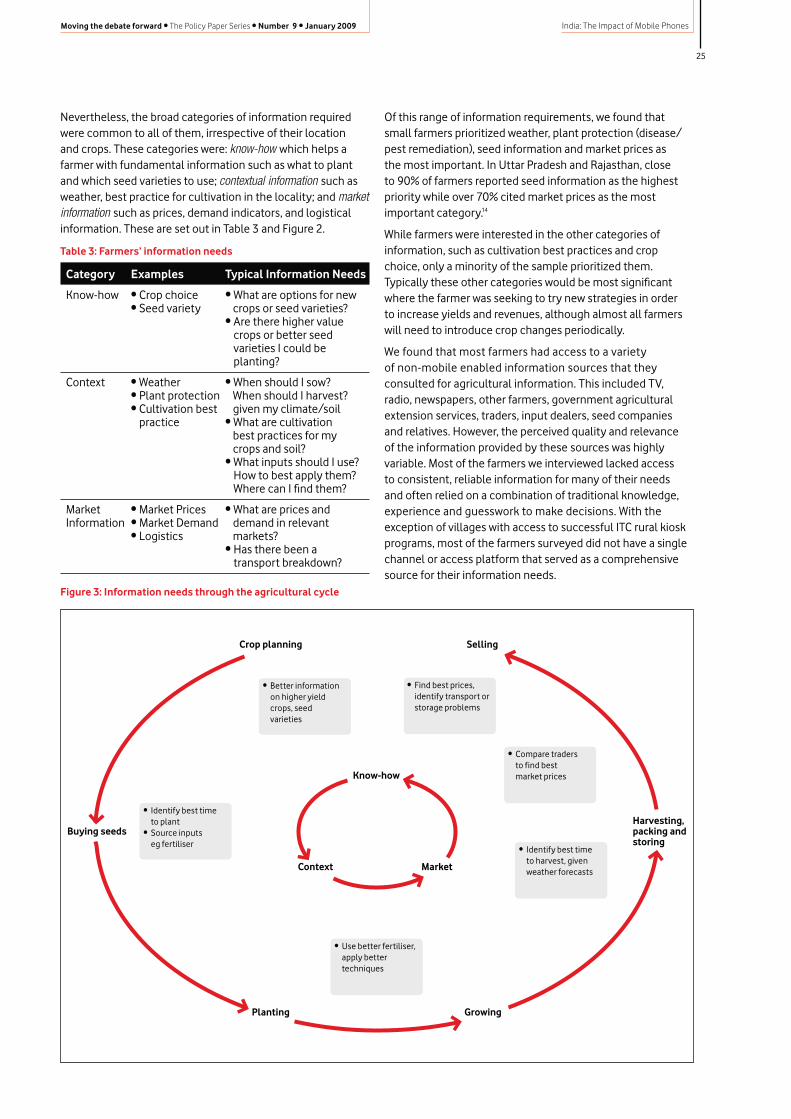
25
India: The Impact of Mobile PhonesMoving the debate forward • The Policy Paper Series • Number 9 • January 2009
Nevertheless, the broad categories of information required were common to all of them, irrespective of their location and crops. These categories were: know-how which helps a farmer with fundamental information such as what to plant and which seed varieties to use; contextual information such as weather, best practice for cultivation in the locality; and market information such as prices, demand indicators, and logistical information. These are set out in Table 3 and Figure 2.
Table 3: Farmers’ information needs
Category Examples Typical Information Needs
Know-how • Crop choice • What are options for new • Seed variety crops or seed varieties? • Are there higher value
crops or better seed varieties I could be planting?
Context • Weather • When should I sow? • Plant protection When should I harvest? • Cultivation best given my climate/soil
practice • What are cultivation best practices for my crops and soil? • What inputs should I use?
How to best apply them? Where can I find them?
Market • Market Prices • What are prices and Information • Market Demand demand in relevant • Logistics markets? • Has there been a
transport breakdown?
Of this range of information requirements, we found that small farmers prioritized weather, plant protection (disease/pest remediation), seed information and market prices as the most important. In Uttar Pradesh and Rajasthan, close to 90% of farmers reported seed information as the highest priority while over 70% cited market prices as the most important category.14
While farmers were interested in the other categories of information, such as cultivation best practices and crop choice, only a minority of the sample prioritized them. Typically these other categories would be most significant where the farmer was seeking to try new strategies in order to increase yields and revenues, although almost all farmers will need to introduce crop changes periodically.
We found that most farmers had access to a variety of non-mobile enabled information sources that they consulted for agricultural information. This included TV, radio, newspapers, other farmers, government agricultural extension services, traders, input dealers, seed companies and relatives. However, the perceived quality and relevance of the information provided by these sources was highly variable. Most of the farmers we interviewed lacked access to consistent, reliable information for many of their needs and often relied on a combination of traditional knowledge, experience and guesswork to make decisions. With the exception of villages with access to successful ITC rural kiosk programs, most of the farmers surveyed did not have a single channel or access platform that served as a comprehensive source for their information needs.
Figure 3: Information needs through the agricultural cycle
Crop planning
Buying seeds
Market
Growing
Selling
Know-how
Context
Harvesting,packing andstoring
Planting
• Better information on higher yield crops, seed varieties
• Identify best time to plant
• Source inputs eg fertiliser
• Use better fertiliser, apply better techniques
• Identify best time to harvest, given weather forecasts
• Compare traders to find best market prices
• Find best prices, identify transport or storage problems
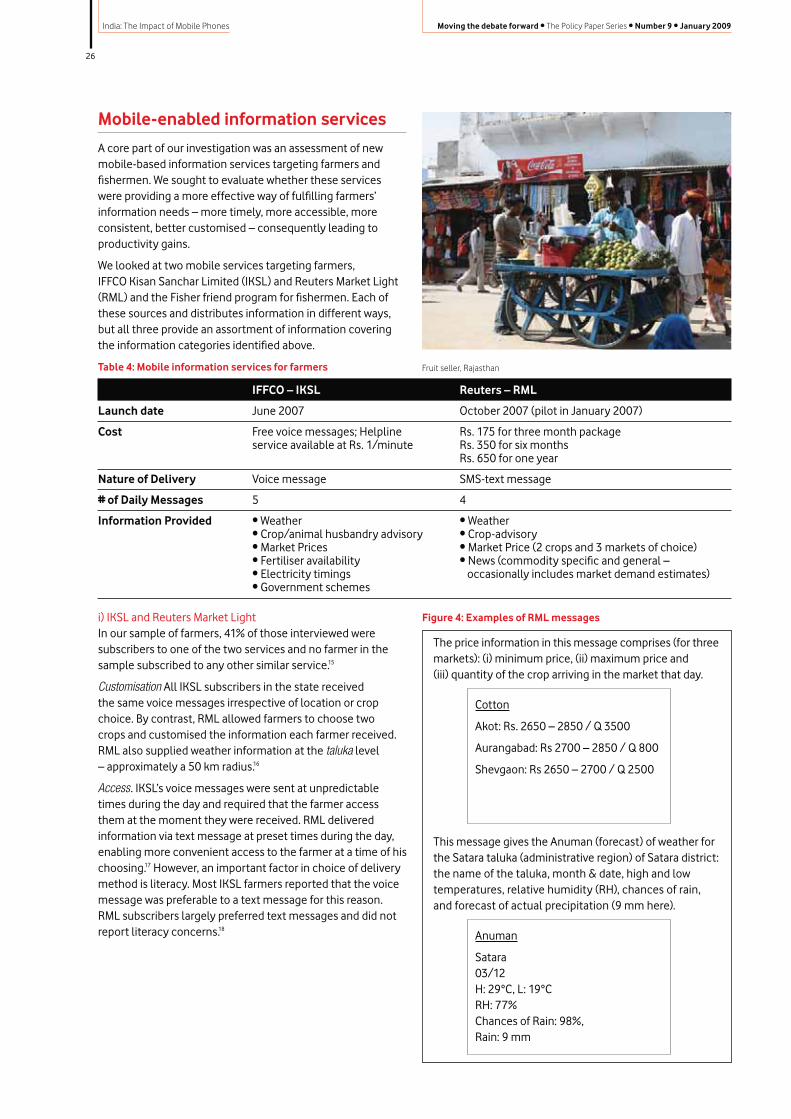
26
India: The Impact of Mobile Phones Moving the debate forward • The Policy Paper Series • Number 9 • January 2009
Mobile-enabled information services
A core part of our investigation was an assessment of new mobile-based information services targeting farmers and fishermen. We sought to evaluate whether these services were providing a more effective way of fulfilling farmers’ information needs – more timely, more accessible, more consistent, better customised – consequently leading to productivity gains.
We looked at two mobile services targeting farmers, IFFCO Kisan Sanchar Limited (IKSL) and Reuters Market Light (RML) and the Fisher friend program for fishermen. Each of these sources and distributes information in different ways, but all three provide an assortment of information covering the information categories identified above.
i) IKSL and Reuters Market LightIn our sample of farmers, 41% of those interviewed were subscribers to one of the two services and no farmer in the sample subscribed to any other similar service.15
Customisation All IKSL subscribers in the state received the same voice messages irrespective of location or crop choice. By contrast, RML allowed farmers to choose two crops and customised the information each farmer received. RML also supplied weather information at the taluka level – approximately a 50 km radius.16
Access. IKSL’s voice messages were sent at unpredictable times during the day and required that the farmer access them at the moment they were received. RML delivered information via text message at preset times during the day, enabling more convenient access to the farmer at a time of his choosing.17 However, an important factor in choice of delivery method is literacy. Most IKSL farmers reported that the voice message was preferable to a text message for this reason. RML subscribers largely preferred text messages and did not report literacy concerns.18
Table 4: Mobile information services for farmers
IFFCO – IKSL Reuters – RML
Launch date June 2007 October 2007 (pilot in January 2007)
Cost Free voice messages; Helpline Rs. 175 for three month package service available at Rs. 1/minute Rs. 350 for six months Rs. 650 for one year
Nature of Delivery Voice message SMS-text message
# of Daily Messages 5 4
Information Provided • Weather • Weather • Crop/animal husbandry advisory • Crop-advisory • Market Prices • Market Price (2 crops and 3 markets of choice) • Fertiliser availability • News (commodity specific and general – • Electricity timings occasionally includes market demand estimates) • Government schemes
Figure 4: Examples of RML messages
The price information in this message comprises (for three markets): (i) minimum price, (ii) maximum price and (iii) quantity of the crop arriving in the market that day.
Cotton
Akot: Rs. 2650 – 2850 / Q 3500
Aurangabad: Rs 2700 – 2850 / Q 800
Shevgaon: Rs 2650 – 2700 / Q 2500
This message gives the Anuman (forecast) of weather for the Satara taluka (administrative region) of Satara district: the name of the taluka, month & date, high and low temperatures, relative humidity (RH), chances of rain, and forecast of actual precipitation (9 mm here).
Anuman
Satara 03/12 H: 29°C, L: 19°C RH: 77% Chances of Rain: 98%, Rain: 9 mm
Fruit seller, Rajasthan

27
India: The Impact of Mobile PhonesMoving the debate forward • The Policy Paper Series • Number 9 • January 2009
Figure 5: Examples of IKSL messages in Uttar Pradesh (translated into English)
Weed Control in Paddy crop: Farmer Brothers, for weed control in paddy fields: Use khurpi or paddy-weeder. Weed-killing chemicals can also be used. For grasses and broad-leaved weeds use Butachlore 5: globules 30–40 kgs. per hectare or Pendimethalin 30 E.C. at the rate of 3.3 litres per hectare. Dissolve in 700–800 litres water and use within 3 to 4 days of sowing. Butachlore should only be used in 3–4 cm. of water. To control broad-leaved weeds only, use 2, 4, D Sodium Salt at the rate of 625 grams per hectare. This should be spread one week after planting the paddy field and 20 days after sowing direct.
Cultivation of Bananas: Those farmer brothers who want to cultivate bananas, they should choose land which is mainly alluvial or clay alluvial land with enough drainage. Also make sure there are sufficient wind barriers especially from the west otherwise hot-winds during May and June can harm and dry the leaves. Plant lines from east to west in order to minimize the chances of damage from hot wind. Banana is an excellent crop for an increased production per unit area in a short period and have a good yield. Grandnen banana is best for cultivation; green cover specie/variety is also good. Timely planting is key and should be grown between 15 June and 15 July. 3-month-old sword-shaped leaves containing fully developed and stout ghanankanda, are used for planting. Plants prepared through tissue-culture are best as they have good disease resistance.
Overall, we found a significant difference in subscribers’ perception of these two information services. The RML service was reported as having information better tailored to the subscriber as well as greater ease of access. The IKSL service was generally found to be more hit or miss in the value it delivered and was often described as lacking in relevance to farmers’ needs.
ii) Fisher friendFisher friend builds upon an existing service that provides information to fishermen through physical centres in fishing villages. The Fisher friend program relays the same information by mobile in order to solve the “last mile” problem for fishermen at sea.
Perceptions of the information service were overall mixed. This partly reflected technical challenges faced by the program that affected accessibility and the updating of information.19 And while fishermen reported varying levels of satisfaction with the different information categories provided, almost all fishermen interviewed who were able to access the service found value in the weather information provided and having mobile access at sea.
Impacts of mobile on agricultural productivity
Overall, our research indicated that mobile phones are starting to have an impact on agricultural productivity.
While most farmers reported that their mobile phones were primarily used for social purposes, almost all interviewees were using their mobiles for at least some agricultural activity, with some respondents citing significant productivity gains. Annex I ranks the information accessed by the interviewees on their mobile phones and compares it with the information accessed from other sources as reported in the NSS 59th round survey.20 Information regarding seeds is the most frequently accessed information in our sample. This is true of the NSS survey as well. Mandi (market) price is the second most important piece of information accessed by farmers in our sample, followed by plant protection and fertiliser application. While the rankings differs somewhat, information on fertiliser application and plant protection are also crucial in the NSS list. Although our sample is small, the nature and frequency of information accessed on the mobile bears close resemblance to the nature and frequency of information accessed by farming households in the NSS. The small sample means it is too early to state that mobile is an efficient substitute for most of the information needs of farmers, but our study clearly underlines the potential. Traders and commission agents comprised a segment making daily use of their mobile phones and offered some evidence that their mobile use was improving overall market efficiency. We also found that a number of fishermen were deriving safety as well as economic benefits (decreased potential losses, increased catch) from the ability to communicate and access information while at sea.
Table 5: Mobile information service for fishermen
FISHER FRIEND
Launch date December 2007 (pilot – still in pilot phase)
Cost Free (handsets and service)
Nature of Delivery Menu-based access (text)
Information provided • Weather (wave height, wind speed) • Market Prices • Optimal Fishing Zone (longitude and latitude) • Rural Yellow Pages • Government Schemes
Comments • Estimated range of service at sea is 5 nautical miles • Availability of information has been sporadic – at time of investigation
service had not been functioning every day
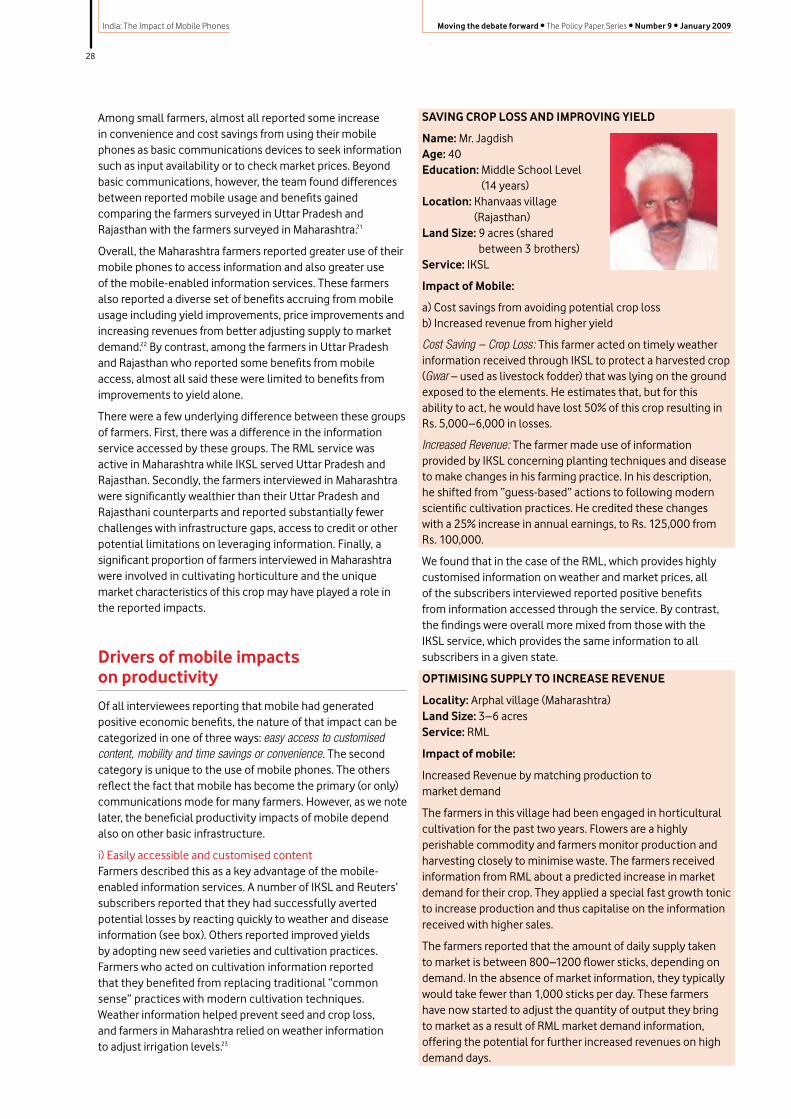
28
India: The Impact of Mobile Phones Moving the debate forward • The Policy Paper Series • Number 9 • January 2009
Among small farmers, almost all reported some increase in convenience and cost savings from using their mobile phones as basic communications devices to seek information such as input availability or to check market prices. Beyond basic communications, however, the team found differences between reported mobile usage and benefits gained comparing the farmers surveyed in Uttar Pradesh and Rajasthan with the farmers surveyed in Maharashtra.21
Overall, the Maharashtra farmers reported greater use of their mobile phones to access information and also greater use of the mobile-enabled information services. These farmers also reported a diverse set of benefits accruing from mobile usage including yield improvements, price improvements and increasing revenues from better adjusting supply to market demand.22 By contrast, among the farmers in Uttar Pradesh and Rajasthan who reported some benefits from mobile access, almost all said these were limited to benefits from improvements to yield alone.
There were a few underlying difference between these groups of farmers. First, there was a difference in the information service accessed by these groups. The RML service was active in Maharashtra while IKSL served Uttar Pradesh and Rajasthan. Secondly, the farmers interviewed in Maharashtra were significantly wealthier than their Uttar Pradesh and Rajasthani counterparts and reported substantially fewer challenges with infrastructure gaps, access to credit or other potential limitations on leveraging information. Finally, a significant proportion of farmers interviewed in Maharashtra were involved in cultivating horticulture and the unique market characteristics of this crop may have played a role in the reported impacts.
Drivers of mobile impacts on productivity
Of all interviewees reporting that mobile had generated positive economic benefits, the nature of that impact can be categorized in one of three ways: easy access to customised content, mobility and time savings or convenience. The second category is unique to the use of mobile phones. The others reflect the fact that mobile has become the primary (or only) communications mode for many farmers. However, as we note later, the beneficial productivity impacts of mobile depend also on other basic infrastructure.
i) Easily accessible and customised contentFarmers described this as a key advantage of the mobile-enabled information services. A number of IKSL and Reuters’ subscribers reported that they had successfully averted potential losses by reacting quickly to weather and disease information (see box). Others reported improved yields by adopting new seed varieties and cultivation practices. Farmers who acted on cultivation information reported that they benefited from replacing traditional “common sense” practices with modern cultivation techniques. Weather information helped prevent seed and crop loss, and farmers in Maharashtra relied on weather information to adjust irrigation levels.23
SAVING CROP LOSS AND IMPROVING YIELD
Name: Mr. JagdishAge: 40Education: Middle School Level
(14 years)Location: Khanvaas village
(Rajasthan)Land Size: 9 acres (shared
between 3 brothers)Service: IKSL
Impact of Mobile:
a) Cost savings from avoiding potential crop loss b) Increased revenue from higher yield
Cost Saving – Crop Loss: This farmer acted on timely weather information received through IKSL to protect a harvested crop (Gwar – used as livestock fodder) that was lying on the ground exposed to the elements. He estimates that, but for this ability to act, he would have lost 50% of this crop resulting in Rs. 5,000–6,000 in losses.
Increased Revenue: The farmer made use of information provided by IKSL concerning planting techniques and disease to make changes in his farming practice. In his description, he shifted from “guess-based” actions to following modern scientific cultivation practices. He credited these changes with a 25% increase in annual earnings, to Rs. 125,000 from Rs. 100,000.
We found that in the case of the RML, which provides highly customised information on weather and market prices, all of the subscribers interviewed reported positive benefits from information accessed through the service. By contrast, the findings were overall more mixed from those with the IKSL service, which provides the same information to all subscribers in a given state.
OPTIMISING SUPPLY TO INCREASE REVENUE
Locality: Arphal village (Maharashtra) Land Size: 3–6 acres Service: RML
Impact of mobile:
Increased Revenue by matching production to market demand
The farmers in this village had been engaged in horticultural cultivation for the past two years. Flowers are a highly perishable commodity and farmers monitor production and harvesting closely to minimise waste. The farmers received information from RML about a predicted increase in market demand for their crop. They applied a special fast growth tonic to increase production and thus capitalise on the information received with higher sales.
The farmers reported that the amount of daily supply taken to market is between 800–1200 flower sticks, depending on demand. In the absence of market information, they typically would take fewer than 1,000 sticks per day. These farmers have now started to adjust the quantity of output they bring to market as a result of RML market demand information, offering the potential for further increased revenues on high demand days.
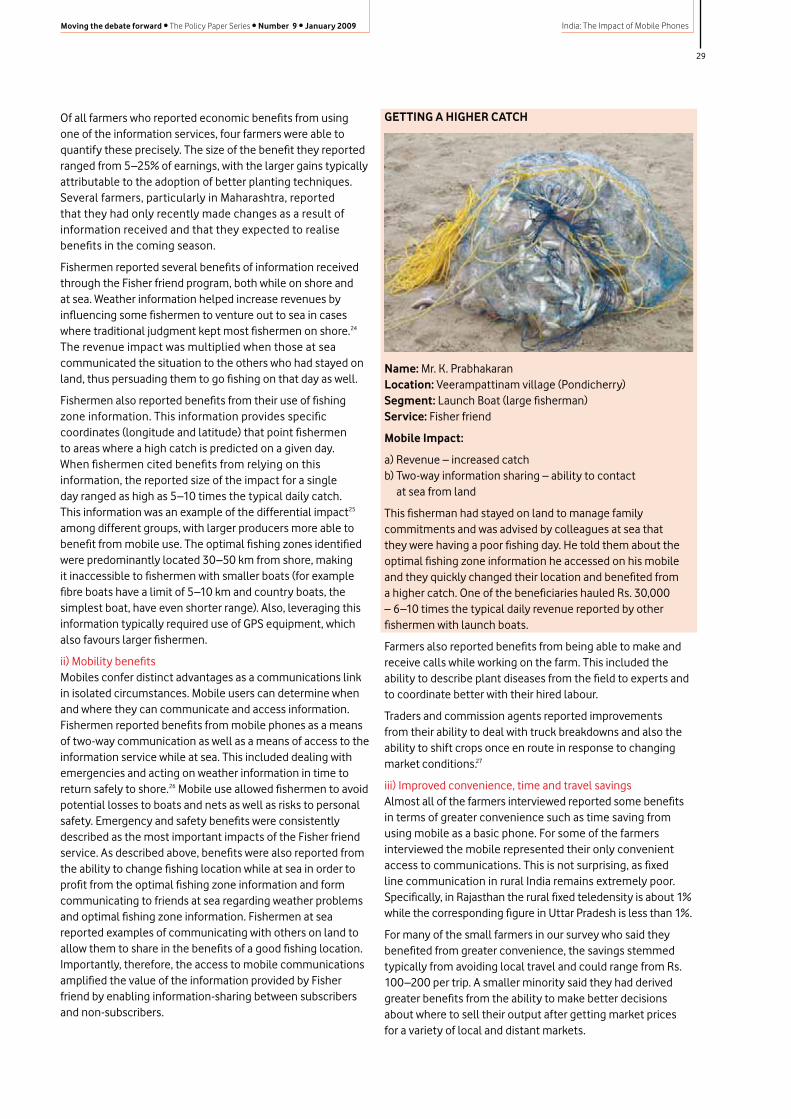
29
India: The Impact of Mobile PhonesMoving the debate forward • The Policy Paper Series • Number 9 • January 2009
Of all farmers who reported economic benefits from using one of the information services, four farmers were able to quantify these precisely. The size of the benefit they reported ranged from 5–25% of earnings, with the larger gains typically attributable to the adoption of better planting techniques. Several farmers, particularly in Maharashtra, reported that they had only recently made changes as a result of information received and that they expected to realise benefits in the coming season.
Fishermen reported several benefits of information received through the Fisher friend program, both while on shore and at sea. Weather information helped increase revenues by influencing some fishermen to venture out to sea in cases where traditional judgment kept most fishermen on shore.24 The revenue impact was multiplied when those at sea communicated the situation to the others who had stayed on land, thus persuading them to go fishing on that day as well.
Fishermen also reported benefits from their use of fishing zone information. This information provides specific coordinates (longitude and latitude) that point fishermen to areas where a high catch is predicted on a given day. When fishermen cited benefits from relying on this information, the reported size of the impact for a single day ranged as high as 5–10 times the typical daily catch. This information was an example of the differential impact25 among different groups, with larger producers more able to benefit from mobile use. The optimal fishing zones identified were predominantly located 30–50 km from shore, making it inaccessible to fishermen with smaller boats (for example fibre boats have a limit of 5–10 km and country boats, the simplest boat, have even shorter range). Also, leveraging this information typically required use of GPS equipment, which also favours larger fishermen.
ii) Mobility benefitsMobiles confer distinct advantages as a communications link in isolated circumstances. Mobile users can determine when and where they can communicate and access information. Fishermen reported benefits from mobile phones as a means of two-way communication as well as a means of access to the information service while at sea. This included dealing with emergencies and acting on weather information in time to return safely to shore.26 Mobile use allowed fishermen to avoid potential losses to boats and nets as well as risks to personal safety. Emergency and safety benefits were consistently described as the most important impacts of the Fisher friend service. As described above, benefits were also reported from the ability to change fishing location while at sea in order to profit from the optimal fishing zone information and form communicating to friends at sea regarding weather problems and optimal fishing zone information. Fishermen at sea reported examples of communicating with others on land to allow them to share in the benefits of a good fishing location. Importantly, therefore, the access to mobile communications amplified the value of the information provided by Fisher friend by enabling information-sharing between subscribers and non-subscribers.
GETTING A HIGHER CATCH
Name: Mr. K. PrabhakaranLocation: Veerampattinam village (Pondicherry)Segment: Launch Boat (large fisherman) Service: Fisher friend
Mobile Impact:
a) Revenue – increased catch b) Two-way information sharing – ability to contact
at sea from land
This fisherman had stayed on land to manage family commitments and was advised by colleagues at sea that they were having a poor fishing day. He told them about the optimal fishing zone information he accessed on his mobile and they quickly changed their location and benefited from a higher catch. One of the beneficiaries hauled Rs. 30,000 – 6–10 times the typical daily revenue reported by other fishermen with launch boats.
Farmers also reported benefits from being able to make and receive calls while working on the farm. This included the ability to describe plant diseases from the field to experts and to coordinate better with their hired labour.
Traders and commission agents reported improvements from their ability to deal with truck breakdowns and also the ability to shift crops once en route in response to changing market conditions.27
iii) Improved convenience, time and travel savingsAlmost all of the farmers interviewed reported some benefits in terms of greater convenience such as time saving from using mobile as a basic phone. For some of the farmers interviewed the mobile represented their only convenient access to communications. This is not surprising, as fixed line communication in rural India remains extremely poor. Specifically, in Rajasthan the rural fixed teledensity is about 1% while the corresponding figure in Uttar Pradesh is less than 1%.
For many of the small farmers in our survey who said they benefited from greater convenience, the savings stemmed typically from avoiding local travel and could range from Rs. 100–200 per trip. A smaller minority said they had derived greater benefits from the ability to make better decisions about where to sell their output after getting market prices for a variety of local and distant markets.
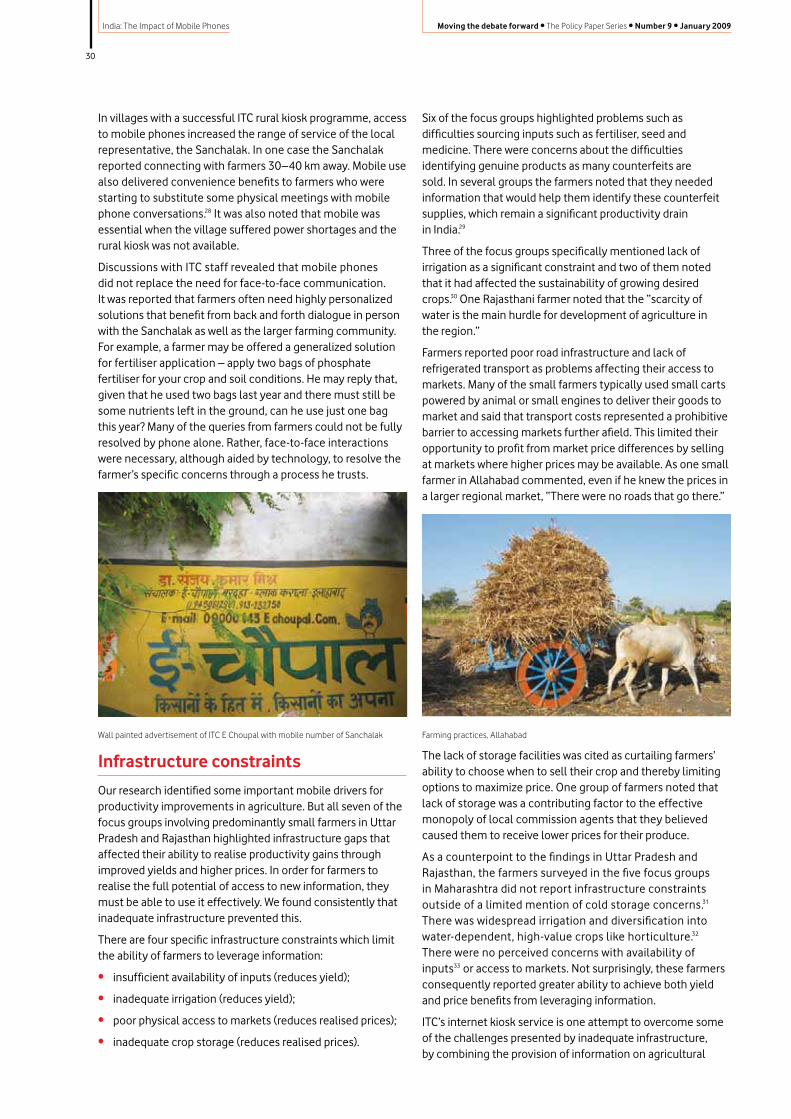
30
India: The Impact of Mobile Phones Moving the debate forward • The Policy Paper Series • Number 9 • January 2009
In villages with a successful ITC rural kiosk programme, access to mobile phones increased the range of service of the local representative, the Sanchalak. In one case the Sanchalak reported connecting with farmers 30–40 km away. Mobile use also delivered convenience benefits to farmers who were starting to substitute some physical meetings with mobile phone conversations.28 It was also noted that mobile was essential when the village suffered power shortages and the rural kiosk was not available.
Discussions with ITC staff revealed that mobile phones did not replace the need for face-to-face communication. It was reported that farmers often need highly personalized solutions that benefit from back and forth dialogue in person with the Sanchalak as well as the larger farming community. For example, a farmer may be offered a generalized solution for fertiliser application – apply two bags of phosphate fertiliser for your crop and soil conditions. He may reply that, given that he used two bags last year and there must still be some nutrients left in the ground, can he use just one bag this year? Many of the queries from farmers could not be fully resolved by phone alone. Rather, face-to-face interactions were necessary, although aided by technology, to resolve the farmer’s specific concerns through a process he trusts.
Infrastructure constraints
Our research identified some important mobile drivers for productivity improvements in agriculture. But all seven of the focus groups involving predominantly small farmers in Uttar Pradesh and Rajasthan highlighted infrastructure gaps that affected their ability to realise productivity gains through improved yields and higher prices. In order for farmers to realise the full potential of access to new information, they must be able to use it effectively. We found consistently that inadequate infrastructure prevented this.
There are four specific infrastructure constraints which limit the ability of farmers to leverage information:
• insufficient availability of inputs (reduces yield);
• inadequate irrigation (reduces yield);
• poor physical access to markets (reduces realised prices);
• inadequate crop storage (reduces realised prices).
Six of the focus groups highlighted problems such as difficulties sourcing inputs such as fertiliser, seed and medicine. There were concerns about the difficulties identifying genuine products as many counterfeits are sold. In several groups the farmers noted that they needed information that would help them identify these counterfeit supplies, which remain a significant productivity drain in India.29
Three of the focus groups specifically mentioned lack of irrigation as a significant constraint and two of them noted that it had affected the sustainability of growing desired crops.30 One Rajasthani farmer noted that the “scarcity of water is the main hurdle for development of agriculture in the region.”
Farmers reported poor road infrastructure and lack of refrigerated transport as problems affecting their access to markets. Many of the small farmers typically used small carts powered by animal or small engines to deliver their goods to market and said that transport costs represented a prohibitive barrier to accessing markets further afield. This limited their opportunity to profit from market price differences by selling at markets where higher prices may be available. As one small farmer in Allahabad commented, even if he knew the prices in a larger regional market, “There were no roads that go there.”
The lack of storage facilities was cited as curtailing farmers’ ability to choose when to sell their crop and thereby limiting options to maximize price. One group of farmers noted that lack of storage was a contributing factor to the effective monopoly of local commission agents that they believed caused them to receive lower prices for their produce.
As a counterpoint to the findings in Uttar Pradesh and Rajasthan, the farmers surveyed in the five focus groups in Maharashtra did not report infrastructure constraints outside of a limited mention of cold storage concerns.31 There was widespread irrigation and diversification into water-dependent, high-value crops like horticulture.32 There were no perceived concerns with availability of inputs33 or access to markets. Not surprisingly, these farmers consequently reported greater ability to achieve both yield and price benefits from leveraging information.
ITC’s internet kiosk service is one attempt to overcome some of the challenges presented by inadequate infrastructure, by combining the provision of information on agricultural
Wall painted advertisement of ITC E Choupal with mobile number of Sanchalak Farming practices, Allahabad

31
India: The Impact of Mobile PhonesMoving the debate forward • The Policy Paper Series • Number 9 • January 2009
practices with other services like insurance along with direct sale of inputs. Recognizing the problems faced by the small farmers in their supply chain, the internet kiosk model includes information delivery, input provision and direct procurement. It seeks to overcome infrastructure constraints by bringing markets to the farmer. Farmers we interviewed in villages with successful ITC programs reported yield improvements and price improvements as a result of the kiosk program. The primary benefits reported were the introduction of hybrid seed varieties and adoption of new farming practices, leading to productivity gains between 10–40%. Farmers noted that by receiving comparative market pricing information as well as a firm price offer in advance from ITC, they had greater ability to choose when and where to sell their products. They also benefited from being to sell to ITC locally and getting transport costs reimbursed.
Other constraints
Inadequate infrastructure was the constraint most often cited by farmers as limiting their ability to realise the full productivity potential of improved access to information, but other issues were also raised over the course of our investigation. In particular, two of these stood out.
i) Access to creditA lack of formal credit can prevent purchase of important inputs and can also reduce the farmer’s chances of getting the best price because of restrictions (explicit or implicit) on where he can sell his crop.34 Access to credit was a problem raised by the majority of small farmer focus groups, although we were unable to evaluate reliably what difference this hurdle made to price received. We heard many contradictory responses as to whether or not farmers were bonded and thus had to sell to a specific trader, commission agent or moneylender who had extended them credit earlier in the year.
ii) Capacity for risk-takingMany farmers are naturally cautious, especially poorer and more vulnerable ones. However, in order for information to drive agricultural productivity, farmers must be willing to try new strategies which may include new farming
Table 6: Example of the ITC ‘e-choupal’ model – Wheat in Uttar Pradesh
Problem Examples Solution
Lack of consistent, • Inputs, disease, sophisticated farming • Information provision through e-choupal reliable information practices, accurate weather reports • Other services (soil-testing, advice) • market prices (in advance of market arrival) available through regional hubs
Lack of availability • Seed, fertiliser, pesticide, fungicide, • Supply of inputs provided of inputs weedicide, medicine
Access to Markets • Crowded physical marketplace (could • Direct procurement by ITC and Storage take 2–3 days to enter) • Deal negotiated at time of farmer’s choosing • lack of storage (less leverage over when • Transport costs reimbursed to sell – worse for perishable products) • Transport costs to non-local markets
Middlemen dominate • Unfair practices – higher transaction costs, • Direct procurement the supply chain lower amount paid to producer • Transparent pricing known in advance • Payment based on gradations of quality
Source: Interviews, Team analysis. Note: The specific range of services provided can vary among individual e-choupals.
techniques. While we found a small number who had made changes based on the information they received via their mobile phones, there were some who expressed reluctance to try new approaches even when they had acquired relevant information. ITC staff said that in their experience persuading small farmers to adopt new seed varieties or farming methods often requires a combination of approaches: repeated dissemination of information, demonstration plots and farmer dialogues. Several focus groups in villages where hybrid seed had been introduced noted that the seed companies also promoted diffusion of the seeds through demonstration plots and capacity building measures. It therefore seems likely that for broader rural productivity gains a set of similar capacity-building activities to complement the basic information provision will be required.
Looking ahead
Over the course of the research we found a number of emerging ideas and applications for mobile phones that showed potential for the future.
• One example involved the use of camera phones to take photos of crop diseases/pest infestations and send them to experts immediately. This visual information can improve diagnosis and advice.35
• ITC has been piloting a new virtual commodity exchange, Tradersnet, that enables direct buying and selling of coffee by producers and wholesale purchasers through an internet based trading platform. SMS messages are sent to users’ mobile phones every morning with the offers and grades available for purchase on that day. At the end of the day, users receive a text message with details of what actually took place. ITC had expected that exchange members would use the internet to access the electronic exchange to execute transactions. However, while members would use the internet for research a number of them were not comfortable using it for transactions. Instead, they would call ITC representatives via their mobiles to execute trades on their behalf. One future option is to enable all actions

32
India: The Impact of Mobile Phones Moving the debate forward • The Policy Paper Series • Number 9 • January 2009
to take place on mobile phones, thus taking advantage of perceived higher comfort levels that users have with their phones over PCs.
• In addition, ITC is considering whether and how mobile phones can extend the rural kiosk program. One possibility is to get farmers to feed personal information into the system via their mobile phones, enabling the efficient delivery of highly customised information back to their mobiles. The information could be updated, allowing for continual adjustment and tailoring to the information the farmer receives. Mobile phones could extend both the reach and possibly functionality of the current e-choupal model and may be critical in ITC achieving its goal of reaching 100,000 villages.36
One key element in these examples is leveraging the portability, flexible content delivery capability and two-way communications characteristics of mobile phones to deliver low-cost but highly customised solutions. One interviewee stressed that for a true revolution to occur with mobile phones in agriculture, mobility in particular was critical: farmers must be able to get information delivered to them at a time and place of their choosing.
Conclusions
Even at this early stage, mobile phones are being used in Indian agriculture and are starting to deliver agricultural productivity improvements, an impact which is enhanced by the new mobile-enabled information services. The most common benefit of mobile found in the research was derived from the use of mobile phones as a basic communications device as for many of the farmers interviewed, it was the only convenient phone access they had. There are significant examples of a range of benefits arising from the use of mobiles in the context of rural India – not only from mobility, but also easy access to customised content and convenience.
Realization of the full potential impact of mobile phones is limited, however, by a set of constraints that prevent farmers from fully leveraging the information they receive. The barriers apply more to small than to large farmers; large farmers are more able to leverage the benefits of the communications and information they can access.
The constraints include shortcomings in physical infrastructure affecting access to markets, storage and irrigation. Issues also arise with the availability to small farmers of critical products and services including seeds, fertilisers, medicines and credit. Equally, to make full use of the potential information delivered, farmers must have sufficient risk-taking capacity to be willing to experiment with the new strategies and ideas disseminated. Social networks may play an important role in building the trust and confidence required to influence the adoption of new mindsets and actions by small farmers. In addition basic information will need to be supplemented by a range of other activities such as demonstrations and broader communications efforts.
This array of constraints means that additional interventions may be required to improve agricultural productivity growth. Increased public and private investment will be necessary to resolve critical infrastructure gaps. Policy changes may also be needed to encourage better access to high-quality inputs and credit for small farmers. Increased extension services and capacity-building efforts can complement information dissemination via mobile phones and associated services to accelerate the adoption of new techniques.
However, even in the case of poor farmers facing significant constraints we found that there were still opportunities to realise productivity gains from the adoption of new farming practices and actions to mitigate crop losses. In the case of fishermen, there were, in addition to economic benefits, safety benefits and enhanced quality of life from decreased isolation and vulnerability.
There are also lessons for current and future mobile-enabled information service providers about the information of greatest value to users in the agricultural sector.
• Customisation and frequent updating add substantial value. Generic information triggers dissatisfaction and reduces the frequency with which farmers access the service. The most frequent criticism we heard was that information was old and routine.
• Secondly, where literacy concerns are not paramount, text messaging offers significant advantages over voice-based delivery in terms of convenience and content flexibility.
• Finally, information should be in the local language and any platform should be intuitive for subscribers to understand. Most of the farmers we interviewed were prepared to pay for information services as long as they felt that they would get the information they wanted – relevant, timely and reliable.
There are some important questions which were not covered by our research. One is the extent to which information is shared by farmers who use mobile phones with those who do not. As continued mobile penetration encourages more information access and diffusion, further research may be able to evaluate if ultimately a tipping point will be reached, amplifying the impact of mobiles on productivity and farm revenues. Finally, it may be useful to consider whether and how much mobile phones may be increasing overall market efficiency reflected in decreasing price dispersion in wholesale agricultural markets.
This study provided a first look at the potential for mobile phones to affect productivity in the agricultural sector as a whole. We saw many examples of benefits created by the characteristics of mobility, customised content delivery and convenience. As mobile penetration continues to increase among farming communities and information services continue to adapt and proliferate, the scope exists for a much greater rural productivity impact in future, but achieving the full productivity potential will depend on reducing other constraints which limit the use of the information farmers and fishermen can obtain from their mobile phones.
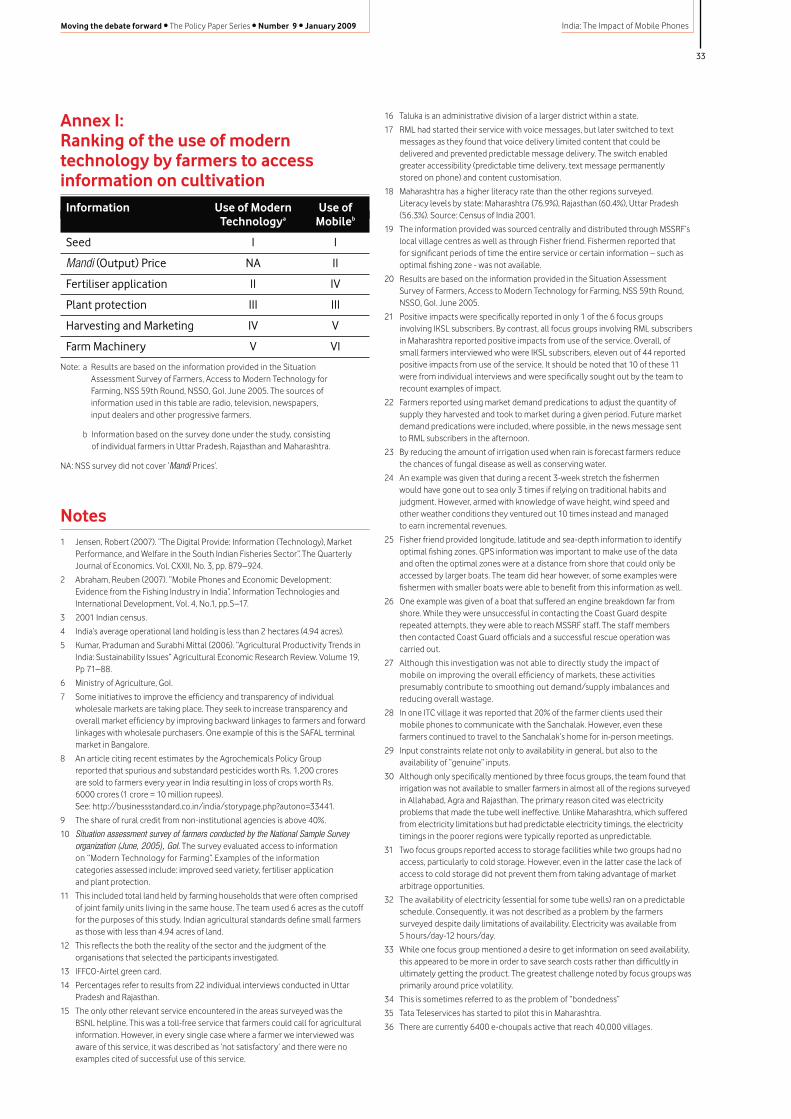
33
India: The Impact of Mobile PhonesMoving the debate forward • The Policy Paper Series • Number 9 • January 2009
Annex I: Ranking of the use of modern technology by farmers to access information on cultivation Information Use of Modern Use of Technologya Mobileb
Seed I I
Mandi (Output) Price NA II
Fertiliser application II IV
Plant protection III III
Harvesting and Marketing IV V
Farm Machinery V VI
Note: a Results are based on the information provided in the Situation Assessment Survey of Farmers, Access to Modern Technology for Farming, NSS 59th Round, NSSO, GoI. June 2005. The sources of information used in this table are radio, television, newspapers, input dealers and other progressive farmers.
b Information based on the survey done under the study, consisting of individual farmers in Uttar Pradesh, Rajasthan and Maharashtra.
NA: NSS survey did not cover ‘Mandi Prices’.
Notes1 Jensen, Robert (2007). “The Digital Provide: Information (Technology), Market
Performance, and Welfare in the South Indian Fisheries Sector”. The Quarterly Journal of Economics. Vol. CXXII, No. 3, pp. 879–924.
2 Abraham, Reuben (2007). “Mobile Phones and Economic Development: Evidence from the Fishing Industry in India”. Information Technologies and International Development, Vol. 4, No.1, pp.5–17.
3 2001 Indian census.
4 India’s average operational land holding is less than 2 hectares (4.94 acres).
5 Kumar, Praduman and Surabhi Mittal (2006). “Agricultural Productivity Trends in India: Sustainability Issues” Agricultural Economic Research Review. Volume 19, Pp 71–88.
6 Ministry of Agriculture, GoI.
7 Some initiatives to improve the efficiency and transparency of individual wholesale markets are taking place. They seek to increase transparency and overall market efficiency by improving backward linkages to farmers and forward linkages with wholesale purchasers. One example of this is the SAFAL terminal market in Bangalore.
8 An article citing recent estimates by the Agrochemicals Policy Group reported that spurious and substandard pesticides worth Rs. 1,200 crores are sold to farmers every year in India resulting in loss of crops worth Rs. 6000 crores (1 crore = 10 million rupees). See: http://businessstandard.co.in/india/storypage.php?autono=33441.
9 The share of rural credit from non-institutional agencies is above 40%.
10 Situation assessment survey of farmers conducted by the National Sample Survey organization (June, 2005), GoI . The survey evaluated access to information on “Modern Technology for Farming”. Examples of the information categories assessed include: improved seed variety, fertiliser application and plant protection.
11 This included total land held by farming households that were often comprised of joint family units living in the same house. The team used 6 acres as the cutoff for the purposes of this study. Indian agricultural standards define small farmers as those with less than 4.94 acres of land.
12 This reflects the both the reality of the sector and the judgment of the organisations that selected the participants investigated.
13 IFFCO-Airtel green card.
14 Percentages refer to results from 22 individual interviews conducted in Uttar Pradesh and Rajasthan.
15 The only other relevant service encountered in the areas surveyed was the BSNL helpline. This was a toll-free service that farmers could call for agricultural information. However, in every single case where a farmer we interviewed was aware of this service, it was described as ‘not satisfactory’ and there were no examples cited of successful use of this service.
16 Taluka is an administrative division of a larger district within a state.
17 RML had started their service with voice messages, but later switched to text messages as they found that voice delivery limited content that could be delivered and prevented predictable message delivery. The switch enabled greater accessibility (predictable time delivery, text message permanently stored on phone) and content customisation.
18 Maharashtra has a higher literacy rate than the other regions surveyed. Literacy levels by state: Maharashtra (76.9%), Rajasthan (60.4%), Uttar Pradesh (56.3%). Source: Census of India 2001.
19 The information provided was sourced centrally and distributed through MSSRF’s local village centres as well as through Fisher friend. Fishermen reported that for significant periods of time the entire service or certain information – such as optimal fishing zone - was not available.
20 Results are based on the information provided in the Situation Assessment Survey of Farmers, Access to Modern Technology for Farming, NSS 59th Round, NSSO, GoI. June 2005.
21 Positive impacts were specifically reported in only 1 of the 6 focus groups involving IKSL subscribers. By contrast, all focus groups involving RML subscribers in Maharashtra reported positive impacts from use of the service. Overall, of small farmers interviewed who were IKSL subscribers, eleven out of 44 reported positive impacts from use of the service. It should be noted that 10 of these 11 were from individual interviews and were specifically sought out by the team to recount examples of impact.
22 Farmers reported using market demand predications to adjust the quantity of supply they harvested and took to market during a given period. Future market demand predications were included, where possible, in the news message sent to RML subscribers in the afternoon.
23 By reducing the amount of irrigation used when rain is forecast farmers reduce the chances of fungal disease as well as conserving water.
24 An example was given that during a recent 3-week stretch the fishermen would have gone out to sea only 3 times if relying on traditional habits and judgment. However, armed with knowledge of wave height, wind speed and other weather conditions they ventured out 10 times instead and managed to earn incremental revenues.
25 Fisher friend provided longitude, latitude and sea-depth information to identify optimal fishing zones. GPS information was important to make use of the data and often the optimal zones were at a distance from shore that could only be accessed by larger boats. The team did hear however, of some examples were fishermen with smaller boats were able to benefit from this information as well.
26 One example was given of a boat that suffered an engine breakdown far from shore. While they were unsuccessful in contacting the Coast Guard despite repeated attempts, they were able to reach MSSRF staff. The staff members then contacted Coast Guard officials and a successful rescue operation was carried out.
27 Although this investigation was not able to directly study the impact of mobile on improving the overall efficiency of markets, these activities presumably contribute to smoothing out demand/supply imbalances and reducing overall wastage.
28 In one ITC village it was reported that 20% of the farmer clients used their mobile phones to communicate with the Sanchalak. However, even these farmers continued to travel to the Sanchalak’s home for in-person meetings.
29 Input constraints relate not only to availability in general, but also to the availability of “genuine” inputs.
30 Although only specifically mentioned by three focus groups, the team found that irrigation was not available to smaller farmers in almost all of the regions surveyed in Allahabad, Agra and Rajasthan. The primary reason cited was electricity problems that made the tube well ineffective. Unlike Maharashtra, which suffered from electricity limitations but had predictable electricity timings, the electricity timings in the poorer regions were typically reported as unpredictable.
31 Two focus groups reported access to storage facilities while two groups had no access, particularly to cold storage. However, even in the latter case the lack of access to cold storage did not prevent them from taking advantage of market arbitrage opportunities.
32 The availability of electricity (essential for some tube wells) ran on a predictable schedule. Consequently, it was not described as a problem by the farmers surveyed despite daily limitations of availability. Electricity was available from 5 hours/day-12 hours/day.
33 While one focus group mentioned a desire to get information on seed availability, this appeared to be more in order to save search costs rather than difficultly in ultimately getting the product. The greatest challenge noted by focus groups was primarily around price volatility.
34 This is sometimes referred to as the problem of “bondedness”
35 Tata Teleservices has started to pilot this in Maharashtra.
36 There are currently 6400 e-choupals active that reach 40,000 villages.

34
India: The Impact of Mobile Phones Moving the debate forward • The Policy Paper Series • Number 9 • January 2009
A survey of usage of mobile in poor urban areasIndia is an increasingly urban country, with over half a billion people expected to live in towns and cities by 2020. More than one fifth of the urban population lives in slum areas, and in some major cities the slum areas account for almost half the population. With large numbers of migrants arriving from the countryside in search of better opportunities, the slums are growing.
This makes the economic and social dynamism of the slums a central issue for development. The key policy question is whether life in the slums can become the focal point for an economic and social transformation which will alleviate poverty. The alternative is that they will remain traps of despair and poverty. The rapid urbanization of the Indian population and the consequent strain on urban infrastructure means that the economic and social plight of those living in the slums will be one of the defining characteristics of India during the next twenty years.
This context makes it crucial to develop public policies and private opportunities which will allow slum dwellers to find ways to address their particular needs. This paper seeks to analyse the uptake and use of mobile telephony within some of India’s urban slums, and its effect on the economic and social lives of their inhabitants. Few innovations have become as pervasive as quickly as the mobile phone. While there is much anecdotal evidence on the ways mobile use can improve the social and economic status of poor people, there is little systematic evidence on the benefits of mobiles for these groups.
Through a large survey covering 1774 people in 84 very poor areas in three metropolitan cities (Delhi, Ahmedabad and Kolkata); this study focuses on understanding the social and economic impacts of mobiles on them.
The primary research question is: What has been the impact of mobiles on users living in urban slums? The study focuses on the social and economic impacts of mobiles on the lives of poor urban dwellers. The purpose was to understand how mobiles affect the way slum residents conduct their social and economic lives and the returns that they derive from their economic activities. The survey questions aimed to:
• understand the determinants of ownership and usage;
• measure the perceived impacts of using a mobile;
• understand how these impacts came about.
The results suggest that mobile users in slums by and large view their mobiles positively and derive more benefits from this usage than the amount they spend. A majority of respondents believe that the of use mobiles has led to an improvement in their economic situation. Not surprisingly, transaction-intensive activities that require communication and the gathering of information are most affected by mobiles. For example, nearly 60% of users engaged in self-employed activities report a positive impact in terms of earnings.1 Users report a positive effect of mobiles not only in reducing costs associated with doing work, such as lower travel costs and better information regarding prices, but also on their ability to co-ordinate with the people they work with,
Professor, Indian Institute of Management (IIM), Ahmedabad.
Prof. Rekha Jain
Professor, Indian Institute of Management (IIM), Ahmedabad.
Prof. Ankur Sarin
Rekha Jain is Professor, Indian Institute of Management, Ahmedabad, India and the Executive Chair of the IIMA-IDEA Telecom Centre of Excellence.
Ankur Sarin is a Professor at the Indian Institute of Management (IIM) in Ahmedabad.
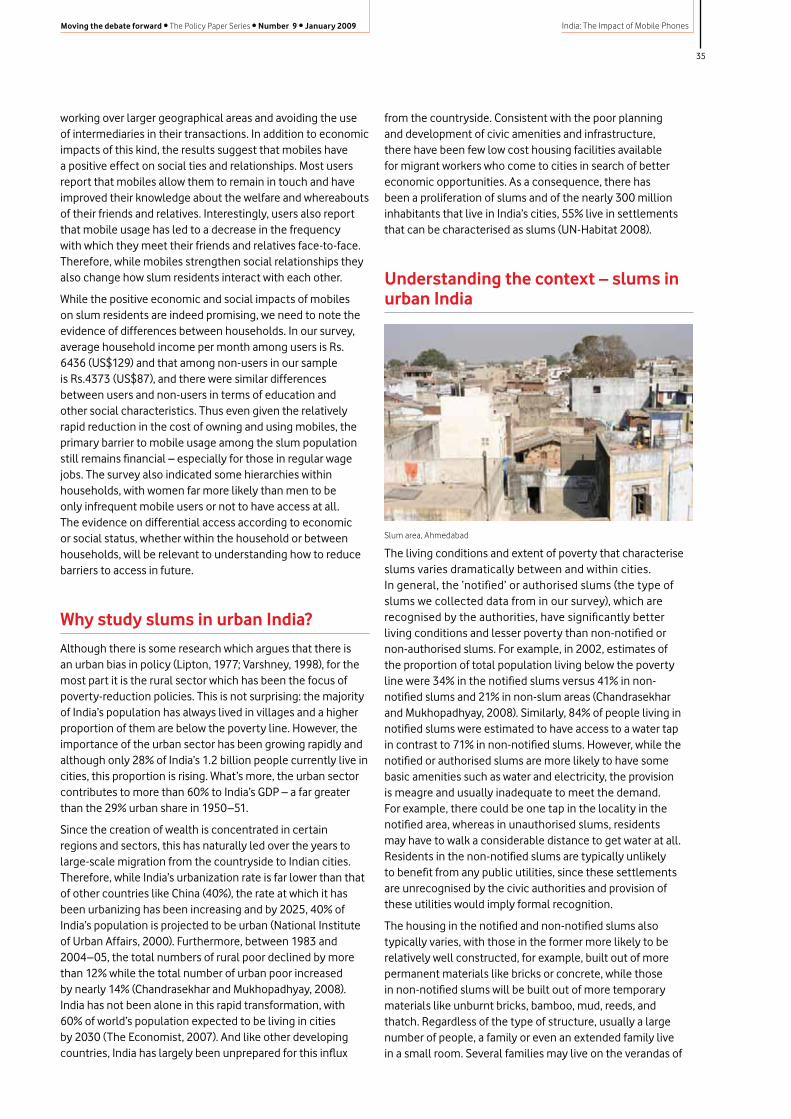
35
India: The Impact of Mobile PhonesMoving the debate forward • The Policy Paper Series • Number 9 • January 2009
working over larger geographical areas and avoiding the use of intermediaries in their transactions. In addition to economic impacts of this kind, the results suggest that mobiles have a positive effect on social ties and relationships. Most users report that mobiles allow them to remain in touch and have improved their knowledge about the welfare and whereabouts of their friends and relatives. Interestingly, users also report that mobile usage has led to a decrease in the frequency with which they meet their friends and relatives face-to-face. Therefore, while mobiles strengthen social relationships they also change how slum residents interact with each other.
While the positive economic and social impacts of mobiles on slum residents are indeed promising, we need to note the evidence of differences between households. In our survey, average household income per month among users is Rs. 6436 (US$129) and that among non-users in our sample is Rs.4373 (US$87), and there were similar differences between users and non-users in terms of education and other social characteristics. Thus even given the relatively rapid reduction in the cost of owning and using mobiles, the primary barrier to mobile usage among the slum population still remains financial – especially for those in regular wage jobs. The survey also indicated some hierarchies within households, with women far more likely than men to be only infrequent mobile users or not to have access at all. The evidence on differential access according to economic or social status, whether within the household or between households, will be relevant to understanding how to reduce barriers to access in future.
Why study slums in urban India?
Although there is some research which argues that there is an urban bias in policy (Lipton, 1977; Varshney, 1998), for the most part it is the rural sector which has been the focus of poverty-reduction policies. This is not surprising: the majority of India’s population has always lived in villages and a higher proportion of them are below the poverty line. However, the importance of the urban sector has been growing rapidly and although only 28% of India’s 1.2 billion people currently live in cities, this proportion is rising. What’s more, the urban sector contributes to more than 60% to India’s GDP – a far greater than the 29% urban share in 1950–51.
Since the creation of wealth is concentrated in certain regions and sectors, this has naturally led over the years to large-scale migration from the countryside to Indian cities. Therefore, while India’s urbanization rate is far lower than that of other countries like China (40%), the rate at which it has been urbanizing has been increasing and by 2025, 40% of India’s population is projected to be urban (National Institute of Urban Affairs, 2000). Furthermore, between 1983 and 2004–05, the total numbers of rural poor declined by more than 12% while the total number of urban poor increased by nearly 14% (Chandrasekhar and Mukhopadhyay, 2008). India has not been alone in this rapid transformation, with 60% of world’s population expected to be living in cities by 2030 (The Economist, 2007). And like other developing countries, India has largely been unprepared for this influx
from the countryside. Consistent with the poor planning and development of civic amenities and infrastructure, there have been few low cost housing facilities available for migrant workers who come to cities in search of better economic opportunities. As a consequence, there has been a proliferation of slums and of the nearly 300 million inhabitants that live in India’s cities, 55% live in settlements that can be characterised as slums (UN-Habitat 2008).
Understanding the context – slums in urban India
The living conditions and extent of poverty that characterise slums varies dramatically between and within cities. In general, the ‘notified’ or authorised slums (the type of slums we collected data from in our survey), which are recognised by the authorities, have significantly better living conditions and lesser poverty than non-notified or non-authorised slums. For example, in 2002, estimates of the proportion of total population living below the poverty line were 34% in the notified slums versus 41% in non-notified slums and 21% in non-slum areas (Chandrasekhar and Mukhopadhyay, 2008). Similarly, 84% of people living in notified slums were estimated to have access to a water tap in contrast to 71% in non-notified slums. However, while the notified or authorised slums are more likely to have some basic amenities such as water and electricity, the provision is meagre and usually inadequate to meet the demand. For example, there could be one tap in the locality in the notified area, whereas in unauthorised slums, residents may have to walk a considerable distance to get water at all. Residents in the non-notified slums are typically unlikely to benefit from any public utilities, since these settlements are unrecognised by the civic authorities and provision of these utilities would imply formal recognition.
The housing in the notified and non-notified slums also typically varies, with those in the former more likely to be relatively well constructed, for example, built out of more permanent materials like bricks or concrete, while those in non-notified slums will be built out of more temporary materials like unburnt bricks, bamboo, mud, reeds, and thatch. Regardless of the type of structure, usually a large number of people, a family or even an extended family live in a small room. Several families may live on the verandas of
Slum area, Ahmedabad

36
India: The Impact of Mobile Phones Moving the debate forward • The Policy Paper Series • Number 9 • January 2009
such houses. In both cases the common space is heavily used. There is little or no personal space and household assets (such as TV and radio) are shared by all the family.
Given the living conditions, it is not surprising that it is the poor among urban residents who are likely to inhabit the slums. Many of the slum dwellers, lacking the skills and capabilities required in the new growth areas of the economy, are usually absorbed in the low-paying informal sectors. Such jobs are not regular, offer little security, and are often exploitative. Most people have no savings and few assets and therefore rely on the vagaries of the labour market for income. As is the case in most Indian labour markets, gender, caste, training and education are the determinants of access to jobs. The types of jobs available to them may be irregular, dependent on the type of neighborhood (construction site, industrial area), and the availability of capital among the self-employed. Often people living in such areas may have to commute long distances for work, as sometimes the slums are right on the periphery of cities.
Social life in slums
Slum dwellers face a difficult social life, not only because of overcrowding but also because of the high competition for shared resources (such as water), the threat of eviction, their insecure or non-existent job tenures, and the need to re-establish social links in a new environment as they move away from their roots. Support from family and community based networks and safety net systems (developed over generations in rural villages) may be limited and the precarious nature of their work and dwellings makes them even more vulnerable. Although some slum residents live in clearly defined occupational or caste based groupings, others do not (Loughhead and Mittal, 2001).
For slum dwellers, it is often not only education, skills and health that determine their ability to cope with vulnerabilities, but also their own capacity to deal with emergent situations. For example, they may not be in a position to take a risk such as forgoing current earning opportunities in order to enhance their skills for a potentially higher earning job in the future. The immediate imperative to earn a living, coupled with natural caution, also determines whether they can exploit new business opportunities. For example, their decisions regarding who to sell their services or goods to may be determined by who they already trust (lower risk than a new supplier they do not know even if willing to give them a better price). A person who has a better provision for their finances may be able to take on additional risk.
The socio-economic context of mobile use in urban slums
Our underlying assumption is that the social and economic context of slums will drive the adoption and usage of mobiles in ways that are different from other sections of the population in other locations. Due to the fact that there is so much sharing of space and other assets, we could expect that
mobiles may be used as a shared service, especially since the handset costs might be a deterrent to acquisition for personal use. We also expect that the communication patterns will be determined by migration amongst other factors. For example, where male migrants have moved to cities, they would need to communicate with their immediate families left behind. There would be a need to communicate not only about their welfare, but also about the status of any remittances they might have sent. Even when entire families migrate to cities, they may well have roots in rural areas or smaller towns and perhaps be involved in supporting the larger family in their place of origin.
Furthermore, we expect that the type of economic activity mobile users are engaged in will determine the adoption and usage. Since many of them are involved in informal activities, the ability to be in touch with sources of job opportunities is critical. Competition for such activities (such as casual labor) is fierce. This puts further pressure on those seeking jobs to be in touch with the source of the opportunity. If they are self employed, or work as sub contractors, then the ability to coordinate with their suppliers and customers is important, as there may be no formal contracts to ensure service or payment, making them extremely vulnerable. Further, since residents of slums probably commute for their work, coordination could help them reduce their travel costs. Since slum dwellers are very susceptible to harsh financial circumstances and have poor living conditions, they may frequently need to contact sources of help to cope with these. The possible frequent need to address financial or non-financial emergencies could drive adoption and use of mobile.
Methodology
The survey sought to compare the experiences and current status of a group of self-selected users and non-users living in slums in the three cities. Households in which there is at least one member who uses mobiles regularly – defined as using a mobile at least once a week – were classified as ‘user’ households and other households were classified as ‘non-user’ households.2 Care should therefore be taken in interpreting the differences between users and non-users in the results reported below. Since the use of mobile phones is a choice that individuals make, the group of users and non-users could systematically differ from each other in more ways than just mobile usage. While some of these, like earnings and education can be controlled and accounted for, others, which are difficult to measure and observe, cannot. For example, people using mobiles are likely to have chosen to use them because of higher perceived or real impacts. Similarly people using a mobile phone might simply be more motivated to improve their life-conditions or be informed about how to do so than non-users. Therefore, attributing any observed difference in outcomes between users and non-users just to mobile use becomes problematic in the presence of other (possibly unobservable and immeasurable) attributes that are correlated both with mobile use and the outcomes being considered. However, differences between the two groups can be regarded as due partly to the impact of mobiles.
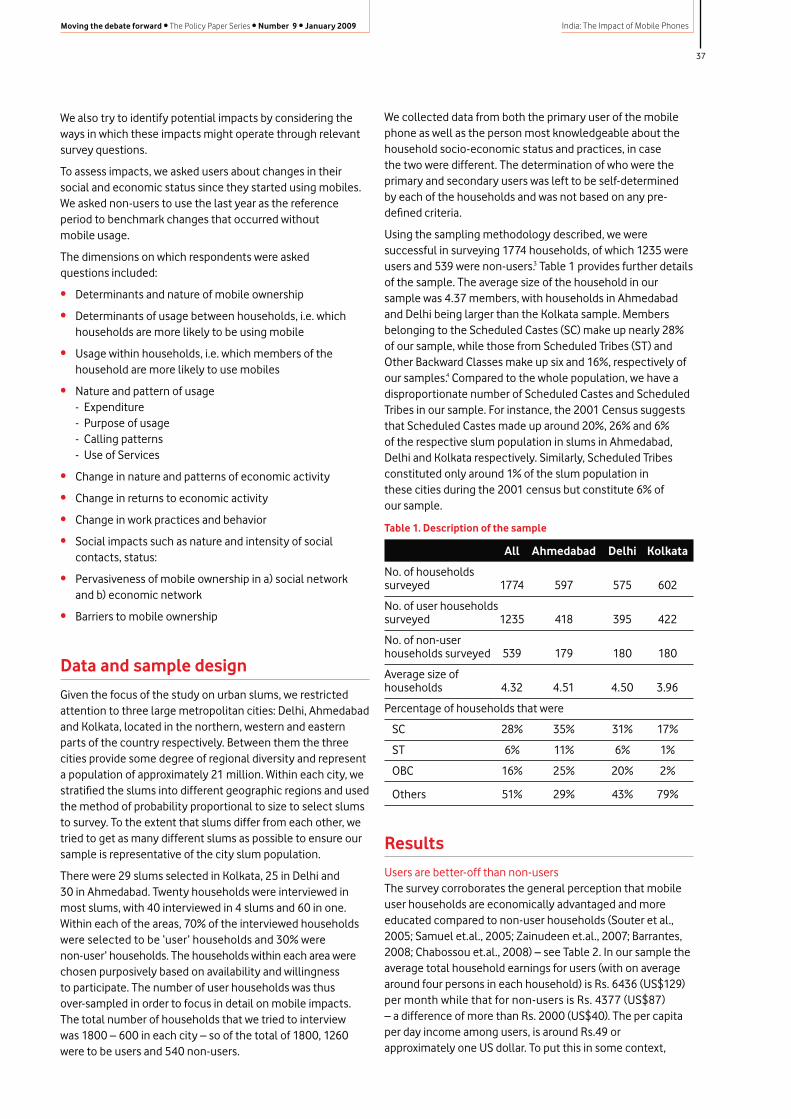
37
India: The Impact of Mobile PhonesMoving the debate forward • The Policy Paper Series • Number 9 • January 2009
We also try to identify potential impacts by considering the ways in which these impacts might operate through relevant survey questions.
To assess impacts, we asked users about changes in their social and economic status since they started using mobiles. We asked non-users to use the last year as the reference period to benchmark changes that occurred without mobile usage.
The dimensions on which respondents were asked questions included:
• Determinants and nature of mobile ownership
• Determinants of usage between households, i.e. which households are more likely to be using mobile
• Usage within households, i.e. which members of the household are more likely to use mobiles
• Nature and pattern of usage - Expenditure - Purpose of usage - Calling patterns - Use of Services
• Change in nature and patterns of economic activity
• Change in returns to economic activity
• Change in work practices and behavior
• Social impacts such as nature and intensity of social contacts, status:
• Pervasiveness of mobile ownership in a) social network and b) economic network
• Barriers to mobile ownership
Data and sample design
Given the focus of the study on urban slums, we restricted attention to three large metropolitan cities: Delhi, Ahmedabad and Kolkata, located in the northern, western and eastern parts of the country respectively. Between them the three cities provide some degree of regional diversity and represent a population of approximately 21 million. Within each city, we stratified the slums into different geographic regions and used the method of probability proportional to size to select slums to survey. To the extent that slums differ from each other, we tried to get as many different slums as possible to ensure our sample is representative of the city slum population.
There were 29 slums selected in Kolkata, 25 in Delhi and 30 in Ahmedabad. Twenty households were interviewed in most slums, with 40 interviewed in 4 slums and 60 in one. Within each of the areas, 70% of the interviewed households were selected to be ‘user’ households and 30% were non-user’ households. The households within each area were chosen purposively based on availability and willingness to participate. The number of user households was thus over-sampled in order to focus in detail on mobile impacts. The total number of households that we tried to interview was 1800 – 600 in each city – so of the total of 1800, 1260 were to be users and 540 non-users.
We collected data from both the primary user of the mobile phone as well as the person most knowledgeable about the household socio-economic status and practices, in case the two were different. The determination of who were the primary and secondary users was left to be self-determined by each of the households and was not based on any pre-defined criteria.
Using the sampling methodology described, we were successful in surveying 1774 households, of which 1235 were users and 539 were non-users.3 Table 1 provides further details of the sample. The average size of the household in our sample was 4.37 members, with households in Ahmedabad and Delhi being larger than the Kolkata sample. Members belonging to the Scheduled Castes (SC) make up nearly 28% of our sample, while those from Scheduled Tribes (ST) and Other Backward Classes make up six and 16%, respectively of our samples.4 Compared to the whole population, we have a disproportionate number of Scheduled Castes and Scheduled Tribes in our sample. For instance, the 2001 Census suggests that Scheduled Castes made up around 20%, 26% and 6% of the respective slum population in slums in Ahmedabad, Delhi and Kolkata respectively. Similarly, Scheduled Tribes constituted only around 1% of the slum population in these cities during the 2001 census but constitute 6% of our sample.
Table 1. Description of the sample
All Ahmedabad Delhi Kolkata
No. of households surveyed 1774 597 575 602
No. of user households surveyed 1235 418 395 422
No. of non-user households surveyed 539 179 180 180
Average size of households 4.32 4.51 4.50 3.96
Percentage of households that were
SC 28% 35% 31% 17%
ST 6% 11% 6% 1%
OBC 16% 25% 20% 2%
Others 51% 29% 43% 79%
Results
Users are better-off than non-usersThe survey corroborates the general perception that mobile user households are economically advantaged and more educated compared to non-user households (Souter et al., 2005; Samuel et.al., 2005; Zainudeen et.al., 2007; Barrantes, 2008; Chabossou et.al., 2008) – see Table 2. In our sample the average total household earnings for users (with on average around four persons in each household) is Rs. 6436 (US$129) per month while that for non-users is Rs. 4377 (US$87) – a difference of more than Rs. 2000 (US$40). The per capita per day income among users, is around Rs.49 or approximately one US dollar. To put this in some context,
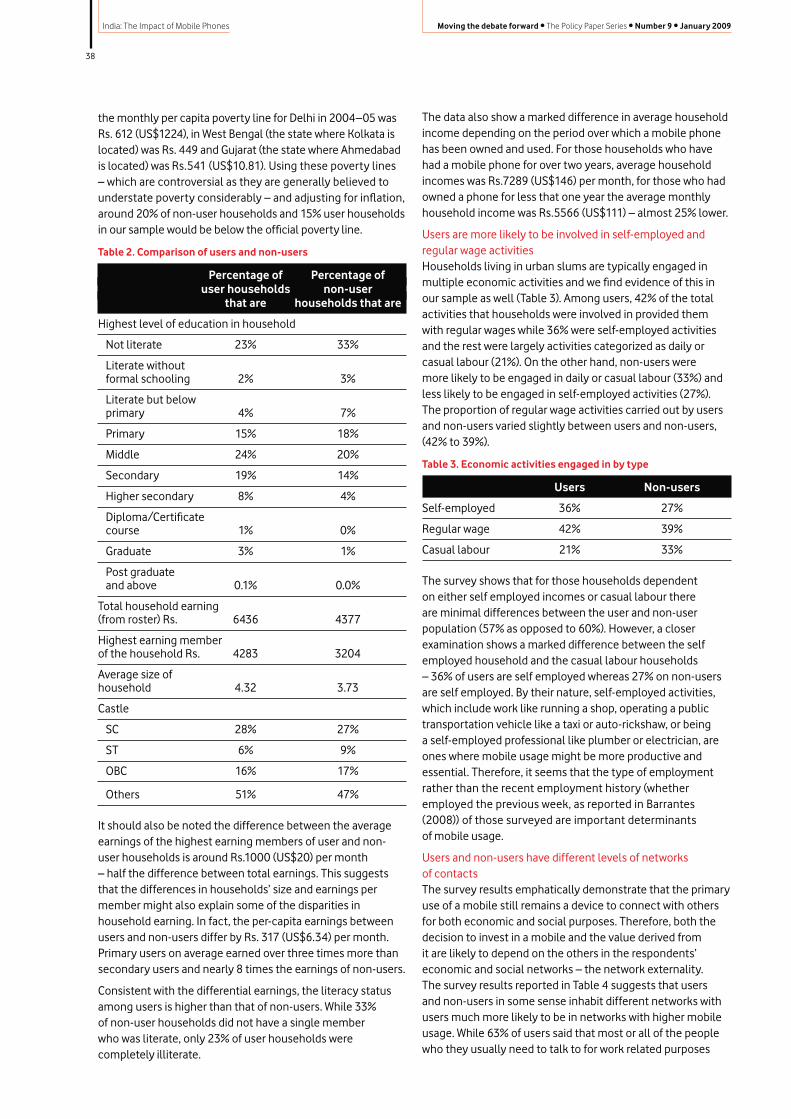
38
India: The Impact of Mobile Phones Moving the debate forward • The Policy Paper Series • Number 9 • January 2009
the monthly per capita poverty line for Delhi in 2004–05 was Rs. 612 (US$1224), in West Bengal (the state where Kolkata is located) was Rs. 449 and Gujarat (the state where Ahmedabad is located) was Rs.541 (US$10.81). Using these poverty lines – which are controversial as they are generally believed to understate poverty considerably – and adjusting for inflation, around 20% of non-user households and 15% user households in our sample would be below the official poverty line.
Table 2. Comparison of users and non-users
Percentage of Percentage of user households non-user that are households that are
Highest level of education in household
Not literate 23% 33%
Literate without formal schooling 2% 3%
Literate but below primary 4% 7%
Primary 15% 18%
Middle 24% 20%
Secondary 19% 14%
Higher secondary 8% 4%
Diploma/Certificate course 1% 0%
Graduate 3% 1%
Post graduate and above 0.1% 0.0%
Total household earning (from roster) Rs. 6436 4377
Highest earning member of the household Rs. 4283 3204
Average size of household 4.32 3.73
Castle
SC 28% 27%
ST 6% 9%
OBC 16% 17%
Others 51% 47%
It should also be noted the difference between the average earnings of the highest earning members of user and non-user households is around Rs.1000 (US$20) per month – half the difference between total earnings. This suggests that the differences in households’ size and earnings per member might also explain some of the disparities in household earning. In fact, the per-capita earnings between users and non-users differ by Rs. 317 (US$6.34) per month. Primary users on average earned over three times more than secondary users and nearly 8 times the earnings of non-users.
Consistent with the differential earnings, the literacy status among users is higher than that of non-users. While 33% of non-user households did not have a single member who was literate, only 23% of user households were completely illiterate.
The data also show a marked difference in average household income depending on the period over which a mobile phone has been owned and used. For those households who have had a mobile phone for over two years, average household incomes was Rs.7289 (US$146) per month, for those who had owned a phone for less that one year the average monthly household income was Rs.5566 (US$111) – almost 25% lower.
Users are more likely to be involved in self-employed and regular wage activitiesHouseholds living in urban slums are typically engaged in multiple economic activities and we find evidence of this in our sample as well (Table 3). Among users, 42% of the total activities that households were involved in provided them with regular wages while 36% were self-employed activities and the rest were largely activities categorized as daily or casual labour (21%). On the other hand, non-users were more likely to be engaged in daily or casual labour (33%) and less likely to be engaged in self-employed activities (27%). The proportion of regular wage activities carried out by users and non-users varied slightly between users and non-users, (42% to 39%).
Table 3. Economic activities engaged in by type
Users Non-users
Self-employed 36% 27%
Regular wage 42% 39%
Casual labour 21% 33%
The survey shows that for those households dependent on either self employed incomes or casual labour there are minimal differences between the user and non-user population (57% as opposed to 60%). However, a closer examination shows a marked difference between the self employed household and the casual labour households – 36% of users are self employed whereas 27% on non-users are self employed. By their nature, self-employed activities, which include work like running a shop, operating a public transportation vehicle like a taxi or auto-rickshaw, or being a self-employed professional like plumber or electrician, are ones where mobile usage might be more productive and essential. Therefore, it seems that the type of employment rather than the recent employment history (whether employed the previous week, as reported in Barrantes (2008)) of those surveyed are important determinants of mobile usage.
Users and non-users have different levels of networks of contactsThe survey results emphatically demonstrate that the primary use of a mobile still remains a device to connect with others for both economic and social purposes. Therefore, both the decision to invest in a mobile and the value derived from it are likely to depend on the others in the respondents’ economic and social networks – the network externality. The survey results reported in Table 4 suggests that users and non-users in some sense inhabit different networks with users much more likely to be in networks with higher mobile usage. While 63% of users said that most or all of the people who they usually need to talk to for work related purposes
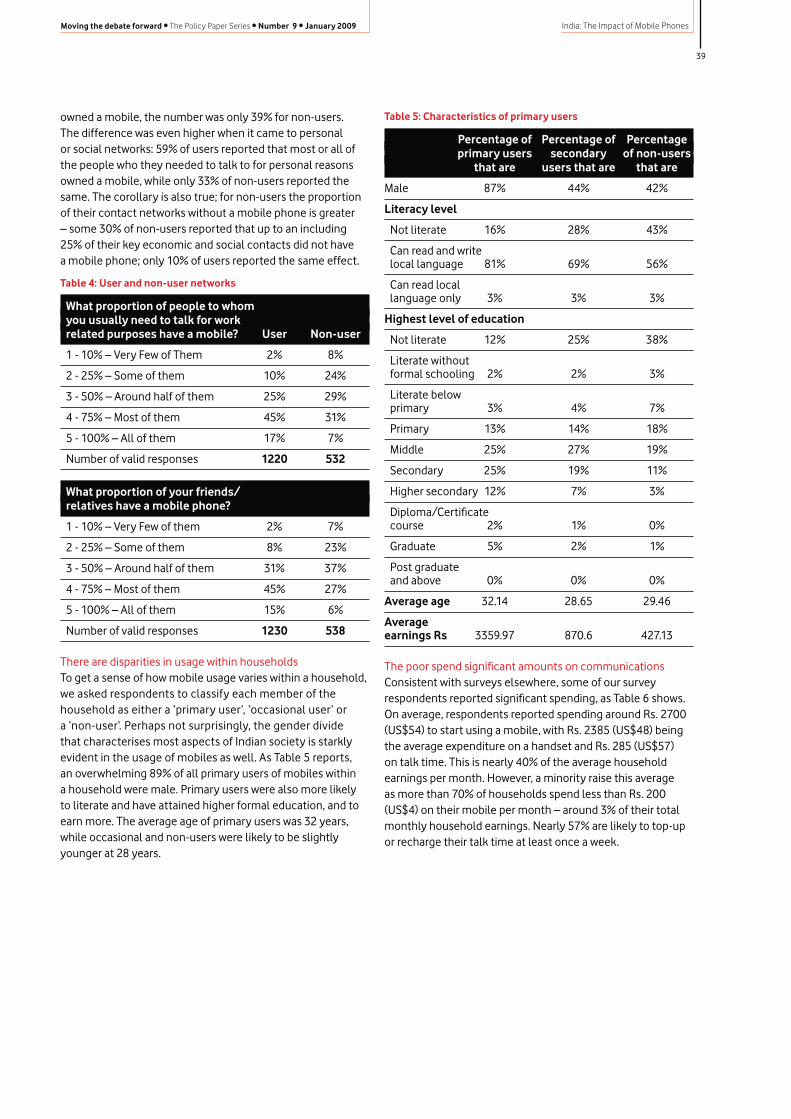
39
India: The Impact of Mobile PhonesMoving the debate forward • The Policy Paper Series • Number 9 • January 2009
owned a mobile, the number was only 39% for non-users. The difference was even higher when it came to personal or social networks: 59% of users reported that most or all of the people who they needed to talk to for personal reasons owned a mobile, while only 33% of non-users reported the same. The corollary is also true; for non-users the proportion of their contact networks without a mobile phone is greater – some 30% of non-users reported that up to an including 25% of their key economic and social contacts did not have a mobile phone; only 10% of users reported the same effect.
Table 4: User and non-user networks
What proportion of people to whom you usually need to talk for work related purposes have a mobile? User Non-user
1 - 10% – Very Few of Them 2% 8%
2 - 25% – Some of them 10% 24%
3 - 50% – Around half of them 25% 29%
4 - 75% – Most of them 45% 31%
5 - 100% – All of them 17% 7%
Number of valid responses 1220 532
What proportion of your friends/ relatives have a mobile phone?
1 - 10% – Very Few of them 2% 7%
2 - 25% – Some of them 8% 23%
3 - 50% – Around half of them 31% 37%
4 - 75% – Most of them 45% 27%
5 - 100% – All of them 15% 6%
Number of valid responses 1230 538
There are disparities in usage within householdsTo get a sense of how mobile usage varies within a household, we asked respondents to classify each member of the household as either a ‘primary user’, ‘occasional user’ or a ‘non-user‘. Perhaps not surprisingly, the gender divide that characterises most aspects of Indian society is starkly evident in the usage of mobiles as well. As Table 5 reports, an overwhelming 89% of all primary users of mobiles within a household were male. Primary users were also more likely to literate and have attained higher formal education, and to earn more. The average age of primary users was 32 years, while occasional and non-users were likely to be slightly younger at 28 years.
Table 5: Characteristics of primary users
Percentage of Percentage of Percentage primary users secondary of non-users that are users that are that are
Male 87% 44% 42%
Literacy level
Not literate 16% 28% 43%
Can read and write local language 81% 69% 56%
Can read local language only 3% 3% 3%
Highest level of education
Not literate 12% 25% 38%
Literate without formal schooling 2% 2% 3%
Literate below primary 3% 4% 7%
Primary 13% 14% 18%
Middle 25% 27% 19%
Secondary 25% 19% 11%
Higher secondary 12% 7% 3%
Diploma/Certificate course 2% 1% 0%
Graduate 5% 2% 1%
Post graduate and above 0% 0% 0%
Average age 32.14 28.65 29.46
Average earnings Rs 3359.97 870.6 427.13
The poor spend significant amounts on communicationsConsistent with surveys elsewhere, some of our survey respondents reported significant spending, as Table 6 shows. On average, respondents reported spending around Rs. 2700 (US$54) to start using a mobile, with Rs. 2385 (US$48) being the average expenditure on a handset and Rs. 285 (US$57) on talk time. This is nearly 40% of the average household earnings per month. However, a minority raise this average as more than 70% of households spend less than Rs. 200 (US$4) on their mobile per month – around 3% of their total monthly household earnings. Nearly 57% are likely to top-up or recharge their talk time at least once a week.
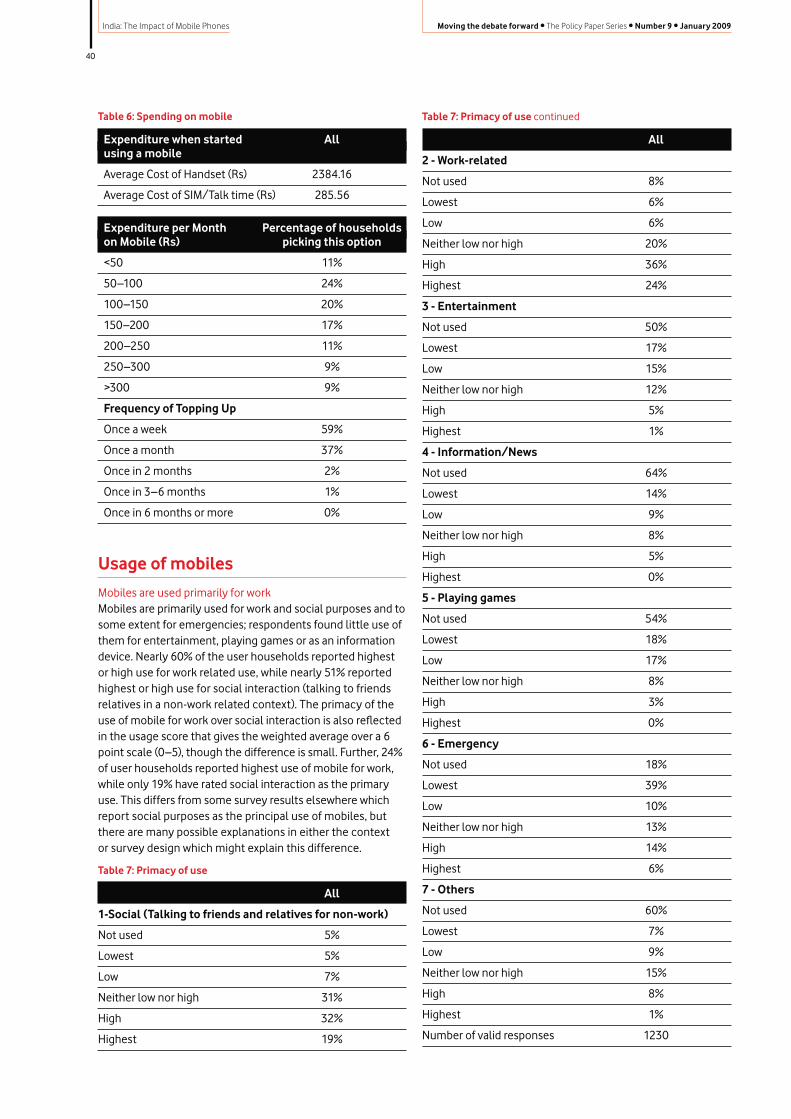
40
India: The Impact of Mobile Phones Moving the debate forward • The Policy Paper Series • Number 9 • January 2009
Table 6: Spending on mobile
Expenditure when started All using a mobile
Average Cost of Handset (Rs) 2384.16
Average Cost of SIM/Talk time (Rs) 285.56
Expenditure per Month Percentage of households on Mobile (Rs) picking this option
<50 11%
50–100 24%
100–150 20%
150–200 17%
200–250 11%
250–300 9%
>300 9%
Frequency of Topping Up
Once a week 59%
Once a month 37%
Once in 2 months 2%
Once in 3–6 months 1%
Once in 6 months or more 0%
Usage of mobiles
Mobiles are used primarily for workMobiles are primarily used for work and social purposes and to some extent for emergencies; respondents found little use of them for entertainment, playing games or as an information device. Nearly 60% of the user households reported highest or high use for work related use, while nearly 51% reported highest or high use for social interaction (talking to friends relatives in a non-work related context). The primacy of the use of mobile for work over social interaction is also reflected in the usage score that gives the weighted average over a 6 point scale (0–5), though the difference is small. Further, 24% of user households reported highest use of mobile for work, while only 19% have rated social interaction as the primary use. This differs from some survey results elsewhere which report social purposes as the principal use of mobiles, but there are many possible explanations in either the context or survey design which might explain this difference.
Table 7: Primacy of use
All
1-Social (Talking to friends and relatives for non-work)
Not used 5%
Lowest 5%
Low 7%
Neither low nor high 31%
High 32%
Highest 19%
Table 7: Primacy of use continued
All
2 - Work-related
Not used 8%
Lowest 6%
Low 6%
Neither low nor high 20%
High 36%
Highest 24%
3 - Entertainment
Not used 50%
Lowest 17%
Low 15%
Neither low nor high 12%
High 5%
Highest 1%
4 - Information/News
Not used 64%
Lowest 14%
Low 9%
Neither low nor high 8%
High 5%
Highest 0%
5 - Playing games
Not used 54%
Lowest 18%
Low 17%
Neither low nor high 8%
High 3%
Highest 0%
6 - Emergency
Not used 18%
Lowest 39%
Low 10%
Neither low nor high 13%
High 14%
Highest 6%
7 - Others
Not used 60%
Lowest 7%
Low 9%
Neither low nor high 15%
High 8%
Highest 1%
Number of valid responses 1230

41
India: The Impact of Mobile PhonesMoving the debate forward • The Policy Paper Series • Number 9 • January 2009
Table 8: Primary use of mobile
Highest use
Social (Talking to friends and relatives for non-work) 19%
Work-related 24%
Entertainment 1%
Information/News 0%
Playing games 0%
Emergency 6%
Others 1%
Mobiles are used to maintain both ‘strong’ and ‘weak ties’Table 9 shows the usage patterns of user households in terms of frequency of use, calls to household members when at work, friends and relatives living in the same city, friends and relatives living in a different city, acquaintances, work related and emergencies. This information was gathered to understand the primary driver of usage and the possible consequences on communication patterns. Reflecting the relatively greater focus on work-related use of mobiles, 38% of user households used the mobiles for work everyday, followed by calls to household members at work (21%), relatives and friends staying in the same city (11%). A small proportion (6%) called their friends and relatives living in different city daily. A large proportion (80%) called their friends and relatives living in the same city once or twice a week (46%) or once or
twice a month (34%), with a weekly frequency being lower for those friends and relatives living in different city (35% for once or twice a week and 42 % for once or twice a month). The frequency of calling acquaintances once or twice a week (35%) compared significantly with the calling pattern for friends and relatives living in different cities. The usage patterns indicate that while work related calls are significant, a substantial percentage of user households (35%) make calls once or twice a month to their friends and relatives living in different cities, towns, villages and acquaintances.
These results indicate that mobiles are used to maintain both types of ties identified in the sociological literature – ‘strong’ ties such as close family members and friends and ‘weak’ ties such as contacts who might be useful for finding work for example. However, in our survey the use of mobiles is heavier for work-purposes, as noted above.
Mobiles are used occasionally for emergenciesOnly 20% of the user households rated highest or high use of mobiles for emergencies, reflected in relatively low usage score for emergency (1.82), as is the percentage score for highest or high use for emergencies. This could be because emergencies do not occur often, leading to low usage for emergencies. Nearly 11% of user households reported using the mobile for emergencies on a daily basis. Although this number appears to be high, we feel it could also be because respondents might have interpreted it to mean something important or to be done quickly.
Table 9: Usage patterns
Valid responses = 1234 Every day Once or Once or twice Once or Once Never twice a week a month twice every a year few months
1 - Household members Calls 21% 36% 22% 4% 0% 18% when at work Missed Calls 7% 16% 13% 1% 0% 62% SMS 1% 3% 5% 0% 0% 91%
2 - Relatives/friends living Calls 11% 46% 34% 7% 0% 2% in the same city Missed Calls 13% 29% 19% 4% 0% 34% SMS 3% 10% 9% 2% 0% 76%
3 - Relatives/friends living Calls 6% 35% 42% 12% 1% 4% in different city/town/ Missed Calls 7% 23% 22% 5% 0% 42% village SMS 1% 6% 8% 3% 0% 82%
4 - Acquaintances Calls 9% 35% 29% 14% 1% 12% Missed Calls 5% 23% 19% 4% 0% 49% SMS 2% 4% 8% 4% 0% 82%
5 - Work related Calls 38% 32% 16% 6% 0% 8% Missed Calls 11% 19% 12% 2% 0% 57% SMS 2% 4% 3% 1% 0% 89%
6 - Emergency Calls 11% 10% 14% 26% 28% 12% Missed Calls 0% 3% 5% 2% 1% 89% SMS 0% 1% 1% 1% 0% 96%

42
India: The Impact of Mobile Phones Moving the debate forward • The Policy Paper Series • Number 9 • January 2009
Table 10: Usage scores by purpose
Purpose Average usage score
Social (Talking to friends and relatives for non-work) 3.37
Work-related 3.42
Entertainment 1.07
Information/News 0.76
Playing games 0.89
Emergency 1.82
Others 1.06
Note: Average usage score is calculated by giving a score of 0 if the user stated that s/he did not use the mobile at all for the identified purpose and a score 5 if the user stated that it was the most important use of the mobile for him or her.
Most respondents use mobiles for productive purposesAs Table 7 above shows, only a small proportion of user households have rated highest or high use for entertainment, information, news and playing games (6%, 5% and 3%). In line with this, we find that only 2% of the user households have used the mobile for participating in contests on television or radio. Only 25% of user households had subscribed to any additional service. Of those that had subscribed (Table 11), nearly 94% subscribe to caller tunes/ring tones, with the next highest usage being for Sports (12%), followed by Jokes, News and Horoscope updates at (8%, 6% and 2%).
Table 11: Usage of subscription services
Subscription to any service All
Ring tones/ Caller tunes 94%
News updates 6%
Jokes 8%
Sports updates 12%
Horoscope updates 2%
Number of valid responses 309
Nearly 29% of user households have used mobiles for contacting doctors and 21% for contacting a person working in the government or a government office. The relatively higher use for contacting doctors possibly reflects the fact that calling a doctor is seldom discretionary.
Table 12: Percentage using mobile to contact:
Doctor 29%
Government person/office 21%
Contests on television/radio 2%
Number of valid responses 1217
SMS is a low usage serviceThe usage of SMS may partly be driven by the level of comfort people have in sending and receiving the messages. Lack of or weak literacy is an obvious barrier. Other factors that drive usage may be the relative cost vis-à-vis voice calls and nature of communication supported by SMS (asynchronous, a number of messages required for confirmation). In order
to assess one of these dimensions, respondents were asked their relative comfort in sending and receiving SMS (Table 13). A large proportion (45%) of user households were not comfortable in either receiving or sending SMS, while 36% were comfortable in both receiving or sending SMS and 19% were comfortable in receiving but not in sending SMS.
Table 13: SMS usage
1- Not comfortable with either sending or receiving SMS 45%
2- Comfortable with both sending and receiving SMS 36%
3- Comfortable with receiving SMS but not comfortable sending SMS 19%
Number of valid responses 1234
Nearly 96% of user households indicated they never used SMS in emergencies, 91% never sent an SMS to household members when at work and 89% never used SMS for work. However, 19% of user households had used SMS once or twice a month or more for contacting relatives and friends staying in the same city, and 14% had done the same for friends and relatives living in different city. For acquaintances, the number was 12%. This indicates that SMS is used more to keep in touch with the not so immediate circle of relationships. For the immediate family, SMS is rarely used.
Mobiles change ways of workingResponses reported in Table 14 indicate that mobiles change how people conduct their economic activities and do so in ways that are likely to increase the economic value of their work. We find rather strong evidence that mobiles improve the ability of people to plan, co-ordinate and search for better prices or lower costs. Over 70% of users for whom the question was applicable report that mobiles have improved their ability to plan and co-ordinate with people they work with. Similarly, while 43% of non-user households rarely or never plan and co-ordinate with their customers and suppliers, around 80% of user households use their mobiles for such planning and co-ordination at least sometimes.
The fact that mobiles confer a distinct advantage over public telephone booths is evident from the fact that while 35% of users report using the mobile to find new or better work either most of the times or always, and 26% of non-users report using telephone booths to do the same.
Mobiles also seem to enable some users to do their work over a larger geographical area. For example, while 40% of users state that there has been no change in the geographical area (as measured by distance from home) over which they do work, 46% report that their mobile usage has either increased the area somewhat or a lot. The contrast with non-users, of whom only 18% report an increase over the prior year, provides suggestive evidence for the hypothesis that mobiles help poor people overcome or lower the transaction costs of doing business beyond their immediate vicinity.
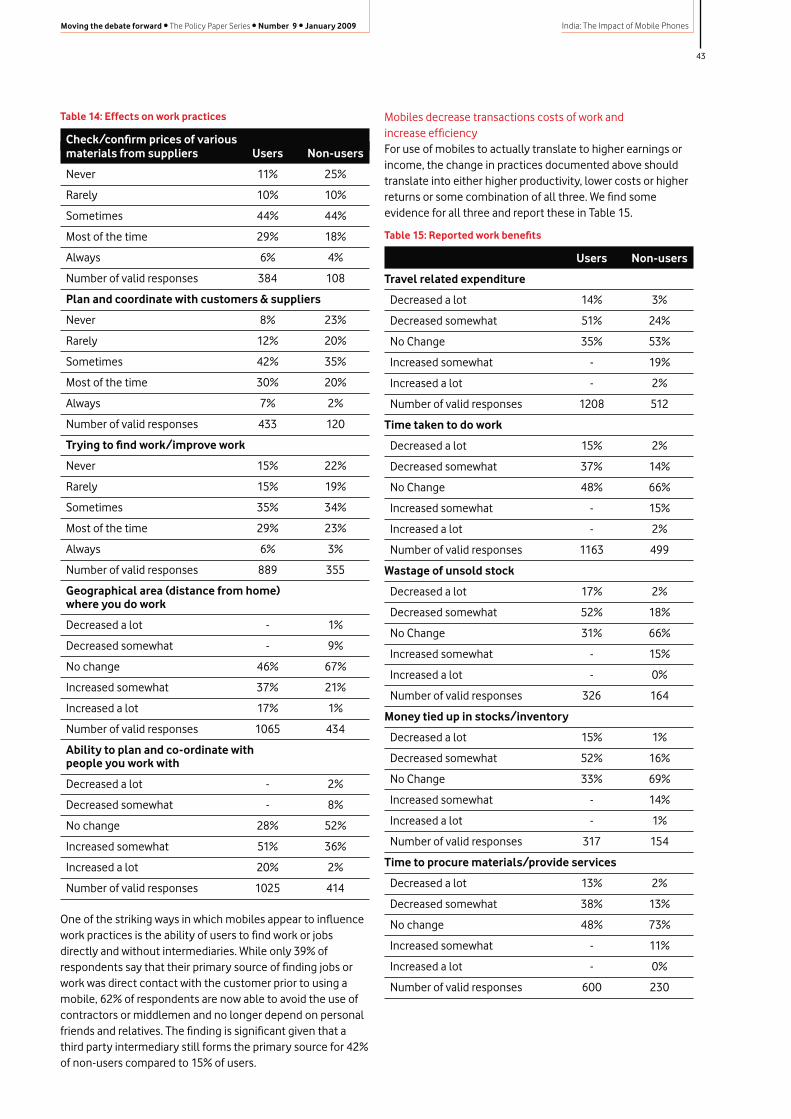
43
India: The Impact of Mobile PhonesMoving the debate forward • The Policy Paper Series • Number 9 • January 2009
Table 14: Effects on work practices
Check/confirm prices of various materials from suppliers Users Non-users
Never 11% 25%
Rarely 10% 10%
Sometimes 44% 44%
Most of the time 29% 18%
Always 6% 4%
Number of valid responses 384 108
Plan and coordinate with customers & suppliers
Never 8% 23%
Rarely 12% 20%
Sometimes 42% 35%
Most of the time 30% 20%
Always 7% 2%
Number of valid responses 433 120
Trying to find work/improve work
Never 15% 22%
Rarely 15% 19%
Sometimes 35% 34%
Most of the time 29% 23%
Always 6% 3%
Number of valid responses 889 355
Geographical area (distance from home) where you do work
Decreased a lot - 1%
Decreased somewhat - 9%
No change 46% 67%
Increased somewhat 37% 21%
Increased a lot 17% 1%
Number of valid responses 1065 434
Ability to plan and co-ordinate with people you work with
Decreased a lot - 2%
Decreased somewhat - 8%
No change 28% 52%
Increased somewhat 51% 36%
Increased a lot 20% 2%
Number of valid responses 1025 414
One of the striking ways in which mobiles appear to influence work practices is the ability of users to find work or jobs directly and without intermediaries. While only 39% of respondents say that their primary source of finding jobs or work was direct contact with the customer prior to using a mobile, 62% of respondents are now able to avoid the use of contractors or middlemen and no longer depend on personal friends and relatives. The finding is significant given that a third party intermediary still forms the primary source for 42% of non-users compared to 15% of users.
Mobiles decrease transactions costs of work and increase efficiencyFor use of mobiles to actually translate to higher earnings or income, the change in practices documented above should translate into either higher productivity, lower costs or higher returns or some combination of all three. We find some evidence for all three and report these in Table 15.
Table 15: Reported work benefits
Users Non-users
Travel related expenditure
Decreased a lot 14% 3%
Decreased somewhat 51% 24%
No Change 35% 53%
Increased somewhat - 19%
Increased a lot - 2%
Number of valid responses 1208 512
Time taken to do work
Decreased a lot 15% 2%
Decreased somewhat 37% 14%
No Change 48% 66%
Increased somewhat - 15%
Increased a lot - 2%
Number of valid responses 1163 499
Wastage of unsold stock
Decreased a lot 17% 2%
Decreased somewhat 52% 18%
No Change 31% 66%
Increased somewhat - 15%
Increased a lot - 0%
Number of valid responses 326 164
Money tied up in stocks/inventory
Decreased a lot 15% 1%
Decreased somewhat 52% 16%
No Change 33% 69%
Increased somewhat - 14%
Increased a lot - 1%
Number of valid responses 317 154
Time to procure materials/provide services
Decreased a lot 13% 2%
Decreased somewhat 38% 13%
No change 48% 73%
Increased somewhat - 11%
Increased a lot - 0%
Number of valid responses 600 230
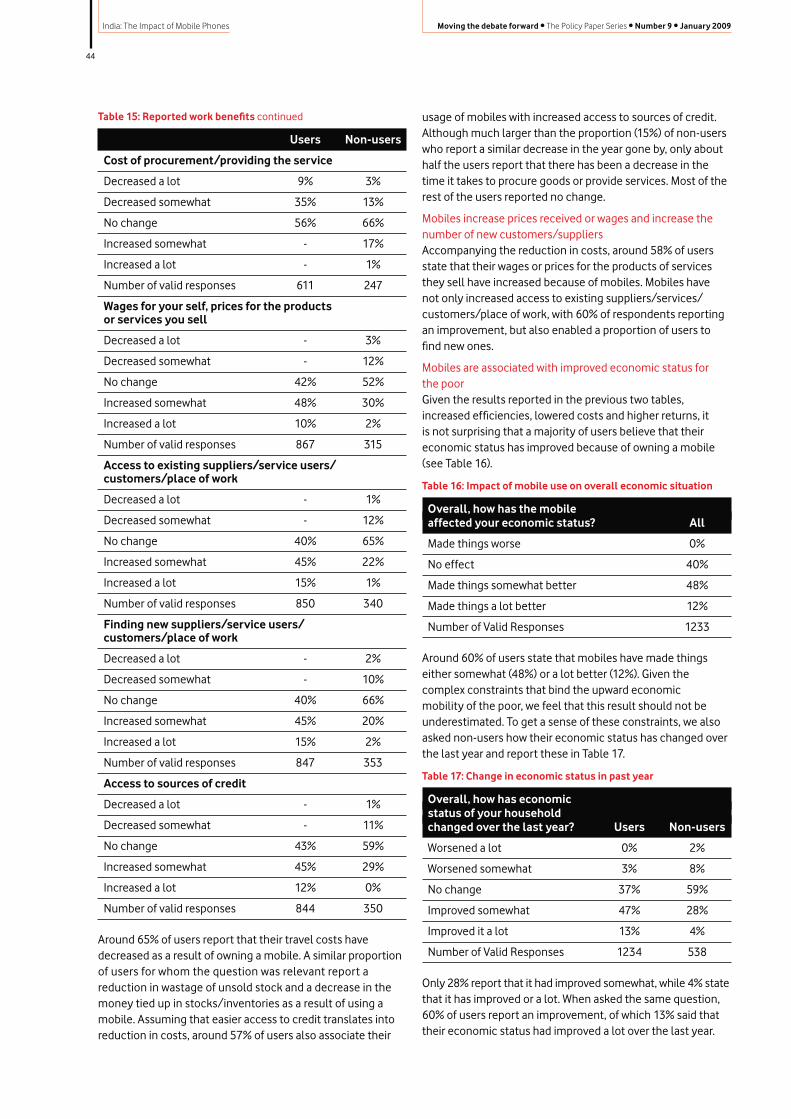
44
India: The Impact of Mobile Phones Moving the debate forward • The Policy Paper Series • Number 9 • January 2009
Table 15: Reported work benefits continued
Users Non-users
Cost of procurement/providing the service
Decreased a lot 9% 3%
Decreased somewhat 35% 13%
No change 56% 66%
Increased somewhat - 17%
Increased a lot - 1%
Number of valid responses 611 247
Wages for your self, prices for the products or services you sell
Decreased a lot - 3%
Decreased somewhat - 12%
No change 42% 52%
Increased somewhat 48% 30%
Increased a lot 10% 2%
Number of valid responses 867 315
Access to existing suppliers/service users/ customers/place of work
Decreased a lot - 1%
Decreased somewhat - 12%
No change 40% 65%
Increased somewhat 45% 22%
Increased a lot 15% 1%
Number of valid responses 850 340
Finding new suppliers/service users/ customers/place of work
Decreased a lot - 2%
Decreased somewhat - 10%
No change 40% 66%
Increased somewhat 45% 20%
Increased a lot 15% 2%
Number of valid responses 847 353
Access to sources of credit
Decreased a lot - 1%
Decreased somewhat - 11%
No change 43% 59%
Increased somewhat 45% 29%
Increased a lot 12% 0%
Number of valid responses 844 350
Around 65% of users report that their travel costs have decreased as a result of owning a mobile. A similar proportion of users for whom the question was relevant report a reduction in wastage of unsold stock and a decrease in the money tied up in stocks/inventories as a result of using a mobile. Assuming that easier access to credit translates into reduction in costs, around 57% of users also associate their
usage of mobiles with increased access to sources of credit. Although much larger than the proportion (15%) of non-users who report a similar decrease in the year gone by, only about half the users report that there has been a decrease in the time it takes to procure goods or provide services. Most of the rest of the users reported no change.
Mobiles increase prices received or wages and increase the number of new customers/suppliersAccompanying the reduction in costs, around 58% of users state that their wages or prices for the products of services they sell have increased because of mobiles. Mobiles have not only increased access to existing suppliers/services/customers/place of work, with 60% of respondents reporting an improvement, but also enabled a proportion of users to find new ones.
Mobiles are associated with improved economic status for the poor Given the results reported in the previous two tables, increased efficiencies, lowered costs and higher returns, it is not surprising that a majority of users believe that their economic status has improved because of owning a mobile (see Table 16).
Table 16: Impact of mobile use on overall economic situation
Overall, how has the mobile affected your economic status? All
Made things worse 0%
No effect 40%
Made things somewhat better 48%
Made things a lot better 12%
Number of Valid Responses 1233
Around 60% of users state that mobiles have made things either somewhat (48%) or a lot better (12%). Given the complex constraints that bind the upward economic mobility of the poor, we feel that this result should not be underestimated. To get a sense of these constraints, we also asked non-users how their economic status has changed over the last year and report these in Table 17.
Table 17: Change in economic status in past year
Overall, how has economic status of your household changed over the last year? Users Non-users
Worsened a lot 0% 2%
Worsened somewhat 3% 8%
No change 37% 59%
Improved somewhat 47% 28%
Improved it a lot 13% 4%
Number of Valid Responses 1234 538
Only 28% report that it had improved somewhat, while 4% state that it has improved or a lot. When asked the same question, 60% of users report an improvement, of which 13% said that their economic status had improved a lot over the last year.
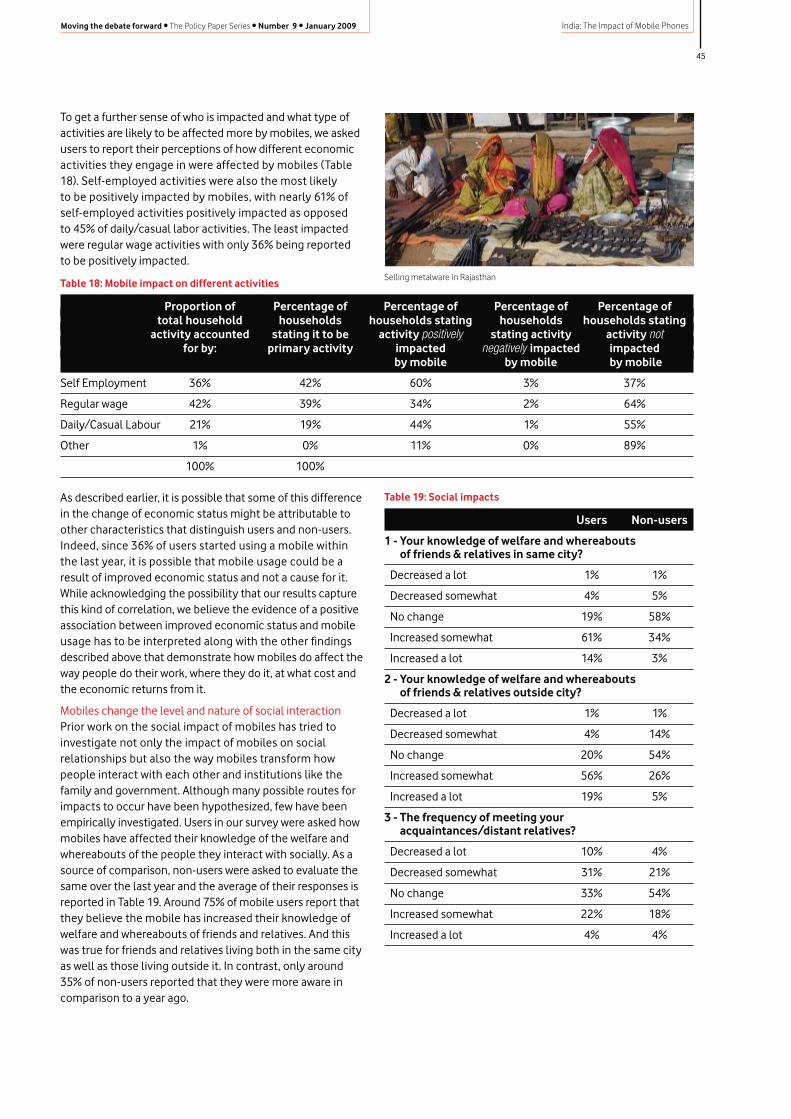
45
India: The Impact of Mobile PhonesMoving the debate forward • The Policy Paper Series • Number 9 • January 2009
To get a further sense of who is impacted and what type of activities are likely to be affected more by mobiles, we asked users to report their perceptions of how different economic activities they engage in were affected by mobiles (Table 18). Self-employed activities were also the most likely to be positively impacted by mobiles, with nearly 61% of self-employed activities positively impacted as opposed to 45% of daily/casual labor activities. The least impacted were regular wage activities with only 36% being reported to be positively impacted.
As described earlier, it is possible that some of this difference in the change of economic status might be attributable to other characteristics that distinguish users and non-users. Indeed, since 36% of users started using a mobile within the last year, it is possible that mobile usage could be a result of improved economic status and not a cause for it. While acknowledging the possibility that our results capture this kind of correlation, we believe the evidence of a positive association between improved economic status and mobile usage has to be interpreted along with the other findings described above that demonstrate how mobiles do affect the way people do their work, where they do it, at what cost and the economic returns from it.
Mobiles change the level and nature of social interaction Prior work on the social impact of mobiles has tried to investigate not only the impact of mobiles on social relationships but also the way mobiles transform how people interact with each other and institutions like the family and government. Although many possible routes for impacts to occur have been hypothesized, few have been empirically investigated. Users in our survey were asked how mobiles have affected their knowledge of the welfare and whereabouts of the people they interact with socially. As a source of comparison, non-users were asked to evaluate the same over the last year and the average of their responses is reported in Table 19. Around 75% of mobile users report that they believe the mobile has increased their knowledge of welfare and whereabouts of friends and relatives. And this was true for friends and relatives living both in the same city as well as those living outside it. In contrast, only around 35% of non-users reported that they were more aware in comparison to a year ago.
Table 18: Mobile impact on different activities
Proportion of Percentage of Percentage of Percentage of Percentage of total household households households stating households households stating activity accounted stating it to be activity positively stating activity activity not for by: primary activity impacted negatively impacted impacted by mobile by mobile by mobile
Self Employment 36% 42% 60% 3% 37%
Regular wage 42% 39% 34% 2% 64%
Daily/Casual Labour 21% 19% 44% 1% 55%
Other 1% 0% 11% 0% 89%
100% 100%
Table 19: Social impacts
Users Non-users
1 - Your knowledge of welfare and whereabouts of friends & relatives in same city?
Decreased a lot 1% 1%
Decreased somewhat 4% 5%
No change 19% 58%
Increased somewhat 61% 34%
Increased a lot 14% 3%
2 - Your knowledge of welfare and whereabouts of friends & relatives outside city?
Decreased a lot 1% 1%
Decreased somewhat 4% 14%
No change 20% 54%
Increased somewhat 56% 26%
Increased a lot 19% 5%
3 - The frequency of meeting your acquaintances/distant relatives?
Decreased a lot 10% 4%
Decreased somewhat 31% 21%
No change 33% 54%
Increased somewhat 22% 18%
Increased a lot 4% 4%
Selling metalware in Rajasthan
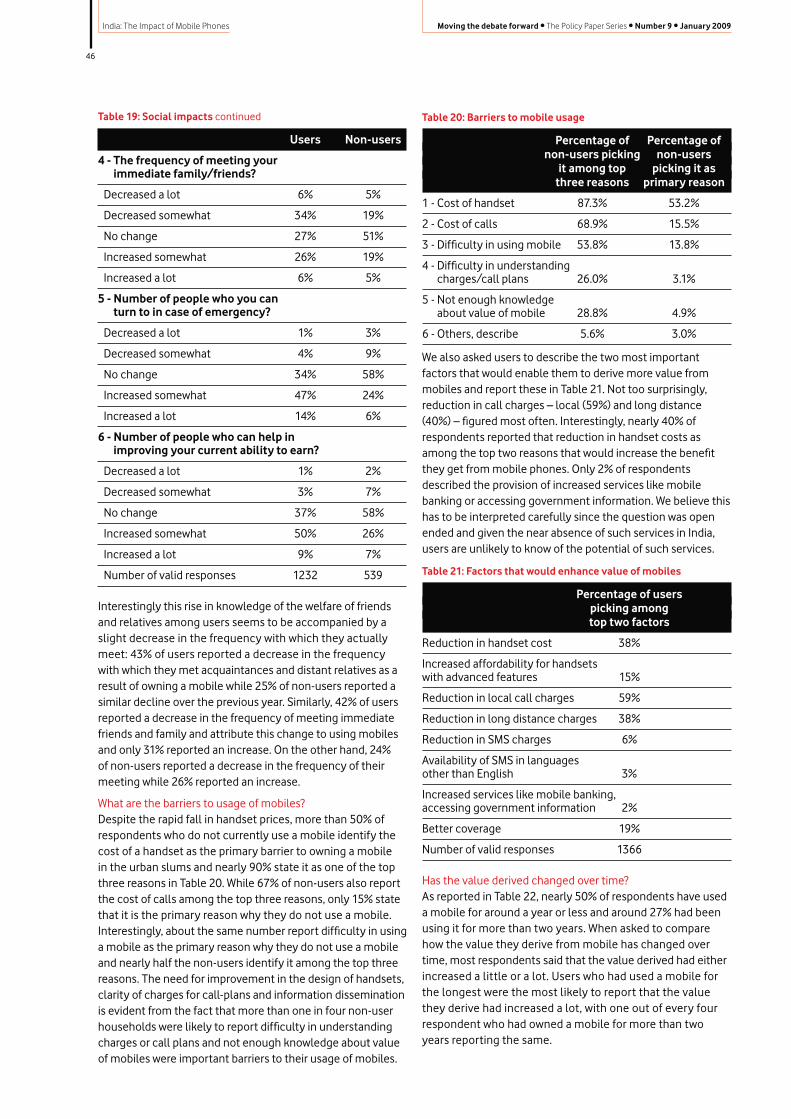
46
India: The Impact of Mobile Phones Moving the debate forward • The Policy Paper Series • Number 9 • January 2009
Table 19: Social impacts continued
Users Non-users
4 - The frequency of meeting your immediate family/friends?
Decreased a lot 6% 5%
Decreased somewhat 34% 19%
No change 27% 51%
Increased somewhat 26% 19%
Increased a lot 6% 5%
5 - Number of people who you can turn to in case of emergency?
Decreased a lot 1% 3%
Decreased somewhat 4% 9%
No change 34% 58%
Increased somewhat 47% 24%
Increased a lot 14% 6%
6 - Number of people who can help in improving your current ability to earn?
Decreased a lot 1% 2%
Decreased somewhat 3% 7%
No change 37% 58%
Increased somewhat 50% 26%
Increased a lot 9% 7%
Number of valid responses 1232 539
Interestingly this rise in knowledge of the welfare of friends and relatives among users seems to be accompanied by a slight decrease in the frequency with which they actually meet: 43% of users reported a decrease in the frequency with which they met acquaintances and distant relatives as a result of owning a mobile while 25% of non-users reported a similar decline over the previous year. Similarly, 42% of users reported a decrease in the frequency of meeting immediate friends and family and attribute this change to using mobiles and only 31% reported an increase. On the other hand, 24% of non-users reported a decrease in the frequency of their meeting while 26% reported an increase.
What are the barriers to usage of mobiles?Despite the rapid fall in handset prices, more than 50% of respondents who do not currently use a mobile identify the cost of a handset as the primary barrier to owning a mobile in the urban slums and nearly 90% state it as one of the top three reasons in Table 20. While 67% of non-users also report the cost of calls among the top three reasons, only 15% state that it is the primary reason why they do not use a mobile. Interestingly, about the same number report difficulty in using a mobile as the primary reason why they do not use a mobile and nearly half the non-users identify it among the top three reasons. The need for improvement in the design of handsets, clarity of charges for call-plans and information dissemination is evident from the fact that more than one in four non-user households were likely to report difficulty in understanding charges or call plans and not enough knowledge about value of mobiles were important barriers to their usage of mobiles.
Table 20: Barriers to mobile usage
Percentage of Percentage of non-users picking non-users it among top picking it as three reasons primary reason
1 - Cost of handset 87.3% 53.2%
2 - Cost of calls 68.9% 15.5%
3 - Difficulty in using mobile 53.8% 13.8%
4 - Difficulty in understanding charges/call plans 26.0% 3.1%
5 - Not enough knowledge about value of mobile 28.8% 4.9%
6 - Others, describe 5.6% 3.0%
We also asked users to describe the two most important factors that would enable them to derive more value from mobiles and report these in Table 21. Not too surprisingly, reduction in call charges – local (59%) and long distance (40%) – figured most often. Interestingly, nearly 40% of respondents reported that reduction in handset costs as among the top two reasons that would increase the benefit they get from mobile phones. Only 2% of respondents described the provision of increased services like mobile banking or accessing government information. We believe this has to be interpreted carefully since the question was open ended and given the near absence of such services in India, users are unlikely to know of the potential of such services.
Table 21: Factors that would enhance value of mobiles
Percentage of users picking among top two factors
Reduction in handset cost 38%
Increased affordability for handsets with advanced features 15%
Reduction in local call charges 59%
Reduction in long distance charges 38%
Reduction in SMS charges 6%
Availability of SMS in languages other than English 3%
Increased services like mobile banking, accessing government information 2%
Better coverage 19%
Number of valid responses 1366
Has the value derived changed over time?As reported in Table 22, nearly 50% of respondents have used a mobile for around a year or less and around 27% had been using it for more than two years. When asked to compare how the value they derive from mobile has changed over time, most respondents said that the value derived had either increased a little or a lot. Users who had used a mobile for the longest were the most likely to report that the value they derive had increased a lot, with one out of every four respondent who had owned a mobile for more than two years reporting the same.
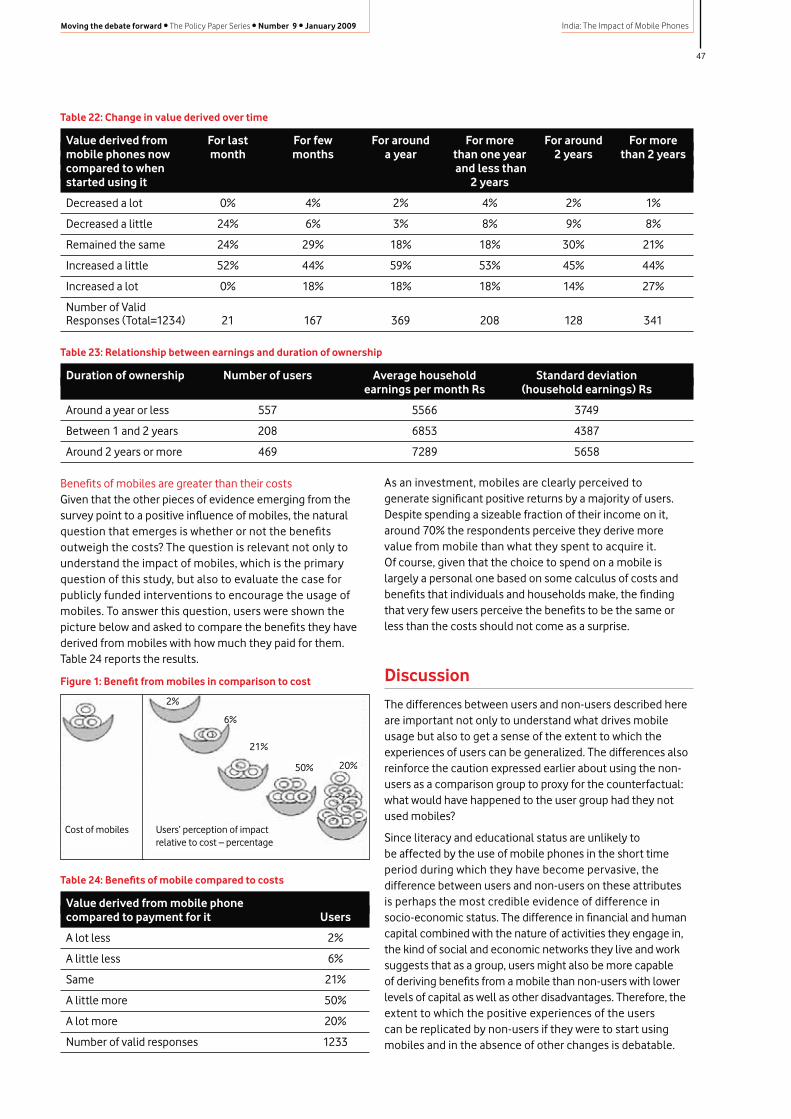
47
India: The Impact of Mobile PhonesMoving the debate forward • The Policy Paper Series • Number 9 • January 2009
Table 22: Change in value derived over time
Value derived from For last For few For around For more For around For more mobile phones now month months a year than one year 2 years than 2 years compared to when and less than started using it 2 years
Decreased a lot 0% 4% 2% 4% 2% 1%
Decreased a little 24% 6% 3% 8% 9% 8%
Remained the same 24% 29% 18% 18% 30% 21%
Increased a little 52% 44% 59% 53% 45% 44%
Increased a lot 0% 18% 18% 18% 14% 27%
Number of Valid Responses (Total=1234) 21 167 369 208 128 341
Table 23: Relationship between earnings and duration of ownership
Duration of ownership Number of users Average household Standard deviation earnings per month Rs (household earnings) Rs
Around a year or less 557 5566 3749
Between 1 and 2 years 208 6853 4387
Around 2 years or more 469 7289 5658
As an investment, mobiles are clearly perceived to generate significant positive returns by a majority of users. Despite spending a sizeable fraction of their income on it, around 70% the respondents perceive they derive more value from mobile than what they spent to acquire it. Of course, given that the choice to spend on a mobile is largely a personal one based on some calculus of costs and benefits that individuals and households make, the finding that very few users perceive the benefits to be the same or less than the costs should not come as a surprise.
Discussion
The differences between users and non-users described here are important not only to understand what drives mobile usage but also to get a sense of the extent to which the experiences of users can be generalized. The differences also reinforce the caution expressed earlier about using the non-users as a comparison group to proxy for the counterfactual: what would have happened to the user group had they not used mobiles?
Since literacy and educational status are unlikely to be affected by the use of mobile phones in the short time period during which they have become pervasive, the difference between users and non-users on these attributes is perhaps the most credible evidence of difference in socio-economic status. The difference in financial and human capital combined with the nature of activities they engage in, the kind of social and economic networks they live and work suggests that as a group, users might also be more capable of deriving benefits from a mobile than non-users with lower levels of capital as well as other disadvantages. Therefore, the extent to which the positive experiences of the users can be replicated by non-users if they were to start using mobiles and in the absence of other changes is debatable.
Benefits of mobiles are greater than their costsGiven that the other pieces of evidence emerging from the survey point to a positive influence of mobiles, the natural question that emerges is whether or not the benefits outweigh the costs? The question is relevant not only to understand the impact of mobiles, which is the primary question of this study, but also to evaluate the case for publicly funded interventions to encourage the usage of mobiles. To answer this question, users were shown the picture below and asked to compare the benefits they have derived from mobiles with how much they paid for them. Table 24 reports the results.
Figure 1: Benefit from mobiles in comparison to cost
Table 24: Benefits of mobile compared to costs
Value derived from mobile phone compared to payment for it Users
A lot less 2%
A little less 6%
Same 21%
A little more 50%
A lot more 20%
Number of valid responses 1233
Cost of mobiles Users’ perception of impact relative to cost – percentage
2%
6%
21%
20%50%
48
India: The Impact of Mobile Phones Moving the debate forward • The Policy Paper Series • Number 9 • January 2009
This thought is consistent with findings from previous studies that suggest mobiles are valued by those who are already more educated and those belonging to middle or higher socio-economic groups because of the economic benefits they provide. This might also be because these groups are able to take advantage of the efficiency gains for greater income generation or exploit new information to generate new opportunities or save expenditure. On the other hand, it may be difficult for the people who are not so well off or educated to understand how these links work or exploit them. If individuals do not perceive economic benefits, they are less likely to adopt and use mobile services, as for them the cost of service may outweigh the perceived economic benefits (Zainudeen et.al., 2007; Souter et.al., 2005).
A possible limitation of our study is that we do not try to quantify the magnitude of the impacts we could identify. For example, we do not try to put a number on the cost reductions or earnings improvement because of mobiles. Instead we leave it to the respondent to report their perceptions of changes either as a result of mobiles (users) or over the last year (non-users). By eschewing an attempt to quantify the costs and benefits we are consistent with most of the other work estimating the impact of mobiles. We do recognise that having a more precise measure of the economic benefit of owning a mobile would indeed be useful for policy makers to evaluate the benefits of programs or policies that promote mobile use and ownership vis-à-vis both the costs of the program and in comparison to other comparable interventions. However, we are sceptical about the weight that could be put on a more numerically precise set of results.
Conclusions
Taking the reports of impacts from mobile users in urban slums in India and comparing them with the experience of non-users, we find that:
• Mobile users in urban slums experience positive changes in both their economic situation and their ability to maintain social ties, and in their self-reports attribute these to the use of mobile phones.
• Mobiles appear to decrease the transactions costs of work and increase its efficiency. In particular, they are able to benefit significantly users engaged in self-employed activities.
• Mobiles are changing how residents in the slum areas interact with each other socially and in particular might decrease physical contact and substitute it with more ‘virtual’ contact.
• Mobiles are much more likely to be used by males than by females within households. Therefore there is a reinforcement of disparities that characterise many other resource allocation decisions both within and outside households.
• Households that use mobiles differ from those that do not in significant ways including earnings, household size, education and literacy status as well as the economic and social networks in which they live and work.
These finding clearly express the economic and social significance of mobile use in urban slums and the emphatic use of the mobile as an essential tool to contemporary urban life. It is noteworthy that the interplay between existing levels of income, economic activity and the use of mobile creates a virtuous cycle allowing households to edge their way from poverty. We know that the majority of users substantially value the benefits of mobile ownership over the costs of ownership and that over time mobile phone costs are being lowered and income benefits for households are growing. However, the survey also reveals that some households are unable to break into this virtuous cycle – in part this barrier appears to be related to income, issues of affordability and deeper questions over the value of (and the perception of) the positive network economic effects that would tip increasing number of households into the user communities.
Given these findings, there is a need to evaluate those public policy measures which address issues of access and affordability of mobile telecommunications services. The key question to be addressed is whether such policies should be targeted towards to urban poor more than at present, and whether current measures are adequate. Importantly the review of the existing policy portfolio needs to focus not just on the incentive mechanism for individual households but also the processes by which individual users can benefit from the extent to which others use mobiles as well – the network externalities or point of critical mass – and therefore drive up the value to themselves of the use of mobile communications.
References
Abraham, J., Dean, D. & Subramanian, A. (2007). Ringing in the Next Billion Mobile Consumers, A Roadmap for Accelerating Telecom Growth in India, A BCG Report.
Aker, J. C. (2008). Does Digital Divide or Provide? The Impact of Cell Phones on Grain Markets in Niger. Job Market Paper.
Ambastha R. (2004). Linking Urban Poverty and Housing, Combat Law, 3(3).
Barrantes, R. (2008). Substitutions and Complementarities in Telecom Services Use: A Case Study of the Peruvian Urban Poor, 17th Biennial Conference of the International Telecommunications Society, Montreal.
Barrantes, R. & Galperinb, H. (2008). Can the Poor Afford Mobile Telephony? Telecommunications Policy, 32(8), 521–530
Chabossou, A., Stork, C., Stork, M. & Zahonogo, P. Mobile Telephony Access & Usage in Africa. Retrieved December 9, 2008 from www.researchICTafrica.net
Chandrasekhar, S & Mukhopadhyay, A. Multidimensions of Urban Poverty: Evidence from India (2007). Indira Gandhi Institute of Development Research, Mumbai. Working Paper:2007-008.
49
India: The Impact of Mobile PhonesMoving the debate forward • The Policy Paper Series • Number 9 • January 2009
Coyle, D. (2005). Overview, The Vodafone Policy Paper Series, Number 3
De Melo, J. (2000). Telecommunications and the Poor. Internal World Bank Report. Washington, DC: World Bank.
De Silva, H., Zainudeen, A. & Ratnadiwakara, D. (2008). Perceived Economic Benefits of Telecom Access at the Bottom of the Pyramid in Emerging Asia, LIRNEasia.
Donner, J. (2005). The Mobile Behaviors of Kigali’s Microentrepreneurs: Whom they call…and why. In Kristof Nyiri, ed., A Sense of Place. Vienna: Passagen Verlag
Forestier, E., Grace, J. & Kenny, C. (2002). Can Information and Communication Technologies be Pro-poor? Telecommunications Policy, 26(11), 623–646.
Garbacz, C. & Thompson, H. (2007). Demand for Telecommunication Services in Developing Countries, Telecommunications Policy, 31(5), 276–289
Goodman, J. (2005). Linking Mobile Phone Ownership and Use to Social Capital in Rural South Africa and Tanzania, The Vodafone Policy Paper Series, Number 3.
Granovetter, M, “The Strength of Weak Ties”, American Journal of Sociology, 78 (1973), 160–1380
Hardy, A. P. (1980). ‘The Role of the Telephone in Economic Development’, Telecommunications Policy, 4(4): 278–286.
Jensen, R. (2007). The Digital Provide: Information (Technology) Market Performance, and Welfare in the South Indian Fisheries Sector. The Quarterly Journal of Economics, CXXII (3), 879–924.
Lall, S. (2003). Employment Strategies for the Poor in India: Search for Sustainability, Working Paper 7, International Workshop on Integrated Urban Housing Development.
Loughhead, S., Mittal, O., Wood, G. (2001), Urban Poverty and Vulnerability in India: DFID’s Experiences from a Social Policy Perspective, Department for International Development, London.
Mobile Phone Adoption in Developing Countries, Retrieved December 9, 2008 from http://www.wikinvest.com/concept/Mobile_Phone_Adoption_in_Developing_Countries
Norton, S. (1992). Transactions Costs, Telecommunications and the Microeconomics of Macroeconomic Growth. Economic Development and Cultural Change, 41(1), 175–196.
Phillip, S. (2002). Social Capital, Local Networks and Community Development, in Ed (Rakodi, C. & Lloyd-Jones, T.), Urban Livelihoods - A People-centred Approach to Reducing Poverty, Department for International Development, Chapter 8.
Roller, L. & Waverman, L. (2001). Telecommunications Infrastructure and Economic Development: A Simultaneous Approach. American Economic Review, 91(4), 909–23.
Samuel, J., Shah, N. & Hadingham, W. (2005). Mobile Communications in South Africa, Tanzania and Egypt: Results from Community and Business Surveys, Africa: The Impact of Mobile Phones, The Vodafone Policy Paper Series, Number 3.
Sood, A. (2006). The Mobile Development Report, The Socio-Economic Dynamics of Mobile Communications in Rural Areas and their Consequences for Development.
Souter, D., Scott, N., Garforth, C., Jain, R., Mascarenhas, O. & McKemey, K. (2005). The Economic Impact of Telecommunications on Rural Livelihoods and Poverty Reduction, A study of rural communities in India (Gujarat), Mozambique and Tanzania, Report of DFID KaR Project 8347.
Telecom Regulatory Authority of India, The Indian Telecom Services Performance Indicators April– June 2008. Retrieved December 9, 2008 from http://www.trai.gov.in/WriteReadData/trai/upload/Reports/44/report7oct08.pdf
Telecom Regulatory Authority of India. (2008) Measures to improve Telecom Penetration in Rural India – The next 100 million subscribers. Paper No 1/2008.
Waverman, L., Meschi, M. & Fuss, M. (2005). The Impact of Telecoms on Economic Growth in Developing Countries, The Vodafone Policy Paper Series, Number 3
Wireless Unbound, The Surprising Economic Value and Untapped Potential of the Mobile Phone, McKinsey & Company, December 2006
Zainudeen, A., Sivapragasam, N., De Silva, H., Iqbal, T. & Ratnadiwakara, D. (2007). Teleuse at the Bottom of the Pyramid: Findings from a Five-Country Study, LIRNEasia
Lipton, Michael. (1977). Why poor people stay poor: urban bias in world development, Cambridge: Harvard UP
Varshney, Ashutosh, (1988) Democracy, Development and the Countryside, Cambridge University Press.
UN-Habitat http://www.unhabitat.org/categories.asp?catid=46). Accessed on 16th December, 2008
continued…
Notes1 To understand their economic lives, we asked respondents to classify their
economic activities into three categories – self-employed, regular wage and daily/casual labour. Self-employed refers to activities like owning and running a shop, operating a rickshaw, providing a service (e.g. plumbers, carpenters). Regular wage refers to activities for which they are compensated on a regular basis while working for others. Daily or casual labour refers to activities which are done on temporary contracts and include manual labour and construction work.
2 Since users in developing countries are likely to share mobile phones within and between households, one of the complexities that researchers in the developing world have had to grapple with is defining and distinguishing between ownership and usage. Unfortunately, there has been no consistent definition of what constitutes a “user” in the existing literature. For example, (Zainudeen et.al., 2007) defines a “user” to be someone who has had used either their own phone or someone else’s – paid for or free of charge – during the preceding three months. So, even if a user had made a single call, then he/she would qualify to be a user. In contrast, the study by Chabossou et.al.(2008) considers anyone above the age of 16, who owns a phone or has an active SIM card as a user regardless of whether s/he has been using the phone and all others as non-users. Samuel et.al. (2005) defines anyone who has never owned or used a phone to be a non-user, unlike the other two studies.
3 Rather surprisingly, most respondents who owned a mobile in our sample – own one exclusively. Only in Kolkata did 17 % of “users” not own a mobile but reported using one. However, this might have also been a consequence of the way data investigators screened households. Therefore, we might instead be looking at a comparison between owners and non-owners.
4 The Indian constitution explicitly defines and makes provision for historically disadvantaged groups labelled as Scheduled Castes (SC), Scheduled Tribes (ST) and Other Backward Classes (OBC).
5 We acknowledge that whether or not a change qualified by the word “somewhat” is large enough to be meaningful is debatable. However, since respondents were given the option of “No Change”, we conjecture that even when respondents pick a response such as “Increased Somewhat”, they are probably reporting small but meaningful changes. While we often club all changes in the same direction together in the text, we distinguish between the magnitude of the perceived changes in the tables.

50
India: The Impact of Mobile Phones Moving the debate forward • The Policy Paper Series • Number 9 • January 2009
Appendix 1: Essential features of some of the notable studies examining the impact of mobiles
No Reference Countries Covered
Methodology Population Covered
Unit of Analysis
1 Abraham, J., Dean, D. & Subramanian, A. (2007). Ringing in the Next Billion Mobile Consumers, A Roadmap for Accelerating Telecom Growth in India, A BCG Report.
India Varying number of respondents in different parts of the report ranging 1285–9174.
Urban, Rural Individual
2 Barrantes, R. (2008). Substitution and Complementarities in Telecom Services Use: A Case Study of the Peruvian Urban Poor, 17th Biennial Conference of the International Telecommunications Society, Montreal.
Peru 1249 respondents
Urban (SEC D, E) Household + Individual
3 De Silva, H., Zainudeen, A. & Ratnadiwakara D. (2008). Perceived economic benefits of telecom access at the Bottom of the Pyramid in emerging Asia, LIRNEasia.
Pakistan, India, Sri Lanka, Philippines, Thailand
8662 respondents
(Urban, Rural (SEC D, E)) *
Individual
4 Goodman, J. (2005). Linking mobile phone ownership and use to social capital in rural South Africa and Tanzania, The Vodafone Policy Paper Series, Number 3.
South Africa, Tanzania
South Africa 252 respondents, Tanzania 223 respondents
Rural Individual
5 McKinsey Report, Wireless Unbound, The Surprising Economic Value and Untapped Potential of the Mobile Phone, McKinsey & Company, December 2006
India, China, Philippines
618 respondents (Urban, Rural) * Individual
6 Samuel, J., Shah, N. & Hadingham, W. (2005). Mobile Communications in South Africa, Tanzania and Egypt: Results from Community and Business Surveys, Africa: The Impact of Mobile Phones, The Vodafone Policy Paper Series, Number 3.
South Africa, Tanzania, Egypt
South Africa 252, Tanzania 223, Egypt 150
Rural Individuals and Small Businesses
7 Sood A. (2006). The Mobile Development Report, The Socio-Economic Dynamics of Mobile Communications in Rural Areas and their. Consequences for Development.
India 80 spot interviews + Focus Group Discussions + 40 depth interviews
Small town, Urban Slum, Village, Remote village (SEC B, C, D, R1, R2, R3)
Individual
8 Souter, D., Scott, N., Garforth, C., Jain, R., Mascarenhas, O. & McKemey, K. (2005). The Economic Impact of Telecommunications on Rural Livelihoods and Poverty Reduction, A study of rural communities in India (Gujarat), Mozambique and Tanzania, Report of DFID KaR Project 8347.
Mozambique, Tanzania, India (Gujarat)
Focus Group Discussions + 2292 respondents
Rural * Household (to a small extent) + Individual + small businesses
9 Chabossou, A., Stork, C., Stork, M. & Zahonogo, P. Mobile Telephony Access & Usage in Africa Retrieved December 9, 2008 from www.researchICTafrica.net
17 African countries
Survey Rural Individual
* In India the study was done on fixed lines.
* The results of urban slums and rural are not separately available, unless one examines the raw data. The raw data is publicly available.

51
India: The Impact of Mobile PhonesMoving the debate forward • The Policy Paper Series • Number 9 • January 2009
The impact of mobiles in the SME sectorAny description of India’s economy is a tale of contrasts. In popular comment on India’s economic performance in recent years, the contrast is drawn between celebration of the steady rise in the number of billionaires in the country on the one hand and regret for slow progress in improving the living standards of the majority of the population on the other. Another telling contrast is between the high profile, big businesses which capture the headlines and the ‘small fry’ which contribute an estimated 39 % of India’s manufacturing output and provide employment to 31.2 million workers in the rural and urban areas of the country. It is these 12.84 million1 small and medium enterprises (SMEs) that meet the bulk of Indians’ diverse needs for food, clothing, housing, education, entertainment, health and other goods and services. SMEs are central to the process by which the economic benefits of growth are distributed among the large part of the population.
Here we address the impact of mobile phones on this world of small and medium enterprises. The growing need of employees for mobility is the main driver of the increasing adoption of mobiles by enterprises in India. Employees need to keep in touch with their offices, shops etc., with other colleagues in the field, and with customers and contacts outside the company.
We distinguish between two ways in which SMEs can use mobile telecommunications. Firstly, and most directly, SMEs can build specific business models around mobile services e.g., developing applications for WAP or SMS-based booking services, or information services (e.g. BookMyShow, JustDial). The mobile phone is enabling more creative and service-oriented business models that are directly creating employment opportunities.
This mobile value added services (MVAS) market which provides services and applications that run on mobile phones or networks is expected to reach over US$3 billion in revenues in 2009.2 The MVAS market offers services of all kinds ranging from entertainment (e.g. film gossip, gaming) to potentially life-saving emergency information about nearest hospitals. This emerging MVAS business is driven by several major SMEs including companies who specialise in technology (e.g. Bharti Telesoft, OnMobile), mobile entertainment (e.g. Hungama), mobile marketing (e.g. ACL wireless, mobile2win, Indiatimes), and the emerging areas of mobile payments (e.g. mChek, Obopay, Ngpay), and location-based services (e.g. MapmyIndia)
In this paper, we look at two examples in particular – SMSOne and the JustDial service – which have created new business opportunities through mobile.
Perhaps more interesting is the second and indirect kind of impact of mobile. How can SMEs in general use mobiles to enhance their productivity and the efficiency of their value chain? Small businesses often face challenges in scaling up their businesses. This may be due to lack of funds or inadequate access to markets but it can also be due to the basic problems of communications and interrelationships as their businesses grow. We were interested in exploring how smaller businesses use mobile phones to overcome these communications challenges.
We have found a great wealth of examples of how mobile communications are enabling SMEs to move successfully up the value chain and become more profitable; mobiles mean they can provide a better service and achieve greater efficiency in their businesses. Arguably, the mobile phone
Professor of Economics, ICRIER Professor, IMI
Prof. Rajat Kathuria
Director, Com First (India) Private Ltd
Dr. Mahesh Uppal
Dr. Mahesh Uppal is the Director of Com First (India) Private Ltd, a consultancy specializing in policy, regulation, and strategy.
Rajat Kathuria is Professor of Economics at ICRIER, and is also a professor at the International Management Institute (IMI), New Delhi.
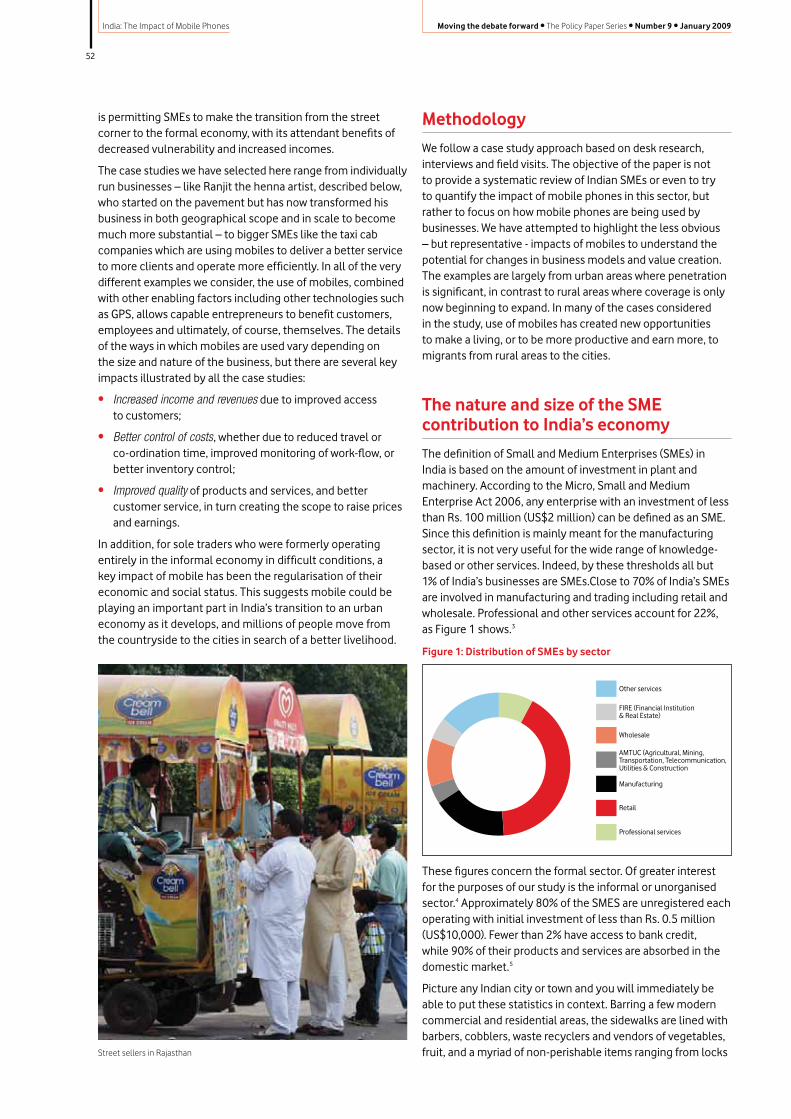
52
India: The Impact of Mobile Phones Moving the debate forward • The Policy Paper Series • Number 9 • January 2009
is permitting SMEs to make the transition from the street corner to the formal economy, with its attendant benefits of decreased vulnerability and increased incomes.
The case studies we have selected here range from individually run businesses – like Ranjit the henna artist, described below, who started on the pavement but has now transformed his business in both geographical scope and in scale to become much more substantial – to bigger SMEs like the taxi cab companies which are using mobiles to deliver a better service to more clients and operate more efficiently. In all of the very different examples we consider, the use of mobiles, combined with other enabling factors including other technologies such as GPS, allows capable entrepreneurs to benefit customers, employees and ultimately, of course, themselves. The details of the ways in which mobiles are used vary depending on the size and nature of the business, but there are several key impacts illustrated by all the case studies:
• Increased income and revenues due to improved access to customers;
• Better control of costs, whether due to reduced travel or co-ordination time, improved monitoring of work-flow, or better inventory control;
• Improved quality of products and services, and better customer service, in turn creating the scope to raise prices and earnings.
In addition, for sole traders who were formerly operating entirely in the informal economy in difficult conditions, a key impact of mobile has been the regularisation of their economic and social status. This suggests mobile could be playing an important part in India’s transition to an urban economy as it develops, and millions of people move from the countryside to the cities in search of a better livelihood.
Methodology
We follow a case study approach based on desk research, interviews and field visits. The objective of the paper is not to provide a systematic review of Indian SMEs or even to try to quantify the impact of mobile phones in this sector, but rather to focus on how mobile phones are being used by businesses. We have attempted to highlight the less obvious – but representative - impacts of mobiles to understand the potential for changes in business models and value creation. The examples are largely from urban areas where penetration is significant, in contrast to rural areas where coverage is only now beginning to expand. In many of the cases considered in the study, use of mobiles has created new opportunities to make a living, or to be more productive and earn more, to migrants from rural areas to the cities.
The nature and size of the SME contribution to India’s economy
The definition of Small and Medium Enterprises (SMEs) in India is based on the amount of investment in plant and machinery. According to the Micro, Small and Medium Enterprise Act 2006, any enterprise with an investment of less than Rs. 100 million (US$2 million) can be defined as an SME. Since this definition is mainly meant for the manufacturing sector, it is not very useful for the wide range of knowledge-based or other services. Indeed, by these thresholds all but 1% of India’s businesses are SMEs.Close to 70% of India’s SMEs are involved in manufacturing and trading including retail and wholesale. Professional and other services account for 22%, as Figure 1 shows.3
Figure 1: Distribution of SMEs by sector
These figures concern the formal sector. Of greater interest for the purposes of our study is the informal or unorganised sector.4 Approximately 80% of the SMES are unregistered each operating with initial investment of less than Rs. 0.5 million (US$10,000). Fewer than 2% have access to bank credit, while 90% of their products and services are absorbed in the domestic market.5
Picture any Indian city or town and you will immediately be able to put these statistics in context. Barring a few modern commercial and residential areas, the sidewalks are lined with barbers, cobblers, waste recyclers and vendors of vegetables, fruit, and a myriad of non-perishable items ranging from locks
Other services
FIRE (Financial Institution& Real Estate)
Wholesale
AMTUC (Agricultural, Mining, Transportation, Telecommunication, Utilities & Construction
Manufacturing
Retail
Professional services
Street sellers in Rajasthan
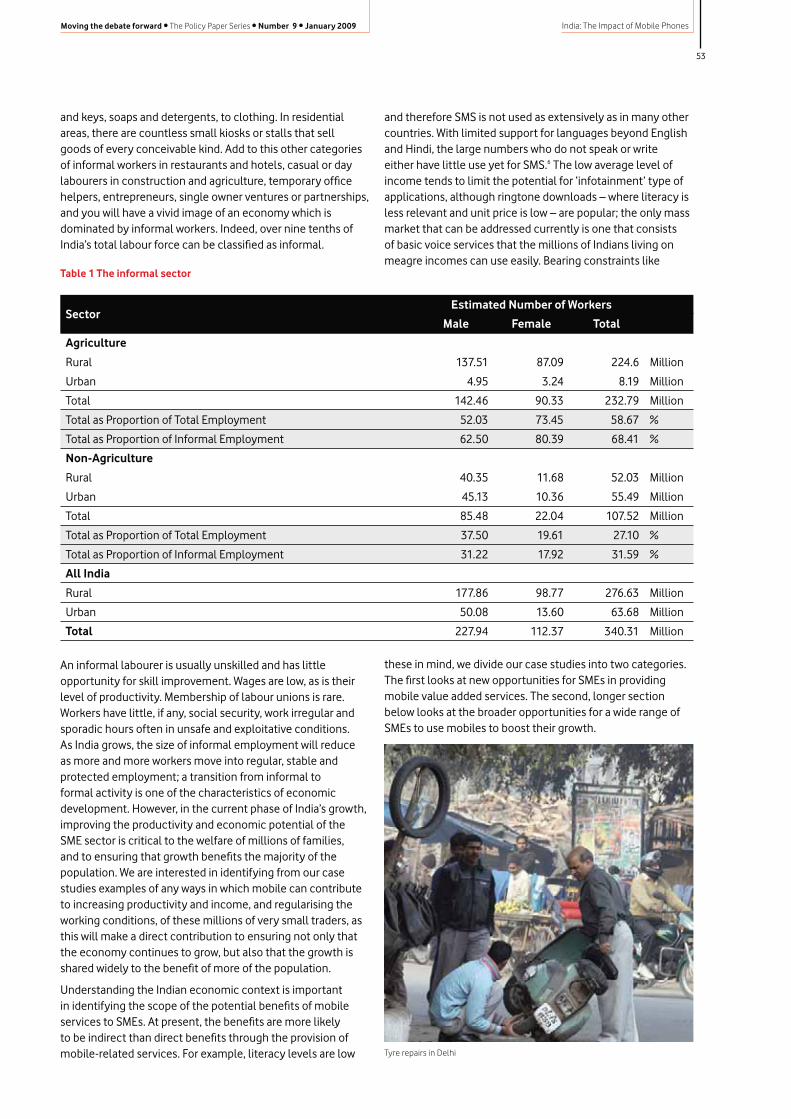
53
India: The Impact of Mobile PhonesMoving the debate forward • The Policy Paper Series • Number 9 • January 2009
these in mind, we divide our case studies into two categories. The first looks at new opportunities for SMEs in providing mobile value added services. The second, longer section below looks at the broader opportunities for a wide range of SMEs to use mobiles to boost their growth.
and therefore SMS is not used as extensively as in many other countries. With limited support for languages beyond English and Hindi, the large numbers who do not speak or write either have little use yet for SMS.6 The low average level of income tends to limit the potential for ‘infotainment’ type of applications, although ringtone downloads – where literacy is less relevant and unit price is low – are popular; the only mass market that can be addressed currently is one that consists of basic voice services that the millions of Indians living on meagre incomes can use easily. Bearing constraints like
and keys, soaps and detergents, to clothing. In residential areas, there are countless small kiosks or stalls that sell goods of every conceivable kind. Add to this other categories of informal workers in restaurants and hotels, casual or day labourers in construction and agriculture, temporary office helpers, entrepreneurs, single owner ventures or partnerships, and you will have a vivid image of an economy which is dominated by informal workers. Indeed, over nine tenths of India’s total labour force can be classified as informal.
An informal labourer is usually unskilled and has little opportunity for skill improvement. Wages are low, as is their level of productivity. Membership of labour unions is rare. Workers have little, if any, social security, work irregular and sporadic hours often in unsafe and exploitative conditions. As India grows, the size of informal employment will reduce as more and more workers move into regular, stable and protected employment; a transition from informal to formal activity is one of the characteristics of economic development. However, in the current phase of India’s growth, improving the productivity and economic potential of the SME sector is critical to the welfare of millions of families, and to ensuring that growth benefits the majority of the population. We are interested in identifying from our case studies examples of any ways in which mobile can contribute to increasing productivity and income, and regularising the working conditions, of these millions of very small traders, as this will make a direct contribution to ensuring not only that the economy continues to grow, but also that the growth is shared widely to the benefit of more of the population.
Understanding the Indian economic context is important in identifying the scope of the potential benefits of mobile services to SMEs. At present, the benefits are more likely to be indirect than direct benefits through the provision of mobile-related services. For example, literacy levels are low
Table 1 The informal sector
SectorEstimated Number of Workers
Male Female Total
Agriculture
Rural 137.51 87.09 224.6 Million
Urban 4.95 3.24 8.19 Million
Total 142.46 90.33 232.79 Million
Total as Proportion of Total Employment 52.03 73.45 58.67 %
Total as Proportion of Informal Employment 62.50 80.39 68.41 %
Non-Agriculture
Rural 40.35 11.68 52.03 Million
Urban 45.13 10.36 55.49 Million
Total 85.48 22.04 107.52 Million
Total as Proportion of Total Employment 37.50 19.61 27.10 %
Total as Proportion of Informal Employment 31.22 17.92 31.59 %
All India
Rural 177.86 98.77 276.63 Million
Urban 50.08 13.60 63.68 Million
Total 227.94 112.37 340.31 Million
Tyre repairs in Delhi

54
India: The Impact of Mobile Phones Moving the debate forward • The Policy Paper Series • Number 9 • January 2009
New mobile livelihoods: using SMS for marketing and local search
In India, the subscriber base is increasing rapidly especially among lower-income users in urban markets and the largely untapped rural markets. This expansion in access is being driven by innovation in services, especially tariffs, such as micro pre-paid, full value recharge and lifetime validity.7 The voice market remains dominant and constitutes 93% of wireless service provider revenue.8 Yet there are important reasons why the prospects for the market for direct mobile services are more limited in India as compared with other countries.
Indian users clock some of highest minutes of usage but some of the lowest usage of SMS. An average mobile user in India sends barely one message per day. Multiple languages, extensive illiteracy, and cheap voice calls, all conspire to limit the popularity of SMS. This, in turn, hurts growth of text based mobile value added services. In contrast, countries like Malaysia and Singapore have almost 3 times as much SMS usage in India. China has double. In Philippines text messages are especially popular, users clocking 15 SMS messages per day, on average.9 Interestingly, in the Philippines, the literacy rate is in excess of 93 per cent.10
A large proportion of subscribers use relatively basic handsets, which might limit most non-voice services e.g. through slow downloads, lack of camera, etc. Consequently, the take up of entertainment oriented services (e.g. Bollywood, live cricket), health, education etc. is low, even though public interest is potentially high.
Nevertheless, straightforward income opportunities can emerge in links in the value-chain that delivers new services to customers via mobiles. Here are two examples.
SMSOne, Pune, MaharashtraSince directories are often unavailable and frequently inaccurate, collecting information to enable direct marketing is a valuable service. In 20 districts of Maharashtra province, youths with about 10 years of education make over Rs5000 a month each on average by sending SMS messages. The youths use their familiarity with the community to collect roughly 1000 mobile phone numbers, at least a quarter of which belong to local businesses or entrepreneurs. The youths obtain written consent from each owner of the phone number to receive a limited number (typically 5 or 6) of informational and or promotional SMS messages each week.
SMSOne Media Services provides the bulk-SMS software to send roughly 5000–6000 messages to those mobile owners enlisted by the young unemployed. The recipients of the messages pay nothing. The young person raises money to cover costs and generate his income from those who want to reach the community. So, for example although messages about government and citizen-centred services are delivered free, small business ads, marriage invitations and other classified-type messages typically cost a rupee per message. Higher value messages such as those for canvassing support in elections, can cost up to four times more.11
JustDial, Mumbai, MaharashtraAs personal access to telecommunications increases, more personalised services can be delivered to subscribers. In India, widespread access to the internet is many years away, so other means of accessing information offer value. JustDial, which began operations in 1994, provides directory services on the lines of the familiar Yellow Pages to help its users to identify and reach a wide range products and services. Callers dial its easy-to-remember phone numbers in different towns and are provided with information by JustDial staff. The range includes helping somebody to locate a plumber who can fix a leaking tap, a tutor for a student, a shop selling decorative tiles for floors, listings information about new film releases, or details of restaurants offering pizza within a certain budget, JustDial can help with an ever-expanding range of queries, and is free for callers; Its revenues come from businesses paying for a listing, as well leads that JustDial generates for them. JustDial now supports SMS delivery that can contain more information such as additional phone numbers, addresses and other relevant information.
JustDial, which had start-up capital of US$1000, 14 years ago, has annual revenues of $17 million and a $100 million dollar valuation company today on the back of its information business. Its creator, in a recent interview,12 attributed his company’s continuing success to the telecom revolution in India, which is largely fuelled by growth of mobile phones. Without this growth, the substantial JustDial business would be significantly smaller as the accessible market would be limited. Mobile phones have clearly allowed the business to expand. They also enable users to receive the information they seek more efficiently via SMS if they choose. JustDial is a very direct example of how economic growth is created as a consequence of increased teledensity.
Use of mobile phones in SME value chains
However, the broader impact of mobile phones on the SME sector is more indirect than the provision of mobile-based services. The attractiveness of the mobile phone to small entrepreneurs lies in its user-friendliness coupled with its relatively low price –starting at less than Rs 1000. We turn now to several examples of these indirect impacts, whose potential for the wider economy is more significant.
The typical SME in India frequently consists of a single self employed person or a sole trader. Even when more people are involved, small businesses necessarily forgo the specialisation of larger businesses which have dedicated persons for specific functions such as sales, marketing, management and information technology (IT). Those working in an SME must routinely resort to multi-tasking. A mobile phone can be a powerful device can help relieve many of daily pressures that SMEs face as a result. For example, orders can be taken on the phone even when a person is busy working elsewhere; mobiles mean there is no need either to have an employee sitting by a fixed line or to miss important calls. Information can be exchanged more readily, and the

55
India: The Impact of Mobile PhonesMoving the debate forward • The Policy Paper Series • Number 9 • January 2009
quality of work monitored. This section illustrates the range of ways in which SMEs can make use of mobiles to increase their productivity, their opportunities for earning revenue, and their service to customers.
LabourNet, BangaloreLabourNet is an example of how the delivery of basic services (such as plumbing, the repair of appliances and maintenance services) can be transformed through better organisation facilitated by mobile phones. Mobile phones have enabled LabourNet to deliver better service to customers with more consistent service standards and quality. At the same time, mobile contact allows the individual tradesmen to regularise their work and become more productive. With increasing economic activity, especially relating to the IT sector, Bangalore and Hyderabad have seen huge demand for construction-related activity. LabourNet is attempting to create an effective and non-exploitative marketplace for construction work.
Traditionally in Bangalore, a client employs a Maistri (usually a small subcontractor or independent foreman) who is usually entrusted with the task of putting together worker teams for a specific construction project. The Maistri, a critical intermediary between clients and the informal workers, has obvious clout. Given the vulnerability of the workers, the Maistri-worker relationship is rarely transparent or documented, and frequently exploitative of the workers involved.
The LabourNet initiative was started in 2004 by Maya, a non-profit agency, with headquarters in Bangalore. It has created a network of workers in the informal service sector that can serve the construction, housekeeping, gardening and transportation needs in the major cities of India by using technology to help them find jobs and business opportunities. The initiative currently includes 200,000 workers and is envisaged to extend to a million workers over the next 7 years in 7 cities around India.
Maya aims to improve lives and livelihoods of traditionally badly paid self-employed construction workers. A variety of tradespersons ranging from masons, carpenters, plumbers, electricians and so on to more specialised trades such as water proofing experts, interior decorators, stone cutters, metal bar benders and many more are registered on LabourNet’s database. Potential clients call LabourNet’s call centre where staff can match their needs with workers on its database with appropriate skills, and also the fees and other specific characteristics which may be relevant for the proposed assignment. A plumber may, for instance, not be willing or able to work on high-rise buildings.
All workers registering with LabourNet require a working mobile phone on which they can be called in case there is work for them. This mobile linkage is critical since the workers, who typically live in the urban slums, cannot be reached in any other way. They may even lack a stable or permanent residential address. Also, many workers are often on-site when they need to be contacted.
LabourNet solution benefits clients as well as workers. Clients get workers who are checked and known to LabourNet. They can access the worker’s individual history, skill sets and employment experience. Since wages too are included in the database, there is little room for last minute disputes or unexpected re-negotiation of rates.
For workers, LabourNet brings much additional value besides new work. It gives them a formal identity card which serves in many other situations – for example accessing buildings or other services. The tracking of their performance can help them negotiate higher pay over time. In addition, registering workers can open their own bank account, usually extremely difficult for itinerant and especially poor workers. All registered workers get accident insurance and can opt also to buy health insurance – a substantial source of security in the vulnerable world that most informal workers inhabit.
The number of registrations has more than doubled each year since the initiative started in 2004. As mentioned, in addition to the Maistries, individual wage earners also register with LabourNet. As might be expected (see Table 3) while the Maistries spot the value of a LabourNet registration first, growing numbers of wage earners who have mobile phones, also starting to do so.
Table 2: LabourNet registrations snapshot
Year Number of workers enrolled*
2004–05 518
2005–06 1237
2006–07 2662
2007–08 5452
* includes maistries and workers
Table 3: Distribution of workers
Maistries Wage earners Tota
Bar Bender 170 138 308
Carpenter 665 364 1029
Plumber 258 69 327
Electrician 262 90 352
Mason 790 1176 1966
Painter 402 352 754
Other 570 146 716
Total 3117 2335 5452
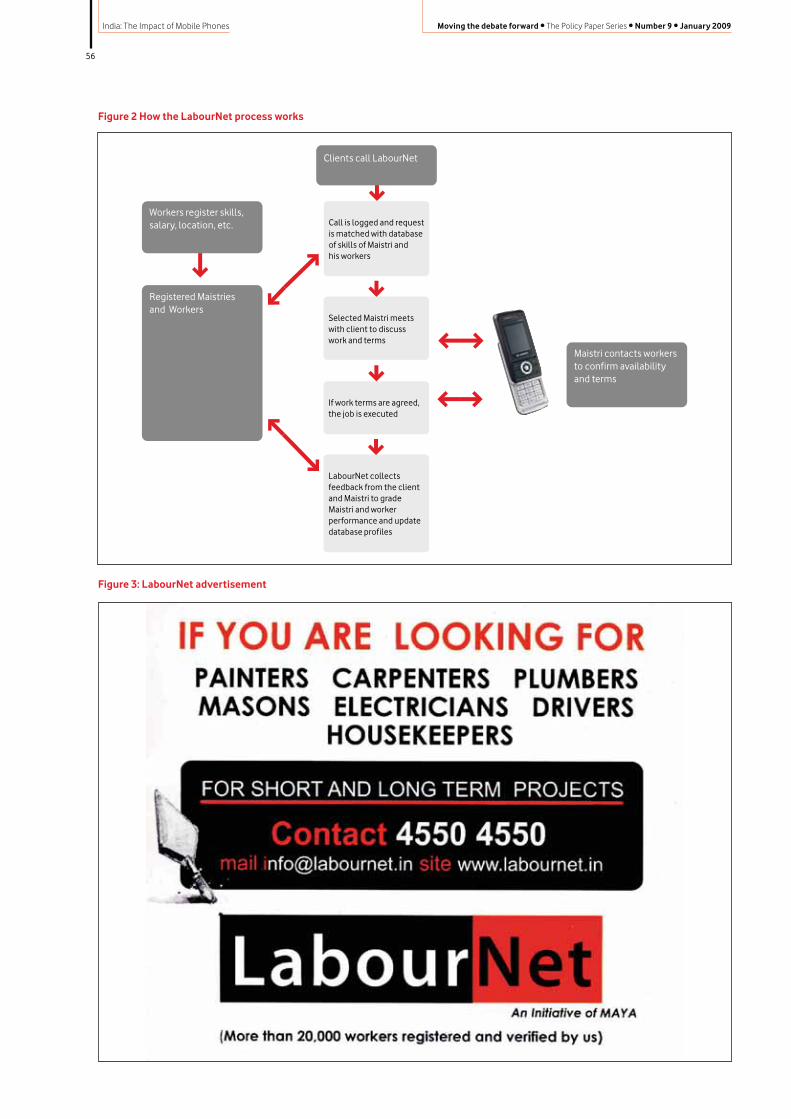
56
India: The Impact of Mobile Phones Moving the debate forward • The Policy Paper Series • Number 9 • January 2009
Figure 2 How the LabourNet process works
Figure 3: LabourNet advertisement
Clients call LabourNet
Call is logged and request is matched with database of skills of Maistri and his workers
Selected Maistri meets with client to discuss work and terms
If work terms are agreed,the job is executed
LabourNet collects feedback from the client and Maistri to grade Maistri and worker performance and update database profiles
Workers register skills, salary, location, etc.
Registered Maistries and Workers
Maistri contacts workers to confirm availability and terms
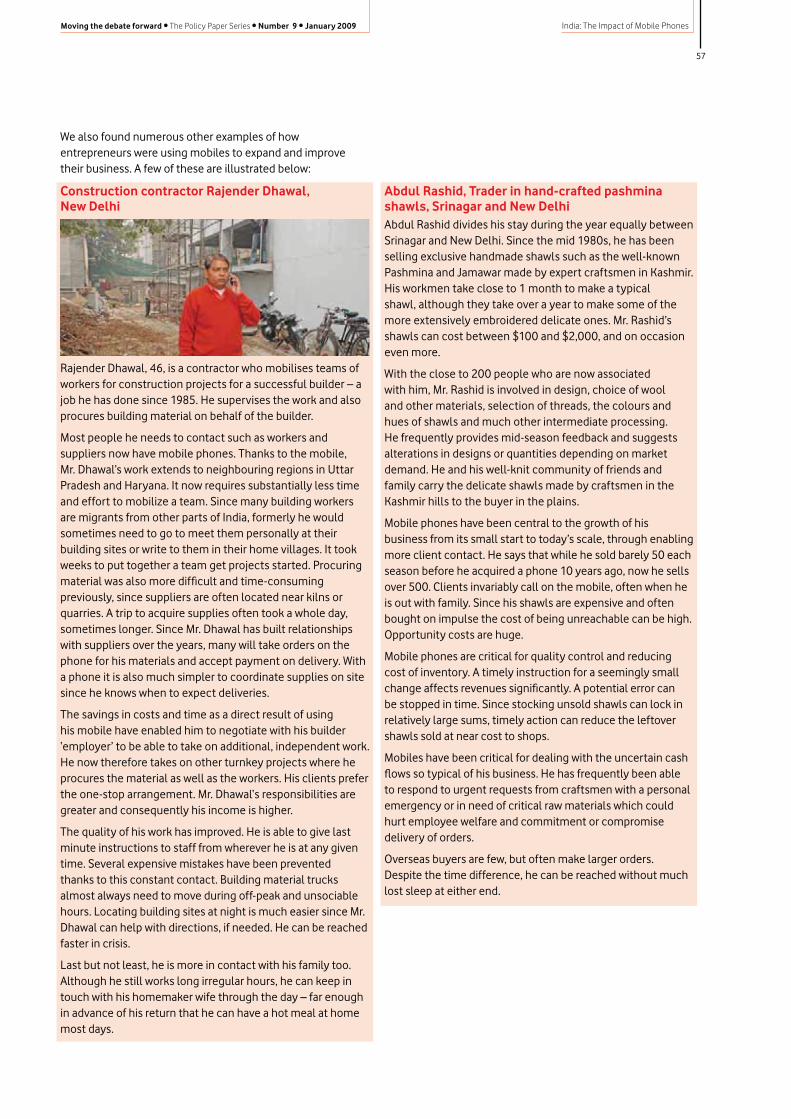
57
India: The Impact of Mobile PhonesMoving the debate forward • The Policy Paper Series • Number 9 • January 2009
We also found numerous other examples of how entrepreneurs were using mobiles to expand and improve their business. A few of these are illustrated below:
Construction contractor Rajender Dhawal, New Delhi
Rajender Dhawal, 46, is a contractor who mobilises teams of workers for construction projects for a successful builder – a job he has done since 1985. He supervises the work and also procures building material on behalf of the builder.
Most people he needs to contact such as workers and suppliers now have mobile phones. Thanks to the mobile, Mr. Dhawal’s work extends to neighbouring regions in Uttar Pradesh and Haryana. It now requires substantially less time and effort to mobilize a team. Since many building workers are migrants from other parts of India, formerly he would sometimes need to go to meet them personally at their building sites or write to them in their home villages. It took weeks to put together a team get projects started. Procuring material was also more difficult and time-consuming previously, since suppliers are often located near kilns or quarries. A trip to acquire supplies often took a whole day, sometimes longer. Since Mr. Dhawal has built relationships with suppliers over the years, many will take orders on the phone for his materials and accept payment on delivery. With a phone it is also much simpler to coordinate supplies on site since he knows when to expect deliveries.
The savings in costs and time as a direct result of using his mobile have enabled him to negotiate with his builder ‘employer’ to be able to take on additional, independent work. He now therefore takes on other turnkey projects where he procures the material as well as the workers. His clients prefer the one-stop arrangement. Mr. Dhawal‘s responsibilities are greater and consequently his income is higher.
The quality of his work has improved. He is able to give last minute instructions to staff from wherever he is at any given time. Several expensive mistakes have been prevented thanks to this constant contact. Building material trucks almost always need to move during off-peak and unsociable hours. Locating building sites at night is much easier since Mr. Dhawal can help with directions, if needed. He can be reached faster in crisis.
Last but not least, he is more in contact with his family too. Although he still works long irregular hours, he can keep in touch with his homemaker wife through the day – far enough in advance of his return that he can have a hot meal at home most days.
Abdul Rashid, Trader in hand-crafted pashmina shawls, Srinagar and New DelhiAbdul Rashid divides his stay during the year equally between Srinagar and New Delhi. Since the mid 1980s, he has been selling exclusive handmade shawls such as the well-known Pashmina and Jamawar made by expert craftsmen in Kashmir. His workmen take close to 1 month to make a typical shawl, although they take over a year to make some of the more extensively embroidered delicate ones. Mr. Rashid’s shawls can cost between $100 and $2,000, and on occasion even more.
With the close to 200 people who are now associated with him, Mr. Rashid is involved in design, choice of wool and other materials, selection of threads, the colours and hues of shawls and much other intermediate processing. He frequently provides mid-season feedback and suggests alterations in designs or quantities depending on market demand. He and his well-knit community of friends and family carry the delicate shawls made by craftsmen in the Kashmir hills to the buyer in the plains.
Mobile phones have been central to the growth of his business from its small start to today’s scale, through enabling more client contact. He says that while he sold barely 50 each season before he acquired a phone 10 years ago, now he sells over 500. Clients invariably call on the mobile, often when he is out with family. Since his shawls are expensive and often bought on impulse the cost of being unreachable can be high. Opportunity costs are huge.
Mobile phones are critical for quality control and reducing cost of inventory. A timely instruction for a seemingly small change affects revenues significantly. A potential error can be stopped in time. Since stocking unsold shawls can lock in relatively large sums, timely action can reduce the leftover shawls sold at near cost to shops.
Mobiles have been critical for dealing with the uncertain cash flows so typical of his business. He has frequently been able to respond to urgent requests from craftsmen with a personal emergency or in need of critical raw materials which could hurt employee welfare and commitment or compromise delivery of orders.
Overseas buyers are few, but often make larger orders. Despite the time difference, he can be reached without much lost sleep at either end.

58
India: The Impact of Mobile Phones Moving the debate forward • The Policy Paper Series • Number 9 • January 2009
Friends Travels and ToursMobile phones have enabled SMEs in the taxi business to grow bigger and better-organised. Sanjay Nagar, whose company Friends Tours & Travels was founded by his father in 1976, has been able to expand the business and improve its quality.
Mr. Nagar rents higher-end cars to Indian and overseas business visitors. He also has a substantial business providing smaller and cheaper cars to clients with less money to spend. Thanks to the steep fall in price of mobile handsets and phone usage charges in the past six years, he can now afford to equip each of his drivers with a mobile. Previously only the drivers of the more expensive cars had a phone. It is now easy to provide cars for all types of customer at short notice and to make last minute changes seamlessly, so the standard of service has improved. Customers’ lengthy waits without any information for a driver who might be delayed are largely a thing of the past.
The company’s cars are also fitted with Global Positioning System (GPS) equipment which makes it possible to track them at almost all times using the software installed on the computers in his control room. The combination of GPS and mobile phones enables the controllers to provide accurate information to clients about when their cars will reach them. For clients arriving at the Delhi airport, the company sends a text message as soon as their flights land at the airport. The SMS includes the name and phone number of driver waiting for them, and the make and registration number of the car, along with the company’s contact details. The client and driver no longer struggle to identify each other, whereas in pre-mobile days it was not uncommon for clients to be poached or duped by unscrupulous competitors.
Clients receive more transparent bills and Mr. Nagar knows this means he will retain them more easily. Drivers who stray from the agreed route are easy to identify.
His cars are more secure too. The GPS device in his cars has a mobile interface. This makes it possible to thwart attempts to steal the cars. A simple SMS with a specific code as text shuts off the car’s ignition and immobilizes it; and the technology can also tell him the exact spot where his car was abandoned.
Monitoring costs of fuel and maintenance is easier now it is possibly to ascertain accurately the route taken by car. With costs easier to control and effective monitoring less of a challenge, Mr. Nagar has now invested in bigger cars which provide him much better rate of return on investment than that on the smaller budget cars.
Radio CabsA number of more recently-founded radio taxi services such as Meru Cabs, Easy Cabs and Mega Cabs have become available to Indian urban consumers in recent years. These newer players leverage GPS and mobile technologies in an integrated fashion. Typically, the client of a radio cab company calls for a taxi an easy-to-remember phone number like 44224422. With the GPS technology deployed in the company’s call centre and in its cars on the road, it is easy to scan the neighbourhood for an available cab. The same system is able to call the driver in the car to confirm if and when he can reach the client at the requested time.
Radio Cabs – currently operating in 4 cities, Delhi, Mumbai, Hyderabad and Bangalore – is estimated to have attained revenues of Rs54.7 million (US$) in barely 4 years since the first services began.13 The market has grown over 50% annually in recent years. Meru, the largest in size, is less than one year old. Radio taxis offer more transparent billing to customers and can often be less expensive than the ordinary taxi with the meter running as the older technologies can be tampered with more easily. Not surprisingly, the radio cab business has flourished in recent years.
Table 4 Radio taxi firms
Company Already operational
Fleet size
Expanding in cities
Meru Cabs Mumbai, Hyderabad, Delhi & Bangalore
1600 Chennai, Kolkata & Pune
Select Cabs Hyderabad 100 Delhi & Mumbai
Forsche Mumbai & New Delhi
60–70 –
Mega Cabs Delhi, Chandigarh, Mumbai
– Goa & Hyderabad
Easy Cabs Chandigarh, Delhi, Hyderabad & Bangalore
1400 Mumbai, Chennai & Pune
Source: http://www.travelbizmonitor.com/radio-cabs-switch-to-top-gear-in-india
The managers and the drivers have a healthier working relationship since the technology – whose exact use varies between the taxi companies – offers the drivers equitable access to lucrative and less-attractive routes, and makes monitoring of their performance transparent. Managers can control costs and quality far more effectively. This means that good drivers are easier to reward and retain. Driver incomes have risen. Equally important, the quality of environment in which they operate has improved noticeably. Drivers find their work hours more predictable and are able to devote quality time to their families.
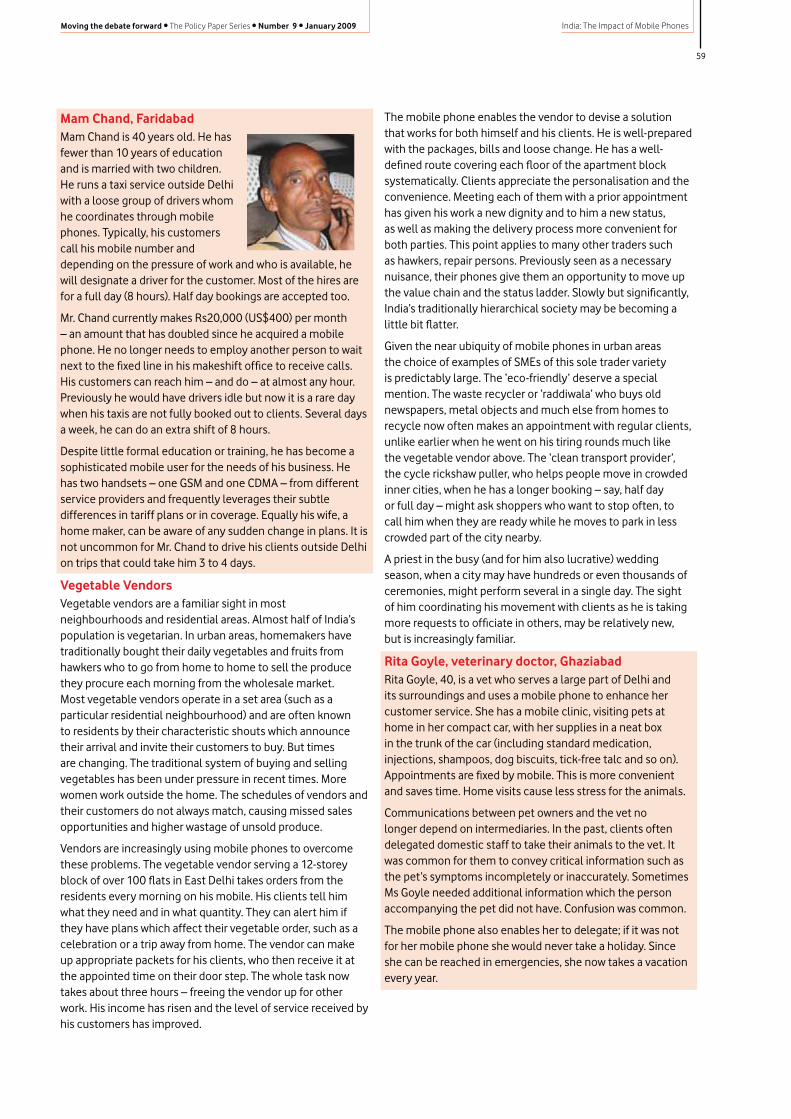
59
India: The Impact of Mobile PhonesMoving the debate forward • The Policy Paper Series • Number 9 • January 2009
Mam Chand, FaridabadMam Chand is 40 years old. He has fewer than 10 years of education and is married with two children. He runs a taxi service outside Delhi with a loose group of drivers whom he coordinates through mobile phones. Typically, his customers call his mobile number and depending on the pressure of work and who is available, he will designate a driver for the customer. Most of the hires are for a full day (8 hours). Half day bookings are accepted too.
Mr. Chand currently makes Rs20,000 (US$400) per month – an amount that has doubled since he acquired a mobile phone. He no longer needs to employ another person to wait next to the fixed line in his makeshift office to receive calls. His customers can reach him – and do – at almost any hour. Previously he would have drivers idle but now it is a rare day when his taxis are not fully booked out to clients. Several days a week, he can do an extra shift of 8 hours.
Despite little formal education or training, he has become a sophisticated mobile user for the needs of his business. He has two handsets – one GSM and one CDMA – from different service providers and frequently leverages their subtle differences in tariff plans or in coverage. Equally his wife, a home maker, can be aware of any sudden change in plans. It is not uncommon for Mr. Chand to drive his clients outside Delhi on trips that could take him 3 to 4 days.
Vegetable Vendors Vegetable vendors are a familiar sight in most neighbourhoods and residential areas. Almost half of India’s population is vegetarian. In urban areas, homemakers have traditionally bought their daily vegetables and fruits from hawkers who to go from home to home to sell the produce they procure each morning from the wholesale market. Most vegetable vendors operate in a set area (such as a particular residential neighbourhood) and are often known to residents by their characteristic shouts which announce their arrival and invite their customers to buy. But times are changing. The traditional system of buying and selling vegetables has been under pressure in recent times. More women work outside the home. The schedules of vendors and their customers do not always match, causing missed sales opportunities and higher wastage of unsold produce.
Vendors are increasingly using mobile phones to overcome these problems. The vegetable vendor serving a 12-storey block of over 100 flats in East Delhi takes orders from the residents every morning on his mobile. His clients tell him what they need and in what quantity. They can alert him if they have plans which affect their vegetable order, such as a celebration or a trip away from home. The vendor can make up appropriate packets for his clients, who then receive it at the appointed time on their door step. The whole task now takes about three hours – freeing the vendor up for other work. His income has risen and the level of service received by his customers has improved.
The mobile phone enables the vendor to devise a solution that works for both himself and his clients. He is well-prepared with the packages, bills and loose change. He has a well-defined route covering each floor of the apartment block systematically. Clients appreciate the personalisation and the convenience. Meeting each of them with a prior appointment has given his work a new dignity and to him a new status, as well as making the delivery process more convenient for both parties. This point applies to many other traders such as hawkers, repair persons. Previously seen as a necessary nuisance, their phones give them an opportunity to move up the value chain and the status ladder. Slowly but significantly, India’s traditionally hierarchical society may be becoming a little bit flatter.
Given the near ubiquity of mobile phones in urban areas the choice of examples of SMEs of this sole trader variety is predictably large. The ‘eco-friendly’ deserve a special mention. The waste recycler or ‘raddiwala’ who buys old newspapers, metal objects and much else from homes to recycle now often makes an appointment with regular clients, unlike earlier when he went on his tiring rounds much like the vegetable vendor above. The ‘clean transport provider’, the cycle rickshaw puller, who helps people move in crowded inner cities, when he has a longer booking – say, half day or full day – might ask shoppers who want to stop often, to call him when they are ready while he moves to park in less crowded part of the city nearby.
A priest in the busy (and for him also lucrative) wedding season, when a city may have hundreds or even thousands of ceremonies, might perform several in a single day. The sight of him coordinating his movement with clients as he is taking more requests to officiate in others, may be relatively new, but is increasingly familiar.
Rita Goyle, veterinary doctor, GhaziabadRita Goyle, 40, is a vet who serves a large part of Delhi and its surroundings and uses a mobile phone to enhance her customer service. She has a mobile clinic, visiting pets at home in her compact car, with her supplies in a neat box in the trunk of the car (including standard medication, injections, shampoos, dog biscuits, tick-free talc and so on). Appointments are fixed by mobile. This is more convenient and saves time. Home visits cause less stress for the animals.
Communications between pet owners and the vet no longer depend on intermediaries. In the past, clients often delegated domestic staff to take their animals to the vet. It was common for them to convey critical information such as the pet’s symptoms incompletely or inaccurately. Sometimes Ms Goyle needed additional information which the person accompanying the pet did not have. Confusion was common.
The mobile phone also enables her to delegate; if it was not for her mobile phone she would never take a holiday. Since she can be reached in emergencies, she now takes a vacation every year.
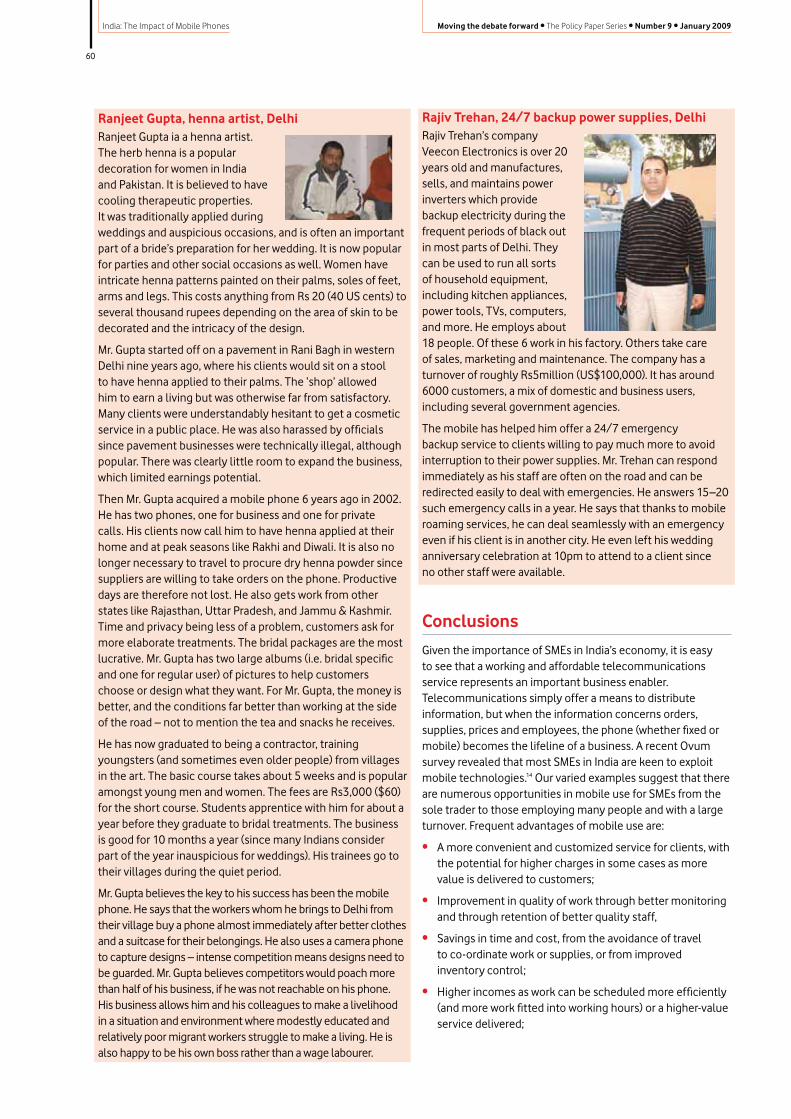
60
India: The Impact of Mobile Phones Moving the debate forward • The Policy Paper Series • Number 9 • January 2009
Ranjeet Gupta, henna artist, DelhiRanjeet Gupta ia a henna artist. The herb henna is a popular decoration for women in India and Pakistan. It is believed to have cooling therapeutic properties. It was traditionally applied during weddings and auspicious occasions, and is often an important part of a bride’s preparation for her wedding. It is now popular for parties and other social occasions as well. Women have intricate henna patterns painted on their palms, soles of feet, arms and legs. This costs anything from Rs 20 (40 US cents) to several thousand rupees depending on the area of skin to be decorated and the intricacy of the design.
Mr. Gupta started off on a pavement in Rani Bagh in western Delhi nine years ago, where his clients would sit on a stool to have henna applied to their palms. The ‘shop’ allowed him to earn a living but was otherwise far from satisfactory. Many clients were understandably hesitant to get a cosmetic service in a public place. He was also harassed by officials since pavement businesses were technically illegal, although popular. There was clearly little room to expand the business, which limited earnings potential.
Then Mr. Gupta acquired a mobile phone 6 years ago in 2002. He has two phones, one for business and one for private calls. His clients now call him to have henna applied at their home and at peak seasons like Rakhi and Diwali. It is also no longer necessary to travel to procure dry henna powder since suppliers are willing to take orders on the phone. Productive days are therefore not lost. He also gets work from other states like Rajasthan, Uttar Pradesh, and Jammu & Kashmir. Time and privacy being less of a problem, customers ask for more elaborate treatments. The bridal packages are the most lucrative. Mr. Gupta has two large albums (i.e. bridal specific and one for regular user) of pictures to help customers choose or design what they want. For Mr. Gupta, the money is better, and the conditions far better than working at the side of the road – not to mention the tea and snacks he receives.
He has now graduated to being a contractor, training youngsters (and sometimes even older people) from villages in the art. The basic course takes about 5 weeks and is popular amongst young men and women. The fees are Rs3,000 ($60) for the short course. Students apprentice with him for about a year before they graduate to bridal treatments. The business is good for 10 months a year (since many Indians consider part of the year inauspicious for weddings). His trainees go to their villages during the quiet period.
Mr. Gupta believes the key to his success has been the mobile phone. He says that the workers whom he brings to Delhi from their village buy a phone almost immediately after better clothes and a suitcase for their belongings. He also uses a camera phone to capture designs – intense competition means designs need to be guarded. Mr. Gupta believes competitors would poach more than half of his business, if he was not reachable on his phone. His business allows him and his colleagues to make a livelihood in a situation and environment where modestly educated and relatively poor migrant workers struggle to make a living. He is also happy to be his own boss rather than a wage labourer.
Rajiv Trehan, 24/7 backup power supplies, DelhiRajiv Trehan’s company Veecon Electronics is over 20 years old and manufactures, sells, and maintains power inverters which provide backup electricity during the frequent periods of black out in most parts of Delhi. They can be used to run all sorts of household equipment, including kitchen appliances, power tools, TVs, computers, and more. He employs about 18 people. Of these 6 work in his factory. Others take care of sales, marketing and maintenance. The company has a turnover of roughly Rs5million (US$100,000). It has around 6000 customers, a mix of domestic and business users, including several government agencies.
The mobile has helped him offer a 24/7 emergency backup service to clients willing to pay much more to avoid interruption to their power supplies. Mr. Trehan can respond immediately as his staff are often on the road and can be redirected easily to deal with emergencies. He answers 15–20 such emergency calls in a year. He says that thanks to mobile roaming services, he can deal seamlessly with an emergency even if his client is in another city. He even left his wedding anniversary celebration at 10pm to attend to a client since no other staff were available.
Conclusions
Given the importance of SMEs in India’s economy, it is easy to see that a working and affordable telecommunications service represents an important business enabler. Telecommunications simply offer a means to distribute information, but when the information concerns orders, supplies, prices and employees, the phone (whether fixed or mobile) becomes the lifeline of a business. A recent Ovum survey revealed that most SMEs in India are keen to exploit mobile technologies.14 Our varied examples suggest that there are numerous opportunities in mobile use for SMEs from the sole trader to those employing many people and with a large turnover. Frequent advantages of mobile use are:
• A more convenient and customized service for clients, with the potential for higher charges in some cases as more value is delivered to customers;
• Improvement in quality of work through better monitoring and through retention of better quality staff,
• Savings in time and cost, from the avoidance of travel to co-ordinate work or supplies, or from improved inventory control;
• Higher incomes as work can be scheduled more efficiently (and more work fitted into working hours) or a higher-value service delivered;
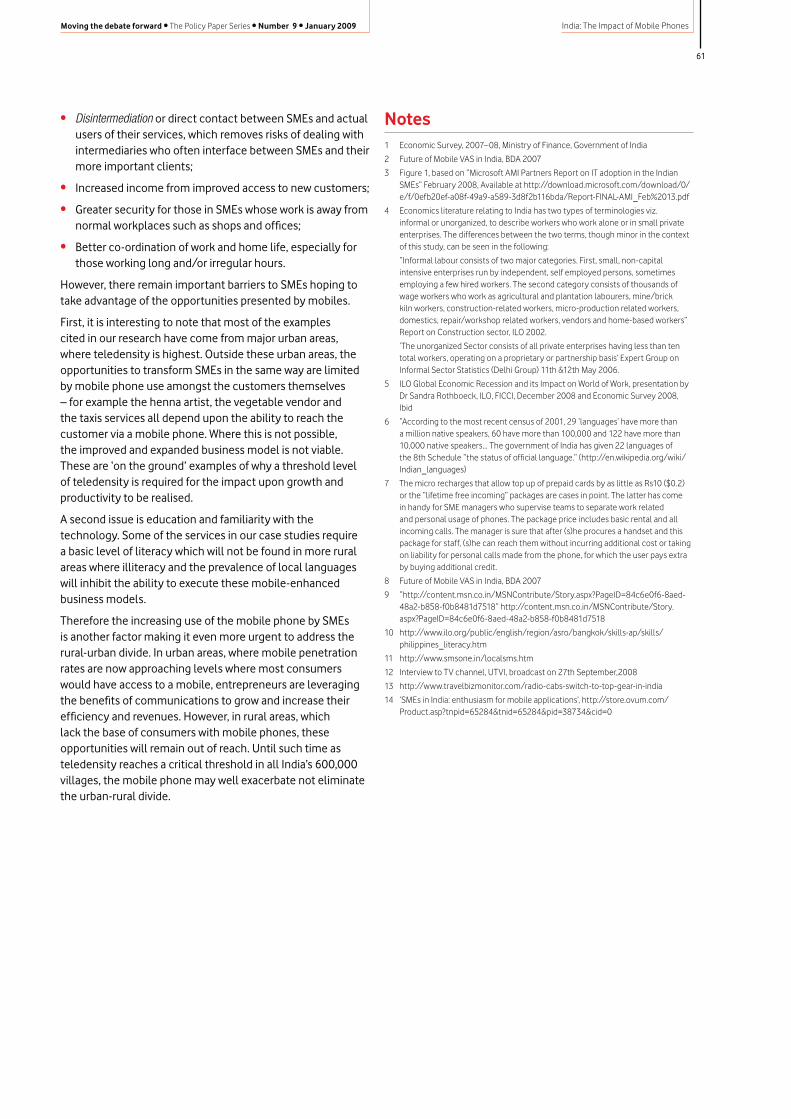
61
India: The Impact of Mobile PhonesMoving the debate forward • The Policy Paper Series • Number 9 • January 2009
• Disintermediation or direct contact between SMEs and actual users of their services, which removes risks of dealing with intermediaries who often interface between SMEs and their more important clients;
• Increased income from improved access to new customers;
• Greater security for those in SMEs whose work is away from normal workplaces such as shops and offices;
• Better co-ordination of work and home life, especially for those working long and/or irregular hours.
However, there remain important barriers to SMEs hoping to take advantage of the opportunities presented by mobiles.
First, it is interesting to note that most of the examples cited in our research have come from major urban areas, where teledensity is highest. Outside these urban areas, the opportunities to transform SMEs in the same way are limited by mobile phone use amongst the customers themselves – for example the henna artist, the vegetable vendor and the taxis services all depend upon the ability to reach the customer via a mobile phone. Where this is not possible, the improved and expanded business model is not viable. These are ‘on the ground’ examples of why a threshold level of teledensity is required for the impact upon growth and productivity to be realised.
A second issue is education and familiarity with the technology. Some of the services in our case studies require a basic level of literacy which will not be found in more rural areas where illiteracy and the prevalence of local languages will inhibit the ability to execute these mobile-enhanced business models.
Therefore the increasing use of the mobile phone by SMEs is another factor making it even more urgent to address the rural-urban divide. In urban areas, where mobile penetration rates are now approaching levels where most consumers would have access to a mobile, entrepreneurs are leveraging the benefits of communications to grow and increase their efficiency and revenues. However, in rural areas, which lack the base of consumers with mobile phones, these opportunities will remain out of reach. Until such time as teledensity reaches a critical threshold in all India’s 600,000 villages, the mobile phone may well exacerbate not eliminate the urban-rural divide.
Notes1 Economic Survey, 2007–08, Ministry of Finance, Government of India
2 Future of Mobile VAS in India, BDA 2007
3 Figure 1, based on “Microsoft AMI Partners Report on IT adoption in the Indian SMEs” February 2008, Available at http://download.microsoft.com/download/0/e/f/0efb20ef-a08f-49a9-a589-3d8f2b116bda/Report-FINAL-AMI_Feb%2013.pdf
4 Economics literature relating to India has two types of terminologies viz. informal or unorganized, to describe workers who work alone or in small private enterprises. The differences between the two terms, though minor in the context of this study, can be seen in the following:
“Informal labour consists of two major categories. First, small, non-capital intensive enterprises run by independent, self employed persons, sometimes employing a few hired workers. The second category consists of thousands of wage workers who work as agricultural and plantation labourers, mine/brick kiln workers, construction-related workers, micro-production related workers, domestics, repair/workshop related workers, vendors and home-based workers” Report on Construction sector, ILO 2002.
‘The unorganized Sector consists of all private enterprises having less than ten total workers, operating on a proprietary or partnership basis’ Expert Group on Informal Sector Statistics (Delhi Group) 11th &12th May 2006.
5 ILO Global Economic Recession and its Impact on World of Work, presentation by Dr Sandra Rothboeck, ILO, FICCI, December 2008 and Economic Survey 2008, Ibid
6 “According to the most recent census of 2001, 29 ‘languages’ have more than a million native speakers, 60 have more than 100,000 and 122 have more than 10,000 native speakers… The government of India has given 22 languages of the 8th Schedule “the status of official language.” (http://en.wikipedia.org/wiki/Indian_languages)
7 The micro recharges that allow top up of prepaid cards by as little as Rs10 ($0.2) or the “lifetime free incoming” packages are cases in point. The latter has come in handy for SME managers who supervise teams to separate work related and personal usage of phones. The package price includes basic rental and all incoming calls. The manager is sure that after (s)he procures a handset and this package for staff, (s)he can reach them without incurring additional cost or taking on liability for personal calls made from the phone, for which the user pays extra by buying additional credit.
8 Future of Mobile VAS in India, BDA 2007
9 “http://content.msn.co.in/MSNContribute/Story.aspx?PageID=84c6e0f6-8aed-48a2-b858-f0b8481d7518” http://content.msn.co.in/MSNContribute/Story.aspx?PageID=84c6e0f6-8aed-48a2-b858-f0b8481d7518
10 http://www.ilo.org/public/english/region/asro/bangkok/skills-ap/skills/philippines_literacy.htm
11 http://www.smsone.in/localsms.htm
12 Interview to TV channel, UTVI, broadcast on 27th September,2008
13 http://www.travelbizmonitor.com/radio-cabs-switch-to-top-gear-in-india
14 ‘SMEs in India: enthusiasm for mobile applications’, http://store.ovum.com/Product.asp?tnpid=65284&tnid=65284&pid=38734&cid=0

62
India: The Impact of Mobile Phones Moving the debate forward • The Policy Paper Series • Number 9 • January 2009
Acknowledgements
The contribution of Vodafone’s SIM (Socio-economic Impact of Mobile) Advisory Panel in instigating and shaping this report is gratefully acknowledged. Diane Coyle, Advisory Panel chair, edited the report. The panel members are: Professor Marc Ivaldi, Ilkka Lakaniemi, David Porteous, Amanda Rowlatt, Professor Len Waverman and Professor Howard Williams. We thank them, and also Neil Gough, Director, Public Policy – Emerging Markets and Joaquim Croca Head of CR Reporting & Performance, of Vodafone, for all their comments and advice.
A report of this scope naturally collects numerous debts along the way and we gratefully and humbly acknowledge the intellectual contribution of many who are mentioned below. But equally important has been the contribution of those who remain nameless but without whose wisdom, we would have fallen short. The farmers and fishermen in remote villages who were gracious with both their time and insights, the technicians, artisans and vegetable vendors who readily agreed to speak with us for hours with no apparent payoff, the Small and Medium Enterprises that unhesitatingly agreed to our often imposing demands on their time, the farmers cooperative societies, all of them cannot imagine the impact their views have had on the quality of this report. To them we owe a huge debt of gratitude.
Collecting information, especially at the sub-national level in India can be taxing at the best of times. The second half of 2008, during which time the team gathered most of the data, gripped as it was by the global financial crisis, can hardly be described as the best of times. Despite their other exigencies, institutions such as IFFCO-IKSL, RML, ITC, MSSRF, LabourNet, JustDial Drishti, Eko, CKS, Friends Tours and Travels, TRAI and their teams of committed and helpful personnel never flinched at our demand for data and interviews. They corrected us when we were wrong, took surprisingly deep interest in our study and helped the ICRIER team to gain insight into many complex issues. We hope the report does justice to their involvement. We place on record our deep appreciation for their support.
We are also grateful to everyone who read, commented and gave advice at various stages of the report’s preparation, including Caroline Dewing and Jim Donahue of Vodafone. Besides, A.R. Thaigarajan, Aditya Dev Sood, Aditya Natesal, Amit Mehra, Anand Kute, Basant Dixit, Gayathri Vasudevan, Gavin d’Abreo, Harish Tomar, Kshitij Karnad, Manoranjan Kumar, Mansi Kohli, Nancy, Nitish Kumar, Nitesh N Bhiwgade, Pankaj Vashisht, Paul Breloff, Pramod Kumar, Prashaant Jain, Praveen Gaur, Rakesh Kapur, Rohan Samarajiva, S Senthilkumaran, Shabbir N. Mulla, Siva Kumar, Swapnil Naik, Satyan Misra, Subho Roy, Surendran, T. Sudhakar, Umesh Kumawat and Suresh Tomar all deserve to be thanked. To colleagues at ICRIER who stood ready to help at every conceivable hour, including Christmas, we are much obliged. A special mention for Rajkumar Shahi our resident IT expert, who never failed to deliver us from the evils of system crashes, whose frequency predictably increased as the deadline drew closer.
For any errors remaining in the report, we claim responsibility.
63
India: The Impact of Mobile PhonesMoving the debate forward • The Policy Paper Series • Number 9 • January 2009
Glossary
2G Second Generation of tele standards
3G Third Generation of tele standards
ADC Access Deficit Charge
BWA Broadband Wireless Access
COAI Cellular Regulatory Authority of India
CPP Calling Party Pays
CSC Community Service Centre
CSO Central Statistical Organisation
DoT Department of Telecommunication
GDP Gross Domestic Product
GPS Global Positioning System
GSDP Gross State Domestic Product
ICT Information and Communications Technology
IFFCO Indian Farmers Fertiliser Cooperatives Limited
IKSL IFFCO Kisan Sanchar Ltd.
IP Internet Protocol
ITU International Telecommunications union
MSSRF M.S. Swaminathan Research Foundation
MVAS Mobile Value Added Services
SME Small & Medium Enterprises
MSME Micro, Small and Medium Enterprises
GSM Global System for Mobile
CDMA Code Division Multiple Access
NSS National Sample Survey
RML Reuters Market Light
SMS Short Messaging Service
TRAI Telecom Regulatory Authority of India
USOF Universal Service Obligation Fund
VAS Value Added Service
CKS Center for Knowledge Societies
VOIP Voice-Over-Internet Protocol
WAP Wireless Application Protocol
WPC Wireless Planning and Coordination

64
India: The Impact of Mobile Phones Moving the debate forward • The Policy Paper Series • Number 9 • January 2009
Notes

c
India: The Impact of Mobile PhonesMoving the debate forward • The Policy Paper Series • Number 9 • January 2009
To keep the environmental impact of this document to a minimum, we have given careful consideration to the production process. The paper used was manufactured in the UK at mills with ISO14001 accreditation. It is 75% recycled from de-inked post consumer waste. The document was printed in accordance with the ISO14001 environmental management system. All the steps we have taken demonstrate our commitment to making sustainable choices.
Designed and produced by Barrett Howe Plc


