31
1 India-USA Trade Relations Trends and Observations

1
India-USA Trade Relations
Trends and Observations

2
CONTENTS
S.No. Particulars P.No.
1 Executive Summary 3
2 Indo-USA: Significant Trade Partners 6
3 India-USA: Deep Rooted Relations 6
4 Loss of India ‘s Share in USA Market - An Analysis 7
5 Markets where India’s % share has shifted 12
6 Impact of GSP withdrawal by USA for Indian G&J products on India’s position in USA market
13
7 Conclusions and Suggestions 20
8 Annexure 21

3
4
EXECUTIVE SUMMARYIndia and USA relations are historically deep rooted and have gone strength in strength over a period of time. India’s exports to USA of gem and jewellery exports rose from US$5.14 billion in 2007 to US$9.55 in 2019 and India’s imports from USA increased from US$1.02 billion to US$6.75 billion during the said time period.
This is in response to Indian Embassy letter whereby GJEPC was cautioned about falling USA imports of gem and jewellery products from India the Council has conducted a brief analysis wherein all the gem and jewellery commodities which are imported by USA from India have been investigated in relation to the World.
While doing the analysis, we have selected 15 gem and jewellery commodities at HS code -8-digit level for the last 3 years, 2017, 2018 and 2019. Since, these are the key commodities which are imported by USA from India, therefore have been considered for the analysis. Further, India’s % share in USA imports of all these commodities over the 3 years have been analysed.
The analysis is categorised in 5 parts:
1. Commodities in which India has recorded a rising and share in USA market.
2. Commodities in which India has recorded falling share in USA market.
3. Countries where India’s share has been shifted.
4. Impact of GSP withdrawal by USA for Indian G&J products on India’s position in USA market.
5. A way to regain the lost share in USA market : Discussion
KEY OBSERVATIONS 1. Commodities in which India has recorded a rising share in USA market.
This is found that %share of India in USA imports of the diamonds, precious, semi-precious and synthetic stones and imitation jewellery has increased during the span of three years 2017 to 2019.
Few of the silver and gold jewellery products have also shown a rise in India’s % share in USA market during the said time period. This includes a) Silver articles of jewellery and parts thereof, nesoi, valued over $18 per dozen pieces or parts b) Gold necklaces and neck chains (o/than of rope or mixed links and c) Precious metal (o/than silver) articles of jewellery and parts thereof, whether or not plated or clad with precious metal, nesoi
2. Commodities in which India has recorded falling share in USA market
This is found that %share of India in USA imports for the various silver and gold jewellery products have declined in 2019 as compared to 2018 and 2017.
a) Silver rope, curb, etc. in continuous lengths, whether or not plated/clad with other precious metal, suitable for jewellery manufacture b) Silver articles of jewellery and parts thereof, nesoi, valued not over $18 per dozen pieces or parts c) Precious metal (o/than silver) rope, curb, etc. in continuous lengths, whether or not plated/clad precious metal, for jewellery manufacture d) Gold rope necklaces and neck chains e) Gold mixed link necklaces and neck chains f) Precious metal (o/than silver) clasps and parts thereof and g) Jewellery and Parts thereof, whether or not plated or clad with precious metal, nesoi.

5
3. Markets where India’s % share has shifted
This has been observed that the products in which India has lost share in USA market for G&J products have shifted to the other markets including Indonesia, China, Germany, Thailand, Peru, Turkey, Indonesia, Oman and France.
USA GSP Scheme and India
Gem and Jewellery products were also receiving the GSP treatment meaning thereby the products were imported in USA at preferential duty rates which resulted in increase in exports of the said products to USA significantly. During the years 2003-2007, the GSP imports of gems and jewellery in USA grew rapidly and this became the major commodity on India‘s GSP exports, accounting for 40% or more of the total GSP imports from India.
The major cause for the decline in GSP imports from India was the revocation in 2007 of competitive need limitation waiver (originally granted in 2001) in respect of certain jewellery items (HSUS 71131929 and 71131950) and further revocation of the 2001 waiver in 2009 of another category (HSUS 71131925). The US took further action to exclude in 2009 one other category (HSUS 71131921) on account of the competitive need limitation.
Adverse impact of the exclusion of key gem and jewellery export commodities from GSP benefit by USA between 2007-2009
Eventually withdrawn of GSP benefit for the key jewellery products in the year 2007, 2008 and 2009 resulted attraction of MFN rate of around 5-6% at the USA customs territories and decline in exports of the various following high-volume jewellery exports from India.
• Articles of gold jewellery (HS Code 71131950)
• Gold rope necklaces and neck chains (HS code 71131921)
• Gold necklace and neck chains (HS code 71131929)
• Gold mixed links, necklaces and neck chains (HS code 71131925)
• Silver articles of jewellery and parts (HS code 71131150)
This is assessed that post the withdrawal of GSP benefit for jewellery products from India in 2007/2009 USA imports from India have witnessed a fall from US$2212 million in 2006 to US$1396.31 million in 2018.
On the other side rise in USA imports of the said products have observed to be increased from China, France, Indonesia, Italy, Oman and Switzerland. USA Imports of gold necklace and neck chain have increased from Canada, Indonesia, Italy, Oman, Singapore South Africa, Turkey, Belgium, China and Dominican Republic. USA imports of Gold role neckalces and neck chains have risen from Peru, Turkey and Indonesia. The country imports of Gold mixed links, necklaces and neck chains have increase from China, Italy, Indonesia, Oman, Thailand and imports of Silver articles of jewellery and parts have witnessed a significant rise from Thailand.

6
1. Indo-USA: Significant Trade Partners
India and the United States share strong trade relations for almost all the products including gem and jewellery. As evident from the fact that India’s gem and jewellery exports to USA are at US$9.55 billion which comprise of around 26% share in India’s total gem and jewellery exports of US$38.63 billion to the World. Similarly, India is one of the key sourcing countries of USA for gem and jewellery products. India constitute for around 17% share in USA total gem and jewellery imports of US$57.47 billion from the World (Refer – Table -1).
Table -1 India -USA Bilateral Trade Scenario - 2019
Particulars Amount (US billion)/% share
India’s total G&J exports 38.63
India’s exports of G&J to USA 9.55
% share of USA in India’s G&J exports 24.72%
USA imports of G&J from the World 57.47
USA imports of G&J from India 10.53
% share of India in USA G&J imports 16.91%
Source: GJEPC and USITC
2. India-USA: Deep Rooted Relations
India and USA relations are historically deep rooted and have gone strength in strength over a period of time. This is evident from the Table-2 that India’s exports to USA of gem and jewellery exports rose from US$5.14 billion in 2007 to US$9.55 in 2019 and India’s imports from USA increased from US$1.02 billion to US$6.75 billion during the said time period. Overall, India USA bilateral gem and jewellery trade got more than doubled from US$6.16 billion in 2007 to US$16.30 billion in 2019.
Table-2 USA Significance in India’s Gem and Jewellery Trade (US$billion)
Year India’s Exports to USA US$billion
% share in Exports
India’s Imports from USA US$ billion
% share in Imports
Total Trade US$billion
2007 5.14 26.88 1.02 3.71 6.16
2010 5.11 13.78 2.24 3.26 7.35
2015 8.27 21.29 3.45 5.78 11.72
2019 9.55 24.72 6.75 11.43 16.30
Source: DGCIS

7
While, this has been noted that India has been losing its share in USA market for gem and jewellery products for the last few years. This is to examine the case in detail we have conducted a brief analysis wherein all the gem and jewellery commodities which are imported by USA from India have been investigated in relation to the World.
3. Loss of India ‘s Share in USA Market - An Analysis
While doing the analysis, we have selected 15 gem and jewellery commodities at HS code -8-digit level for the last 3 years, 2017, 2018 and 2019. Since, these are the key commodities which are imported by USA from India, therefore have been considered for the analysis. Further, India’s % share in USA imports of all these commodities over the 3 years have been analysed. (Table - 6)
The analysis is categorised in 5 parts:
1. Commodities in which India has recorded a rising and share in USA market.
2. Commodities in which India has recorded falling share in USA market.
3. Countries where India’s share has been shifted.
4. Impact of GSP withdrawal by USA for Indian G&J products on India’s position in USA market.
5. A way to regain the lost share in USA market : Discussion
Key Observations
3.1. Commodities in which India has recorded a rising share in USA market.
• This is understood from the Table-3 & 6 that %share of India in USA imports of the diamonds, precious, semi-precious and synthetic stones and imitation jewellery has increased during the span of three years 2017 to 2019.
• Few of the gold and silver jewellery products have also shown a rise in India’s % share in USA market during the said time period. Commodities in which India’s share has increased in USA market are listed here below.

8
Table - 3
USA Imports from India in 2017, 2018 and 2019 which have witnessed rise in share in USA market
HS Codes Commodity Description Rise of % share in USA Market from 2017 to 2019
Diamonds/Precious and Semi-Precious Stones
710239Diamonds, Non-Industrial Worked Including Polished or Drilled
38% to 41%
710391Rubies, Sapphire and Emeralds oth-erwise worked
9.7% to 13%
710399Semiprecious Stones, otherwise worked
17.5% to 28%
710490Synthetic or Reconstructed Precious or Semi-Precious tones NESOI, oth-erwise worked
39% to 58.5%
Silver and Gold Jewellery
71131150Silver articles of jewellery and parts thereof, nesoi, valued over $18 per dozen pieces or parts
21.18% to 21.42%
Gold Jewellery
71131929Gold necklaces and neck chains (o/than of rope or mixed links)
7.5% to 8.16%
71131950
Precious metal (o/than silver) arti-cles of jewellery and parts thereof, whether or not plated or clad with precious metal, nesoi
22.3% to 27.1%
Imitations Jewellery
7117 Imitation Jewellery constant at 2.6%
Source: GJEPC based on USITC General Import Database as on 19th August 202
9
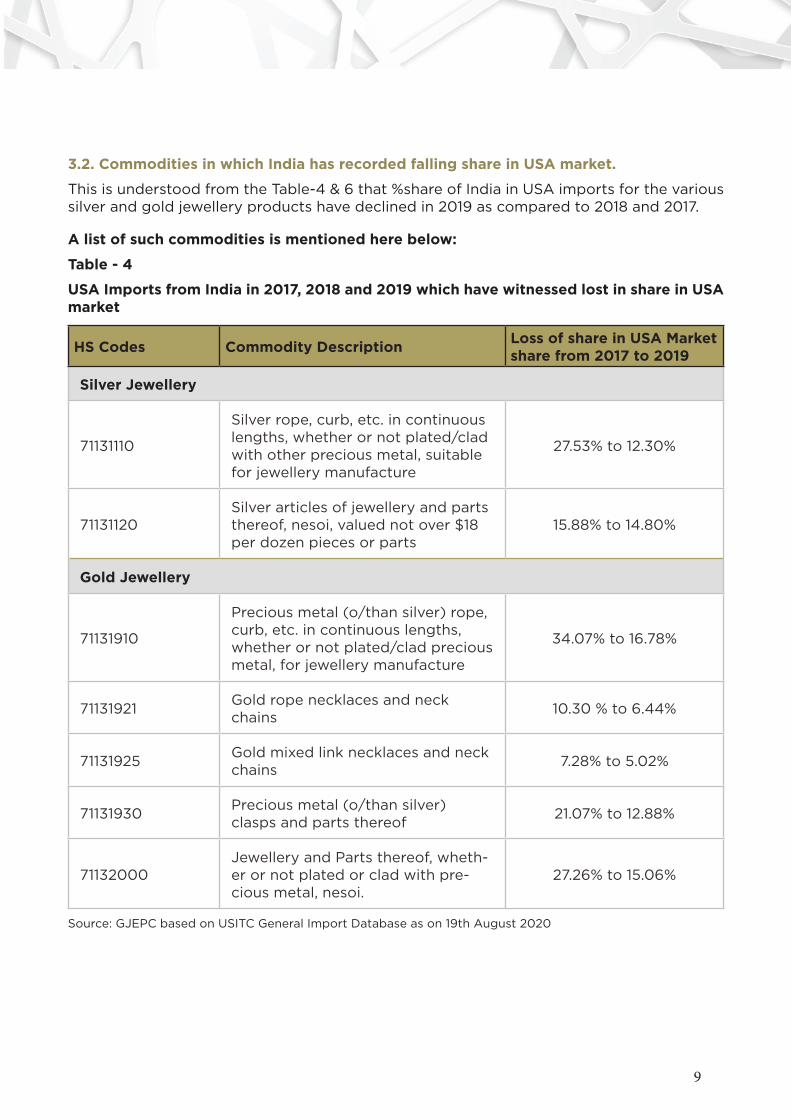
3.2. Commodities in which India has recorded falling share in USA market.
This is understood from the Table-4 & 6 that %share of India in USA imports for the various silver and gold jewellery products have declined in 2019 as compared to 2018 and 2017.
A list of such commodities is mentioned here below:
Table - 4
USA Imports from India in 2017, 2018 and 2019 which have witnessed lost in share in USA market
HS Codes Commodity Description Loss of share in USA Market share from 2017 to 2019
Silver Jewellery
71131110
Silver rope, curb, etc. in continuous lengths, whether or not plated/clad with other precious metal, suitable for jewellery manufacture
27.53% to 12.30%
71131120Silver articles of jewellery and parts thereof, nesoi, valued not over $18 per dozen pieces or parts
15.88% to 14.80%
Gold Jewellery
71131910
Precious metal (o/than silver) rope, curb, etc. in continuous lengths, whether or not plated/clad precious metal, for jewellery manufacture
34.07% to 16.78%
71131921Gold rope necklaces and neck chains
10.30 % to 6.44%
71131925Gold mixed link necklaces and neck chains
7.28% to 5.02%
71131930Precious metal (o/than silver) clasps and parts thereof
21.07% to 12.88%
71132000Jewellery and Parts thereof, wheth-er or not plated or clad with pre-cious metal, nesoi.
27.26% to 15.06%
Source: GJEPC based on USITC General Import Database as on 19th August 2020

10
3.3. India share in USA in over all gem and jewellery products
USA imports of G&J from India declined to US$10.53 billion in 2019 from US$11.34 billion in 2018. With this India’s % share in USA imports of all gem and jewellery products have recorded a decline from 19 % to 18.32% during the said period. (Table 5)
Table – 5
USA imports of G&J from World vis-à-vis India Trade Scenario – 2017 to 2019
Particulars USA imports from World US$billion
USA Imports from India US$billion
India % Share in USA Imports
2017 58.9 10.36 17.6%
2018 60 11.34 19%
2019 57.5 10.53 18.32%
Source: GJEPC and USITC

11
Table - 6 USA imports from India of Key Gem & Jewellery Commodities in 2017, 2018 and 2019
Source : USITC , 19th August 2020, General Imports
HT
S N
o.
De
scri
pti
on
Ye
ar
20
17Y
ear
20
18Y
ear
20
19
US
A I
mp
ort
s fr
om
Wo
rld
(U
S$
mil
lio
n)
US
A I
mp
ort
s fr
om
In
dia
(U
S$
mil
lio
n)
% s
hare
in
US
A
Imp
ort
s
US
A I
mp
ort
s fr
om
Wo
rld
(U
S$
mil
lio
n)
US
A I
mp
ort
s fr
om
In
dia
(U
S$
mil
lio
n)
% s
hare
in
US
A
Imp
ort
s
US
A I
mp
ort
s fr
om
Wo
rld
(U
S$
mil
lio
n)
US
A I
mp
ort
s fr
om
In
dia
(U
S$
mil
lio
n)
% s
hare
in
US
A
Imp
ort
s
71
Natu
ral o
r C
ult
ure
d P
earl
s, p
recio
us
or
Sem
ipre
cio
us
Sto
nes,
pre
cio
us
Meta
ls, P
recio
us
Meta
l C
lad
Meta
ls, A
rtcile
s th
ere
of;
Im
itati
on
je
welle
ry c
oin
.
58
,977.
91
10,3
63
.83
17.5
76
0,0
01.73
11,3
41.
32
18.9
057,
46
6.4
410
,528
.45
18.3
2
DIA
MO
ND
S &
PR
EC
IOU
S /
SE
MI
PR
EC
IOU
S S
TO
NE
S /
SY
NT
HE
TIC
ST
ON
ES
710
23
9 D
iam
on
ds,
No
n In
du
stri
al W
ork
ed
In
clu
din
g
Po
lsih
ed
or
Dri
lled
21,
54
2.8
48
,191.
42
38
.02
23
,29
5.8
59
,08
5.8
93
9.0
019
,45
5.9
57,
974
.164
0.9
9
710
39
1 R
ub
ies,
Sap
ph
ire a
nd
Em
era
lds
oth
erw
ise
wro
ked
1,
49
4.8
114
5.5
39
.74
1,5
65
.68
159
.41
10.1
81,1
08
.63
143
.51
12.9
4
710
39
9 S
em
ipre
cio
us
Sto
nes,
Oth
erw
ise w
ork
ed
5
91.73
103
.40
17.4
75
28
.21
108
.24
20
.49
557.
70
154
.64
27.
73
710
49
0 S
yn
theti
c o
r R
eco
nst
ructe
d P
recio
us
or
Sem
i P
recio
us
Sto
nes
NE
SO
I, O
therw
ise w
ork
ed
167.
94
65
.193
8.8
223
3.4
29
1.78
39
.32
40
5.4
7237.
175
8.4
9
SIL
VE
R J
EW
EL
LE
RY
PR
OD
UC
TS
711
311
10S
ilver
rop
e, c
urb
, etc
. in
co
nti
nu
ou
s le
ng
ths,
w
heth
er
or
no
t p
late
d/c
lad
wit
h o
ther
pre
cio
us
meta
l, su
itab
le f
or
jew
elr
y m
an
ufa
ctu
re8
.39
2.3
12
7.5
38
.72
2.0
92
3.9
77.
32
0.9
012
.30
711
311
20
Silv
er
art
icle
s o
f je
welr
y a
nd
part
s th
ere
of, n
eso
i, valu
ed
no
t o
ver
$18
per
do
zen
pie
ces
or
part
s5
1.9
08
.24
15.8
85
5.7
29
.39
16.8
55
6.4
78
.36
14.8
0
711
311
50
Silv
er
art
icle
s o
f je
welr
y a
nd
part
s th
ere
of, n
eso
i, valu
ed
over
$18
per
do
zen
pie
ces
or
part
s1,
56
6.8
73
31.
82
21.
181,
60
7.77
30
1.0
518
.72
1,4
18.7
13
03
.89
21.
42
711
319
10P
recio
us
meta
l (o
/th
an
silv
er)
ro
pe, c
urb
, etc
. in
co
nti
nu
ou
s le
ng
ths,
wh
eth
er
or
no
t p
late
d/c
lad
p
recio
us
meta
l, fo
r je
welr
y m
an
ufa
ctu
re24
.92
8.4
93
4.0
721.
67
5.5
82
5.7
527.
53
4.6
216
.78
GO
LD
JE
WE
LL
ER
Y P
RO
DU
CT
S
711
319
21
Go
ld r
op
e n
eckla
ces
an
d n
eck c
hain
s9
9.0
310
.20
10.3
012
3.3
811
.38
9.2
217
8.5
611
.50
6.4
4
711
319
25
Go
ld m
ixed
lin
k n
eckla
ces
an
d n
eck c
hain
s6
3.7
24
.64
7.2
87
1.0
33
.75
5.2
89
3.7
94
.71
5.0
2
711
319
29
Go
ld n
eckla
ces
an
d n
eck c
hain
s (o
/th
an
of
rop
e
or
mix
ed
lin
ks)
1,28
2.9
49
6.14
7.4
91,
324
.06
81.1
26
.13
1,3
88
.78
113
.29
8.1
6
711
319
30
Pre
cio
us
meta
l (o
/th
an
silv
er)
cla
sps
an
d p
art
s th
ere
of
26
.06
5.4
92
1.0
724
.09
4.7
819
.84
27.
65
3.5
612
.88
711
319
50
Pre
cio
us
meta
l (o
/th
an
silv
er)
art
icle
s o
f je
welr
y
an
d p
art
s th
ere
o, w
heth
er
or
no
t p
late
d o
r cla
d
wit
h p
recio
us
meta
l,neso
i5
,89
4.5
31,
30
7.14
22
.18
5,4
43
.03
1,3
96
.31
25
.65
5,5
06
.72
1,4
91.0
02
7.0
8
711
320
00
Jew
elle
rt a
nd
Part
s th
ere
of
, wh
eth
er
or
no
t p
late
d o
r cla
d w
ith
pre
cio
us
meta
l, n
eso
i.26
.197.
142
7.2
63
6.3
54
.82
13.2
626
.82
4.0
415
.06
IMIT
AT
ION
JE
WE
LL
ER
Y P
RO
DU
CT
S
711
7Im
itati
on
Jew
elle
ry
1,270
.09
33
.152
.61
1,28
5.2
629
.30
2.2
81,1
46
.67
29
.82
2.6
0

12
4. Markets where India’s % share has shifted
This has been observed that the products in which India has lost share in USA market for G&J products have shifted to the other markets which are mentioned here below:
Table -7
USA Imports from India in 2017, 2018 and 2019
which have witnessed lost in share in USA market
HS Codes Commodity Description In which markets shifted
Silver Jewellery
71131110
Silver rope, curb, etc. in continuous lengths, whether or not plated/clad with other precious metal, suitable for jewelery manufacture
Italy, China, Germany (refer to annexure B - Table B1)
71131120
Silver articles of jewelery and parts thereof, nesoi, valued not over $18 per dozen pieces or parts
China, Thailand
Gold Jewellery
71131910
Precious metal (o/than silver) rope, curb, etc. in continuous lengths, whether or not plated/clad precious metal, for jewelery manufacture
Peru, Italy, Turkey (refer to annexure B - Table B2)
71131921Gold rope necklaces and neck chains
Indonesia, Peru, Turkey (refer to annexure B - Table B3)
71131925Gold mixed link necklaces and neck chains
Oman, Peru, Turkey, France, China, Hong Kong (refer to annexure B - Ta-ble B4)
71131930Precious metal (o/than silver) clasps and parts thereof
Turkey
71132000Jewellery and Parts thereof, whether or not plated or clad with precious metal, nesoi.
Could not find
Source: GJEPC based on UN Comtrade General Import Database as on 19th August 2020
*For more details of extent of shift to other markets refer to annexure B

13
5. Impact of GSP withdrawal by USA for Indian G&J products on India’s position in USA market.
5.1. USA GSP (Generalised System of Preference) Benefit to India: Backdrop
The U.S. Generalized System of Preferences (GSP), a program designed to promote economic growth in the developing world, provides preferential duty-free treatment for over several products from a wide range of designated beneficiary developing countries (BDCs), including many least-developed beneficiaries developing countries (LDBDCs). The USA GSP Scheme was introduced in 1976 with the objective of increasing the export earnings of developing countries, promote their industrialization and accelerate their economic growth.
GSP Benefit is majorly granted at two levels: (i). Country Level wherein a country is designated as Beneficiary Developing Country (BDC) (2) Product Level wherein a commodity or commodity group(s) of BDCs is granted GSP benefit.
5.2. CNL (Competitive Need Limitation):
CNL are quantitative ceilings on GSP benefits for each product and BDC. The GSP statute provides that a BDC is to lose its GSP benefit with respect to a product if the CNLs are exceeded and if no waiver is exceeded.
CNLs measures are: US imports of a particular product from a BDC during a calendar year should not exceed US$180 million (in 2017) or its imports should not account for 50% or more of the value of total US imports of that product.
Products from a specified beneficiary are considered “sufficiently competitive” when exports exceed one of these limits. As per the statute, if imports of that article from that BDC fall below the above stated CNL in a subsequent year, the products can be considered for the re-designation.
5.3. USA GSP Scheme and India
India had rightfully been a BDC to USA GSP Program since long primarily on account of being highly labour intensive and export oriented. The benefit was available for several products including Vehicle and parts, Nuclear Reactors & Machinery, Articles of Iron or Steel, Carpets, Electrical machinery and so on. Gem and Jewellery products were also receiving the GSP treatment meaning thereby the products were imported in USA at preferential duty rates which resulted in increase in exports of the said products to USA significantly. During the years 2003-2007, the GSP imports of gems and jewellery in USA grew rapidly and this became the major commodity on India‘s GSP exports, accounting for 40% or more of the total GSP imports from India. Thereafter USA jewellery imports from India1 under the GSP started declining.
1. ICREIR

14
The major cause for the decline in GSP imports from India was the revocation in 2007 of competitive need limitation waiver (originally granted in 2001) in respect of certain jewellery items (HSUS 71131929 and 71131950) and further revocation of the 2001 waiver in 2009 of another category (HSUS 71131925). The US took further action to exclude in 2009 one other category (HSUS 71131921) on account of the competitive need limitation. (Table 8)
Table - 8
Jewellery Products Excluded from the GSP Program
HS Code8 Digit
71131150 71131921 71131925 71131929 71131950
Products
Silver ar-ticles of jewellery and parts
Gold rope necklaces and neck chains
Gold mixed link necklaces and neck chains
Gold necklaces and neck chains (except of rope or mixed links)
Precious metal (except silver) articles of jewellery &parts, whether or not plated or clad with precious metal
CNLS Exclusion
2009 2009 2009Before 2001
Before 2001
Waiver Granted
2001 2001 2001
Waiver Revoked
2009 2007 2007
MFN Tariff (2018)
5% 5% 5.8% 5.5% 5.5%
Source: Harmonized Tariff Schedule of the USTR (2018), Revision 4
5.4. Adverse impact of the exclusion of key gem and jewellery export commodities from GSP benefit by USA between 2007-2009
Eventually withdrawn of GSP benefit for the key jewellery products in the year 2007, 2008 and 2009 resulted attraction of MFN rate of around 5-6% at the USA customs territories and decline in exports of the various following high-volume jewellery exports from India.
• Articles of gold jewellery (HS Code 71131950)
• Gold rope necklaces and neck chains (HS code 71131921)
• Gold necklace and neck chains (HS code 71131929)
• Gold mixed links, necklaces and neck chains (HS code 71131925)
• Silver articles of jewellery and parts (HS code 71131150)
Impact of exclusion of commodities from GSP benefit (listed in table 9) can be easily understood from the USA imports of these commodities from India during the pre and post withdrawal of GSP benefit.

15
Overall Impact - The GJEPC has analysed that USA imports of the said commodities from India fell by around 28% from US$2487.75 million in 2009 to US$1793.61 million in 2018 (Table -9 )
Table - 9
Jewellery Products Excluded from the GSP Program
HS Code 8 Digit 71131150 71131921 71131925 71131929 71131950
USA imports from India (US$mn)
Products
Silver articles of jewelry and parts
Gold rope necklaces and neck chains
Gold mixed link necklaces and neck chains
Gold necklaces and neck chains (except of rope or mixed links)
Precious metal (except silver) articles of jewelry and parts thereo, whether or not plated or clad with precious metal
CNLS Exclusion 2009 2009 2009Before 2001
Before 2001
Waiver Granted 2001 2001 2001
Waiver Revoked 2009 2007 2007
MFN Tariff (2018)
5% 5% 5.80% 5.50% 5.50%
USA imports from India (US$mn) 2009/2007
191.65 64.38 63.93 266.45 1901.34 2487.75
USA imports from India (US$ million) 2018
301.05 11.38 3.75 81.12 1396.31 1793.61
Source : USITC and Harmonized Tariff Schedule of the USTR (2018), Revision 4

16
Commodity wise Imapct –
1. Gold rope necklaces and neck chains (HS code 71131921)
• USA imports of Gold rope necklaces and neck chains from India decreased from US$64.38 million in 2009 to US$11.38 million in 2018 (HS code – 71131921) (Table -10)
2. Gold mixed links, necklaces and neck chains (HS code 71131925)
• USA imports of Gold mixed link necklaces and neck chains from India declined from US$63.93 million in 2009 to US$3.75 million in 2018 (HS Code – 71131925) (Table -10)
3. Silver articles of jewellery and parts (HS Code 71131150)
• This is only one commodity i.e. silver articles of jewellery and parts imports of which have witnessed a rise in USA from US$191.65 million in 2009 to US$301.05 in 2018. (Table 10)
Table-10
US Imports of key jewellery products during pre and post withdrawal of GSP Reference period : 2009-2018 (US$million)
HTS No. Description 2009 2010 2011 2012 2013 2014 2015 2016 2017 2018
71131150
Silver articles of jewelry and parts thereof, nesoi, valued over $18 per dozen pieces or parts
191.65 269.46 331.76 331.82 347.41 343.39 337.24 311.41 331.82 301.05
71131921Gold rope necklaces and neck chains
64.38 46.46 21.09 17.79 19.27 24.96 19.55 15.75 10.20 11.38
71131925
Gold mixed link necklac-es and neck chains
63.39 33.46 4.61 4.38 4.64 5.53 5.09 3.76 4.64 3.75
Source : USITC
The figure 1 depicts how, USA imports of key jewellery commodities from India have declined during the post withdrawal of GSP for the said commodities.
Figure 1: USA imports from India Pre and Post Withdrawal of GSP (2009-18)
Source : USITC

17
4. Gold necklace and neck chains (HS code 71131929)
Exports of Gold necklaces and neck chains (except of rope or mixed links) declined form US$266.45 million in 2007 to US$81.12 million in 2018. (HS Code – 71131929) (Table-11)
5. Articles of gold jewellery (HS Code 71131950)
Exports of Precious metal (except silver) articles of jewellery &parts, whether or not plated or clad with precious metal fell from US$1901.34 million in 2007 to US$1396.31 million in 2018 (HS code 71131950) (Table-11)
Table-11
US Imports of key jewellery products during pre and post withdrawal of GSP Reference period : 2007 – 2018
HTS No. Description 2009 2010 2011 2012 2013 2014 2015 2016 2017 2018
71131929
Gold necklac-es and neck chains (o/than of rope or mixed links)
53.67 45.24 52.93 48.73 43.45 49.57 45.11 75.37 96.14 81.12
71131950
Precious metal (o/than silver) articles of jewelry and parts thereo, whether or not plated or clad with precious metal,nesoi
910.92 1002.69 1044.31 1056.55 1081.61 1105.48 1233.71 1401.71 1307.14 1396.31
Source : USITC
The figure 2 depicts how, USA imports of key jewellery commodities from India have declined during the post withdrawal of GSP for the said commodities.
Figure 2 : US imports of key G & J products pre and post withdrawal of GSP ( 2007-18)
Source :USITC

18
Countries where India’s share has been shifted : This is based on the rising imports of USA from other countries during the last 10 years which is an indication of shifting of India’s business to these countries due to the loss of duty advantage which was available with Indian exporters during the GSP regime.
USA imports of articles of jewellery have increased from China, France, Indonesia, Italy, Oman and Switzerland. USA Imports of gold necklace and neck chain have increased from Canada, Indonesia, Italy, Oman, Singapore South Africa, Turkey, Belgium, China and Dominican Republic. USA imports of Gold role necklaces and neck chains have risen from Peru, Turkey and Indonesia. The country imports of Gold mixed links, necklaces and neck chains have increase from China, Italy, Indonesia, Oman, Thailand and imports of Silver articles of jewellery and parts have witnessed a significant rise from Thailand. (Table 12)
Table -12
Markets where India’s Lost Exports has shifted
HS Codes Commodity DescriptionIn which markets shifted from 2007 to 2018
71131950 Articles of gold jewellerySingapore, France, Indonesia, Italy, Oman, Switzerland (refer to annexure C - Table C1)
71131929Gold necklace and neck chains
Canada, Indonesia, Italy, Oman, South Africa, Turkey, Dominican Republic. (refer to annexure C - Table C2)
71131921Gold rope necklaces and neck chains
Peru, Turkey, Indonesia (refer to annexure C - Table C3)
7113925Gold mixed links, necklaces and neck chains
China, Italy, Indonesia, Oman, Thailand (re-fer to annexure C - Table C4)
71131150Silver articles of jewellery and parts
Thailand
Source: GJEPC based on UN Comtrade General Import Database as on 19th August 2020
*For more details of extent of shift to other markets refer to annexure C

19
5.5. Withdrawal of BDC Status for India or Complete withdrawal of GSP Benefit from July 2019
The council has assessed that after the termination of GSP designation of India by USA, exports of around 45 gem and jewellery commodities at HS code 8-digit level which were under the GSP-A and A*category2 i.e. Duty-Free benefit for Beneficiary Developing Country (BDC) have started attracting the import duties in USA. (table 13)
Consequently, 45 gem and jewellery commodities for which GSP benefit was available in USA had terminated after the complete withdrawal of GSP benefit for India as a whole resulting in terms of escalated prices and reduced export competitiveness of these products (Refer annexure - A)
5.6. Countries still in the list of BDC for USA GSP program
Please take a note the following countries where India’s gem and jewellery business have been shifted are still in the list of BDC for USA GSP Programme and hence duty benefit is still available to these countries. This might be one of the major reasons of loss of India’s share in USA market.
1. Indonesia,
2. South Africa,
3. Dominican Republic and
4. Thailand
2. As per the Harmonized Tariff Schedule of the United States (2019) , HTSUS : The special code A in special column indicates that the commodity is eligible for GSP benefit for all the Beneficiary Developing Countries Including India

20
CONCLUSIONS AND SUGGESTIONS
Recent meeting with Indian Embassy, Washington, USA
This is to take a note that the analysis was conducted after having cautioned by Indian Embassy about falling USA imports of gem and jewellery products from India.
Therefore, this is in response to the Embassy, the GJEPC representatives had met Indian Embassy dated 10th September 2020, and discussed the findings of the detailed data analysis pertaining to USA imports from India and from rest of the world. After the presentation, the Council confirmed that the observations of the later pertaining to fall in USA imports from India in recent years and shifting to other markets is a fact and worrisome. The representatives of Indian Embassy found the data analysis is insightful; while at the same time suggested to conduct a scientific study to understand why the share of exports to US market is shrinking to come out with a workable solution. In this endeavour the Embassy has assured the Council of providing desired level of support during the conduct of the suggested study exclusively for the USA market.
Conclusions and Suggestions
United States of America (USA) is one of India’s major export destinations for gem and jewellery products. While, in recent years USA imports from India have witnessed a decline and shifting to the other countries viz. Thailand, Turkey, Peru etc. The situation seems to be unfavourable for Indian gem and jewellery sector. Withdrawal of the GSP benefit by USA for India had led to a rise in import duty in the country and further reducing export competitiveness for Indian exporters as compared to other countries. This is one of the primary reasons for India’s declining share in USA imports of gems and jewellery products.
At this backdrop, this is imperative to regain our share in the USA market. Few of the suggestions are indicated here below :
• Requesting the USA Government for decreasing import tariff on key Indian gems and jewellery commodities like Gold ,Silver and imitation jewellery as these commodities occupy a significant position in the India -USA gems and jewellery export.
• Reduction of tariffs on imports of cut and polished from 7.5 % to 2.5 % for USA since India imports 31% of its total imports of polished diamonds from USA so as to provide duty benefit to the country .
• Government should support Brand India Initiatives for gems and jewellery in the USA markets .
• As suggested by Indian Embassy we should extend the study in terms of empirically determine the factors of decline in USA imports from India and shifting to the other markets. This effort would enable us to reformulate our trade strategies pertaining to USA market. Furthermore, as suggested by Indian Embassy we should extend the study in terms of empirically determine the factors of decline in USA imports from India and shifting to the other markets. This effort would enable us to reformulate our trade strategies pertaining to USA market.
We are hopeful that by making the above efforts India may regain price advantage and exports of gem and jewellery in USA that were lost to other countries .

21
ANNEXURES
A List of 45 products
USA Imports of Gem and Jewellery Products from India on which following duty rates are now applicable after GSP withdrawal by USA - 2018
HS Codes
Product Description
USA Imports from India (US$ million)
Category of GSP
Duty Rate Applicable for India after GSP Withdrawal
71031040Precious stones (o/than diamonds) & semiprecious stones, simply sawn or roughly shaped
0.12 A 10.50%
71039950
Precious or semiprecious stones, nesoi, worked, whether or not graded, but n/strung (ex. ungraded temporarily strung), mtd. or set
2.96 A 10.50%
71049050
Synth.or reconstruct. precious or semiprecious stones, wkd, whether or not graded, but n/strung (ex.ungraded temp. strung), mtd./set,nesoi
0.64 A 6.40%
71069150Silver, unwrought (o/than bullion and dore)
0.01 A 3%
71069250Silver (including silver plated with gold or platinum), in semimanufactured form, nesoi
3.53 A* 3%
71070000Base metals clad with silver, not further worked than semimanufactured
0.01 A 3.30%
71081370
Gold (including gold plated with platinum), nonmonetary, in semimanufactured forms (except gold leaf), nesoi
0 A 4.10%
71131110
Silver rope, curb, etc. in continuous lengths, whether or not plated/clad with other precious metal, suitable for jewelry manufacture
2.02 A 6.30%
71131120Silver articles of jewelry and parts thereof, nesoi, valued not over $18 per dozen pieces or parts
9.61 A 13.50%
71131910
Precious metal (o/than silver) rope, curb, etc. in continuous lengths, whether or not plated/clad precious metal, for jewelry manufacture
5.4 A 7%

22
71131930Precious metal (o/than silver) clasps and parts thereof
4.85 A 5.80%
71132010Base metal clad w/precious metal, rope, curb & like articles in continuous lengths, suitable for use in jewelry manufacture
0.03 A 7%
71132021Base metal clad w/gold rope necklaces and neck chains
0.11 A 5.80%
71132025Base metal clad w/gold mixed link necklaces and neck chains
3.45 A 5.80%
71132029Base metal clad w/gold necklaces and neck chains, nesoi
0.11 A 5.20%
71132030Base metal clad w/precious metal clasps and parts thereof
0.03 A 5.80%
71132050Base metal clad w/precious metal articles of jewelry and parts thereof, nesoi
1.1 A* 5.20%
71141110Knives with handles of silver, whether or not plated or clad with other precious metal
0.01 A 2.80%
71141120Forks with handles of silver, whether or not plated or clad with other precious metal
0 A 2.70%
71141130Spoons and ladles with handles of sterling silver
0 A 3.30%
71141140Spoons and ladles (o/than w/sterling silver handles) of silver, whether or not plated or clad w/other precious metal
0.02 A 3.50%
71141150 Tableware, nesoi, of sterling silver 0.19 A 3.30%
71141160Articles of silver nesoi, for household, table or kitchen use, toilet and sanitary wares, including parts thereof
0.05 A* 3%

23
HS Codes
Product Description
USA Imports from India (US$ million)
Category of GSP
Duty Rate Applicable for India after GSP Withdrawal
71141170 Silversmiths' wares (other than for household/table/kitchen use & toilet and sanitary wares) of silver, nesoi
0.84 A 3%
71141900 Precious metal (o/than silver) arti-cles, nesoi, whether or not plated or clad with other precious metal, nesoi
0.13 A 7.90%
71142000 Goldsmiths' or silversmiths' wares of base metal clad with precious metal
0.37 A 3%
71159030 Gold (including metal clad with gold) articles (o/than jewellry or gold-smiths' wares), nesoi
0.49 A 3.90%
71159040 Silver (including metal clad with silver) articles (o/than jewellry or silversmiths' wares), nesoi
0.5 A 3%
71159060 Articles of precious metal (o/than gold or silver), including metal clad with precious metal, nesoi
0.01 A 4%
71161010 Natural pearl articles 0 A 3.30%
71161025 Cultured pearl articles 0.02 A 5.50%
71162005 Jewelry articles of precious or semi-precious stones, valued not over $40 per piece
8.81 A 3.30%
71162015 Jewelry articles of precious or semi-precious stones, valued over $40 per piece
6.06 A 6.50%
71162030 Semiprecious stones (except rock crystal), graded and strung temporar-ily for convenience of transport
2.91 A 2.10%
71162035 Semiprecious stone (except rock crystal) figurines
0.57 A 4.50%
71162040 Semiprecious stone (except rock crystal) articles (other than jewelry and figurines)
3.96 A 10.50%

24
71171100 Cuff links and studs of base metal (whether or not plated w/precious metal)
0.07 A 8%
71171915
Rope, curb, cable, chain, etc., of base metal (whether or n/plated w/prec. metal), val. n/over 33 cents/meter for jewelry mfr.
0.09 A* 8%
71171920
Rope, curb, cable, chain, etc., of base metal (whether or n/plated w/prec. metal), val. o/33 cents/meter, for jewelry mfr.
0.06 A 11%
71171930
Religious articles of a devotional character, design. to be carried on the person, of base metal (whether or not plated with precious metal)
0.22 A 3.90%
71171990
Imitation jewelry (o/than toy jewelry & rope, curb, cable, chain, etc.), of base metal (wheth. or n/plated w/prec.metal), nesoi
15.94 A 11%
71179020
Rosaries and chaplets of a purely devotional character for personal use, of a material o/than prec. or base metals, nesoi
0.06 A 3.30%
71179030 Religious articles of a purely de-votional character designed to be carried on the person, nesoi
0.17 A 3.90%
71179055 Imitation jewelry nesoi, not of base metal, n/o 20 cents/doz. pcs or pts
0.11 A 7.20%
71179090 Imitation jewelry not of base metal or plastics, nesoi, over 20 cents/doz-en pcs or pts
10.9 A 11%
USA Total Imports of selected Gem & Jewellery Products from India
US$ 86.54 million
Source: USITC
Notes: Symbol “A” indicates that all GSP countries are eligible Symbol “A*” indicates that certain GSP countries are ineligible Symbol “A+” indicates that approximately 1500 additional tariff items for which only the LDBDCs are eligible

25
B. Extent of Shift to Other Markets ( 4. Markets where India’s % share has shifted )
Table B1 - 71131110 Silver rope, curb, etc. in continuous lengths, whether or not plated/clad with other precious metal, suitable for jewelery manufacture
Countries 2015 2019
India 1.31 0.90
Italy 2.82 3.53
China 0.52 0.86
Germany 0.05 0.22
It has been observed that USA’s imports of silver rope from Indian markets has declined from US $ 1.31 million to US $ 0.90 million during the span of 4 years from 2015 to 2019.USA imports of silver ropes from countries shifted to the markets in Italy ,China and Germany .
Table B2 - 71131910 Precious metal (o/than silver) rope, curb, etc. in continuous lengths, whether or not plated/clad precious metal, for jewelery manufacture
Countries 2015 2019
India 4.73 4.62
Peru 2.66 5.99
Italy 2.17 5.20
Turkey 1 3.97
The USA’s imports of precious metals ( o/ than silver)from India declined marginally from US$ 4.73 million to US $ 4.62 million during the span of 4 years from 2015 to 2019 . The markets for precious metals ( o/ than silver) shifted to the countries of Peru , Italy and Turkey as USA’s imports of this product increased within the same period especially turkey whose market share increased rapidly from 2015 to 2019 among these 4 countries

26
Table B3 - 71131921 Gold rope necklaces and neck chains
Countries 2015 2019
India 19.55 11.50
Indonesia 0.19 6.89
Peru 25.82 125.86
Turkey 5.12 17.83
India recorded the maximum decline in the gold rope ,necklaces and neck chains segment where USA’s imports of the product declined from US$ 19.55 million to US $ 11.5 million from 2015 to 2019. The Gold ropes,necklaces and neck chains markets shifted to Indonesia ,Peru and Turkey as USA’s imports increased for this product from these countries especially Indonesia where USA’s imports of the product increased from US$ 0.19 million to US$6.89 within the same period.
Table B4 - 71131925 Gold neck mixed rings, necklaces and neck chains
Countries 2015 2019
India 5.09 4.71
China 9.98 10.42
Hong Kong 5.22 7.23
Oman 0.38 17.48
Turkey 1.08 7.82
Peru 0.84 1.86
France 0.77 8.35
USA’s imports of gold mixed links necklaces and neck chains and declined from US$ 5.09 million to US$ 4.71 million during the span of 4 years from 2015 to 2019 . The Gold mixed link necklaces and neck chains market shifted to the countries of China , Honk Kong , Oman

27
, Turkey , Peru and France .USA’s imports of the product from Oman increased from US$ 0.38 million to US$ 17.48 million making it the biggest gainer in this segment within the same period
C : Markets where India’s Lost Exports has shifted
(Impact of GSP withdrawal by USA for Indian G&J products on India’s position in USA market.)
Table C1 71131950 Articles of gold jewellery
Countries 2007 2019
India 1901 1491
France 246 854
Indonesia 60 117
Italy 453 515
Jordan 24.31 36.2
Lebanon 15 35
Oman 61 160
Pakistan 15 70
Singapore 16 34
South Korea 19 32
Switzerland 70 111
Vietnam 10 43
USA’s imports of articles of Gold jewellery from India declined from US$ 1901 million in 2007 to US$ 1491 million . The Articles of gold jewellery market in turn shifted to the countries of France, Indonesia ,Italy ,Jordon, Lebanon ,Oman ,Pakistan , Singapore ,South Korea

28
,Switzerland and Vietnam as USA imports of articles of gold jewellery increased rapidly in this segment from 2007 to 2019 especially Pakistan and Vietnam who emerged as the biggest gainers among these countries .
Table C2 71131929 Gold necklace and neck chains
Countries 2007 2019
India 267 113
Canada 11 36.33
Dominican Republic 21 104.41
France 71 84
Indonesia 22 228
Italy 218 253.32
Oman 12.10 44
South Africa 24.13 116
Turkey 113.4 180
It was observed that the imports of Gold necklaces and neck chains of USA from India declined significantly from US$ 267 million to US$ 113 million in a span of 12 years from 2007 to 2019. USA’s imports of gold necklaces and neck chains shifted to the markets of Canada, Dominican Republic , France ,Indonesia ,Italy ,Oman ,South Africa and Turkey who became the top suppliers of the USA in this segment within the same period .The proportion of Indonesia and Dominican republic share in USA’s imports of gold necklaces and neck chains was the highest within the same period among these countries .
Table C3 71131921 Gold rope necklaces and neck chains
Countries 2009 2019
India 64.38 11.50
Indonesia 0.72 7
Peru 10.12 126
Turkey 5 18

29
The imports of gold ropes ,necklaces and neck chains of USA from India declined from US$ 64.38 million in 2009 to US$ 11.5 million in 2019 which reflected a significant decline in India’s share within this segment . Indonesia ,Peru and Turkey in turn became the preferred estinations of USA’s imports of Gold rope necklaces and neck chains in a span of 10 years from 2009 to 2019 .
The USA’s imports of gold rope necklaces and neck chains from Peru increased from US$ 10.12 million to US$ 126 million from 2009 to 2019 among these countries making it the most preferred destination of USA’s imports in this segment .
Table C4 7113925 Gold mixed links, necklaces and neck chains
Countries 2009 2019
India 64 4.71
China 4.15 10.42
Italy 6.61 13.12
Indonesia 5 10.32
Oman 0.75 17.48
Thailand 2.96 5.02
The USA’s imports from India in the gold mixed links ,necklaces and neck chains segment recorded the maximum decline as the imports fell from US$ 64 million to US$ 4.71 million from 2009 to 2019 shifting to the markets of China ,Italy , Indonesia ,Oman and Thailand within the same period .
Oman and Thailand became the most preferred import destinations of USA in the gold mixed links , necklaces and neck chains segment among these countries within the same period.

30
DISCLAIMER
A report titled ‘India-USA Trade Relations - Trends and Observations’ is prepared by the Gems and Jewellery Export Promotion Council (GJEPC) for general guidance and information purposes only and should not be reproduced or decentralized to others without the permission of Gems and Jewellery Export Promotion Council .
Though, each effort is formed to confirm the accuracy and completeness of data contained ,the GJEPC takes no responsibility and assumes no liability of any error /omission or accuracy of the report .Readers of the report should consider professional advice or analyse their own judgement and conclusion before making any decision.
Gems and Jewellery Export Promotion Council (GJEPC)ALL RIGHTS RESERVED
February 2021
Guidance By
Mr. Sabyasachi RayExecutive Director,GJEPC
Prepared By
Ms. Rashmi AroraAssistant Director(Economist) Statistics Department, GJEPC [email protected]
Mr. Alfred Cyril StatisticianStatistics Department, GJEPC [email protected]
Mr. Animesh Sharma Sr. Research Executive Statistics Department, [email protected]

THE GEM & JEWELLERY EXPORT PROMOTION COUNCIL
Head Office and Registered OfficeOffice No. AW 1010, Tower A, G Block, Bharat Diamond Bourse, Next to ICICI Bank, Bandra-Kurla Complex, Bandra - East, Mumbai 400 051, Indiawww.gjepc.org


