1 India’s Intermediate Goods Trade in the Inter Regional Value Chain: An examination based on Trade data and Input Output Analysis - By Simi Thambi 1 Abstract: Intermediate goods play a very important role in world trade. Infact a large part of world trade takes place in the form of intermediate goods rather than final goods. One significant feature of world trade in the past decade has been the increase in the role of rapidly growing economy of China in the global value chain of intermediate goods trade. India’s rapid growth rates like China have also attracted attention but little research has been done on the nature of its integration into the interregional value chain of trade in intermediate goods.The objective of this paper is to fill this void in literature. At the global level India’s share in the trade of intermediate goods is very low but out of the BEC (Broad Economic Categories) classifications of goods (Final, Intermediate and Primary goods), India trades the most with the rest of the world in intermediate goods. Therefore from an Indian perspective it is interesting to examine the nature of India’s integration into the interregional value chain of intermediate goods trade and especially look at its intermediate goods trade relationship with China which has established itself as the leader of Asian Intermediate goods trade in the past decade. Section1: Introduction An intermediate good can be defined as an input to the production process that has itself been produced and, unlike capital, is used up in production. The difference between intermediate and capital goods lies in the latter entering as a fixed asset in the production process. Like any primary factor (such as labor, land, or natural resources) capital is used but not used up in the production process). On the contrary, an intermediate good is used, often transformed, and incorporated in the final output. As an input,an intermediate good has itself been produced and is hence defined in contrast to a primary input. As an output, an intermediate good is used to produce other goods (or services) contrary to a final good which is consumed and can be referred to as “consumption good”. 2 Intermediate inputs consist of both material goods as well as services. The latter can also be used as input to any sector of the economy; that is for the production of the same, or other services, as well as manufacturing goods. According to an OECD report, Intermediate inputs represent 56% of total goods trade and 73% of total services trade. Trade flows are dominated not by goods that are 1 Simi Thambi is a 1 st Year student of Phd at Yokohama National University. 2 Definition provided by Deardorff (2006) in his Glossary of International Economics.
Transcript
1
India’s Intermediate Goods Trade in the Inter Regional Value Chain:
An examination based on Trade data and Input Output Analysis
- By Simi Thambi1
Abstract:
Intermediate goods play a very important role in world trade. Infact a large part of world trade takes
place in the form of intermediate goods rather than final goods. One significant feature of world
trade in the past decade has been the increase in the role of rapidly growing economy of China in
the global value chain of intermediate goods trade. India’s rapid growth rates like China have also
attracted attention but little research has been done on the nature of its integration into the
interregional value chain of trade in intermediate goods.The objective of this paper is to fill this void
in literature. At the global level India’s share in the trade of intermediate goods is very low but out of
the BEC (Broad Economic Categories) classifications of goods (Final, Intermediate and Primary goods),
India trades the most with the rest of the world in intermediate goods. Therefore from an Indian
perspective it is interesting to examine the nature of India’s integration into the interregional value
chain of intermediate goods trade and especially look at its intermediate goods trade relationship
with China which has established itself as the leader of Asian Intermediate goods trade in the past
decade.
Section1: Introduction
An intermediate good can be defined as an input to the production process that has itself been
produced and, unlike capital, is used up in production. The difference between intermediate and
capital goods lies in the latter entering as a fixed asset in the production process. Like any primary
factor (such as labor, land, or natural resources) capital is used but not used up in the production
process). On the contrary, an intermediate good is used, often transformed, and incorporated in the
final output. As an input,an intermediate good has itself been produced and is hence defined in
contrast to a primary input. As an output, an intermediate good is used to produce other goods (or
services) contrary to a final good which is consumed and can be referred to as “consumption
good”.2Intermediate inputs consist of both material goods as well as services. The latter can also be
used as input to any sector of the economy; that is for the production of the same, or other services,
as well as manufacturing goods. According to an OECD report, Intermediate inputs represent 56% of
total goods trade and 73% of total services trade. Trade flows are dominated not by goods that are
1 Simi Thambi is a 1
st Year student of Phd at Yokohama National University.
2Definition provided by Deardorff (2006) in his Glossary of International Economics.
2
fully consumed but by goods that are further used in the production of other goods and services.
(OECD, 2009).Thus, intermediate inputs are an important component of world trade.
The flip side of the coin of trade in intermediate inputs is fragmentation of value chain or production.
The fragmentation of production can happen at the different parts of the value chain. In recent
decades the increasing importance of outsourcing has also facilitated the trade in intermediate
inputs (goods and services). The trade of Intermediate inputs has grown at an average annual rate of
6.2% for goods and 7 % for services (in volume terms) between 1995 and 2006. (Miroudot, S., R.
Lanz and A. Ragoussis 2009)
Inter regional value chain can be defined as the geographical fragmentation of production and long
distance coordination of production in both goods and services industries (UNIDO, 2010). Several
names have been used to address this process -‘slicing up the value-added chain’ (Krugman
1991); ‘offshoring’; ‘outsourcing’; ‘fragmentation’ (Jones and Kierkowski 1990 and 2001,
Deardorff 2001); and ‘vertical specialization’ (Balassa 1967 and Hummels et al. 1998, 2001,
Gonzalez 2012) (Baldwin2006, 2012).
The analysis of this paper is based on two observations: One, China has significantly increased its
position in the world trade of intermediate goods between 2001 and 2011.Two, out of the three,
Broad Economic Classification (BEC) of goods India trades the most in intermediate goods. Based on
these two observations, what can be said about India’s intermediate goods trade with China?
Therefore the aim for this paper is to examine the nature of India’s intermediate goods especially its
interaction with China. To get a broader picture we begin by looking at India’s trade with few other
countries ( EU, US, ASEAN, Japan) and then eventually narrow down to China.
For the purpose of this paper we limit ourselves to the study of intermediate goods and leave the
study of India’s integration into intermediate trade of services for future research even though
services industry has become the most important industry in India in the past decade.3An analysis of
trade in services sector requires data at a disaggregated level but limitations of finding such data is
the reason why we exclude services from this research. For instance, the International Input Output
3Services trade is very important for India and India’s rapid growth rates have been attributed to its rapidly
growing services sector. Much of this growth in exports is driven by growth in service exports. Within services, it is mainly modern services (referred to as “miscellaneous services”) that have been driving this export performance. Further decomposing miscellaneous services into software, communications, business and financial services reveals that exports are dominated by software services. Export Destination of service exports is highly concentrated with U. S as the top destination (65% of total software and service exports). For more details refer Eichengreen, B. and P. Gupta (2010).
3
Tables only includes 4 classifications of service industries: Construction, Trade and transport, other
services and Public administration. Such a broad aggregation of services industry constrains a
meaningful analysis of India’s service industry which mainly trades with the world in software
services.
The structure of the paper is as follows. In section 2, we explain the motivation for research. In
section 3 we review the literature on intermediate goods and value chain. In section 4, the data and
methodology for the paper is elucidated. In section 5 and section 6 we examine India’s intermediate
good trade using two different methodologies, i.e. RIEIT TD database and BRICS IO table. The final
section 7 is devoted to drawing conclusions from the analysis and scope for future research
Section 2: Motivation
In Asia, the attractiveness of China and ASEAN countries as a favorable manufacturing base and
increased agglomeration of industries in these countries has increased their significance in
intermediate goods trade. Together these two regions are accountable for much of the intermediate
goods trade in this region. China and ASEAN countries together increased their share from 11.6% to
17.6% in global export and 12% to 17.2% of global imports of intermediate goods between 2001 and
2011. Table 1 explains this point further. It shows the geographical distribution of world trade of
goods according to production stage.
In 2001 the share of China’s trade as a percentage of total world trade in primary, intermediate and
final goods was 1.7%, 4.4% and 10.8 % respectively. Its share of world trade was the least in primary
goods which reduced to almost half of its value in 2001 over the ten year period till 2011.On the
other hand if we look at China’s trade of intermediate goods as a share of total world trade in
intermediate goods we find that it almost doubled to 8.1% in 2011 as against 4.4% in 2001. China’s
trade in final goods also showed a jump during the ten year period increasing to 19.5% of total world
trade in final goods in the year 2011 as against 10.5% in 2001. If we look at the import of
intermediate goods, there too the share of China almost doubled. The share of China in world
intermediate goods imports more than doubled from 4.5% to 9% between 2001 and 2011. An
interesting point to note is that the share of China in world final good import was only 5.5% in 2011
which is a meager amount when compared to China’s share in world final good export that stood at
19.5% in 2011. From the above figures we can understand that in the intermediate good category,
over the 10 year period China doubled its share of both imports and exports in world trade however
in the final good category it significantly increased its share mainly in the export of final goods.
4
ASEAN including Indonesia, Malaysia, Philippines, Singapore, Thailand, Brunei (Darussalam),
Cambodia, Vietnam increased its share of intermediate goods from 7.2 % to 9.5% between 2001 and
2011. The share of ASEAN export in world trade of primary goods increased a bit from 4.3% to 5.2%
between 2001 and 2011. Its share in world trade of final goods reduced a little from 6.2% in 2001 to
6.8% in 2011. When we look at imports, we find that ASEAN’s share of intermediate goods is also
high like its exports of intermediate goods. This share increased from 7.5% to 8.2% between 2001
and 2011. The share of ASEAN imports in world trade of primary goods fell from 5.2% in 2001 to
4.8% in 2011. The share of ASEAN imports in world trade of final goods increased only slightly from
3.5% in 2001 to 3.9% in 2011. Thus from the above figures we can see that ASEAN like China trades
the most with the world through its export and import of intermediate goods.
If we compare with China or ASEAN, India’s performance in intermediate goods has been lackluster,
India’s share in global export and import of intermediate goods increased from 0.8% to 1.9% and 0.8
to 2.8% between 2001 and 2011 respectively. Therefore, in the discussion on intermediate goods,
India is often shadowed by the limelight of China and ASEAN countries. However from an Indian
perspective, intermediate goods are an important part of India’s trade with the world even though
at the regional level India’s contribution to trade is significantly less compared to China and ASEAN
countries. Table 2 shows the importance of primary, intermediate and final goods in India’s trade
with the world. Out of the three BEC classifications of goods, India trades the most with the world in
intermediate goods.
India’s intermediate exports accounted for 52% of India’s trade with the world in 2001 and this
increased to 60% in 2011.On the other hand the share of India’s export of primary goods to the
world was a meager 7% and 9% of world trade in 2001 and 2011. The share of final good exports in
India’s trade with the world fell from 41% in 2001 to 31% in 2011.We find a similar picture of
importance of intermediate goods in India’s trade with the world when we look at India’s imports.
India imported intermediate goods the most in both the years. Its share increased fairly from 44% to
49% between 2001 and 2011. The share of primary products in India’s total trade with the world fell
from 42% to 13% while the share of final goods in India’s total trade with the world increased from
14% to 34% between 2001and 2011.
Therefore India’s position in global value chain maybe weak but if we look at India’s trade in goods
with the world, we find it is intermediate goods which account for most of India’s trade. This is
because among the different categories of goods, trade in BEC classification, intermediate goods
trade is the most important for India.
5
Based on the two tables above, we can reiterate the two main observations. Firstly, China has
significantly increased its position in world trade of intermediate goods and export of final goods
between 2001 and 2011. Secondly, India trades the most with the world in intermediate goods.
Given this, we try to examine the nature of India’s intermediate goods trade and its integration into
the interregional value chain especially its interaction with China.
Section 3: Literature review on intermediate goods and value chain
A lot of research has been done on value chain and intermediate goods trade, a look at some of
these works helps in putting this paper in perspective. The literature can be divided into two broad
sets based on area of coverage.
The first set deals with this topic as a whole with interconnection across regions: Asia, Europe, and
America. For e.g. some latest work under this set is that of Baldwin (2012) and Gonzalez (2012).
Baldwin (2012) looks at the importance and future of supply chain which is a narrower aspect of
value chain. He provides a general idea of global supply chains: past, present and future. According
to him supply chains are as old as industry itself. For e.g. Automobiles require tires which require
rubber; steel requires iron which requires iron ore. The supply chain is the sequence of plants that
provide these inputs. He divided the evolution of supply chain into two parts - the first and second
unbundling of globalization. While the first unbundling was initiated by transportation made possible
by steam, the second was initiated by transmission made possible by ICT. He identifies that the
world is now in the 2nd phase of unbundling, some production stages previously performed in close
proximity are dispersed geographically. In the previous stage of unbundling, firms had to be in close
proximity to perform best but in the 2nd unbundling ICT revolution has helped the firms to grow over
the ‘coordination glue’ making it not too complex to manage operations across borders. In his paper,
he provides many schematic frameworks in which this 2nd unbundling process is being carried out.
One interesting finding of his study relevant for our paper is the rise of Asia in intermediate goods
trade and even within that the rise in the share of electronics and other related equipment.
Gonzalez (2012) in the first essay of his thesis, conducts a bilateral input- output analysis looking at
both the country of import and destination of export. He does this by looking at backward and
forward linkages of the input output table. One of the interesting finding of his analysis is that global
supply chain is more regional than global. China has high backward linkages with Japan and Korea
and high forward linkages with EU and USA. He calls it unidirectional triangular trade. Intermediate
goods are sourced into China and then exported to US.
6
Given the importance of China and ASEAN in intermediate goods trade, there is a wide range of
literature that looks at Asian aspect of intermediate goods trade especially China’s intermediate
goods trade. We club this under the second set which looks at specific region .i.e. the Asian region.
China and ASEAN or China and Japan are common themes under this set .(Ha Thi Hong Van
Linkage analysis provides a very useful way to look at the interdependence of supply and demand
across sectors as well as countries. The standard method for such an analysis of interdependence is
backward and forward linkages.International backward linkage determines the extent to which, the
industry of one country depends on the component suppliers of another country. International
forward linkages determine the extent to which the industries of other countries depend of the
output of one country.
Based on the analysis of the previous sections, generally we can expect international forward
linkages to be low for India because of India’s weak position as an exporter in the region. As for
international backward linkages, we can expect them to be most with EU and China.
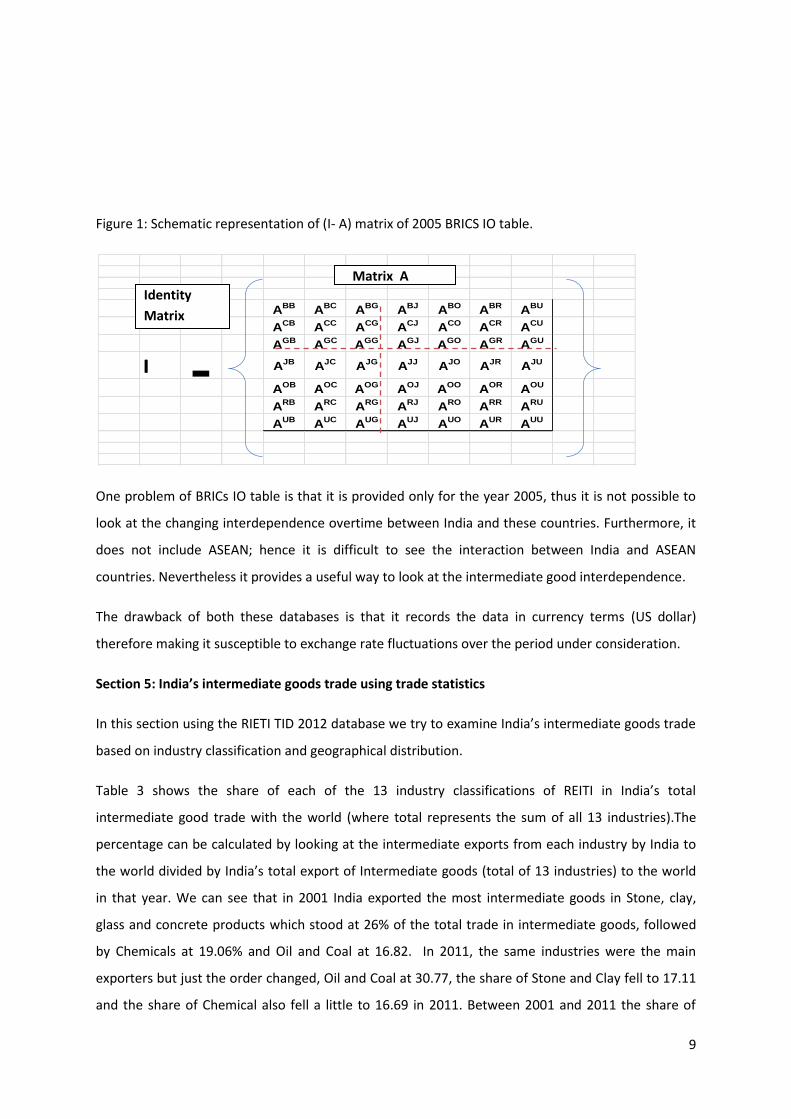
Using BRICS 2005 IO table in our analysis
a. We first look at interdependence between different sectors of India and all BRIC+3 countries
without differentiating the country of origin.In this part the intensity of backward linkage(BL)
is measured with an index known as the Power of dispersion index. Similarly the forward
linkage (FL) is measured with an index known as the Sensitivity of Dispersion Index. An index
value of more than one means that the industry has a power of dispersion/sensitivity of
dispersion greater than the average of all industries. However this total figure for power of
dispersion includes both domestic and external backward linkages. To look at just the
external BL/FL we subtract from it domestic BL/FL from the total.
b. Next, we look at interdependence between different sectors of India and each of the BRIC+3
countries. For this we look at India’s industry wise backward and forward linkage to each
12
country. This can be calculated as the sum of column (for backward linkage) and rows(for
forward linkage) of the Leontief inverse matrix.
For the first part, we tried to identify the industries within the top 4 rank based on power of
dispersion index and sensitivity of dispersion index. Our analysis shows the following:
When we look at the total figure of power of dispersion of India as can be seen in Table 6, it is
highest for Computer and Electronic equipment, followed by; Other electrical equipment; Textile,
leather, and the products there of and finally Food, beverage and tobacco. In other words generally
these industries depend most on component suppliers when compared to other industries.
As can be seen from Table 6, external backward linkages were also the most for Computer and
electronic equipment, Other electrical equipment, followed by Transport equipment and Chemical
products in that order.That is, relative to the other industries, these industries purchase most inputs
from the industries of BRIC+ 3 countries.Textile, leather, and the products thereof; & Food, beverage
and tobacco do not figure high in external forward linkages implying that the backward linkages in
these industries are more domestic than external. The ranking of domestic BL is also shown for
reference. The table shows that out of all industries computer and electronic equipment clearly tops
the average of all other industries in terms of both domestic and external backward linkages.
Table 7 shows the sensitivity of dispersion of top 4 industries.When we look at sensitivity of
dispersion, the index is highest for Trade and transport followed by Other services, Chemical
products, Metal and Metal Products. In other words the influence of these sectors on the economy
as suppliers is higher than the average of all industries. We can see that the top rankers are services
industries except Chemical & Metal and Metal Products.
Just like in the case of external BL we calculate external forward linkage (FL). The ranking of the top
four industries is in the following order- Chemical products, Trade and Transport, Other mining,
Petroleum and petro products. The contribution of these four industries to the index of sensitivity of
dispersion was the most. That is, relative to the average of the other industries, these industries
supply more of their output to industries of BRIC+ 3 countries. Under the category of manufacturing
intermediate goods, it is the Chemical products industry tops the list.
In the second part of this section point b above, we look at country specific linkages between
different sectors of India and each country of BRICS as shown in Table 8.
At the overall level, we see that India has maximum backward linkages with EU followed by
China.With both these partners, among all the industries the backward linkages are the highest in
13
Computers and electronic equipment followed by,Other electrical equipment,Industrial machinery,
Transport equipment and Chemical products.5
Thus, the important findings based on tables, Table 6,7 and 8 can be summarized as follows:
EBL are highest in the following industries- computer and electronic equipment, Other electrical
equipment, transport equipment and chemical products .India’s backward linkages are most with EU
followed by China for all these industries.
Section 7: Conclusion
Based on the analysis till now, in this section we aim to summarize the result and draw conclusion
based on both REITI database result and IO analysis. The following points summarize the result of
the analysis:
Chemicals figures as a top industry of India’s trade in intermediaries based on both trade
statistics (Export / Import/ Import from China) and IO analysis. In other words, not only is
the share of this industry high in India’s trade basket but also the linkages of this industry are
high both domestic and external linkages. Infact among all the other industries Chemicals
was the only manufacturing industry that figured in top 4 ranks of industries with high
external forward linkages.
The share of Iron and Steel in India’s import basket was the highest but it does not figure
among top industries with linkages. This implies few backward linkages with other
industries; it could be because the inputs are produced and consumed in the industry of
origin and industry of import respectively.
Out of all the industries, the sensitivity of dispersion (Index for backward linkage) was the
highest for Computer and electronic equipment; Other electronic equipment; Textiles and
food in that order. However if we exclude the domestic inter industry linkages to look at just
external power of dispersion. We find Computer and Electronic equipment; Other electronic
equipment, continue to hold their position, the third and the fourth place is taken up by
Transport equipment and Chemicals.
5 An analysis of the external forward linkages of each Indian industry to each BRIC+ 3 as expected
reveals a very weak position of India in intermediate goods trade. The only industry in which India
has significant forward linkages is ‘Other Mining’ industry which is with China and stands at a
relatively high level of 3.1%, for all other countries the figure is less than 0.4%.
14
A country wise look at India’s external backward linkages shows EU followed China take the
top place. Among the industries with the linkages with these countries, on the top again
figure, Computer and electronic equipment; Other electronic equipment followed by
Industrial Machinery, Transport Equipment, and Chemicals. Therefore from an Indian point
of view its trade in intermediate goods with both EU and China is important especially for
computer and electronic related industries.
Overall backward linkages are highest for computer and electrical equipment and other
machinery industries, this inspite of the fact that when we look at the absolute share of this
industry in India’s trade basket, its share is not too high.The result of the analysis is
consistent with Baldwin( 2012)’s claim “21st century trade is concentrated in relatively few
sectors.Electrical machinery and electronics take the lion’s share of the level and the growth
in the 1990s”
Therefore one major conclusion this paper puts forward is the importance of China in India’s value
chain. Trade with China especially imports from China has increased significantly. As a share of total
imports, Chemicals or Iron and steel, are on top but if we look at linkages, they are the most in
Computer and electronic equipment related industries. This conclusion of the paper has important
policy implications for India’s trade engagement with China and also for other countries like Japan
which are interested in better trade with India. India’s intermediate goods trade in the Asia also
enables a better understanding of Asian value chain.
One very interesting fact we observed from REITI database is that China’s position in India’s
intermediate goods imports doubled between 2001 and 2011 over shooting the position of EU and
US. However because of the unavailability of IO data beyond2005, we were not able to see this
through IO table. Nevertheless, we can definitely expect the linkages in Computer and electronic
equipment with China to have over shot that of EU. It will be interesting to check this fact when data
becomes available for future research.
Moreover, it will also be interesting to examine the import content of China’s exports into India
especially if we can identify the extent of imports from Japan for China’s exports to India.
Furthermore, as India is a famous for its rapidly growing services especially software sector, it would
be interesting to observe backward and forward linkages across different classifications of service
industry.
15
Table 1: Geographic Distribution of World Trade in goods according to production stage
(World total=100%)
Flow Partner( World)
2001
Partner( World)
2011
Primary
Goods
Intermediate
Goods
Final
Goods
Total Primary
Goods
Intermediate
Goods
Final
Goods
Total
Export China 1.7 4.4 10.8 6.8 0.7 8.1 19.5 11.4
ASEAN 4.3 7.2 6.2 6.5 5.2 9.5 5.7 6.8
India 0.5 0.8 0.7 0.8 0.8 1.9 1.3 1.5
Japan 0.4 8.2 8 7.3 0.4 17.2 5.7 5
EU27 13.7 38.3 40.2 36.5 10.1 34.1 39 31.6
US 6.3 14.2 11.3 12.2 4.7 9.4 8 8.1
ROW 73.1 26.6 22.8 30 78 19.8 20.8 36
World 100 100 100 100 100 100 100 100
Import China 4.7 4.5 2.1 3.5 17 9 5.5 9.2
ASEAN 5.2 7.5 3.5 5.6 4.8 8.2 3.9 6.1
India 3.4 0.8 0.3 0.9 5.9 2.8 1 2.7
Japan 10.7 4.7 5.6 5.7 8.5 4.2 4.4 5
EU27 34.6 37.4 39.9 38.1 30.1 34.3 38 34.8
US 17.4 15.5 22.8 18.8 13.6 10.4 16.2 13
ROW 24 29.6 25.9 27.4 20.2 31.1 31 29.1
World 100 100 100 100 100 100 100 100
Source: Compiled based on REITI TID 2012 Database August, 2013
Table 2: Importance of Primary, Intermediate and Final goods in India’s Trade with the world
(Total of Primary, Intermediate and Final goods= 100%)
Flow Partner( World)
2001
Partner( World)
2011
India Primary
Goods
Intermediate
Goods
Final
Goods
Total Primary
Goods
Intermediate
Goods
Final
Goods
Total
Export 7 52 41 100 9 60 31 100
Import 42 44 14 100 13 49 38 100
Source: Compiled based on REITI TID 2012 Database August, 2013
16
Table 3: Share of each industry in total Intermediate goods trade of India(according to industry
classification)
Partner – World
Export
Partner – World
Import
2001 2011 2001 2011
1. Food 3.27 1.98 0.29 0.25
2. Textiles 15.28 5.86 4.23 1.73
3. Pulp,Paper and
Wood
5.68 4.24 10.12 6.56
4. Chemicals 19.06 16.69 24.01 19.55
5. Oil and Coal 16.82 30.77 8.62 9.50
6. Stone, clay, glass
and concrete
products
26.59 17.11 2.43 10.16
7. Iron and steel
and non ferrous
metals
10.63 12.36 28.92 36.48
8. General
machinery
5.76 4.77 9.53 6.68
9. Electrical
machinery
3.76 3.09 7.66 5.60
10. Household
Electrical
appliances
0.65 0.23 0.40 0.25
11. Transport
equipment
1.78 2.14 1.83 2.39
12. Precision
machinery
0.18 0.24 0.85 0.34
13. Toys and
miscellaneous
goods
0.54 0.53 1.11 0.52
Industry
Total( 13
industries)
1 1 1 1
Source: RIETI TID Database accessed August 2013
17
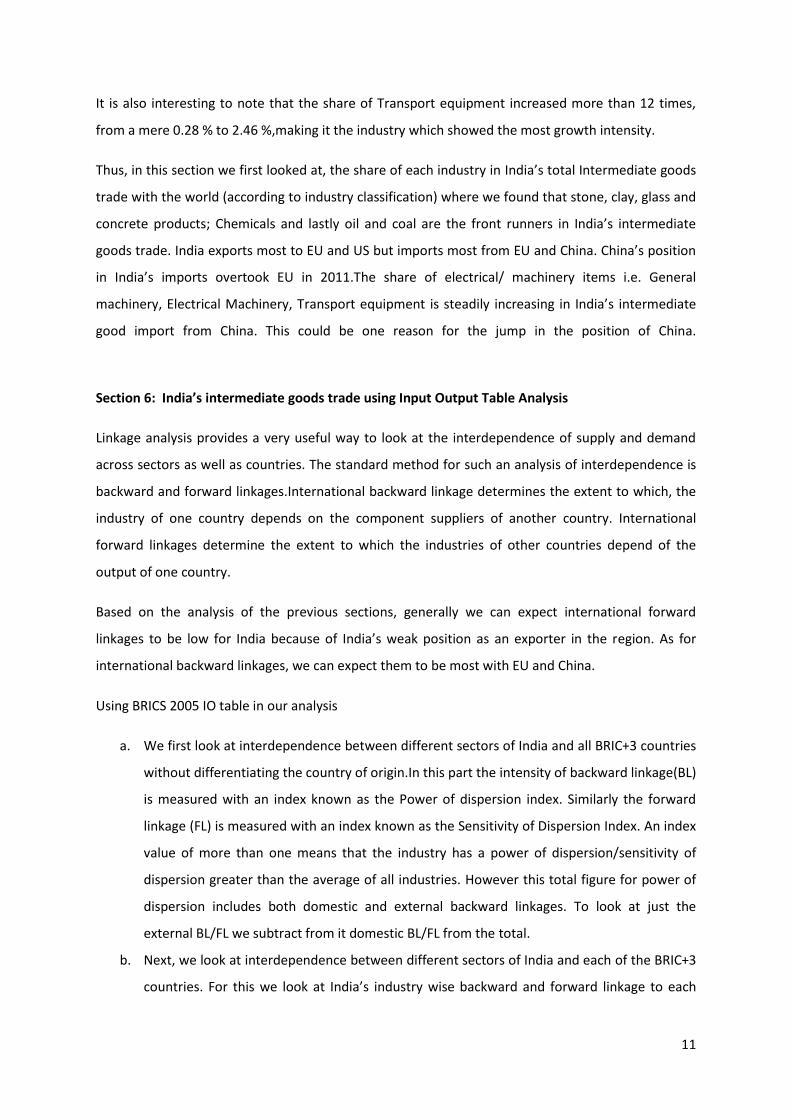
Table 4: Geographical Distribution of India’s Trade in Intermediate goods
Share of each country in India’s total trade in intermediate goods
Export Import
2001 2011 2001 2011
China 3.77 5.86 6.29 13.39
ASEAN 10.34 13.43 12.22 10.13
Japan 4.05 3.36 5.50 3.27
EU27 21.49 20.82 18.20 12.24
US 18.97 14.53 7.46 5.98
Source: RIETI TID Database accessed August 2013
Table 5- India’s intermediate good import from china according to industry classification
Import
2001 2011
1. Food 0.56 0.22
2. Textiles 16.64 6.73
3. Pulp,Paper and
Wood
0.74 3
4. Chemicals 34.39 32.85
5. Oil and Coal 10.01 2.93
6. Stone, clay,
glass and
concrete
products
2.14 3.04
7. Iron and steel
and non ferrous
metals
13.70 21.21
8. General
machinery
8.06 11.45
9. Electrical
machinery
8.54 12.72
10. Household
Electrical
appliances
3.01 1.02
11. Transport 0.28 3.46
18
equipment
12. Precision
machinery
0.75 0.56
13. Toys and
miscellaneous
goods
1.18 0.81
14. Industry
Total( 13
industries)
100 100
Source: RIETI TID Database accessed August 2013
Table 6: Power of Dispersion of Top 4 Industries: Result of IO analysis
影響力 1.Computers and
electronic equipment
2.Other electrical
equipment
3.Textile, leather,
and the products
thereof
4 Food,
beverage and
tobacco
1.19 1.13 1.09 1.07
国内影響力
Domestic BL
1.Food, beverage and
tobacco
2. Computers and
electronic
equipment
3.Textile, leather,
and the products
thereof
4. Other
electrical
equipment
1.05 1.05 1.04 1.03
外海影響
External BL
1.Computers and
electronic equipment
2.Other electrical
equipment
3.Transport
equipment
4.Chemical
Products
0.14 0.09 0.07 0.06
19
Table 7: Sensitivity of Dispersion of Top 4 industries: Result of IO analysis
感応度
Total FL
Trade and transport Other services Chemical
products
Metal and
Metal Products
2.21 1.57 1.42 1.36
国 内 感 応
Domestic FL
Trade and transport Other services Chemical
products
Metal and
Metal Products
2.18 1.55 1.38 1.34
海外感応度
External FL
Chemical products Trade and
Transport
Other mining Petroleum and
petro products
.039 .038 .02 .019
Table 8: Top 4 Backward linkages of India with BRICs+ 3 countries: Result of IO analysis
Computer and electronic equipment
Other electrical equipment
Industrial machinery
Transport equipment
Chemical Products
Brazil 0.1% 0.1% 0.1% 0.1% 0.1%
China 3.4% 2.2% 1.6% 1.4% 1.4%
India 88.0% 91.6% 92.4% 92.5% 94.0%
Japan 1.0% 0.7% 0.7% 0.7% 0.5%
EU 5.0% 3.7% 3.6% 3.6% 2.6%
Russia 0.6% 0.6% 0.7% 0.5% 0.3%
USA 1.9% 1.1% 0.9% 1.1% 1.1%
20
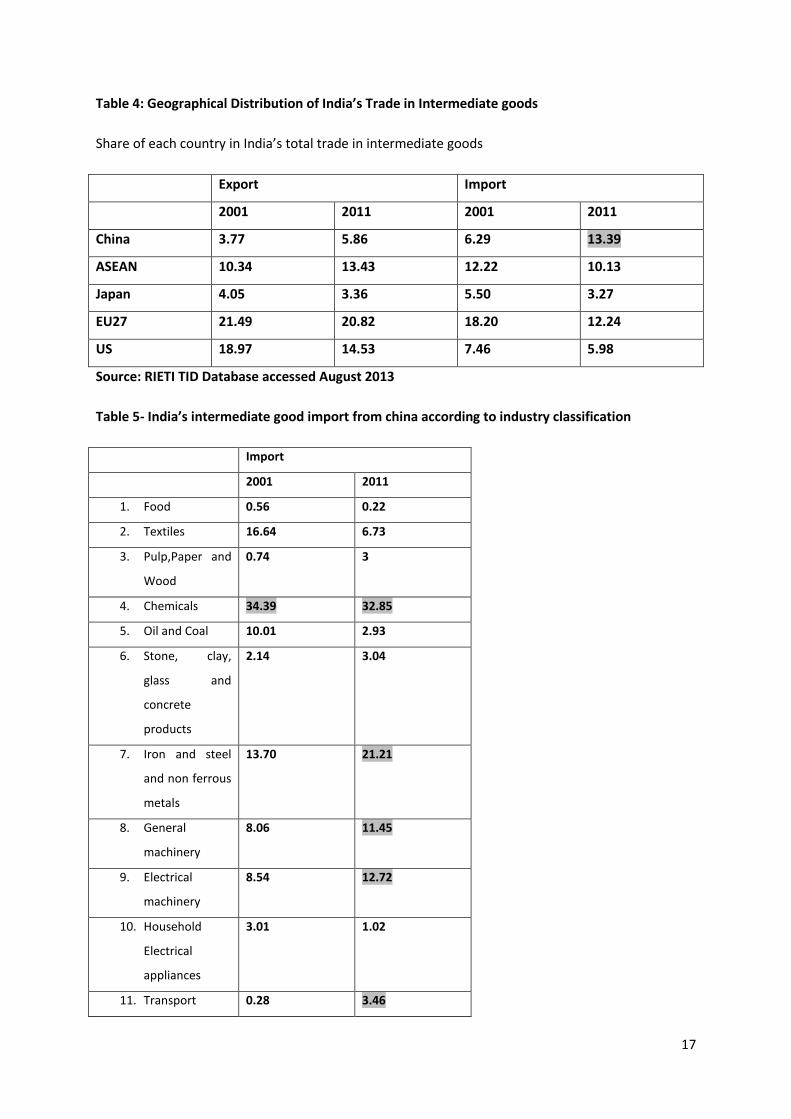
Appendix 1: BRICS Industry Classification
BRICs I-O 25-sector
Code Description
001 Agricultural products
002 Livestock and poultry
003 Forestry
004 Fishery
005 Crude petroleum and natural gas
006 Other mining
007 Food, beverage and tobacco
008 Textile, leather, and the products thereof
009 Wooden furniture and other wooden products
010 Pulp, paper and printing
011 Chemical products
012 Petroleum and petro products
013 Rubber products
014 Non-metallic mineral products
015 Metals and Metal products
016 Industrial machinery
017 Computers and electronic equipment
018 Other electrical equipment
019 Transport equipment
020 Other manufacturing products
021 Electricity, gas and water supply
022 Construction
023 Trade and transport
024 Other services
025 Public administration
21
References Balassa, B., (1967) Trade Liberalization among Industrial Countries. McGraw-Hill, New York Baldwin, R. E., (2006) ‘Globalisation: the great unbundling(s)’ Working paper for project: Globalisation Challenges for Europe and Finland. 20th September 2006 http://appli8.hec.fr/map/files/globalisationthegreatunbundling%28s%29.pdf’ Deardorff, A. V., ‘Fragmentation in Simple Trade Models,’ North American Journal of Economics and Finance, 12: 2, 121-137. 2001 Deardorff, Terms of Trade: Glossary of International Economics.World Scientific Publishing, 2006 Eichengreen, B. and P. Gupta.“The service sector as India’s road to economic empirical tests. Journal of International Business Studies, 15, 167-188. 2010 Gonzales-Lopez “Vertical Specialisation and New Regionalism”, Thesis PhD thesis, University of Sussex, April. 2012 Ha Thi Hong Van, Intermediate goods trade between China and Vietnam in ‘Intermediate goods trade in East Asia: Economic deepening through FTAs/ EPAs’ ,edited by MatsuhiroKagami, BRC Research Report No.5, Bangkok Research Centre, IDE- Jetro, Bangkok Thailand. 2011 Hasebe&ShresthaEconomic Integration in East Asia: A view of interdependence based on Intermediate Inputs. 2006 Hasegawa, T. External Backward Linkageand External Forward Linkage in Asian International Input-Output Table, 20th INFORUM World Conference in Firenze. 2012 Hummels, D., Ishii, J., and Yi K-M., (2001) ‘The Nature and Growth of Vertical Specialization in World Trade’.Journal of International Economics. 54:75-96 June 2001 Hummel, Ishii and Yi, The nature and growth of vertical specialization in world trade, Journal of International Economics 54 (2001) 75–96. Jones, R.W., and Kierzkowski, H., (‘The Role of Services in Production and International Trade: A Theoretical Framework,’ in R.W. Jones and A.O. Krueger (eds.), The Political Economy of International Trade. Oxford: Blackwell, 1990 Krugman, P.R., ‘Is Bilateralism Bad?’ In Elhanan Helpman and AssafRazineds International Trade and Trade Policy, Cambridge, MA: MIT Press. 1991 Makishima Minoru, Production Network and Intermediate goods trade, Cases of Japan in ‘Intermediate goods trade in East Asia: Economic deepening through FTAs/ EPAs’ ,edited by MatsuhiroKagami, BRC Research Report No.5, Bangkok Research Centre, IDE- Jetro, Bangkok Thailand. 2011 Miroudot, S., R. Lanz and A. Ragoussis, “Trade in Intermediate Goods and Services”, OECD Trade Policy Papers, No. 93, OECD Publishing. http://dx.doi.org/10.1787/5kmlcxtdlk8r-en2009 RE Baldwin, Global supply chains: Why they emerged, why they matter, and where they are going. Centre for Trade and Economic Integration (CTEI) Papers 2012-132012 UNIDO, Mapping Global Value Chains: Intermediate Goods Trade and Structural Change in the World Economy, Timothy J. Sturgeon & Olga Memedovic, Development Policy and Strategic Research Branch Working Paper 05/2010 Wang and Uemura Japanese FDI in China and International Production Linkages: Changes in Interdependence between 1995 and 2000, Economica Vol.57,No.2 ( November 2006),pp 29-50. 2006 Wang, J., “The Impact of the Japanese Multinationals in China: An Input-Out Study_”, Yokohama Journal of Social Sciences, Vol.9, No.2. 2004 Yamada, M. “Input-Output Analysis on Overseas Production of Japanese Firms” in Mitsuo Yamada, and Soshichi Kinoshita eds., Macro-econometric Analysis of Economic Development in East Asia, Chapter 7, Keiso Shobou, pp.167-188 (in Japanese) 2006 Yamada, M. “Japanese Overseas Production within the Asia International Input-Output Framework: Japan, the US, and Asia”, Journal of Econometric Study of Northeast Asia, Economic Research Institute for Northeast Asia, Vol. 5, No. 1, pp.27-42. 2004
Yasuhi Ueki, Intermediate goods trade in East Asia in ‘Intermediate goods trade in East Asia: Economic deepening through FTAs/ EPAs’ ,edited by Matsuhiro Kagami, BRC Research Report No.5, Bangkok Research Centre, IDE- Jetro, Bangkok Thailand 2011